1. Introduction
According to the United Nations Food and Agriculture Organization (FAO), the production, export, and price of berries (blueberries, cherries, cranberries, gooseberries, strawberries) have grown steadily over the last 20 years. Berry production reached approximately tons in 2016. The main producers were China, Turkey, Mexico, Spain, Egypt, Poland, Canada, Germany, Chile, and Italy, which together represented more than the 58% of world production. The price of these fruit has also increased steadily in recent years, with blueberries fetching the highest price per ton. Large producers such as China, Turkey, and Mexico export only a fraction of their production, whereas countries such as Spain and Chile export almost all of it.
In the case of Chile, blueberry production is mainly intended for distant markets (e.g., North America, Europe and Asia), so the fruit spends a considerable time in transit to its destination. There are producers in the south of the country who attribute 20% of fruit damage to the vibrations generated by the poor state of the roads from orchard to packing facility [
1].
Furthermore, Chilean berries are generally harvested manually, which involves many workers. In December 2012 alone, the fruit export sector demanded more than 10 million man days [
2], representing an important part of production costs. Harvest times are shortened, however, when the fruit is at optimal ripeness, and at times when external variables such as temperature and vibrations affect product quality as little as possible.
To control the quality of the berries, various solutions for tracking agricultural products from packing to their arrival at the target market (post-harvest) have been studied, based mainly on measuring humidity and temperature in the transport vehicles. These studies incorporate the use of sensors, global positioning system (GPS) technology to locate the vehicle, general packet radio service (GPRS) for communications between the vehicle and the monitoring station, and radio frequency identification (RFID) to identify the products [
2,
3]. Some of these technological solutions are commercially available, and their use helps to guarantee that the fruit is transported in suitable conditions and within the times committed to by the company. Moreover, there are studies that in addition to measuring humidity and temperature, incorporate the concept of “intelligent containers” [
4,
5], which reduce the amount of data sent to the monitoring station.
Although these solutions are useful tools for controlling the fruit during transport from packing to the final market, they do not cover the specific harvest process; this is recognized by experts as a highly important operation in agricultural production, since any insufficiency during this phase may cause the loss of an entire year’s work [
6]. Indeed, studies such as [
7] show that mechanical damage (bruising) to some fruit, due to bumps, vibrations, and overweight during the harvest, impacts directly on the shelf life of the product [
6,
8,
9,
10].
Patents have also been established for post-harvest solutions. The patent in [
11] describes a system for monitoring and recording variables inside a fruit container, including geographical position, humidity, time, temperature, shock, vibration, ambient light and emissions of gases (carbon dioxide and ethylene). The system also includes sensors with wireless features (using technologies such as Bluetooth and Wi-Fi). The patent in [
12] specifies a system for the packaging of oranges and tangerines with weight and ethylene adsorption sensors, including a data display module.
Other patents, as in Schueller et al. [
13] and Xu et al. [
14] propose products that can be used in orchards. The former [
13] offers a solution for collecting and managing data during the manual processes of harvesting, planting, cutting flowers, pruning, and thinning of fruit trees. It includes an accelerometer, magnetic sensor, pedometer, RFID transponder, GPS, acoustic sensor, biosensors, and optical sensors to detect and analyze hand movements. This product is a sophisticated solution that needs to be customized to the specific crop. The second solution [
14] consists of a Berry Impact Recording Device (BIRD), implemented as an artificial berry with an accelerometer and a microcontroller inside. This product is used to analyze the impact of mechanized picking processes [
15,
16] on berries; it measures vibrations in one artificial berry, which is insufficient information for harvest analysis.
To verify harvest conditions in situ, technologies based on wireless sensor networks (WSN) have been tested which incorporate low-cost, energy-saving technologies with acceptable computing capacities [
7,
17,
18,
19]. However, WSN must still be integrated with other communication systems, such as Wi-Fi or GSM/GPRS, so that important data reach the user in the shortest possible time. Ampatzidis et al. [
20,
21,
22] address the issue of technology integration including RFID technology and bar codes in harvest bins and cherry orchards. This system, with the aid of an electronic scale and a differential global positioning system (DGPS) mounted on the tractors that transport the harvest bins, allows the weight of the harvested fruit to be measured and productivity indicators to be determined for orchards and pickers. Tan et al. [
23] and Ampatzidis et al. [
24] studied the integration of the above technologies with cloud-based monitoring systems, generating a harvest-tracking system in which information is available to local or remote users. These systems include visualization platforms to analyze and search for information, putting a decision-making tool at the user’s disposal. In addition, Ampatzidis et al. establish that weighing with an electronic scale on the tractor-trailer that transports the bins increases loading time by almost 33% [
21]; this extra time could be eliminated if the weight could be measured in the harvest basket itself using an automatic weighing mechanism. It should be stressed that the studies cited do not consider environmental variables such as high temperatures and/or excessive vibrations to which the fruit is subjected, which, as mentioned previously, affect its shelf life.
To illustrate the aspects mentioned above,
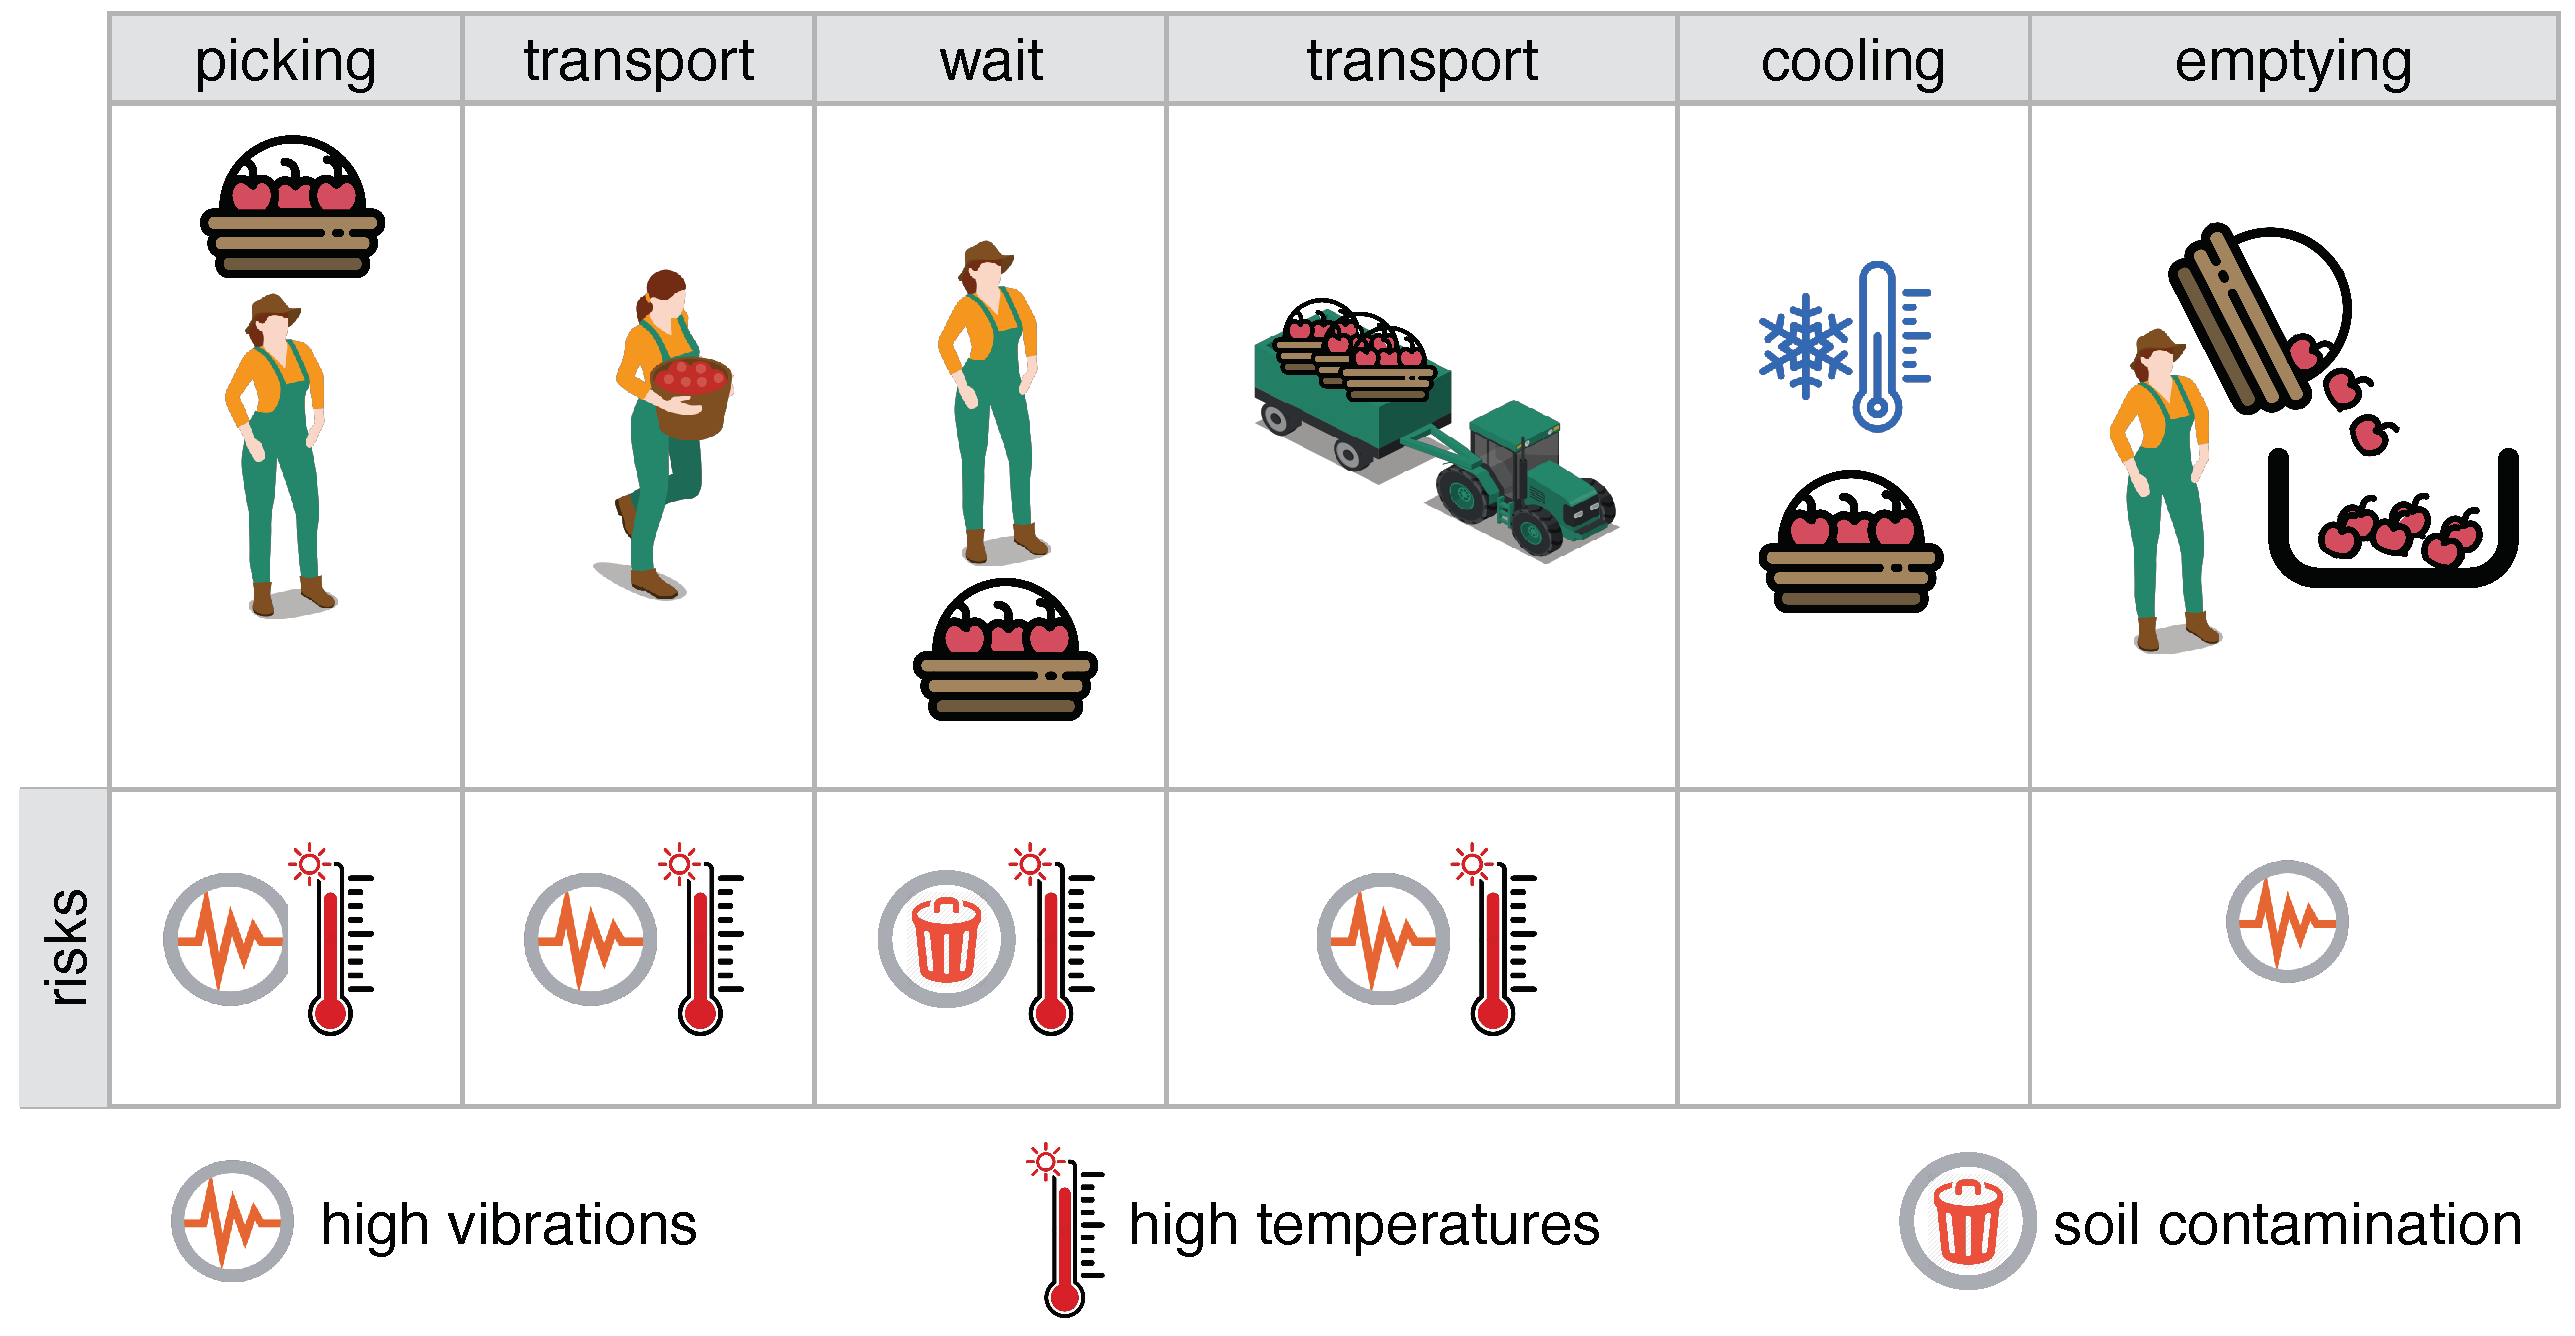
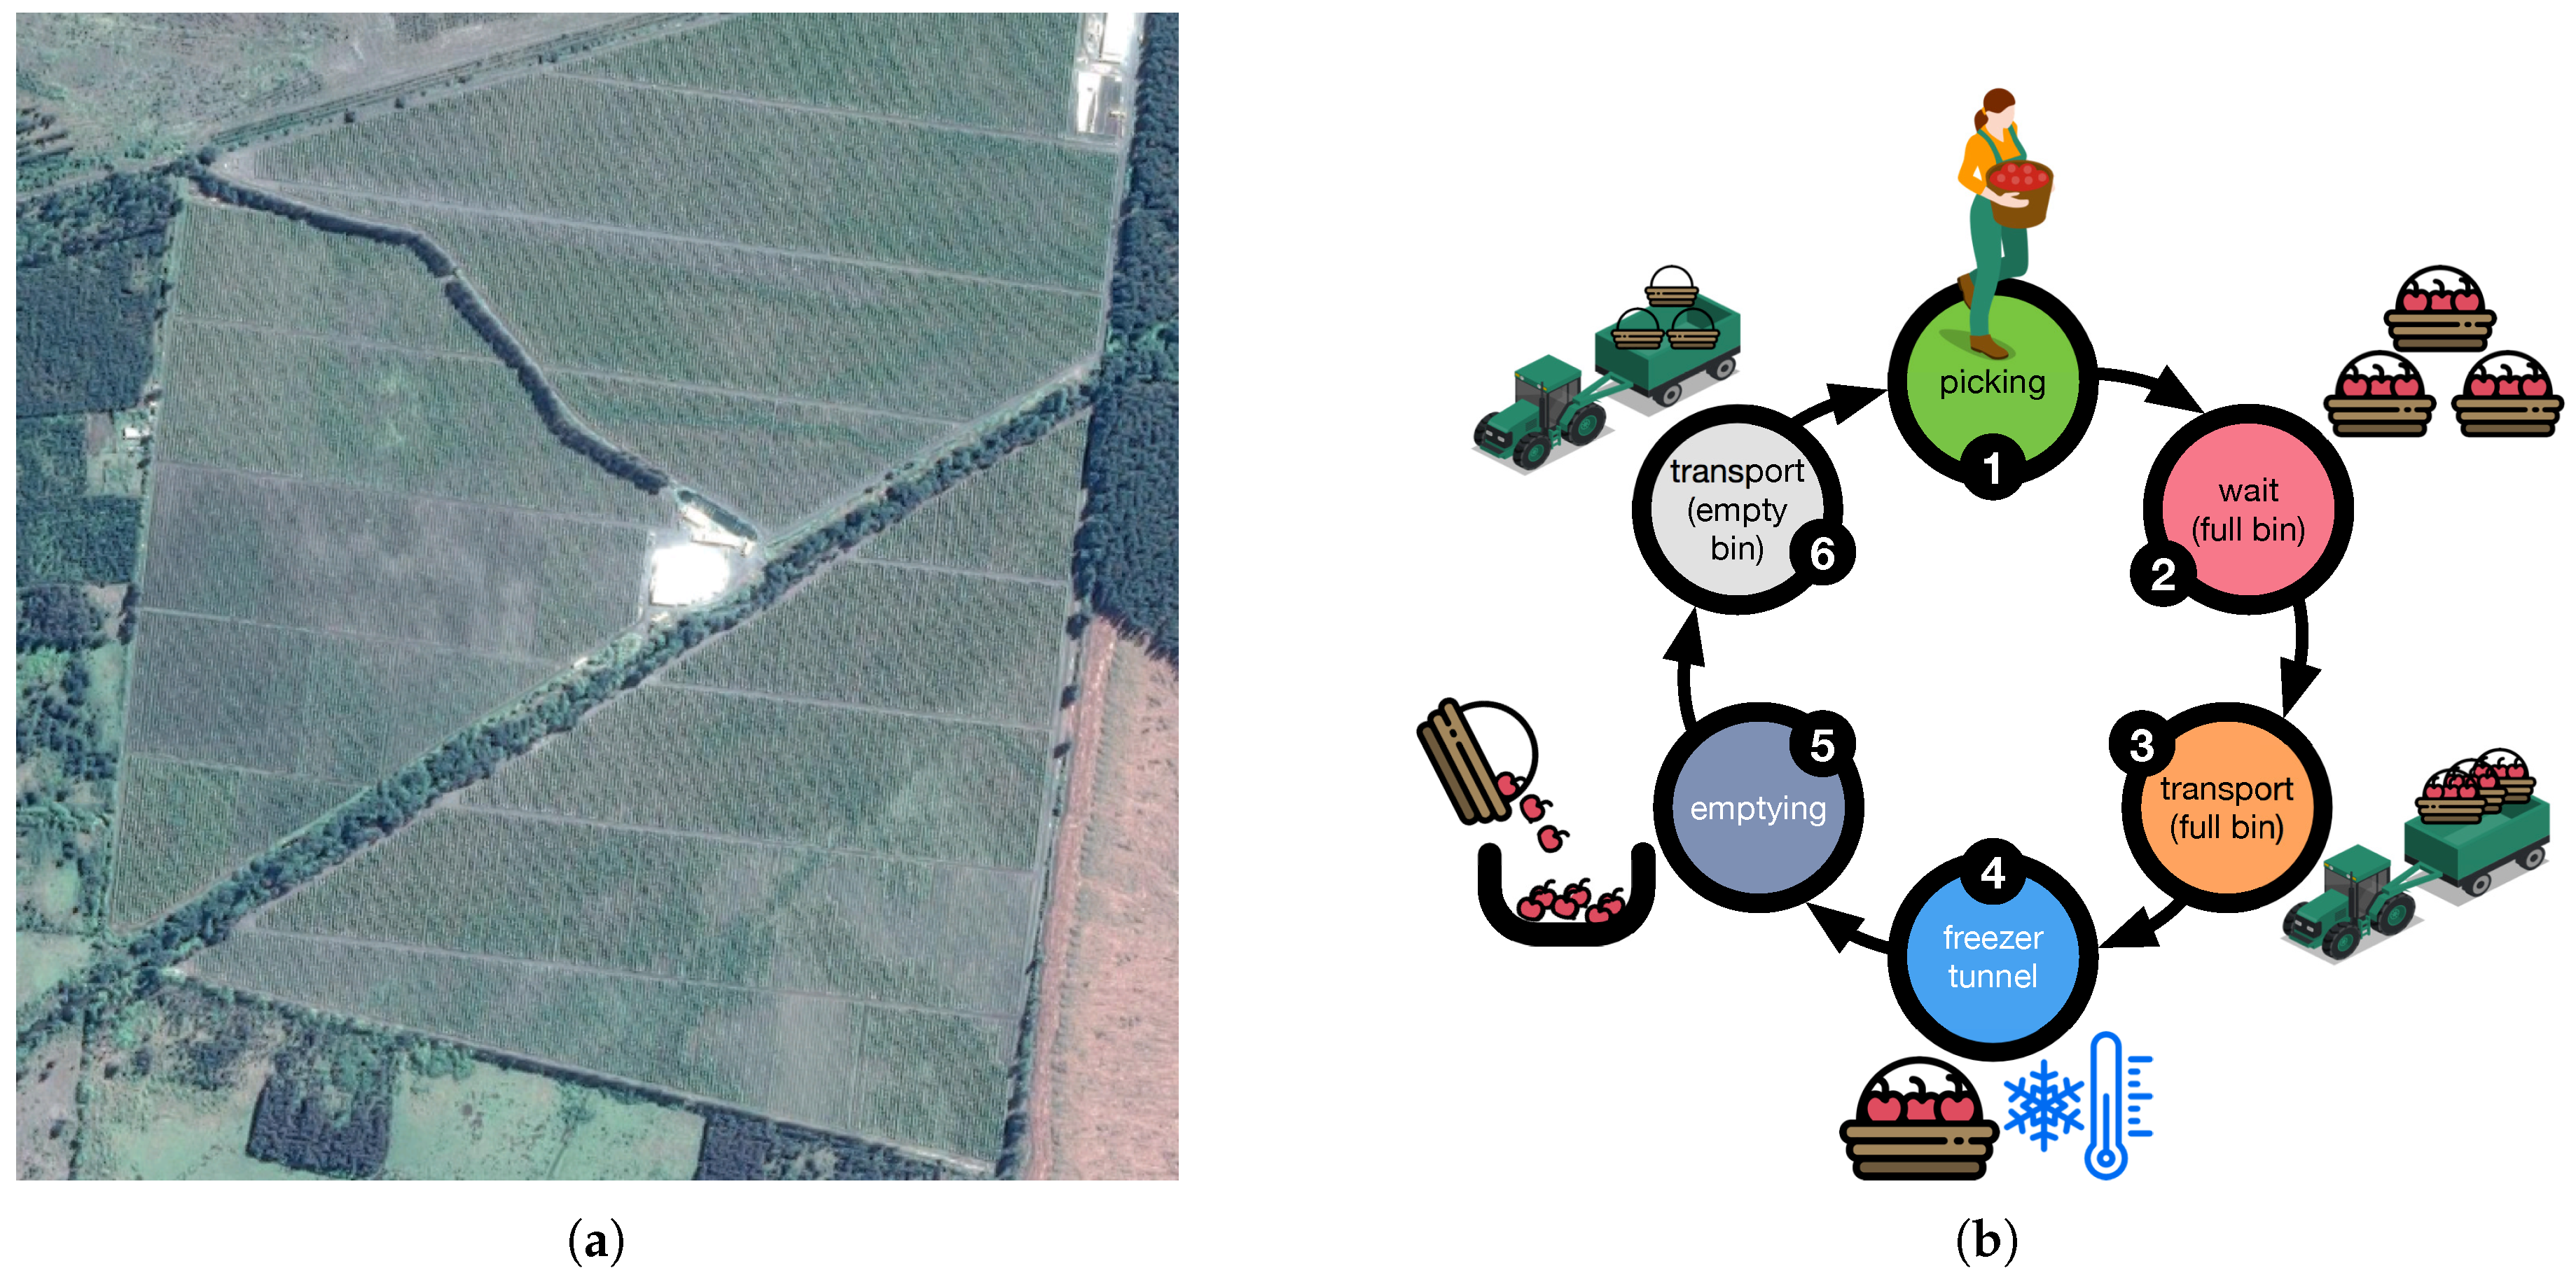
Figure 1 shows the blueberry harvest process in an orchard in southern Chile, where the harvest basket passes through several stages before arriving at the packing facility: picking, transport on foot, waiting times, transport by vehicle, refrigeration chain, emptying of the basket in the packing area. At each of these stages there are potential risks that could affect the final shelf life or some quality indicators. At least three important risks are identified: (1) excessive vibrations or bumps, (2) high temperatures and (3) contamination due to contact with the soil. Extreme vibrations due to rough handling or falling from the basket can occur during picking. The likelihood of vibrations is high during transfer on foot from plant to plant, transport by vehicle and, finally, the emptying stage. Exposure to direct sunlight or high temperature during extended periods of time could shorten the fruit’s shelf life; this risk occurs when the temperature in the harvested fruit is high during long periods, and it could be triggered during the stages of picking, waiting for transportation or transportation. During the harvest process, the picker needs to take occasional breaks, sometimes leaving the basket resting on the ground. According to agriculture regulations, the basket must not touch the ground due to possible soil (dirt) contamination of the fruit, so these events need to be avoided.
In view of the above, any improvement in the agricultural production process can have a significant impact, particularly in countries where this industry represents an important percentage of the productive matrix. It is also important for the berries business model that all production stages of harvesting should be monitored, so that potential damage to the berries can be evaluated. To do this, the first step is to implement a system capable of detecting and isolating each of these stages based on monitoring variables that can be measured during the whole process. This system should be simple and inexpensive; moreover, it should be modular and easily scalable to field size. Since it is necessary to monitor variables that affect the harvested fruit physically, the sensors should be placed as close to the fruit as possible. In this case, the inside of the harvest basket will be the ideal place to implement solution.
This article proposes a stage monitoring system for berry harvesting based on three variables measured with sensors inside the harvest basket: weight, temperature, and vibrations. Combined analysis of these variables can help to identify the different stages of the harvesting process and detect possible risks of excessive vibrations and high temperatures. This information also makes it possible to assess whether harvest operations are performed accurately.
The remainder of this paper is organized as follows: In
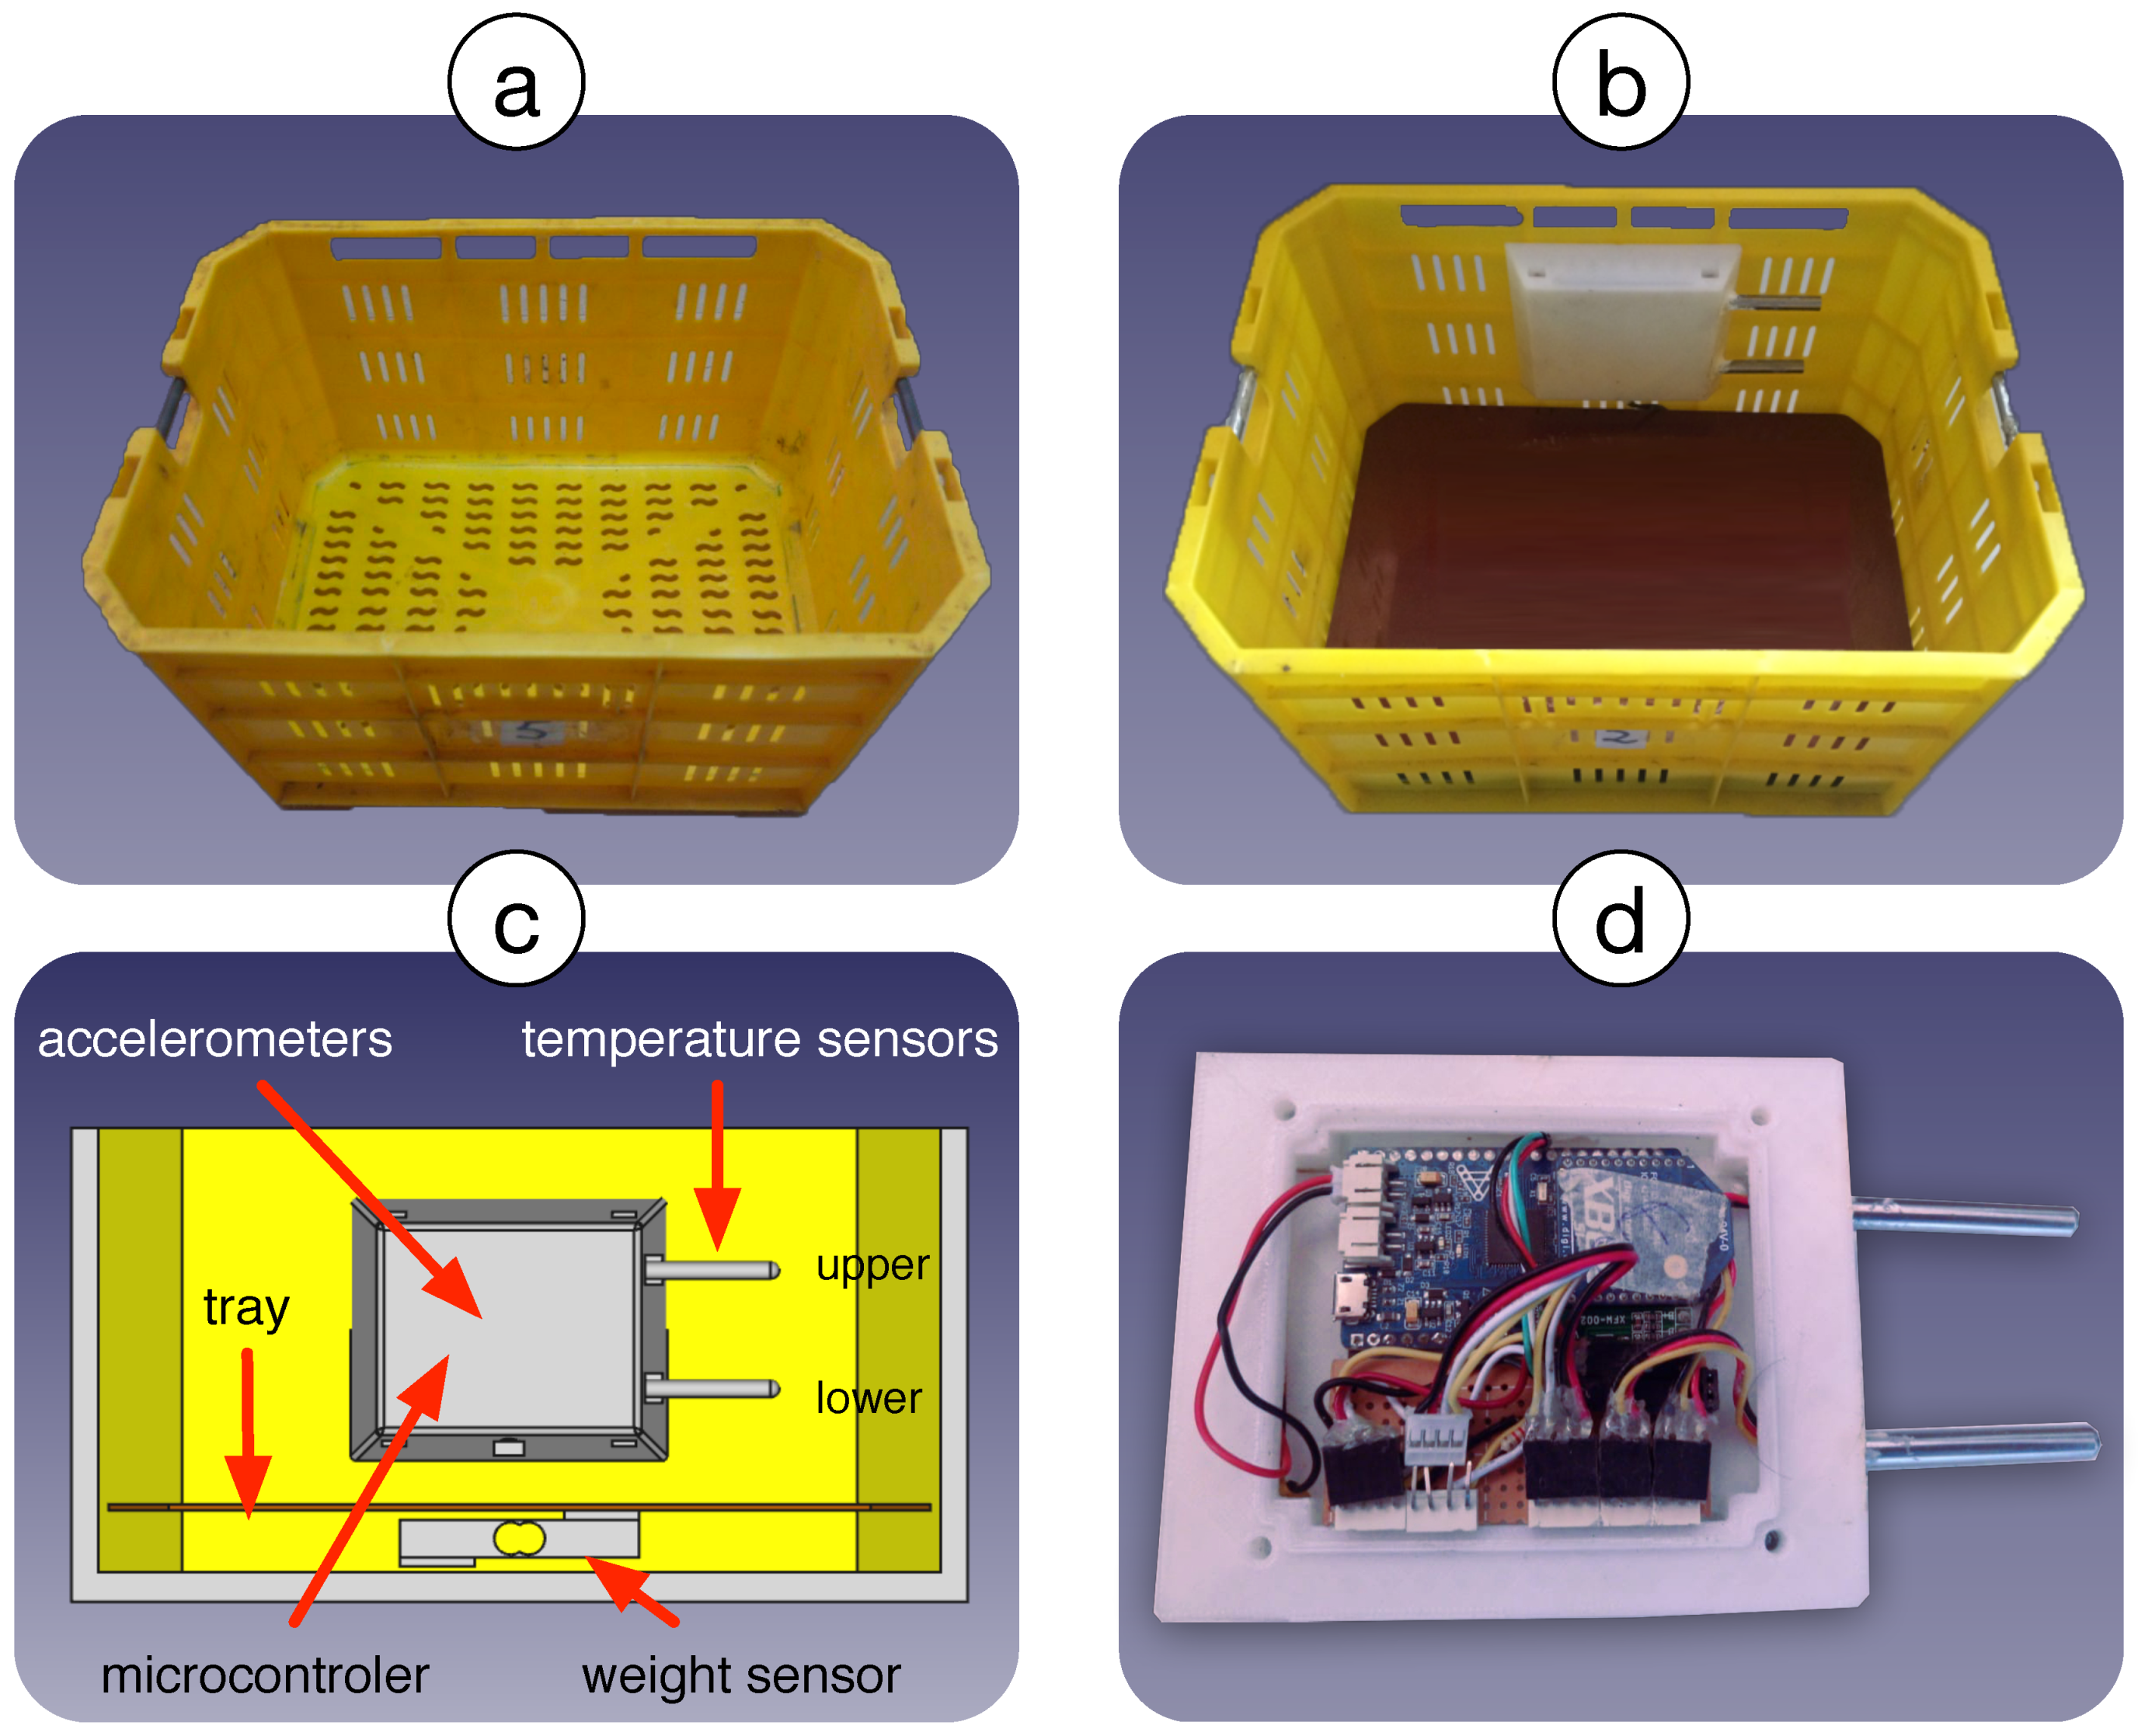
Section 2 we present the proposal of this paper, describing the harvesting problem adopted as the case study and the proposed ‘Smartbin’ system, which includes modified harvest baskets fitted with various kinds of sensors, and a data acquisition module, allowing data collection during the different stages of the harvesting process. We also briefly describe the experimental design. Experimental results obtained by applying Smartbins in a real harvesting process are described in
Section 3. The results show how the data collected from the instrumented baskets can serve to identify and describe the different stages of the harvesting process. Finally,
Section 4 offers our conclusions and suggests some future directions for this work.
3. Results
The data obtained from the five baskets presented similar behavior.
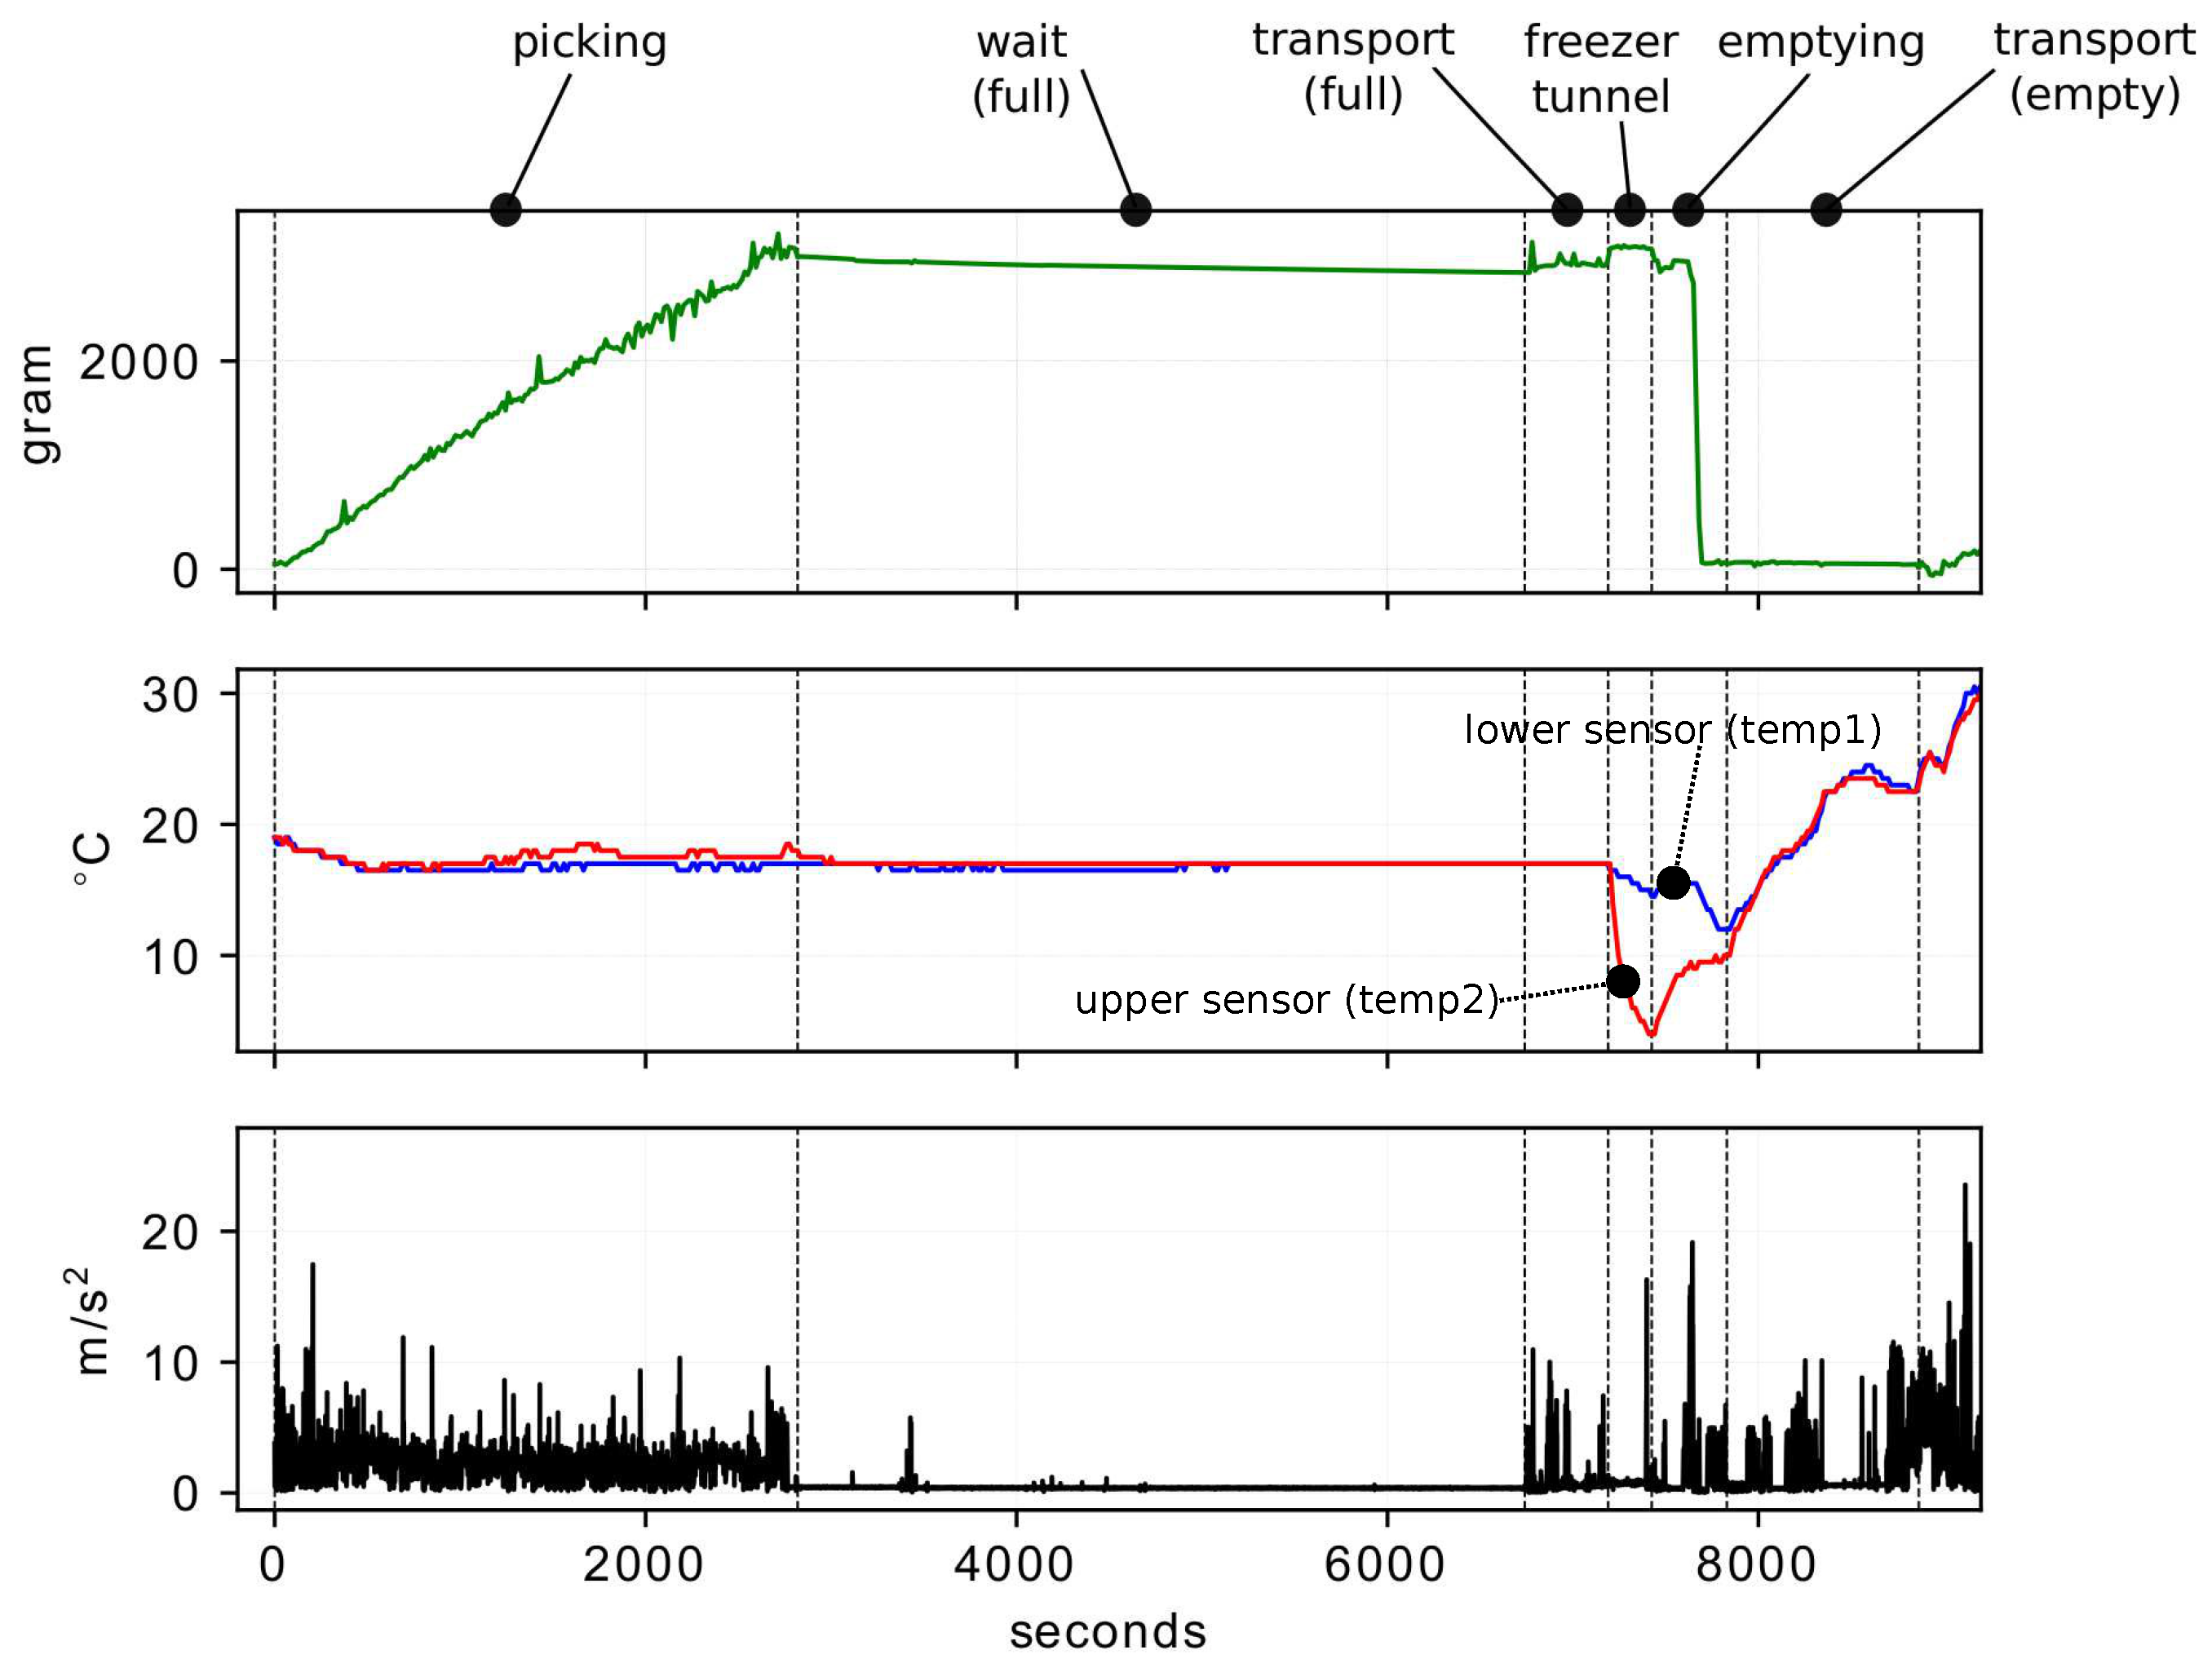
Figure 4 depicts the vibrations, weight, and temperature data obtained for one harvest basket.
The weight graph illustrates the mass of the fruit contained in the basket in grams. The temperature graph is measured in degrees Celsius and represents the temperature inside the basket at both the lower sensor (temp1), and the upper sensor (temp2). Finally, the graph of the vibrations (accelerations) is represented with the module of the vector sum of the linear accelerations on the three spatial axes and given by Equation (
1) and expressed in
.
All the recorded variables were aligned on the same time scale (seconds), where zero corresponds to the point at which the monitoring system in the basket was switched on. The vertical dotted lines correspond to the six harvest stages mentioned in
Figure 2b, which were manually determined with the information compiled during the experiment. Next, the behavior of the three variables monitored for each of these stages is described:
Picking: The records of the accelerometer clearly indicate the movements of the basket during harvesting. The weight sensor shows a progressive increase as the basket fills. The temperature sensors record values similar to the environmental temperature.
Wait (Full): During this period, the accelerometer does not register significant movements. The weight sensor does not register variations in mass in the basket. The temperature sensors continue to record the environmental temperature.
Transport (Full): Here the accelerometer again detects movements of an order similar to that of picking; these movements are also detected by the weight sensor due to the vertical accelerations associated with transport by vehicle. The temperature sensors continue to record the environmental temperature.
Cold Tunnel: In this process the full basket moves through a cold tunnel on a low-speed conveyor belt. Here, the vibrations detected are imperceptible at the scale of the graph. The weight sensor also does not record changes in mass inside the basket. The two temperature sensors record a significant loss, with the higher sensor in the basket recording the greatest temperature change due to the characteristics of the cooling system.
Emptying: Emptying the fruit onto a conveyor belt generates significant vibrations detected by the accelerometer due to tipping of the basket. At this point the weight sensor drops drastically due to the loss of mass inside the basket. Given that this process occurs outside the cold tunnel, the temperatures of both thermometers begin to rise significantly.
Transport (Empty): The vibrations from transporting the empty basket are clearly recorded by the accelerometer. The weight sensor continues to record the absence of fruit, and the temperature sensors begin to register the increase in environmental temperature.
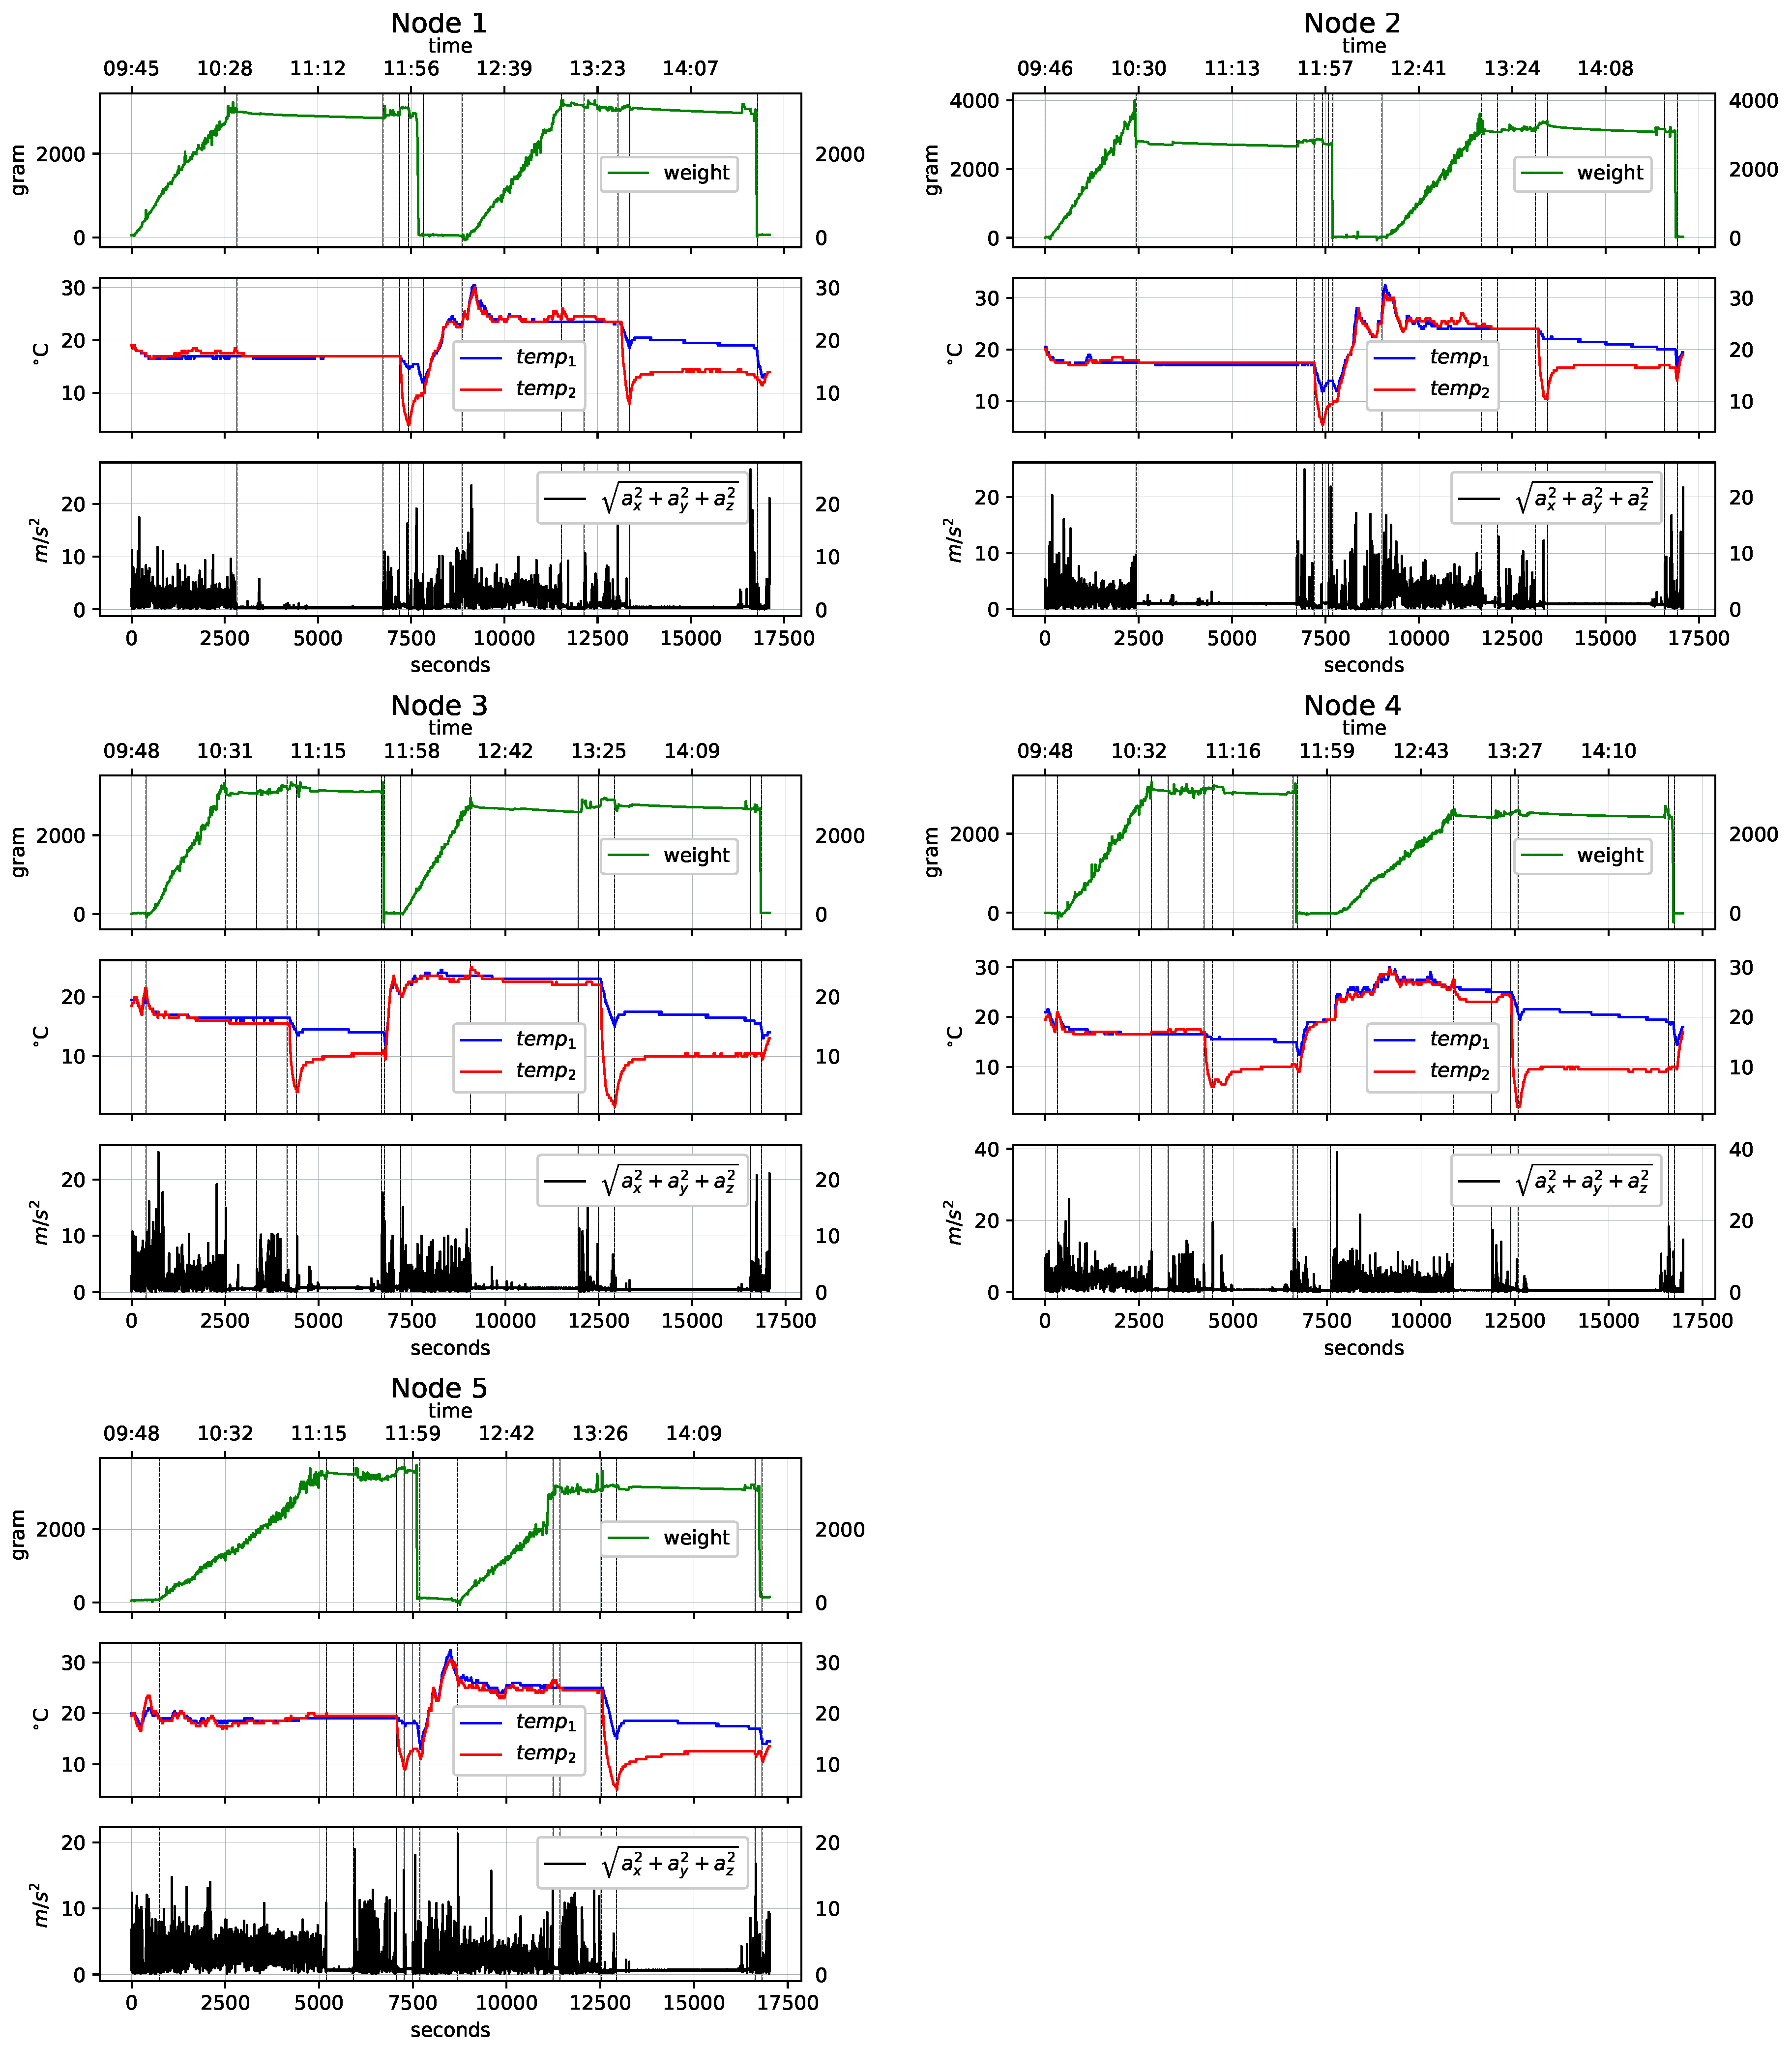
Figure 5 shows the vibration, weight and temperature graphs for the five nodes (
) used in the experiment, for an entire working day. During the working day, each node described two picking processes (harvest 1 and harvest 2), yielding a total of 10 recorded harvests. The graphs also contain vertical lines that define the times in seconds at the beginning and end of each stage of the harvest process. The first harvest starts at second 0 (typically at 9:45 a.m., depending on picker assignment), so the temperature is low (no more than 18 °C). The second harvest begins around second 8000–9000 (midday), when the temperature rises to 25 °C–30 °C depending on the weather conditions.
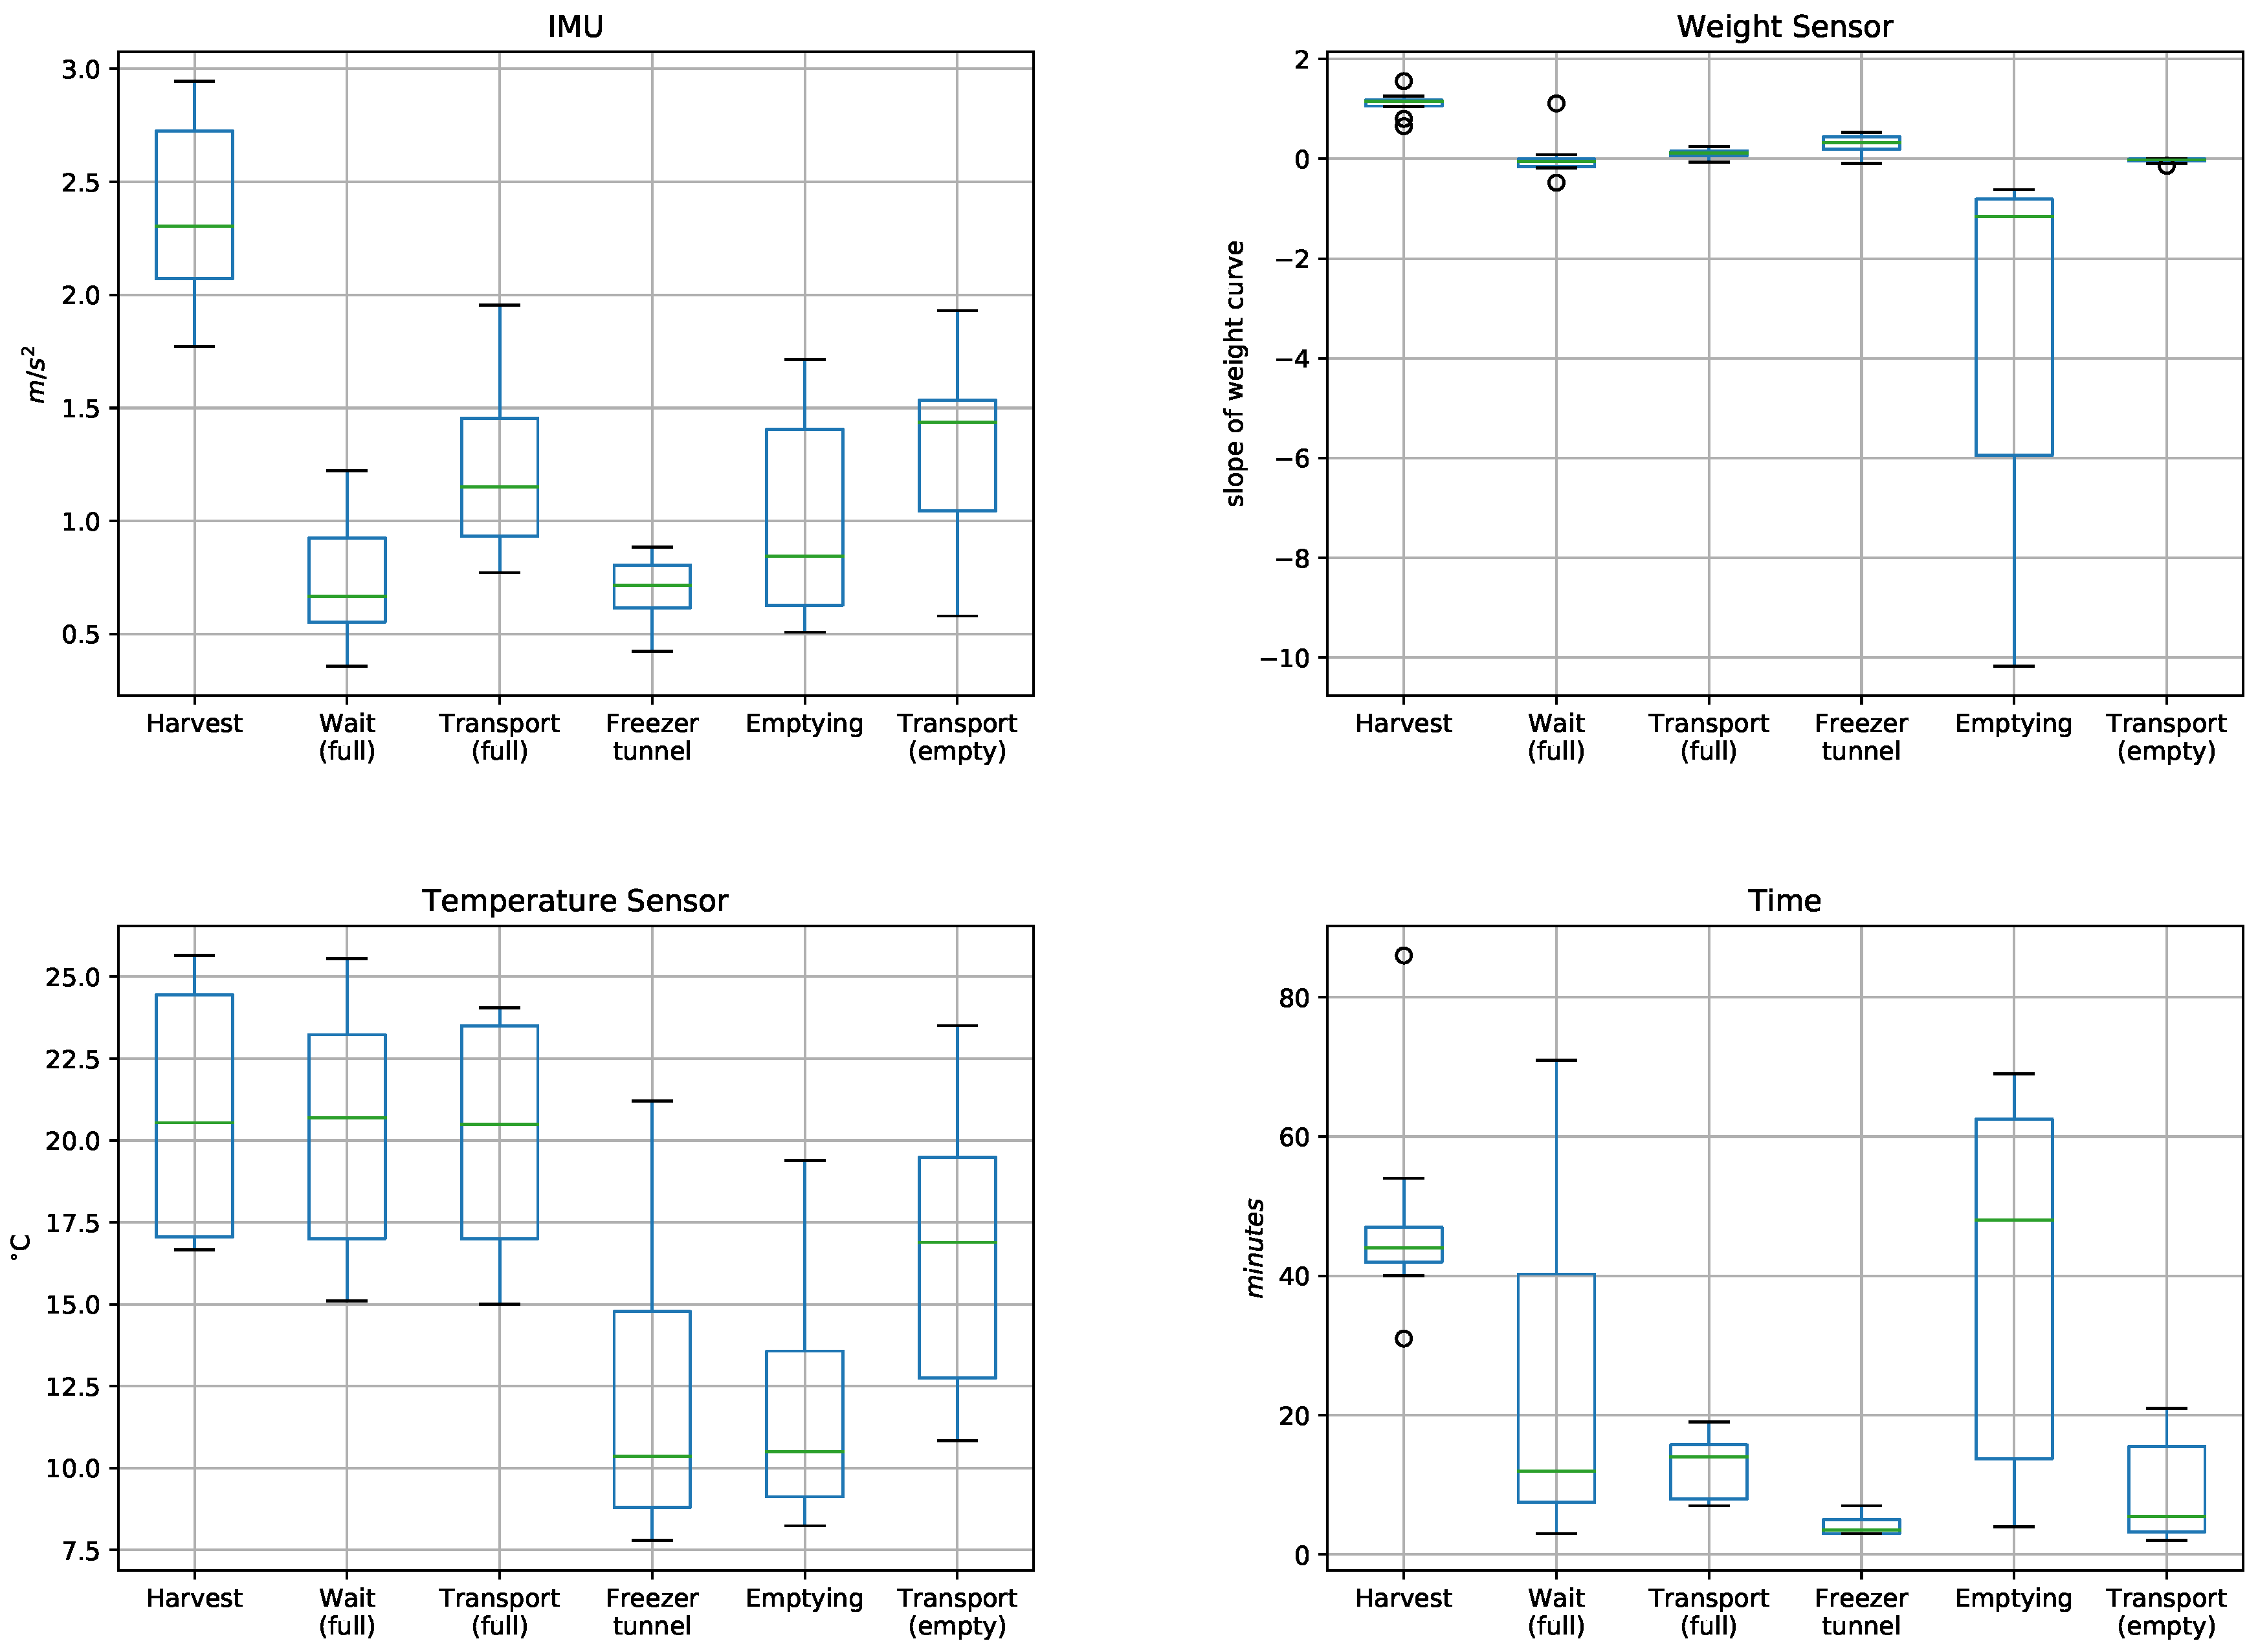
Figure 6 presents a statistical analysis that integrates the data from the 10 harvests, grouped by the results from each sensor (IMU, weight sensor, temperature sensor) and the times associated with each stage. In the case of the weight sensor, an indicator of the variation in weight over time was calculated (grams/second), which corresponds to the slope of the weight curve. Please note that this graph shows values that can differentiate some of the harvest stages. For example, in the IMU the mean values for picking and transport exceed the other stages, reaching values over 1. In the case of the weight sensor, the slope of the curve during picking stands out, maintaining values near 1, whereas during emptying a negative slope is produced due to the steep weight loss. The temperature sensor yields significantly lower values than the environmental temperature only during the stages of cold tunnel and emptying.
When the duration of each stage is analyzed, long times are observed for picking, wait-full, and emptying. During the first and second stages, the fruit is subjected to temperatures that could affect its shelf life due to dehydration. In the emptying stage, the fruit must wait for classification into different qualities.
3.1. Algorithms for the Recognition of Harvest Stages
To generate a recognition mechanism for the different stages of the harvest based on the variables monitored, different classification strategies were analyzed based on machine learning (ML) algorithms. To do this, we used the programming language Python and five libraries: scipy, numpy, matplotlib, pandas, and sklearn.
The data from the 10 harvests were pre-processed and tabulated in a csv text file of 1669 records in 8 columns:
base_time,
id_device,
imu_mean,
weight_slope,
weight_mean,
temperature_mean,
temperature_slope, and
state. The mean values were calculated using an arbitrary interval of
s. In the tests, six ML algorithms were evaluated: logistic regression (LR), linear discriminant analysis (LDA), K-nearest neighbors (KNN), classification and regression trees (CART), Gaussian Naive Bayes (Gaussian NB) and support vector machines (SVM). We used the data from four of the five nodes (equivalent to eight harvests), while the data from Node 3 (equivalent to two harvests) was left for analysis to provide an independent final validation of the selection process of the recognition model. To obtain the optimal model, k-fold cross-validation was used with 80% of the date to generate the model and 20% to validate it.
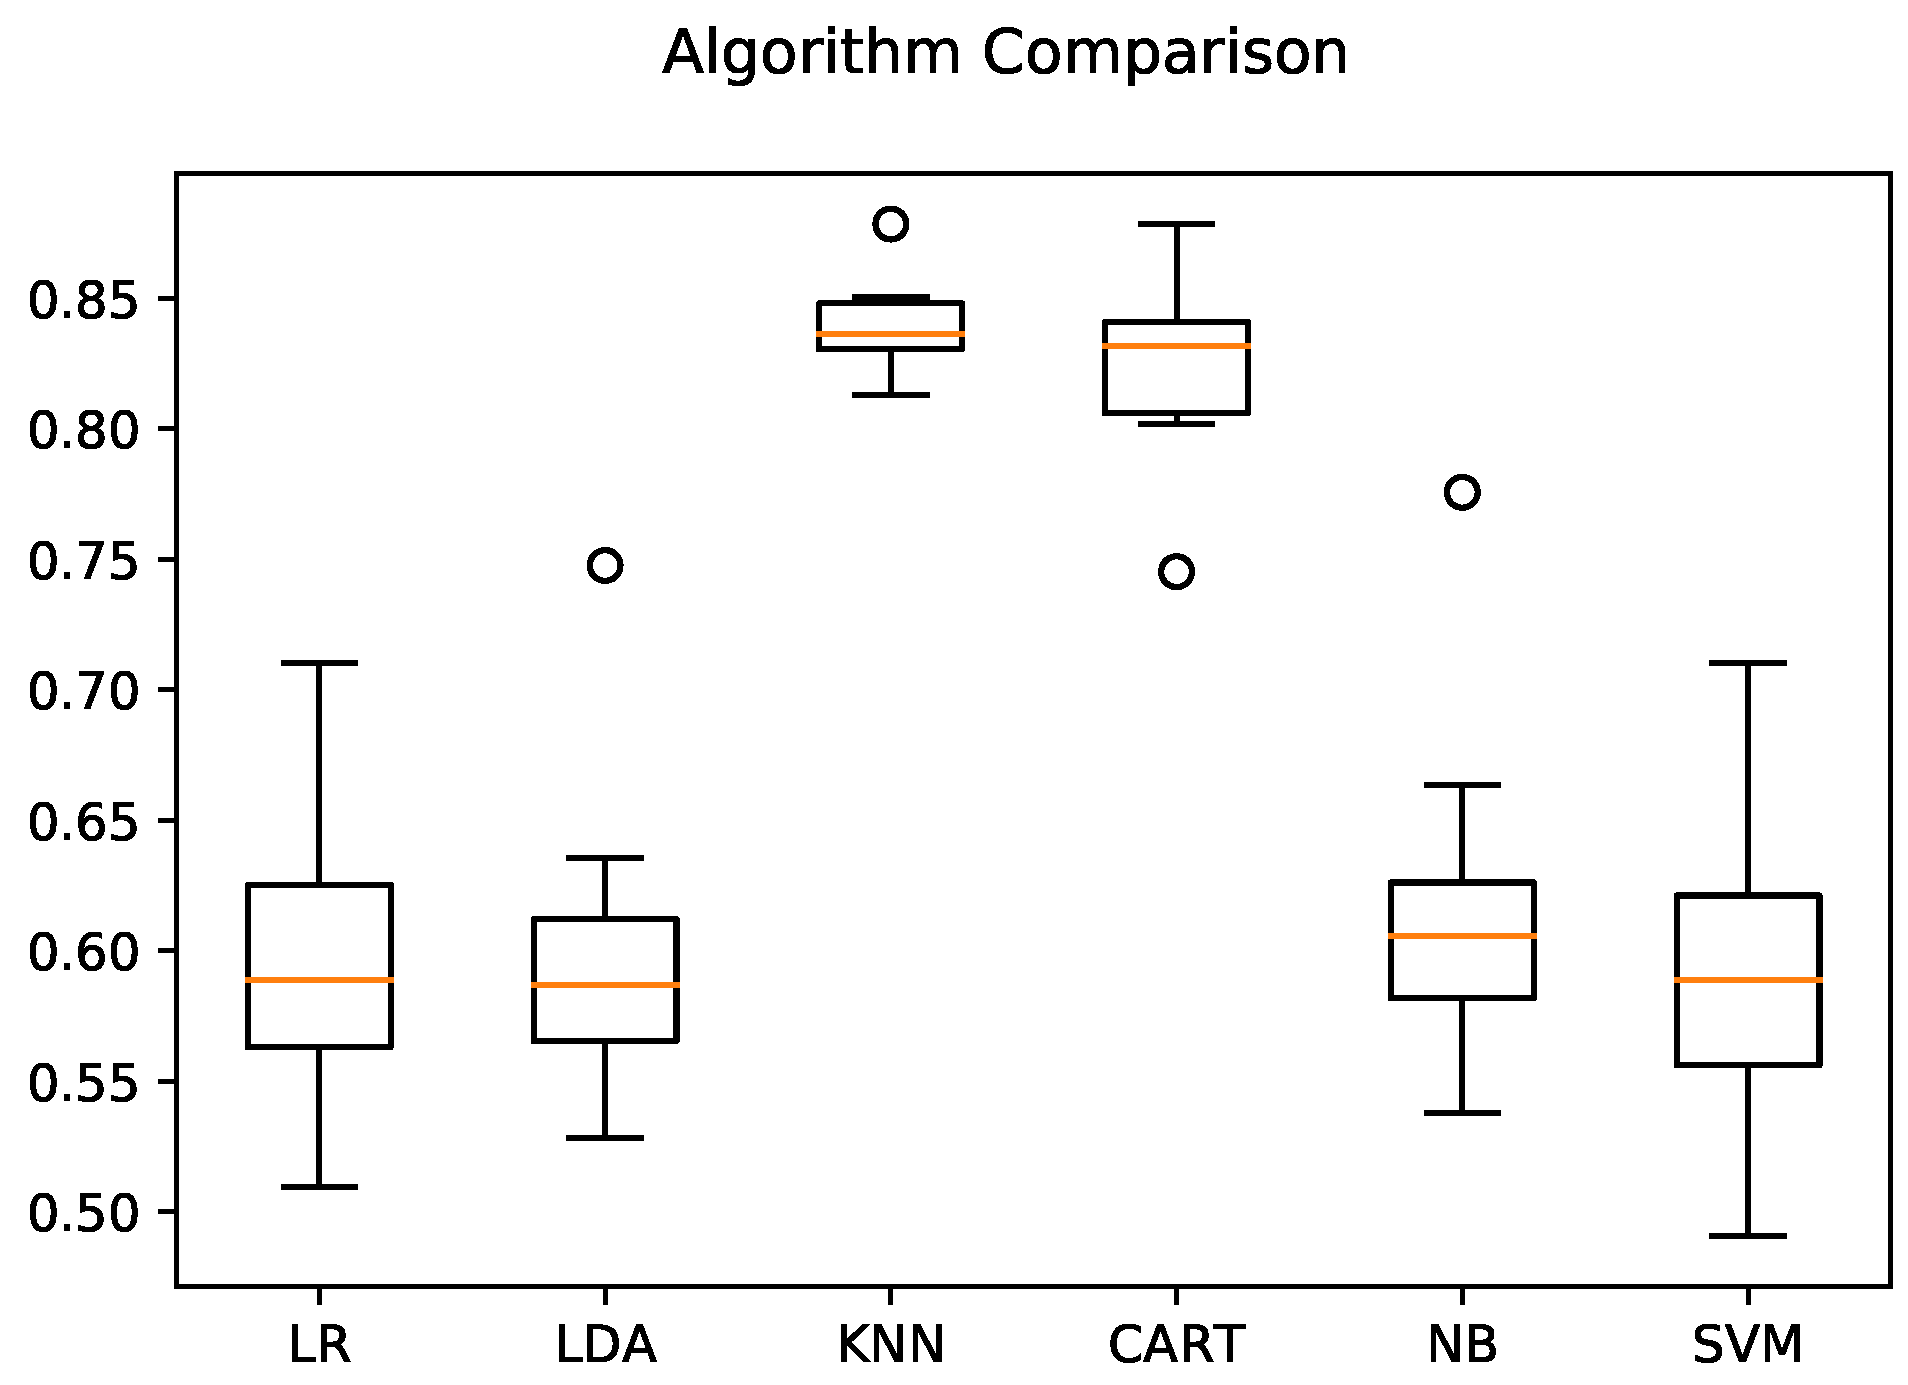
Figure 7 shows a comparison of the ML algorithms mentioned above; the KNN and CART algorithms stand out, presenting accuracies of over 80%.
Table 1 shows the result of the KNN classifier and the validation data set. Here, we observe that all stages present relatively high performance values except the freezer tunnel and transport (empty) stages. On analyzing the records, we find that only a low amount of data (10%) corresponds to these two harvest stages, while about 90% of the observations correspond to the other stages. This situation is evident in
Figure 8, where we find the typical case of skewed classes or a class imbalance problem [
25]. The low performance could be explained because the KNN algorithm does not classify the harvest stages well with the proportionally small amount of data available.
Table 1 also includes two support values for each stage: the standard support, and the support in seconds. The latter represents the amount of time the basket remains in each stage. The basket remains a long time in the stages picking and wait (full), and for these stages the precision and recall values are high, meaning that the time estimation is reasonable. On the other hand, in the transport (full), freezer tunnel and emptying stages, the precision and recall values are lower, probably because these stages are short causing the problem of imbalanced data.
3.2. Validation of the Model with an Independent Node
Finally, we decided to execute one last validation process of the KNN model with data from Picking Node 3. This guarantees total independence of the validation, since none of the data produced by this physical node were used to generate the recognition model.
Table 2 shows the precision of the model based on this independent node. Here, a slight drop in performance is noted (from 82% to 79%), as well as a variation in the individual performance. This result confirms that the KNN algorithm performs acceptably in harvest stage recognition Finally,
Figure 9 shows a comparison between the values of the harvest stages estimated by the KNN model (red line) and the real harvest stages of Node 3 during the field test (blue line). The red circles on the blue lines correspond to the values successfully estimated by the model, corresponding to approximately 80% of cases.
4. Discussion
In many countries, berry picking is still done manually. This makes it difficult to control the harvest process, which can influence the ultimate quality of the harvested fruit due to human and/or environmental factors. Although many of the variables associated with the harvest process (vibrations, temperature, overweight, etc.) are generally difficult to control, they can be measured using embedded sensor systems that can be incorporated into the fruit harvest baskets.
Using the Smartbin in a real harvest situation, we gathered temperature, weight and vibration data from which to construct a mathematical model that can identify at which stage of the process each Smartbin is. The model was constructed comparing six different ML techniques (LR, LDA, KNN, CART, Gaussian NB, and SVM). The best performance was obtained with KNN (close to 80%). Due to the imbalanced nature of the data collected, the best results were obtained in longer stages (picking and wait-full, with a performance of 89% and 86% respectively); while in shorter stages, representing about 10% of the total amount of data, the performance decreased considerably (to between 36% and 60%).
Two similar solutions were found in the literature. Xu [
14] uses an artificial berry to analyze vibrations during the harvest process. It is a simple approach based on an accelerometer, but insufficient to generate enough information to identify harvest stages. Schueller’s patent [
13] consists of a generic platform customizable for different agricultural processes; it includes sophisticated sensors and algorithms to recognize manual agricultural operations (events). The Smartbin presented here generates important information for the producer, including the number of baskets at each harvest stage, process bottlenecks, excessive times when the fruit is subjected to undesirable conditions (temperature and vibrations), estimation of production time intervals, identification of workers who mishandle the basket, etc.
The cost of the monitoring system is €103; this value was calculated using the price of each component of the prototype and does not include the price of the harvest basket.
Despite the low complexity of the prototype, it is estimated that its design can still be improved by eliminating the mechanical component used to measure the mass inside the basket. This improvement would involve a simplification of system installation and maintenance, as well as a reduction in the power consumption and the volume occupied in the basket. To do this, it will be necessary to assess the feasibility of estimating the mass of the fruit indirectly based on a detailed analysis of the data generated by the IMU in conjunction with estimation models that include information about harvest sequence patterns.
In the future, our intention is to construct a model that can use factor analysis to estimate the shelf life of the fruit after exposure to extreme conditions of the variables measured. This system could form the basis of a decision support system (DSS) for berry harvesting, where the producer would know what to do with the different qualities of harvested fruit. For example, if the fruit is not damaged, it can be exported; otherwise, it can be sent directly to individual quick freezing (IQF), thereby avoiding future economic losses. On the other hand, the DSS could have real-time alarm systems to avoid the fruit being exposed to extreme environmental variables or mistreatment. Future efforts will also consider improvements in the classification algorithm by solving the imbalanced data problem. This can be achieved by increasing the amount of data in short harvest stages by simply increasing the sampling frequency of the sensors (temperature and weight). The monitoring systems will also address the incorporation of other kinds of sensors (such as positioning systems) and wireless communications, to offer online remote data access.

 ,
, 


