Bitter Orange (Citrus aurantium Linné) Improves Obesity by Regulating Adipogenesis and Thermogenesis through AMPK Activation

 , , and
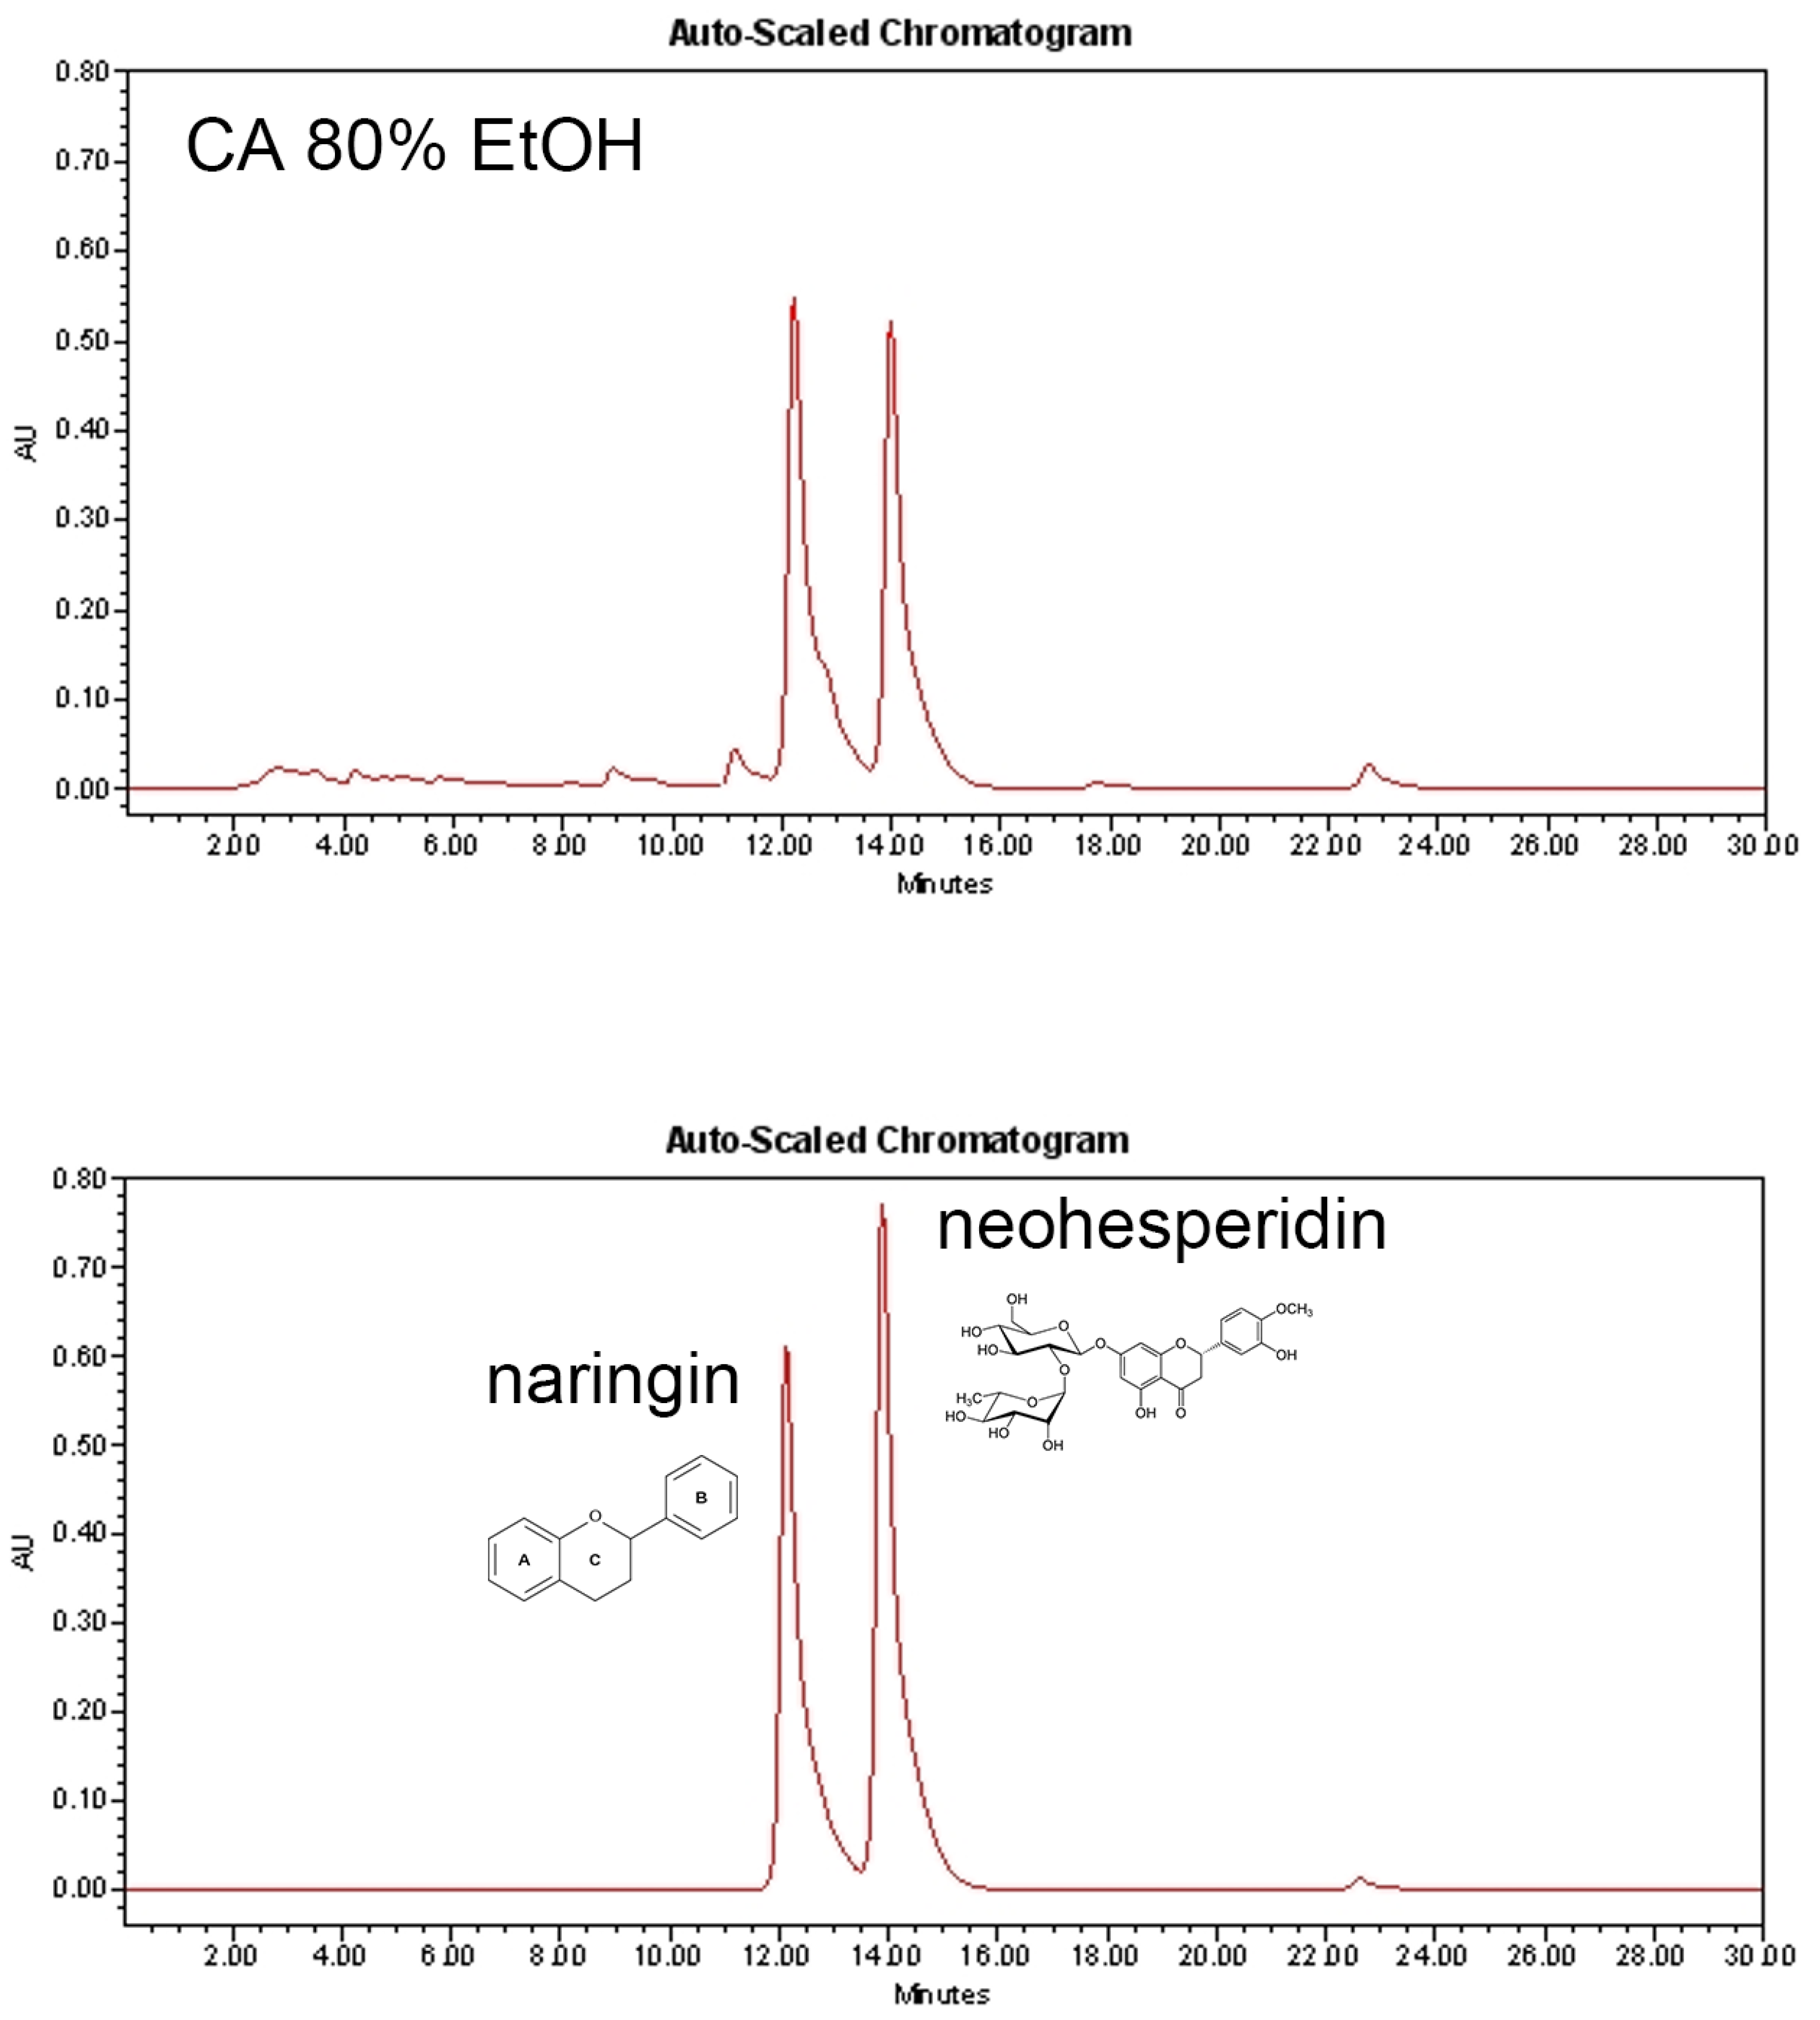
Abstract
:1. Introduction
2. Materials and Methods
2.1. Preparation of CA
2.2. Chemical Reagents and Antibodies
2.3. Chromatographic Separation
2.4. Ethics Statement
2.5. Animals and Diets
2.6. Serum Analysis
2.7. Cell Culture and Differentiation
2.8. Cytotoxicity Measurement
2.9. Oil Red O Staining
2.10. RNA Extraction and Real-Time Reverse Transcription Polymerase Chain Reaction (RT-PCR)
2.11. Protein Extraction and Western Blot Analysis
2.12. Mitochondrial Microscopic Analysis and Immunofluorescence Staining
2.13. Statistical Analysis
3. Results
3.1. Chromatographic Characterization of CA
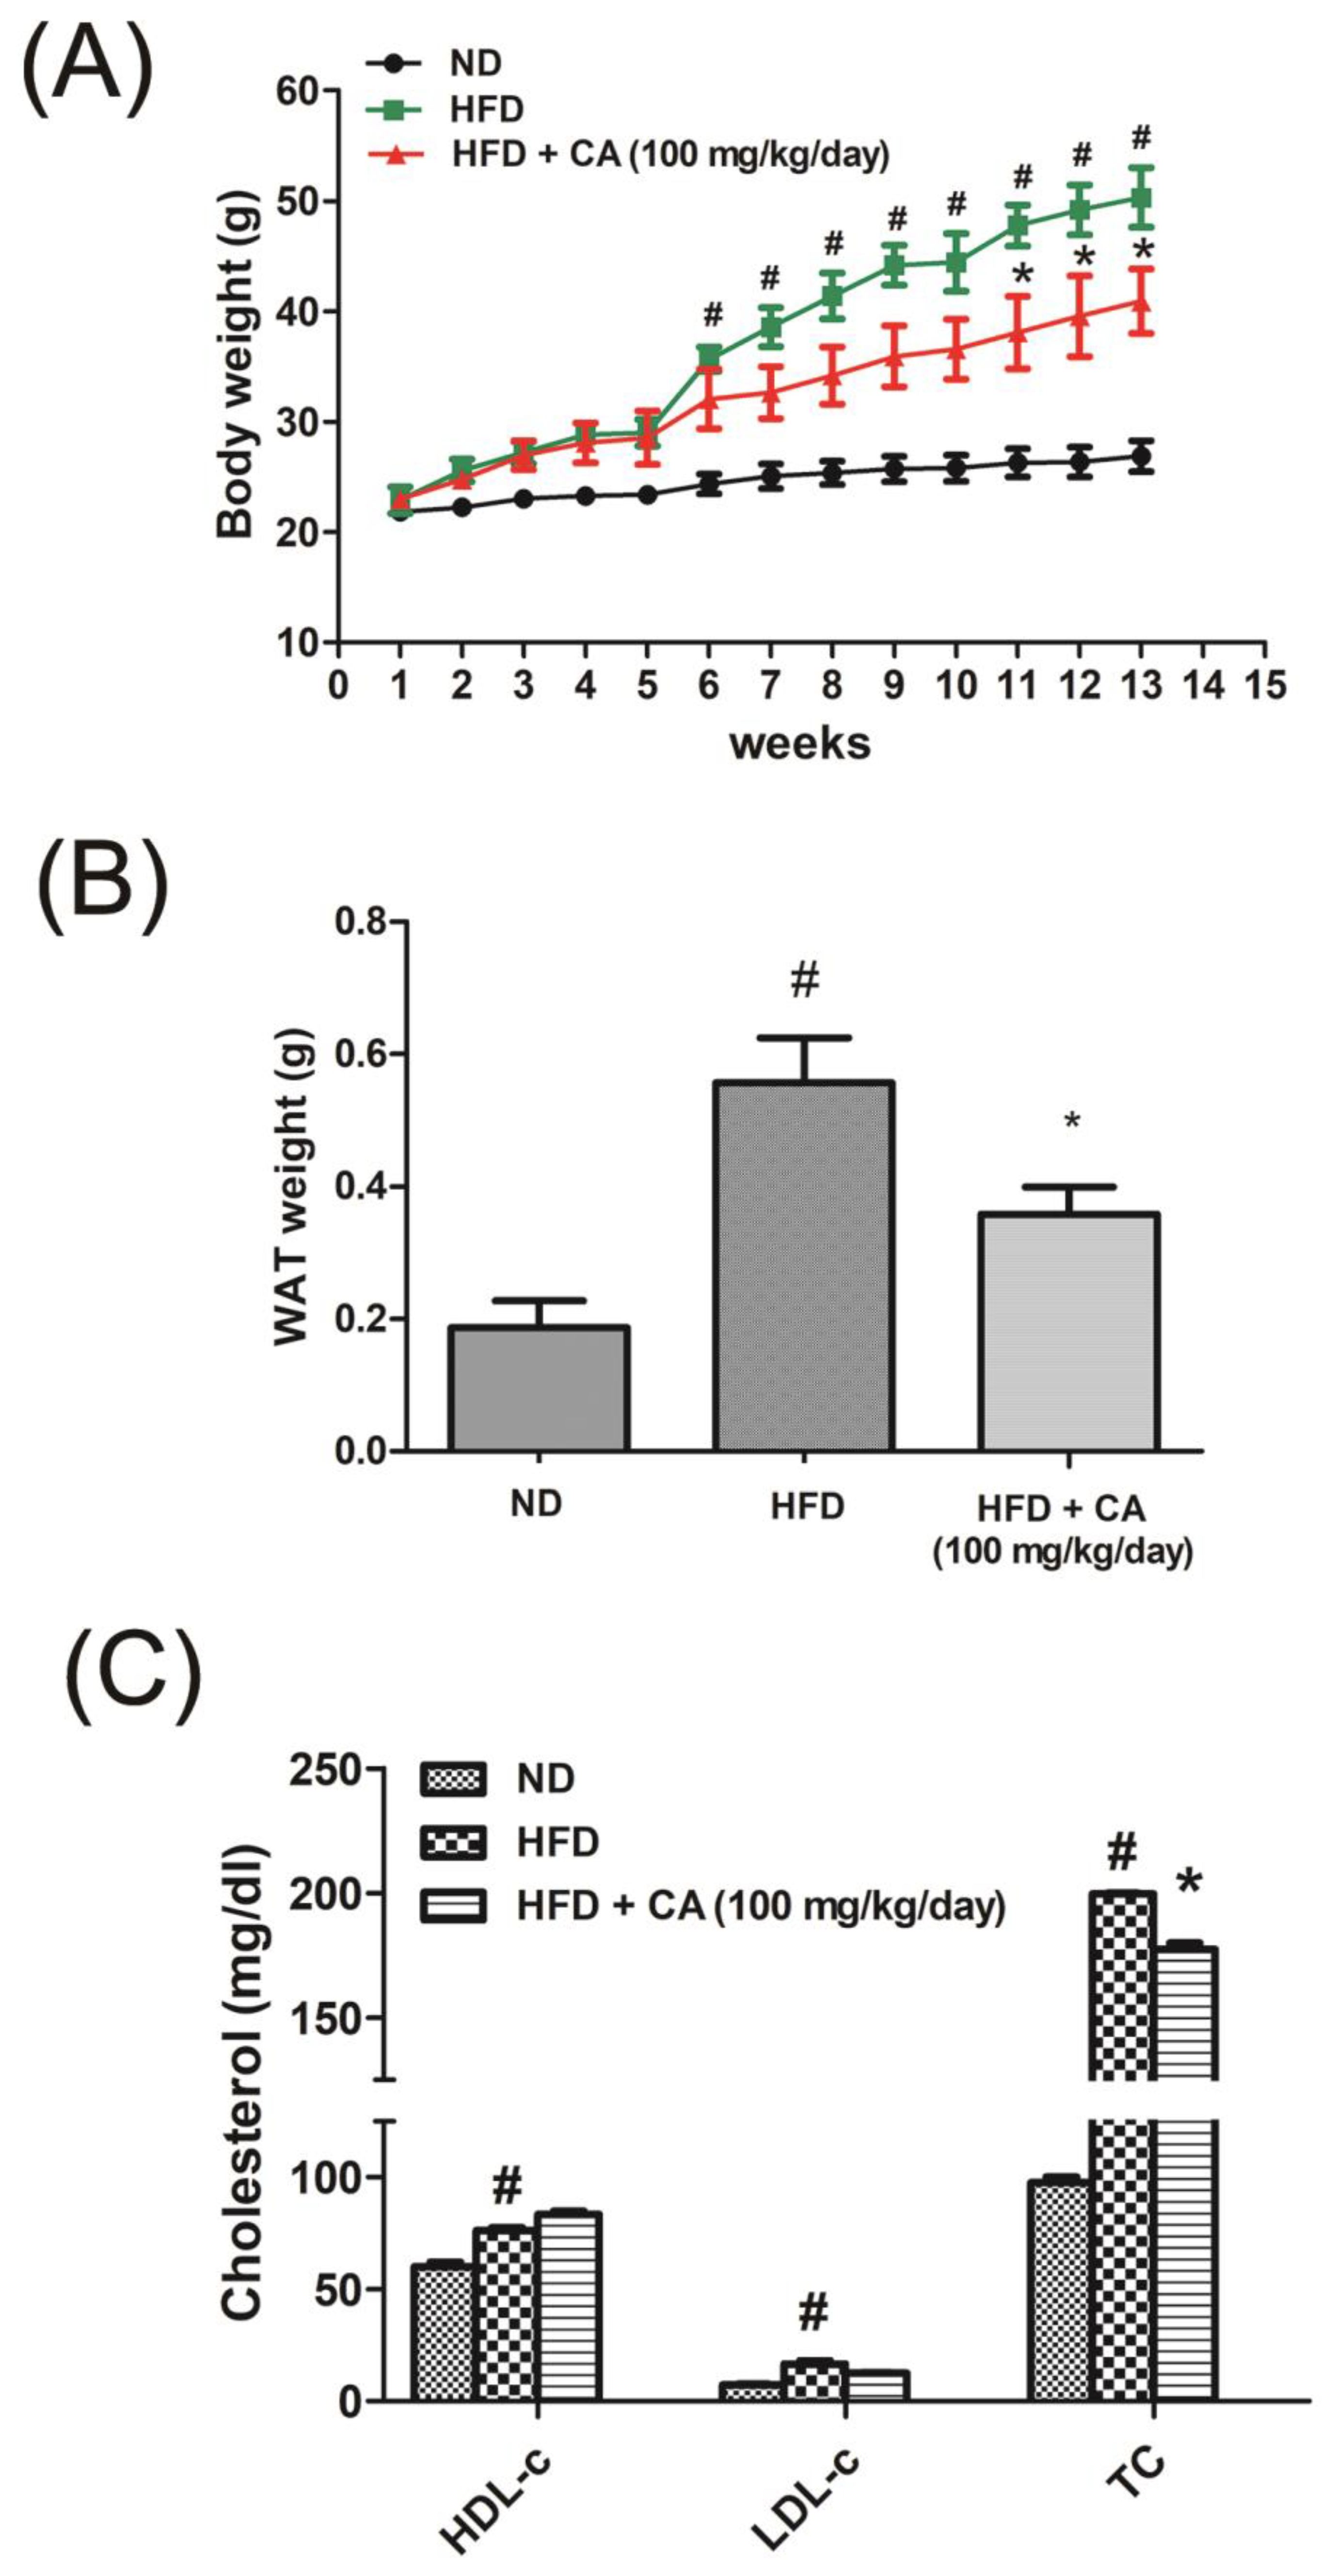
3.2. CA Suppressed Body Weight Gain in HFD-induced Obese C57BL/6 Mice
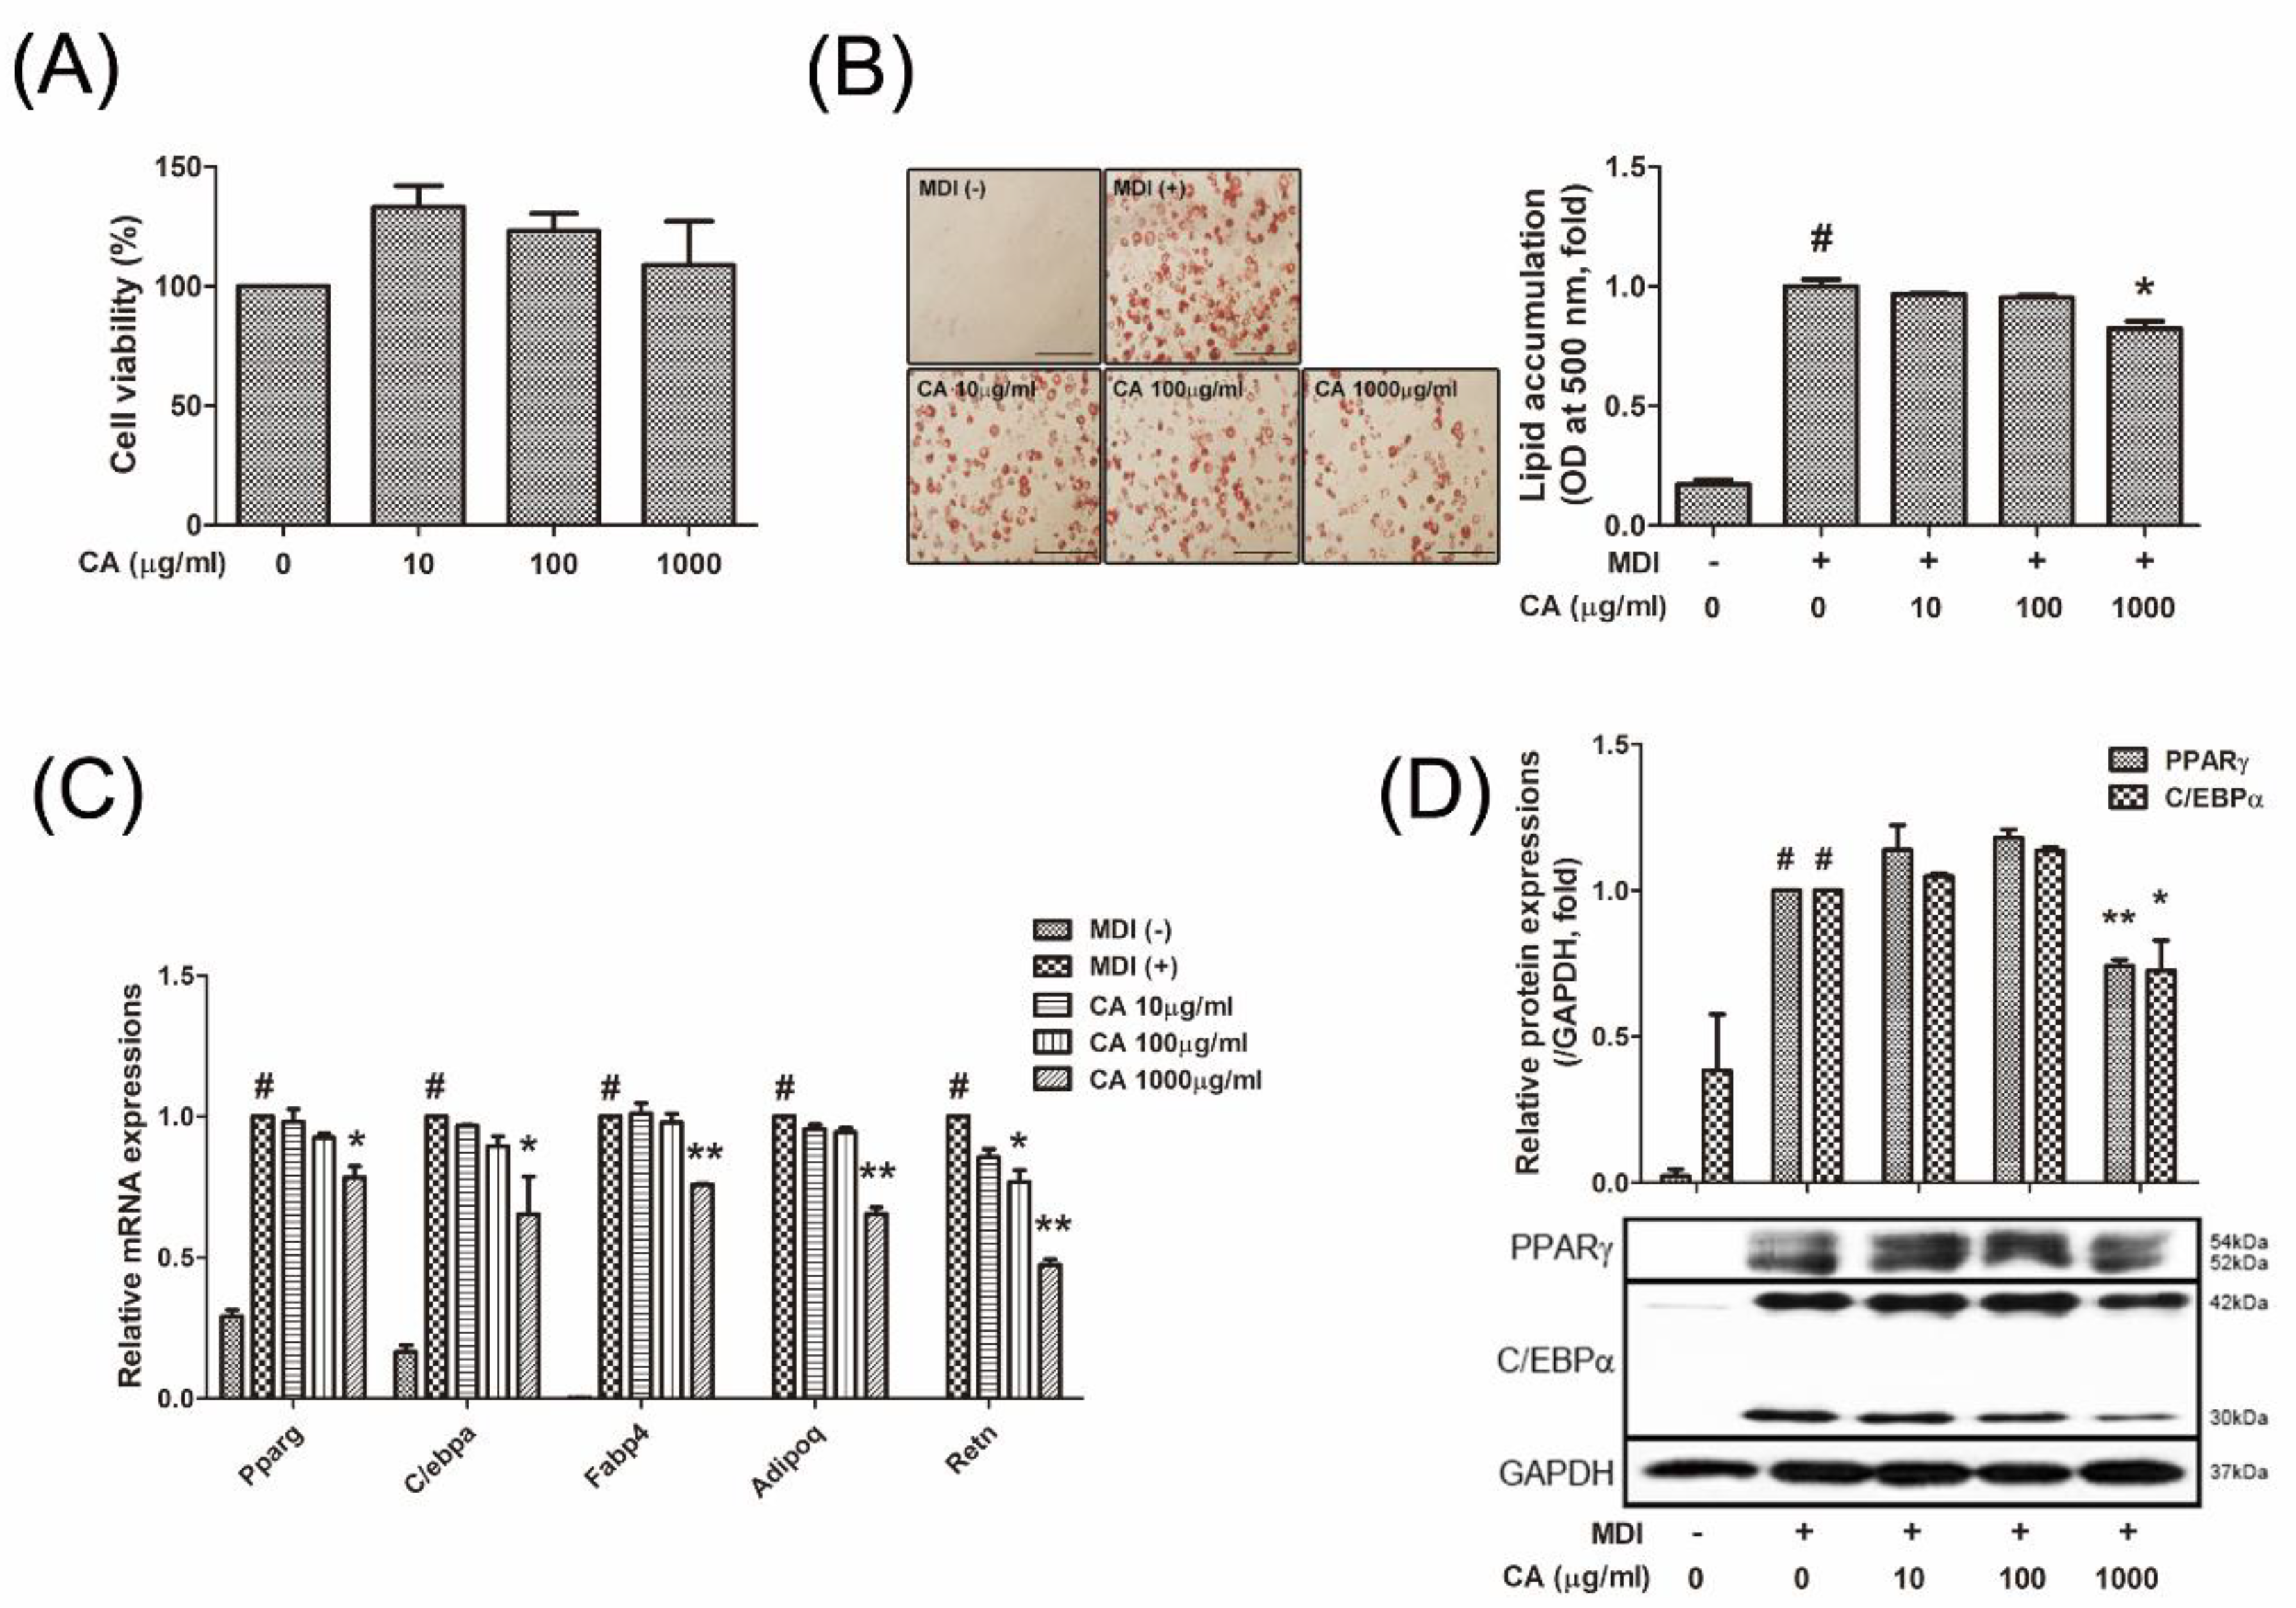
3.3. CA Decreased Lipid Accumulation by Inhibiting Adipogenesis of 3T3-L1 White Adipocytes
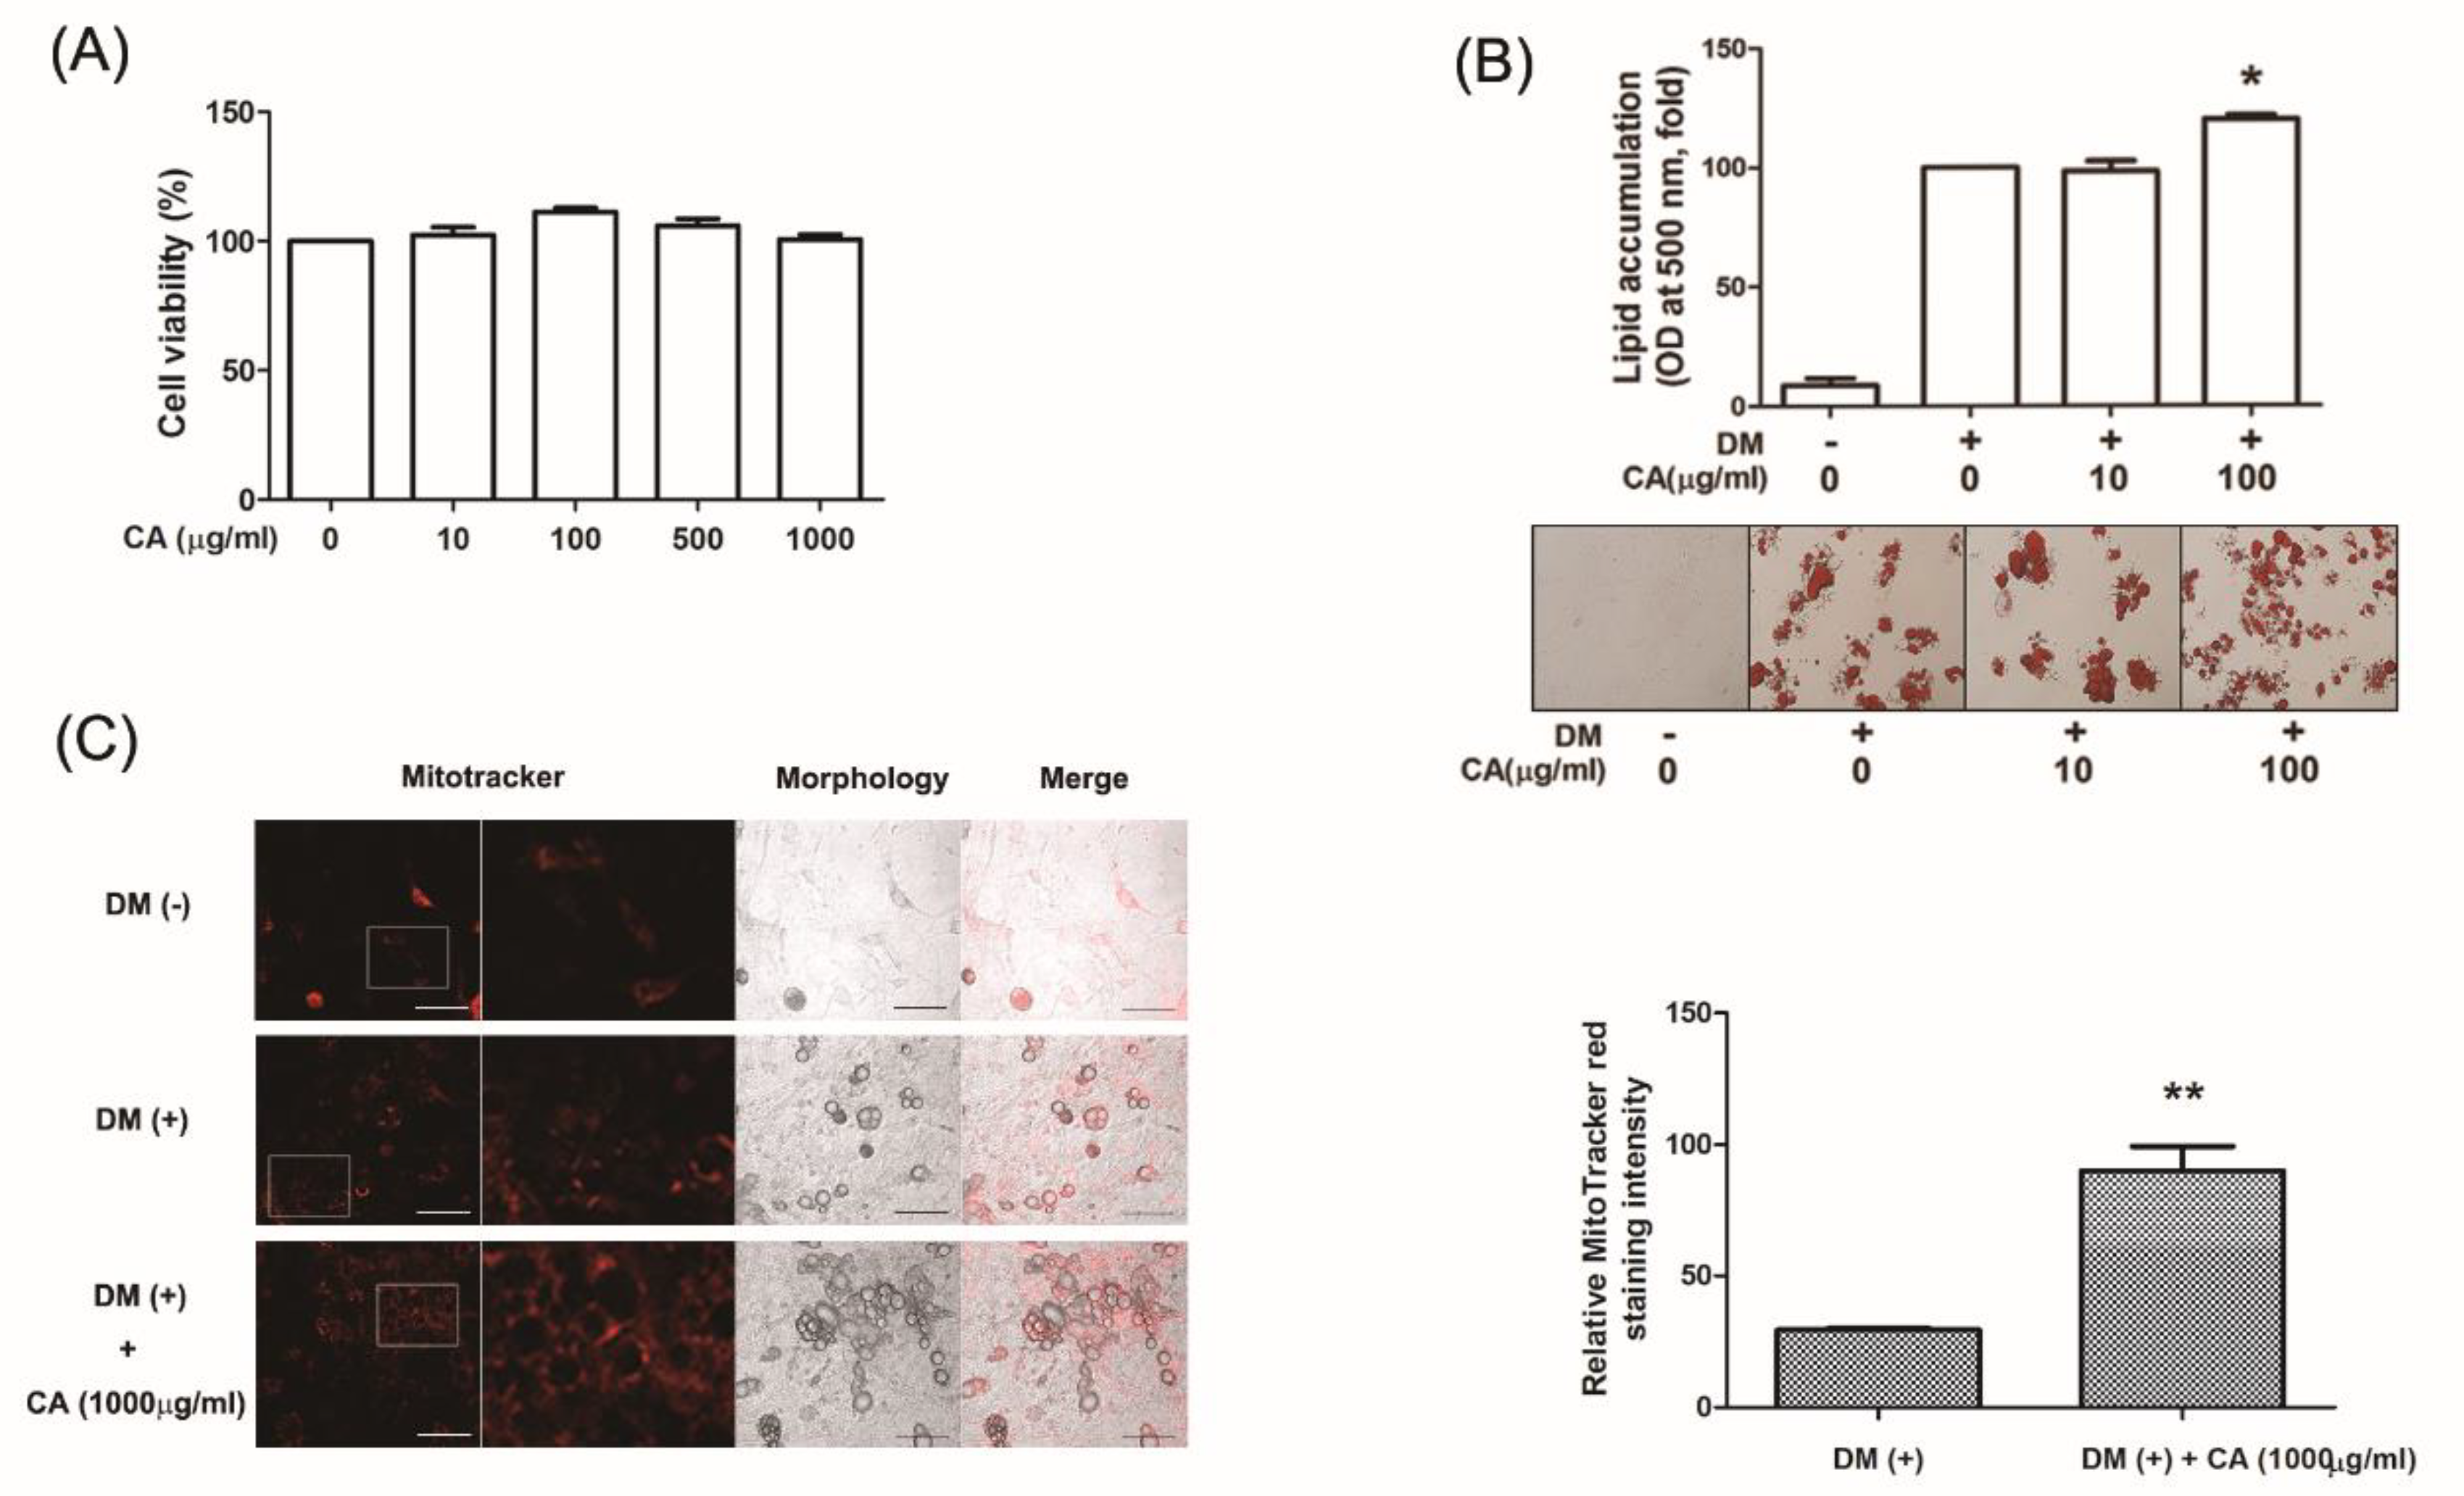
3.4. CA Increased Differentiation of Primary Cultured Brown Adipocytes
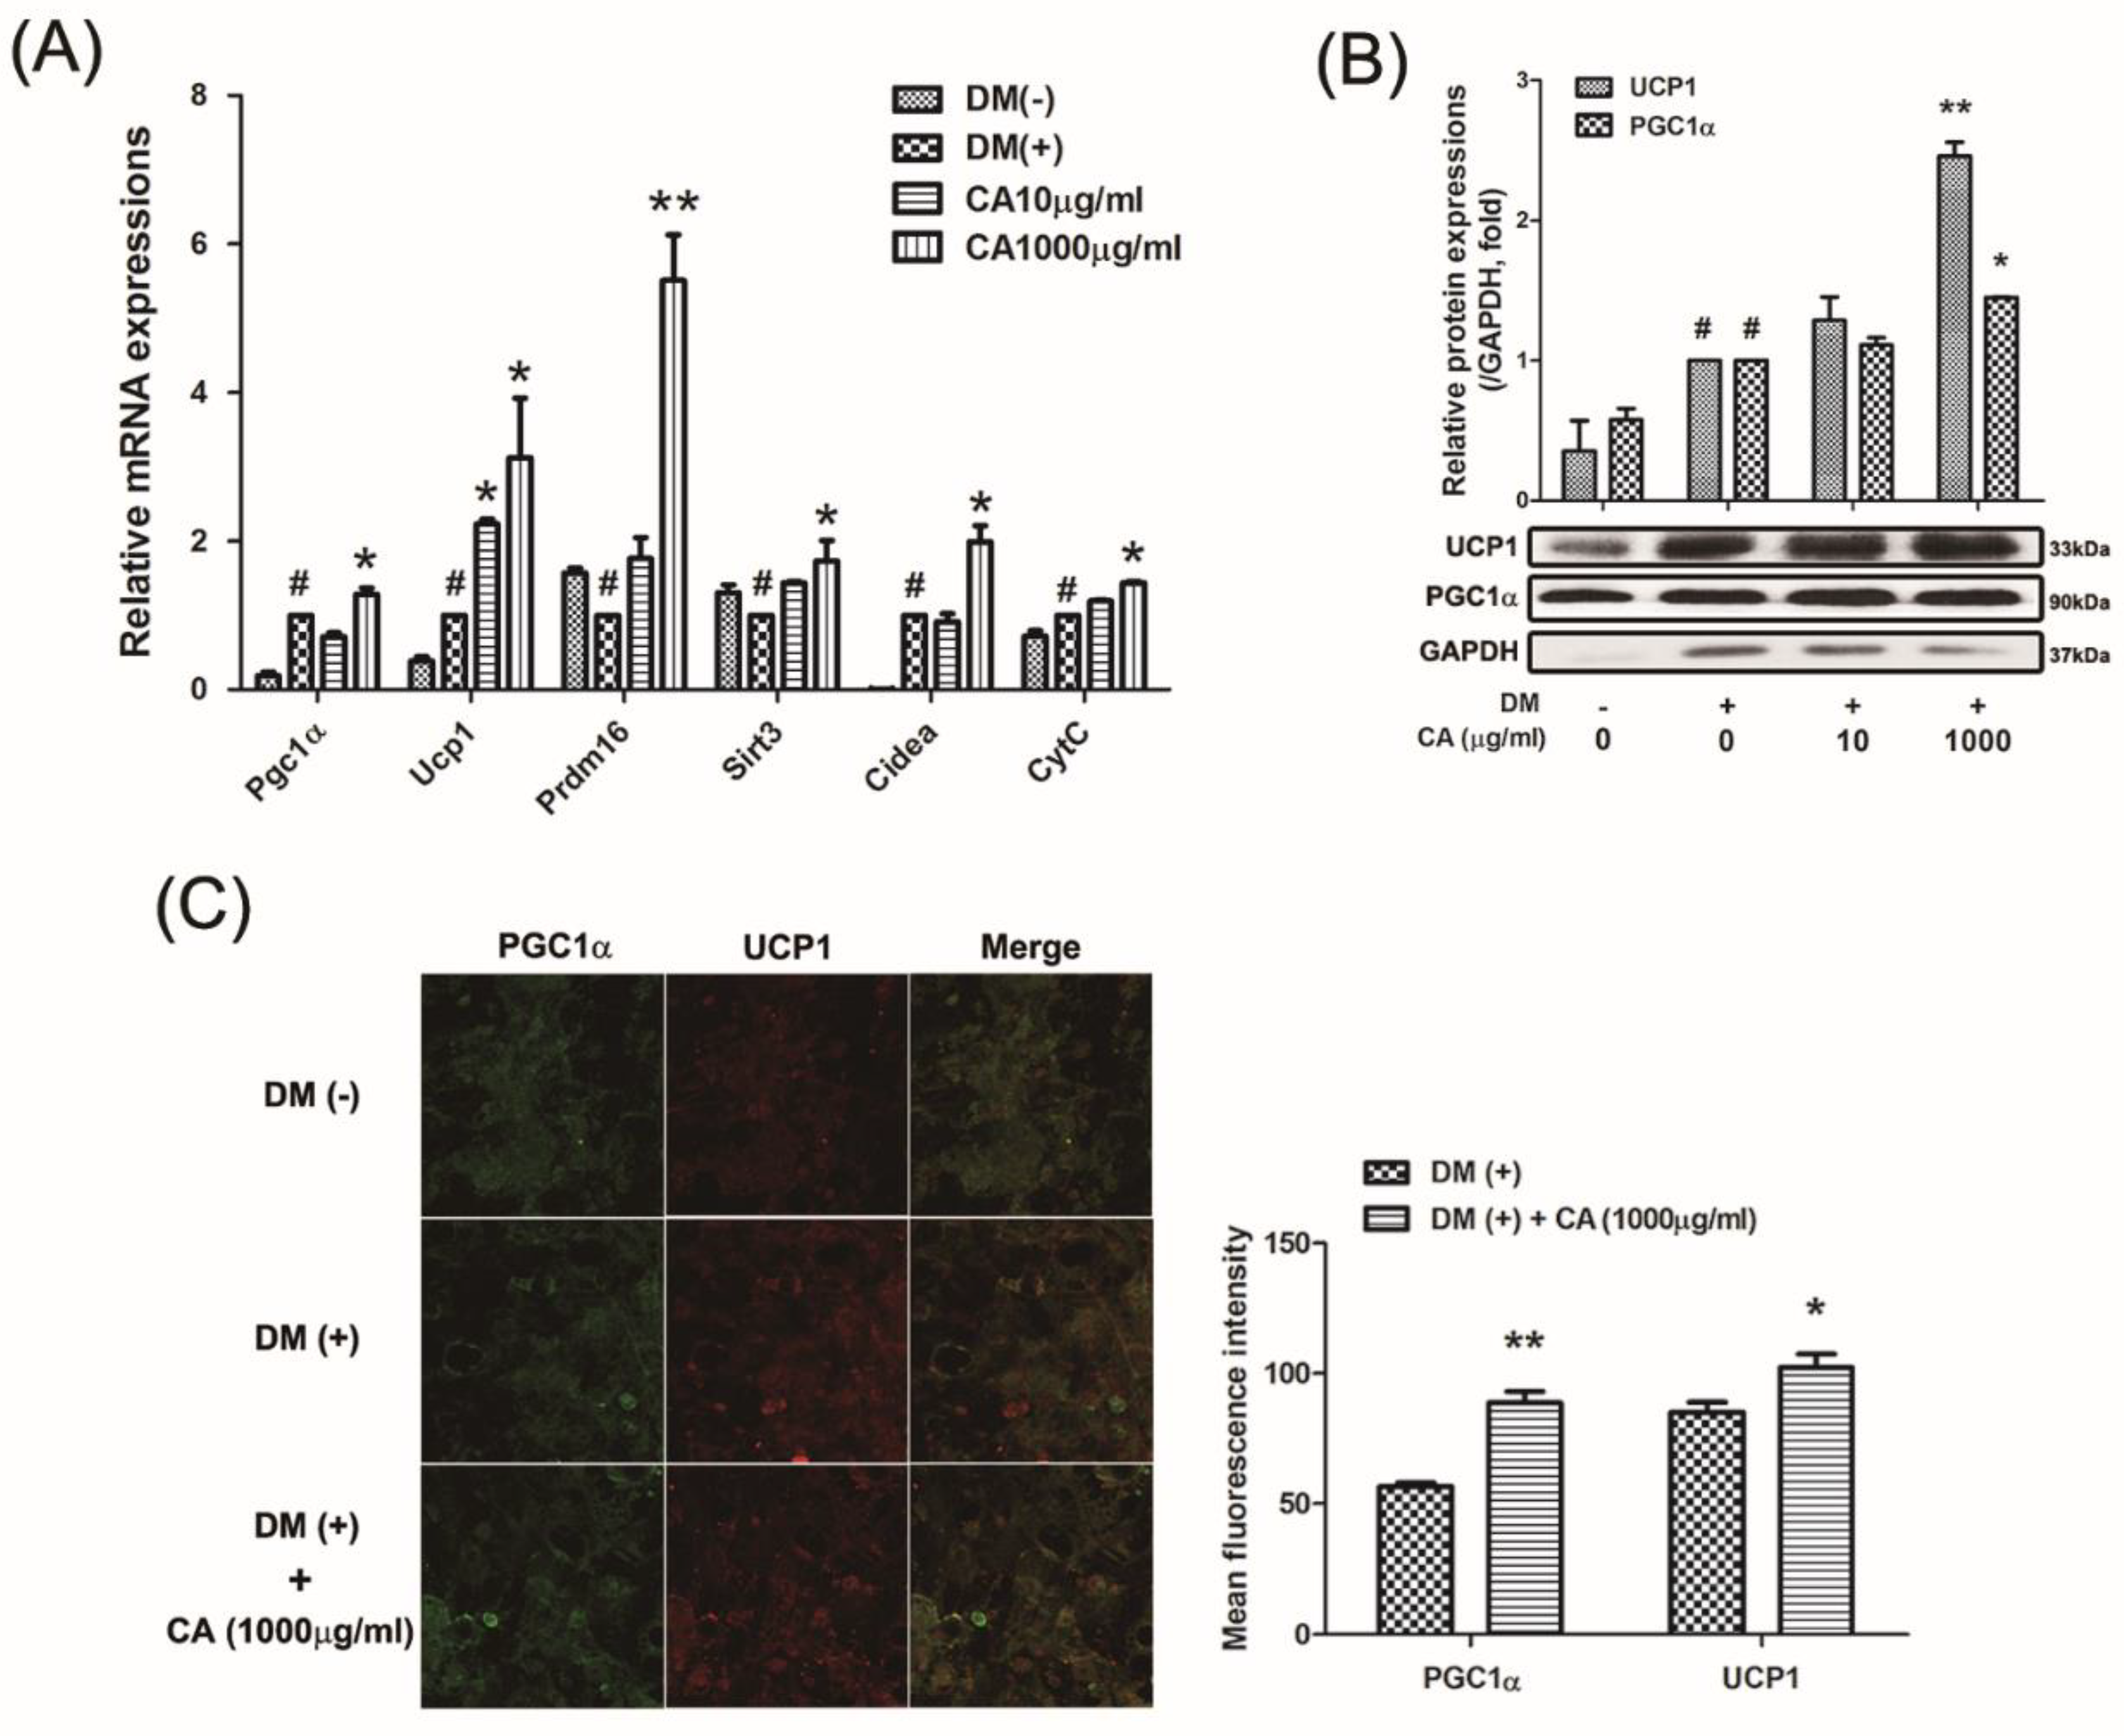
3.5. CA Induced Thermogenic Factors in Primary Cultured Brown Adipocytes
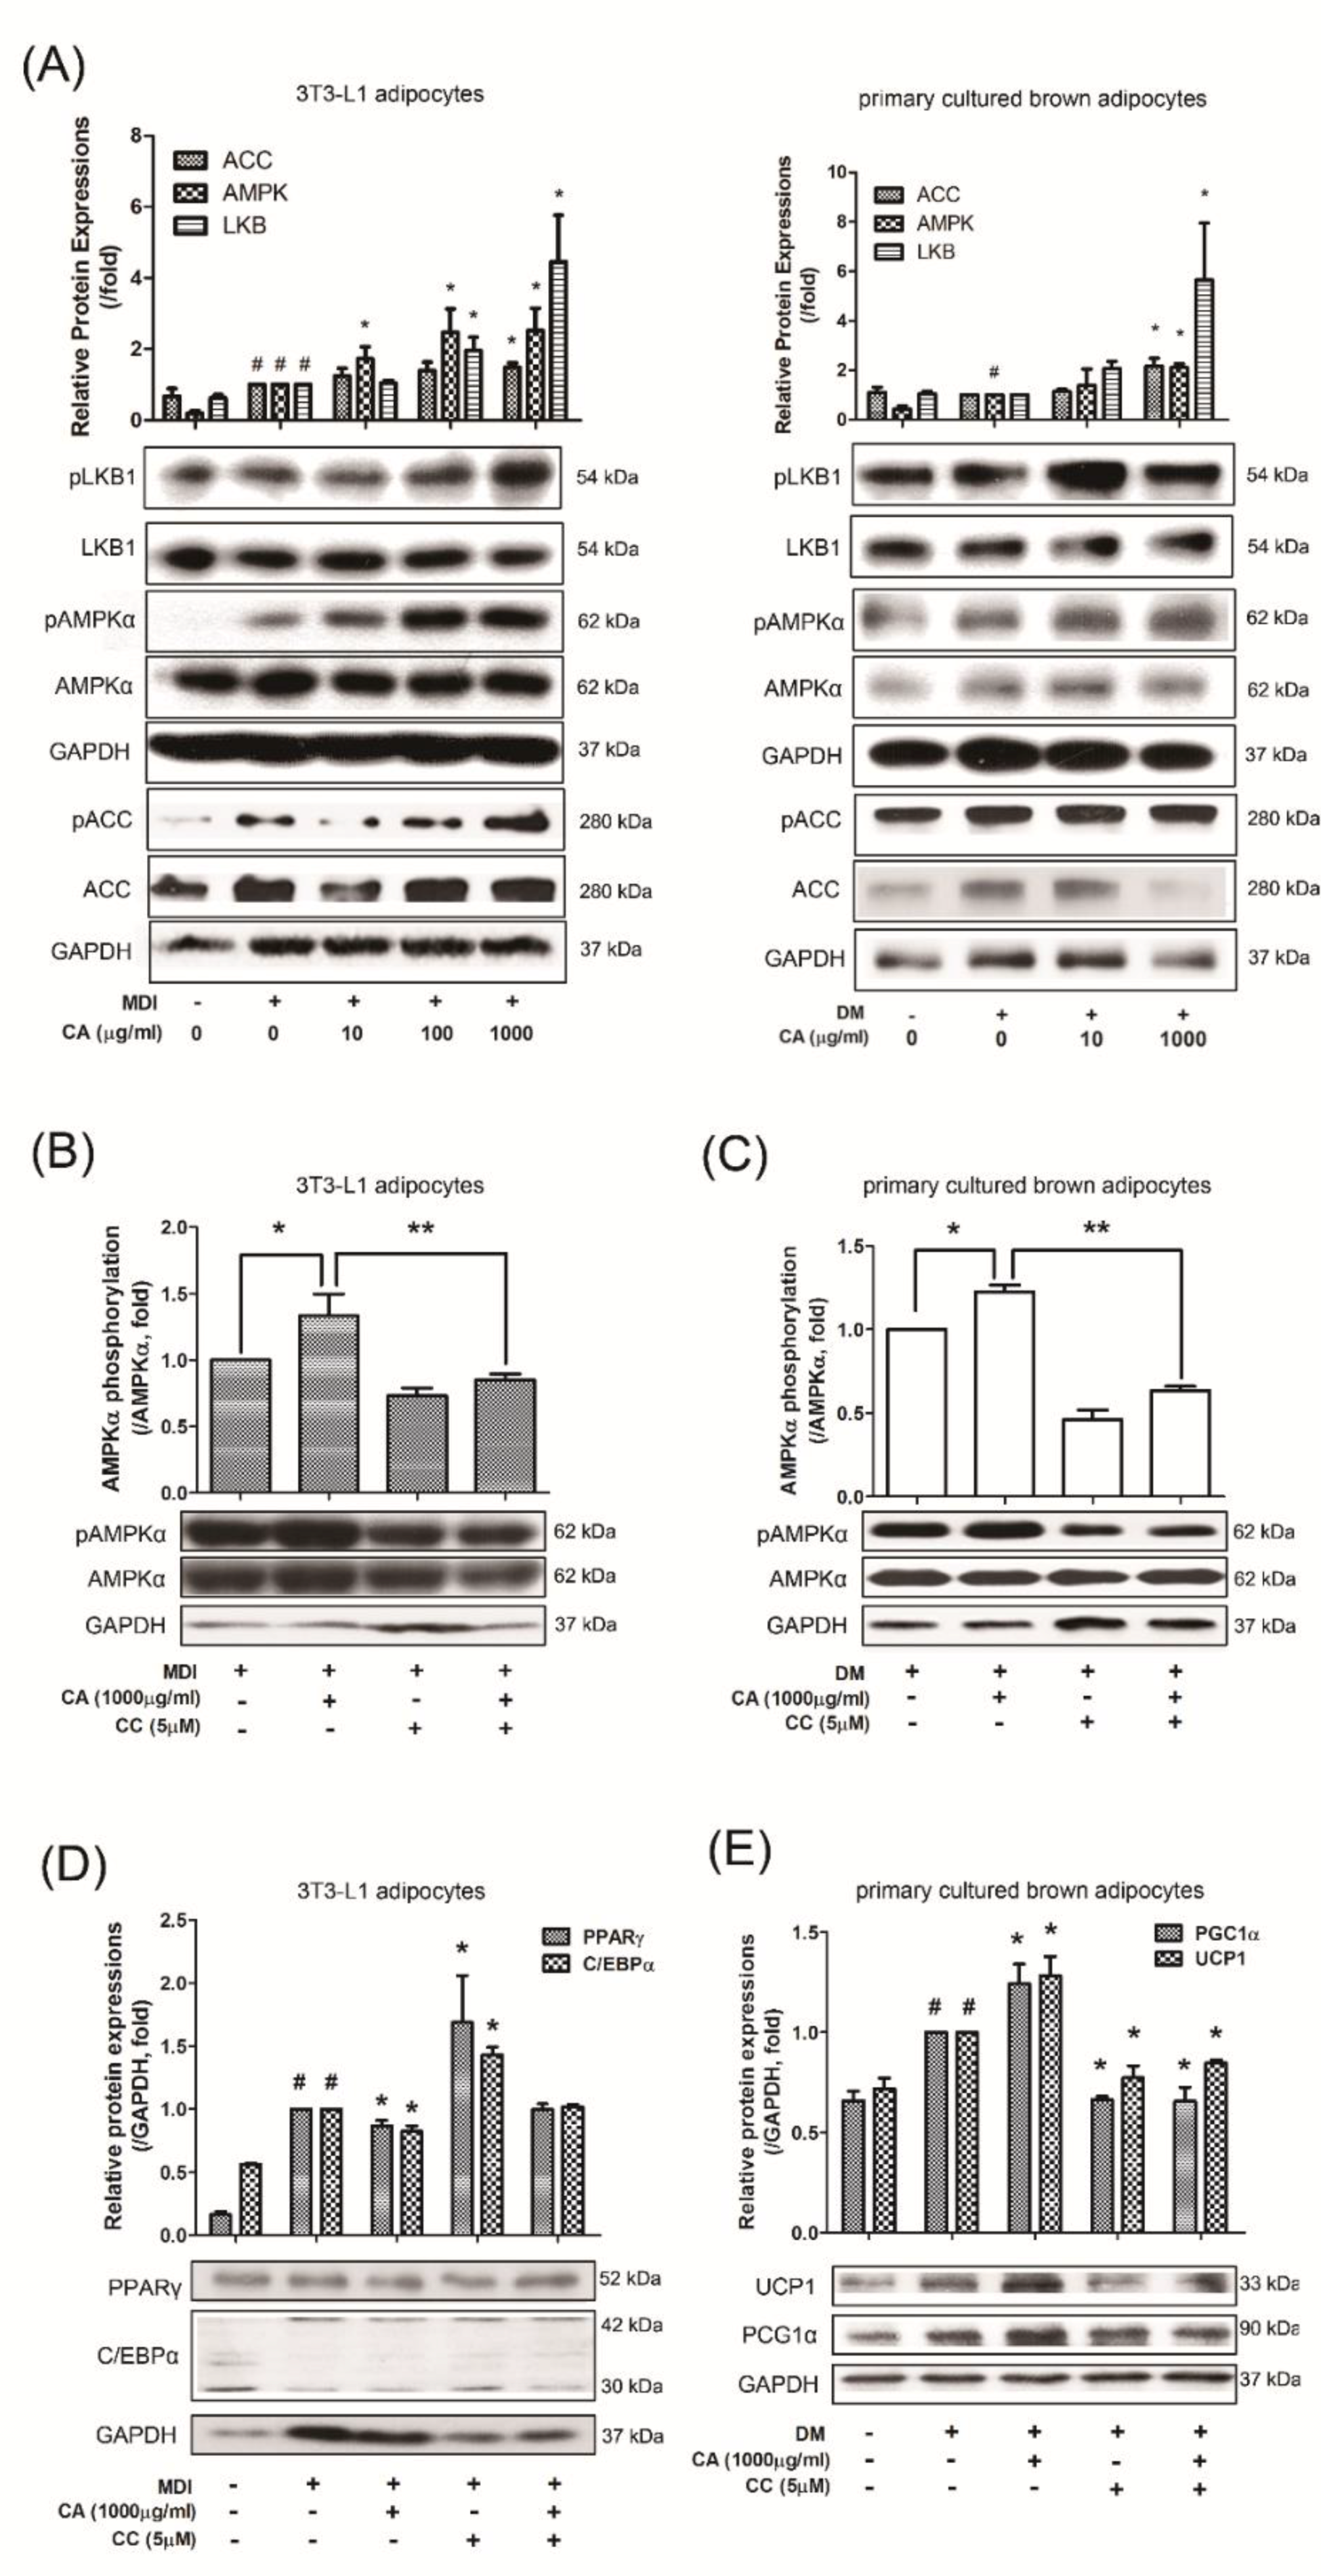
3.6. CA Regulated Adipogenesis and Thermogenesis via AMPK Activation
4. Discussion
5. Conclusions
Supplementary Materials
Author Contributions
Funding
Conflicts of Interest
References
- WHO. Fact sheets - Obesity and overweight. Available online: https://www.who.int/en/news-room/fact-sheets/detail/obesity-and-overweight (accessed on 16 July 2019).
- NCD Risk Factor Collaboration (NCD-RisC). Trends in adult body-mass index in 200 countries from 1975 to 2014: a pooled analysis of 1698 population-based measurement studies with 19.2 million participants. Lancet 2016, 387, 1377–1396. [Google Scholar] [CrossRef]
- Bell, J.A.; Kivimaki, M.; Hamer, M. Metabolically healthy obesity and risk of incident type 2 diabetes: A meta-analysis of prospective cohort studies. Obes. Rev. 2014, 15, 504–515. [Google Scholar] [CrossRef] [PubMed]
- Mongraw-Chaffin, M.L.; Peters, S.A.E.; Huxley, R.R.; Woodward, M. The sex-specific association between BMI and coronary heart disease: A systematic review and meta-analysis of 95 cohorts with 1.2 million participants. Lancet Diabetes Endocrinol. 2015, 3, 437–449. [Google Scholar] [CrossRef]
- Trestini, I.; Carbognin, L.; Bonaiuto, C.; Tortora, G.; Bria, E. The obesity paradox in cancer: clinical insights and perspectives. Eat. Weight Disord. 2018, 23, 185–193. [Google Scholar] [CrossRef] [PubMed]
- Cinti, S. Adipose Organ Development and Remodeling. Compr. Physiol. 2018, 8, 1357–1431. [Google Scholar] [CrossRef] [PubMed]
- Morrison, S.F.; Madden, C.J.; Tupone, D. Central neural regulation of brown adipose tissue thermogenesis and energy expenditure. Cell Metab. 2014, 19, 741–756. [Google Scholar] [CrossRef]
- Betz, M.J.; Enerback, S. Targeting thermogenesis in brown fat and muscle to treat obesity and metabolic disease. Nat. Rev. Endocrinol. 2018, 14, 77–87. [Google Scholar] [CrossRef]
- Lowe, C.E.; O’Rahilly, S.; Rochford, J.J. Adipogenesis at a glance. J. Cell Sci. 2011, 124, 2681–2686. [Google Scholar] [CrossRef] [Green Version]
- Lee, J.E.; Schmidt, H.; Lai, B.; Ge, K. Transcriptional and Epigenomic Regulation of Adipogenesis. Mol. Cell Biol. 2019, 39. [Google Scholar] [CrossRef] [Green Version]
- Lefterova, M.I.; Zhang, Y.; Steger, D.J.; Schupp, M.; Schug, J.; Cristancho, A.; Feng, D.; Zhuo, D.; Stoeckert, C.J., Jr.; Liu, X.S.; et al. PPARgamma and C/EBP factors orchestrate adipocyte biology via adjacent binding on a genome-wide scale. Genes Dev. 2008, 22, 2941–2952. [Google Scholar] [CrossRef]
- Madsen, M.S.; Siersbaek, R.; Boergesen, M.; Nielsen, R.; Mandrup, S. Peroxisome proliferator-activated receptor gamma and C/EBPalpha synergistically activate key metabolic adipocyte genes by assisted loading. Mol. Cell Biol. 2014, 34, 939–954. [Google Scholar] [CrossRef] [PubMed]
- Crowley, V.E.; Yeo, G.S.; O’Rahilly, S. Obesity therapy: Altering the energy intake-and-expenditure balance sheet. Nat. Rev. Drug Discov. 2002, 1, 276–286. [Google Scholar] [CrossRef] [PubMed]
- Kolonin, M.G.; Saha, P.K.; Chan, L.; Pasqualini, R.; Arap, W. Reversal of obesity by targeted ablation of adipose tissue. Nat. Med. 2004, 10, 625–632. [Google Scholar] [CrossRef] [PubMed]
- Cannon, B.; Nedergaard, J. Brown adipose tissue: Function and physiological significance. Physiol. Rev. 2004, 84, 277–359. [Google Scholar] [CrossRef] [PubMed]
- Nedergaard, J.; Bengtsson, T.; Cannon, B. Three years with adult human brown adipose tissue. Ann. N. Y. Acad. Sci. 2010, 1212, E20–E36. [Google Scholar] [CrossRef] [PubMed]
- Villarroya, F.; Vidal-Puig, A. Beyond the sympathetic tone: the new brown fat activators. Cell Metab. 2013, 17, 638–643. [Google Scholar] [CrossRef] [PubMed]
- Lim, S.W.; Lee, D.R.; Choi, B.K.; Kim, H.S.; Yang, S.H.; Suh, J.W.; Kim, K.S. Protective effects of a polymethoxy flavonoids-rich Citrus aurantium peel extract on liver fibrosis induced by bile duct ligation in mice. Asian Pac. J. Trop. Med. 2016, 9, 1158–1164. [Google Scholar] [CrossRef] [Green Version]
- Nair, S.A.; Sr, R.K.; Nair, A.S.; Baby, S. Citrus peels prevent cancer. Phytomedicine 2018, 50, 231–237. [Google Scholar] [CrossRef]
- Shammugasamy, B.; Valtchev, P.; Dong, Q.; Dehghani, F. Effect of citrus peel extracts on the cellular quiescence of prostate cancer cells. Food Funct. 2019, 10, 3727–3737. [Google Scholar] [CrossRef]
- Akhlaghi, M.; Shabanian, G.; Rafieian-Kopaei, M.; Parvin, N.; Saadat, M.; Akhlaghi, M. Citrus aurantium blossom and preoperative anxiety. Rev. Bras. Anestesiol. 2011, 61, 702–712. [Google Scholar] [CrossRef]
- Costa, C.A.; Cury, T.C.; Cassettari, B.O.; Takahira, R.K.; Florio, J.C.; Costa, M. Citrus aurantium L. essential oil exhibits anxiolytic-like activity mediated by 5-HT(1A)-receptors and reduces cholesterol after repeated oral treatment. BMC Complement. Altern. Med. 2013, 13, 42. [Google Scholar] [CrossRef] [PubMed]
- Ghasemi, K.; Ghasemi, Y.; Ebrahimzadeh, M.A. Antioxidant activity, phenol and flavonoid contents of 13 citrus species peels and tissues. Pak. J. Pharm. Sci. 2009, 22, 277–281. [Google Scholar] [PubMed]
- Wang, Q.H.; Shu, Z.P.; Xu, B.Q.; Xing, N.; Jiao, W.J.; Yang, B.Y.; Kuang, H.X. Structural characterization and antioxidant activities of polysaccharides from Citrus aurantium L. Int. J. Biol. Macromol. 2014, 67, 112–123. [Google Scholar] [CrossRef] [PubMed]
- Alarcon-Aguilara, F.J.; Roman-Ramos, R.; Perez-Gutierrez, S.; Aguilar-Contreras, A.; Contreras-Weber, C.C.; Flores-Saenz, J.L. Study of the anti-hyperglycemic effect of plants used as antidiabetics. J. Ethnopharmacol. 1998, 61, 101–110. [Google Scholar] [CrossRef]
- Haaz, S.; Fontaine, K.R.; Cutter, G.; Limdi, N.; Perumean-Chaney, S.; Allison, D.B. Citrus aurantium and synephrine alkaloids in the treatment of overweight and obesity: An update. Obes. Rev. 2006, 7, 79–88. [Google Scholar] [CrossRef] [PubMed]
- Campbell, J.I.; Mortensen, A.; Molgaard, P. Tissue lipid lowering-effect of a traditional Nigerian anti-diabetic infusion of Rauwolfia vomitoria foilage and Citrus aurantium fruit. J. Ethnopharmacol. 2006, 104, 379–386. [Google Scholar] [CrossRef] [PubMed]
- Raciti, G.A.; Fiory, F.; Campitelli, M.; Desiderio, A.; Spinelli, R.; Longo, M.; Nigro, C.; Pepe, G.; Sommella, E.; Campiglia, P.; et al. Citrus aurantium L. dry extracts promote C/ebpbeta expression and improve adipocyte differentiation in 3T3-L1 cells. PLoS ONE 2018, 13, e0193704. [Google Scholar] [CrossRef]
- Kim, H.L.; Park, J.; Park, H.; Jung, Y.; Youn, D.H.; Kang, J.; Jeong, M.Y.; Um, J.Y. Platycodon grandiflorum A. De Candolle Ethanolic Extract Inhibits Adipogenic Regulators in 3T3-L1 Cells and Induces Mitochondrial Biogenesis in Primary Brown Preadipocytes. J. Agric. Food Chem. 2015, 63, 7721–7730. [Google Scholar] [CrossRef] [PubMed]
- Kim, H.L.; Park, J.; Jung, Y.; Ahn, K.S.; Um, J.Y. Platycodin D, a novel activator of AMP-activated protein kinase, attenuates obesity in db/db mice via regulation of adipogenesis and thermogenesis. Phytomedicine 2019, 52, 254–263. [Google Scholar] [CrossRef]
- Kwak, H.J.; Jeong, M.Y.; Um, J.Y.; Park, J. beta -Lapachone Regulates Obesity through Modulating Thermogenesis in Brown Adipose Tissue and Adipocytes: Role of AMPK Signaling Pathway. Am. J. Chin. Med. 2019, 47, 803–822. [Google Scholar] [CrossRef]
- Han, H.Y.; Lee, S.K.; Choi, B.K.; Lee, D.R.; Lee, H.J.; Kim, T.W. Preventive Effect of Citrus aurantium Peel Extract on High-Fat Diet-Induced Non-alcoholic Fatty Liver in Mice. Biol. Pharm. Bull. 2019, 42, 255–260. [Google Scholar] [CrossRef] [PubMed]
- Jung, Y.; Park, J.; Kim, H.L.; Sim, J.E.; Youn, D.H.; Kang, J.; Lim, S.; Jeong, M.Y.; Yang, W.M.; Lee, S.G.; et al. Vanillic acid attenuates obesity via activation of the AMPK pathway and thermogenic factors in vivo and in vitro. Faseb. J. 2018, 32, 1388–1402. [Google Scholar] [CrossRef] [PubMed]
- Adams, A.E.; Hanrahan, O.; Nolan, D.N.; Voorheis, H.P.; Fallon, P.; Porter, R.K. Images of mitochondrial UCP 1 in mouse thymocytes using confocal microscopy. Biochim. Biophys. Acta 2008, 1777, 115–117. [Google Scholar] [CrossRef] [PubMed] [Green Version]
- Chouchani, E.T.; Kazak, L.; Spiegelman, B.M. New Advances in Adaptive Thermogenesis: UCP1 and Beyond. Cell Metab. 2019, 29, 27–37. [Google Scholar] [CrossRef] [PubMed]
- Pirkmajer, S.; Kulkarni, S.S.; Tom, R.Z.; Ross, F.A.; Hawley, S.A.; Hardie, D.G.; Zierath, J.R.; Chibalin, A.V. Methotrexate promotes glucose uptake and lipid oxidation in skeletal muscle via AMPK activation. Diabetes 2015, 64, 360–369. [Google Scholar] [CrossRef] [PubMed]
- Habinowski, S.A.; Witters, L.A. The effects of AICAR on adipocyte differentiation of 3T3-L1 cells. Biochem. Biophys. Res. Commun. 2001, 286, 852–856. [Google Scholar] [CrossRef]
- Jeon, S.M. Regulation and function of AMPK in physiology and diseases. Exp. Mol. Med. 2016, 48, e245. [Google Scholar] [CrossRef] [PubMed]
- Tam, C.S.; Lecoultre, V.; Ravussin, E. Brown adipose tissue: mechanisms and potential therapeutic targets. Circulation 2012, 125, 2782–2791. [Google Scholar] [CrossRef] [PubMed]
- Zhang, Y.; Liu, J.; Yao, J.; Ji, G.; Qian, L.; Wang, J.; Zhang, G.; Tian, J.; Nie, Y.; Zhang, Y.E.; et al. Obesity: Pathophysiology and intervention. Nutrients 2014, 6, 5153–5183. [Google Scholar] [CrossRef]
- Saito, M.; Okamatsu-Ogura, Y.; Matsushita, M.; Watanabe, K.; Yoneshiro, T.; Nio-Kobayashi, J.; Iwanaga, T.; Miyagawa, M.; Kameya, T.; Nakada, K.; et al. High incidence of metabolically active brown adipose tissue in healthy adult humans: Effects of cold exposure and adiposity. Diabetes 2009, 58, 1526–1531. [Google Scholar] [CrossRef]
- Pilitsi, E.; Farr, O.M.; Polyzos, S.A.; Perakakis, N.; Nolen-Doerr, E.; Papathanasiou, A.E.; Mantzoros, C.S. Pharmacotherapy of obesity: Available medications and drugs under investigation. Metabolism 2019, 92, 170–192. [Google Scholar] [CrossRef] [PubMed]
- Velusami, C.C.; Agarwal, A.; Mookambeswaran, V. Effect of Nelumbo nucifera Petal Extracts on Lipase, Adipogenesis, Adipolysis, and Central Receptors of Obesity. Evid. Based Complement. Alternat. Med. 2013, 2013, 145925. [Google Scholar] [CrossRef] [PubMed]
- Frontini, A.; Cinti, S. Distribution and development of brown adipocytes in the murine and human adipose organ. Cell Metab. 2010, 11, 253–256. [Google Scholar] [CrossRef] [PubMed]
- Seale, P.; Kajimura, S.; Yang, W.; Chin, S.; Rohas, L.M.; Uldry, M.; Tavernier, G.; Langin, D.; Spiegelman, B.M. Transcriptional control of brown fat determination by PRDM16. Cell Metab. 2007, 6, 38–54. [Google Scholar] [CrossRef] [PubMed]
- Seale, P.; Conroe, H.M.; Estall, J.; Kajimura, S.; Frontini, A.; Ishibashi, J.; Cohen, P.; Cinti, S.; Spiegelman, B.M. Prdm16 determines the thermogenic program of subcutaneous white adipose tissue in mice. J. Clin. Investig. 2011, 121, 96–105. [Google Scholar] [CrossRef] [PubMed] [Green Version]
- Lombard, D.B.; Alt, F.W.; Cheng, H.L.; Bunkenborg, J.; Streeper, R.S.; Mostoslavsky, R.; Kim, J.; Yancopoulos, G.; Valenzuela, D.; Murphy, A.; et al. Mammalian Sir2 homolog SIRT3 regulates global mitochondrial lysine acetylation. Mol. Cell Biol. 2007, 27, 8807–8814. [Google Scholar] [CrossRef] [PubMed]
- Kong, X.; Wang, R.; Xue, Y.; Liu, X.; Zhang, H.; Chen, Y.; Fang, F.; Chang, Y. Sirtuin 3, a new target of PGC-1alpha, plays an important role in the suppression of ROS and mitochondrial biogenesis. PLoS ONE 2010, 5, e11707. [Google Scholar] [CrossRef] [PubMed]
- Sebaa, R.; Johnson, J.; Pileggi, C.; Norgren, M.; Xuan, J.; Sai, Y.; Tong, Q.; Krystkowiak, I.; Bondy-Chorney, E.; Davey, N.E.; et al. SIRT3 controls brown fat thermogenesis by deacetylation regulation of pathways upstream of UCP1. Mol. Metab. 2019, 25, 35–49. [Google Scholar] [CrossRef] [PubMed]
- Wang, S.; Pan, M.H.; Hung, W.L.; Tung, Y.C.; Ho, C.T. From white to beige adipocytes: therapeutic potential of dietary molecules against obesity and their molecular mechanisms. Food Funct. 2019, 10, 1263–1279. [Google Scholar] [CrossRef] [PubMed]
- Shin, H.; Ma, Y.; Chanturiya, T.; Cao, Q.; Wang, Y.; Kadegowda, A.K.G.; Jackson, R.; Rumore, D.; Xue, B.; Shi, H.; et al. Lipolysis in Brown Adipocytes Is Not Essential for Cold-Induced Thermogenesis in Mice. Cell Metab. 2017, 26, 764–777. [Google Scholar] [CrossRef] [PubMed]
- Hardie, D.G. AMPK--sensing energy while talking to other signaling pathways. Cell Metab. 2014, 20, 939–952. [Google Scholar] [CrossRef] [PubMed]
- Hardie, D.G.; Lin, S.C. AMP-activated protein kinase - not just an energy sensor. F1000Res 2017, 6, 1724. [Google Scholar] [CrossRef] [PubMed]
- Hardie, D.G. Keeping the home fires burning: AMP-activated protein kinase. J. R. Soc. Interface 2018, 15. [Google Scholar] [CrossRef] [PubMed]
- Dagon, Y.; Avraham, Y.; Berry, E.M. AMPK activation regulates apoptosis, adipogenesis, and lipolysis by eIF2alpha in adipocytes. Biochem. Biophys. Res. Commun. 2006, 340, 43–47. [Google Scholar] [CrossRef] [PubMed]
- Mottillo, E.P.; Desjardins, E.M.; Crane, J.D.; Smith, B.K.; Green, A.E.; Ducommun, S.; Henriksen, T.I.; Rebalka, I.A.; Razi, A.; Sakamoto, K.; et al. Lack of Adipocyte AMPK Exacerbates Insulin Resistance and Hepatic Steatosis through Brown and Beige Adipose Tissue Function. Cell Metab. 2016, 24, 118–129. [Google Scholar] [CrossRef] [PubMed] [Green Version]
- Zhao, J.; Yang, Q.; Zhang, L.; Liang, X.; Sun, X.; Wang, B.; Chen, Y.; Zhu, M.; Du, M. AMPKα1 deficiency suppresses brown adipogenesis in favor of fibrogenesis during brown adipose tissue development. Biochem. Biophys. Res. Commun. 2017, 491, 508–514. [Google Scholar] [CrossRef] [PubMed]
- Hutchinson, D.S.; Chernogubova, E.; Dallner, O.S.; Cannon, B.; Bengtsson, T. Beta-adrenoceptors, but not alpha-adrenoceptors, stimulate AMP-activated protein kinase in brown adipocytes independently of uncoupling protein-1. Diabetologia 2005, 48, 2386–2395. [Google Scholar] [CrossRef] [PubMed]
- Beiroa, D.; Imbernon, M.; Gallego, R.; Senra, A.; Herranz, D.; Villarroya, F.; Serrano, M.; Fernø, J.; Salvador, J.; Escalada, J.; et al. GLP-1 agonism stimulates brown adipose tissue thermogenesis and browning through hypothalamic AMPK. Diabetes 2014, 63, 3346–3358. [Google Scholar] [CrossRef]
- Kim, G.S.; Park, H.J.; Woo, J.H.; Kim, M.K.; Koh, P.O.; Min, W.; Ko, Y.G.; Kim, C.H.; Won, C.K.; Cho, J.H. Citrus aurantium flavonoids inhibit adipogenesis through the Akt signaling pathway in 3T3-L1 cells. BMC Complement. Altern. Med. 2012, 12, 31. [Google Scholar] [CrossRef]
- Pu, P.; Gao, D.M.; Mohamed, S.; Chen, J.; Zhang, J.; Zhou, X.Y.; Zhou, N.J.; Xie, J.; Jiang, H. Naringin ameliorates metabolic syndrome by activating AMP-activated protein kinase in mice fed a high-fat diet. Arch. Biochem. Biophys. 2012, 518, 61–70. [Google Scholar] [CrossRef]
- Sui, G.G.; Xiao, H.B.; Lu, X.Y.; Sun, Z.L. Naringin Activates AMPK Resulting in Altered Expression of SREBPs, PCSK9, and LDLR To Reduce Body Weight in Obese C57BL/6J Mice. J. Agric. Food Chem. 2018, 66, 8983–8990. [Google Scholar] [CrossRef] [PubMed]
- Wu, H.; Liu, Y.; Chen, X.; Zhu, D.; Ma, J.; Yan, Y.; Si, M.; Li, X.; Sun, C.; Yang, B.; et al. Neohesperidin Exerts Lipid-Regulating Effects in vitro and in vivo via Fibroblast Growth Factor 21 and AMP-Activated Protein Kinase/Sirtuin Type 1/Peroxisome Proliferator-Activated Receptor Gamma Coactivator 1alpha Signaling Axis. Pharmacology 2017, 100, 115–126. [Google Scholar] [CrossRef] [PubMed]
- Jung, U.J.; Lee, M.K.; Park, Y.B.; Kang, M.A.; Choi, M.S. Effect of citrus flavonoids on lipid metabolism and glucose-regulating enzyme mRNA levels in type-2 diabetic mice. Int. J. Biochem. Cell Biol. 2006, 38, 1134–1145. [Google Scholar] [CrossRef] [PubMed]
- Morikawa, K.; Nonaka, M.; Mochizuki, H.; Handa, K.; Hanada, H.; Hirota, K. Naringenin and hesperetin induce growth arrest, apoptosis, and cytoplasmic fat deposit in human preadipocytes. J. Agric. Food Chem. 2008, 56, 11030–11037. [Google Scholar] [CrossRef] [PubMed]
- Alam, M.A.; Kauter, K.; Brown, L. Naringin improves diet-induced cardiovascular dysfunction and obesity in high carbohydrate, high fat diet-fed rats. Nutrients 2013, 5, 637–650. [Google Scholar] [CrossRef] [PubMed]
- Wang, D.; Yan, J.; Chen, J.; Wu, W.; Zhu, X.; Wang, Y. Naringin Improves Neuronal Insulin Signaling, Brain Mitochondrial Function, and Cognitive Function in High-Fat Diet-Induced Obese Mice. Cell Mol. Neurobiol. 2015, 35, 1061–1071. [Google Scholar] [CrossRef] [PubMed]
- Jia, S.; Hu, Y.; Zhang, W.; Zhao, X.; Chen, Y.; Sun, C.; Li, X.; Chen, K. Hypoglycemic and hypolipidemic effects of neohesperidin derived from Citrus aurantium L. in diabetic KK-A(y) mice. Food Funct. 2015, 6, 878–886. [Google Scholar] [CrossRef] [PubMed]
- Han, G.E.; Kang, H.T.; Chung, S.; Lim, C.; Linton, J.A.; Lee, J.H.; Kim, W.; Kim, S.H.; Lee, J.H. Novel Neohesperidin Dihydrochalcone Analogue Inhibits Adipogenic Differentiation of Human Adipose-Derived Stem Cells through the Nrf2 Pathway. Int. J. Mol. Sci. 2018, 19. [Google Scholar] [CrossRef] [PubMed]


© 2019 by the authors. Licensee MDPI, Basel, Switzerland. This article is an open access article distributed under the terms and conditions of the Creative Commons Attribution (CC BY) license (http://creativecommons.org/licenses/by/4.0/).
Share and Cite
Park, J.; Kim, H.-L.; Jung, Y.; Ahn, K.S.; Kwak, H.J.; Um, J.-Y. Bitter Orange (Citrus aurantium Linné) Improves Obesity by Regulating Adipogenesis and Thermogenesis through AMPK Activation. Nutrients 2019, 11, 1988. https://doi.org/10.3390/nu11091988
Park J, Kim H-L, Jung Y, Ahn KS, Kwak HJ, Um J-Y. Bitter Orange (Citrus aurantium Linné) Improves Obesity by Regulating Adipogenesis and Thermogenesis through AMPK Activation. Nutrients. 2019; 11(9):1988. https://doi.org/10.3390/nu11091988
Chicago/Turabian StylePark, Jinbong, Hye-Lin Kim, Yunu Jung, Kwang Seok Ahn, Hyun Jeong Kwak, and Jae-Young Um. 2019. "Bitter Orange (Citrus aurantium Linné) Improves Obesity by Regulating Adipogenesis and Thermogenesis through AMPK Activation" Nutrients 11, no. 9: 1988. https://doi.org/10.3390/nu11091988