Article

Impact of Nutritional Status on Gastroenteropancreatic Neuroendocrine Tumors (GEP-NET) Aggressiveness

by
Luigi Barrea
1,*,†,
Barbara Altieri
1,2,†,
Giovanna Muscogiuri
1,
Daniela Laudisio
1,
Giuseppe Annunziata
3,
Annamaria Colao
1,
Antongiulio Faggiano
1 and
Silvia Savastano
1
1
Dipartimento di Medicina Clinica e Chirurgia, Unit of Endocrinology, Federico II University Medical School of Naples, Via Sergio Pansini, 5, 80131 Naples, Italy
2
Division of Endocrinology and Diabetes, Department of Internal Medicine I, University Hospital, University of Wuerzburg, 97080 Wuerzburg, Germany
3
Department of Pharmacy, University of Naples “Federico II”, Italy; Via Domenico Montesano, 49, 80131 Naples, Italy
*
Author to whom correspondence should be addressed.
These authors contributed equally to this work.
Nutrients 2018, 10(12), 1854; https://doi.org/10.3390/nu10121854
Submission received: 29 October 2018 / Revised: 14 November 2018 / Accepted: 22 November 2018 / Published: 1 December 2018

Abstract

:
Neuroendocrine tumors (NETs) are rare neoplasms mostly originating from the gastroenteropancreatic tract (GEP-NETs). Data regarding nutritional status in GEP-NET patients are limited. The aim of the study was to investigate the nutritional status and adherence to the Mediterranean Diet (MD) in GEP-NET patients and to correlate them with tumor aggressiveness. A cross-sectional case-control observational study was conducted enrolling 83 patients with well-differentiated G1/G2 GEP-NETs after resection, as well as 83 healthy subjects, age, sex and body mass index-matched. Nutritional status was assessed by evaluating with Bioelectrical Impedance analysis and its phase angle (PhA), adherence to the MD according to PREDIMED score, dietary assessment, anthropometric parameters, and clinico-pathological characteristics. GEP-NET patients consumed less frequently vegetables, fruits, wine, fish/seafood, nuts, and more frequently red/processed meats, butter, cream, margarine, and soda drinks than controls. Patients with more aggressive disease presented a lower adherence to MD according to PREDIMED categories in comparison to G1, localized and free/stable disease status. A smaller PhA value and a lower PREDIMED score were significantly correlated with G2 tumor, metastases, and progressive disease. To the best of our knowledge, this is the first study reporting an association between nutritional status and tumor aggressiveness in a selected group of GEP-NETs. Moreover, higher intakes of food of MD, may represent a potential tool for prevention of tumor aggressiveness. Thus, a skilled nutritionist should be an integral part of the multidisciplinary management of GEP-NET patients.

1. Introduction

Neuroendocrine tumors (NETs) are rare neoplasms, with an estimated annual incidence of ~6.9 per 100,000. More than 50% of these tumors originate from the digestive system and are referred to as gastroenteropancreatic NETs (GEP-NETs) [1]. The majority of GEP-NETs are diagnosed as incidental findings or due to clinical manifestation related to tumor mass (non-functioning NETs) [2]. In about 30% of cases, symptoms are related to hypersecretion of hormones and other biologically active molecules (functioning NETs) which can induce different metabolic and gastrointestinal impairments, such as hypoglycemia, hyperglycemia, peptic ulcers, diarrhea, steatorrhea, and altered gastrointestinal motility [3]. Thus, tumor hypersecretion as well as the surgical approach in altering the anatomy of the gastrointestinal tract, the somatostatin analogs treatment affecting the gut’s secretion, motility and absorption, and systemic chemotherapy causing anorexia and weight loss, may all lead to an alteration of the nutritional status in patients affected by GEP-NET [4].
Despite the nutritional status being largely affected in GEP-NET patients, only few studies have investigated this topic. Recently, it was demonstrated that metabolic profile in patients with non-functioning GEP-NET was associated with higher ki67% index and larger tumor size [5]. In contrast to this, a large analysis using the Nationwide Inpatient Sample showed that obesity could represent a protective factor against inpatient mortality in abdominal NET patients [6]. The same study also reported that malnutrition correlated with nearly 5-fold higher odds of inpatient mortality in this group of patients [6]. It has been suggested that a poor nutritional status may negatively impact the clinical outcome of patients with NET, extending the duration of hospitalization and reducing the overall-survival [7,8]. Moreover, malnourished NET patients showed a worse response to transcatheter arterial chemoembolization of liver metastases [9]. Maasberg et al. observed an association between nutritional status and body composition evaluated through Bioelectrical Impedance Analysis (BIA) and its derived parameter Phase Angle (PhA) in NET patients [8], as already reported in other cancer types [10,11]. Particularly, the authors reported that malnutrition significantly correlated with poorer BIA parameters and decreased PhA value [8]. No further details on nutritional status, dietary pattern, and body composition in GEP-NET patients have been reported.
Evidence suggests that nutritional factors, such as the scarce adherence to the Mediterranean diet (MD), could influence the aggressiveness of different tumor types, such as prostate, bladder, and breast cancer [12,13,14], in addition to representing a dietary pattern suitable in both prevention and mortality reduction of several cancer types [15]. Moreover, it has been reported that a low adherence to the MD correlated with an increased risk of metabolic syndrome [16], that, as above mentioned, was associated with larger and higher proliferative tumor in GEP-NET patients [5]. Recently, an association between PhA measurements and adherence to the MD independently from confounding factors, such as sex, age, and body weight in healthy subjects was observed [17]. Nowadays, nutritional guidelines in GEP-NET patients are still missing and there is no evidence regarding the association between the adherence to the MD and its potential association with tumor aggressiveness in patients with GEP-NET. Thus, the evaluation of PhA value and the adherence to the MD could be particularly useful to predict the nutritional status of GEP-NET patients.
The aim of this case-control, cross-sectional study was to investigate the nutritional status, including adherence to the MD and dietary pattern, in a selected group of GEP-NET patients and to evaluate the association of the nutritional status with different markers of tumor aggressiveness.

2. Materials and Methods

2.1. Design and Setting

This paper presnents a cross-sectional case-control observational study carried out at the European Neuroendocrine Tumor Society (ENETS) Center of Excellence Multidisciplinary Group for Neuroendocrine Tumors, Department of Clinical Medicine and Surgery, Unit of Endocrinology, University “Federico II” of Naples. Both patients and controls were enrolled from January 2017 to July 2018. The work was conducted in accordance with the Code of Ethics of the World Medical Association (Declaration of Helsinki) for experiments involving humans, and approved by the Ethical Committee of the University of Naples “Federico II” Medical School (n. 201/17). The protocol was explained to both patients and controls, and a written informed consent was obtained. This cross-sectional observational study was registered at clinicaltrials.gov with the number NCT03592940.

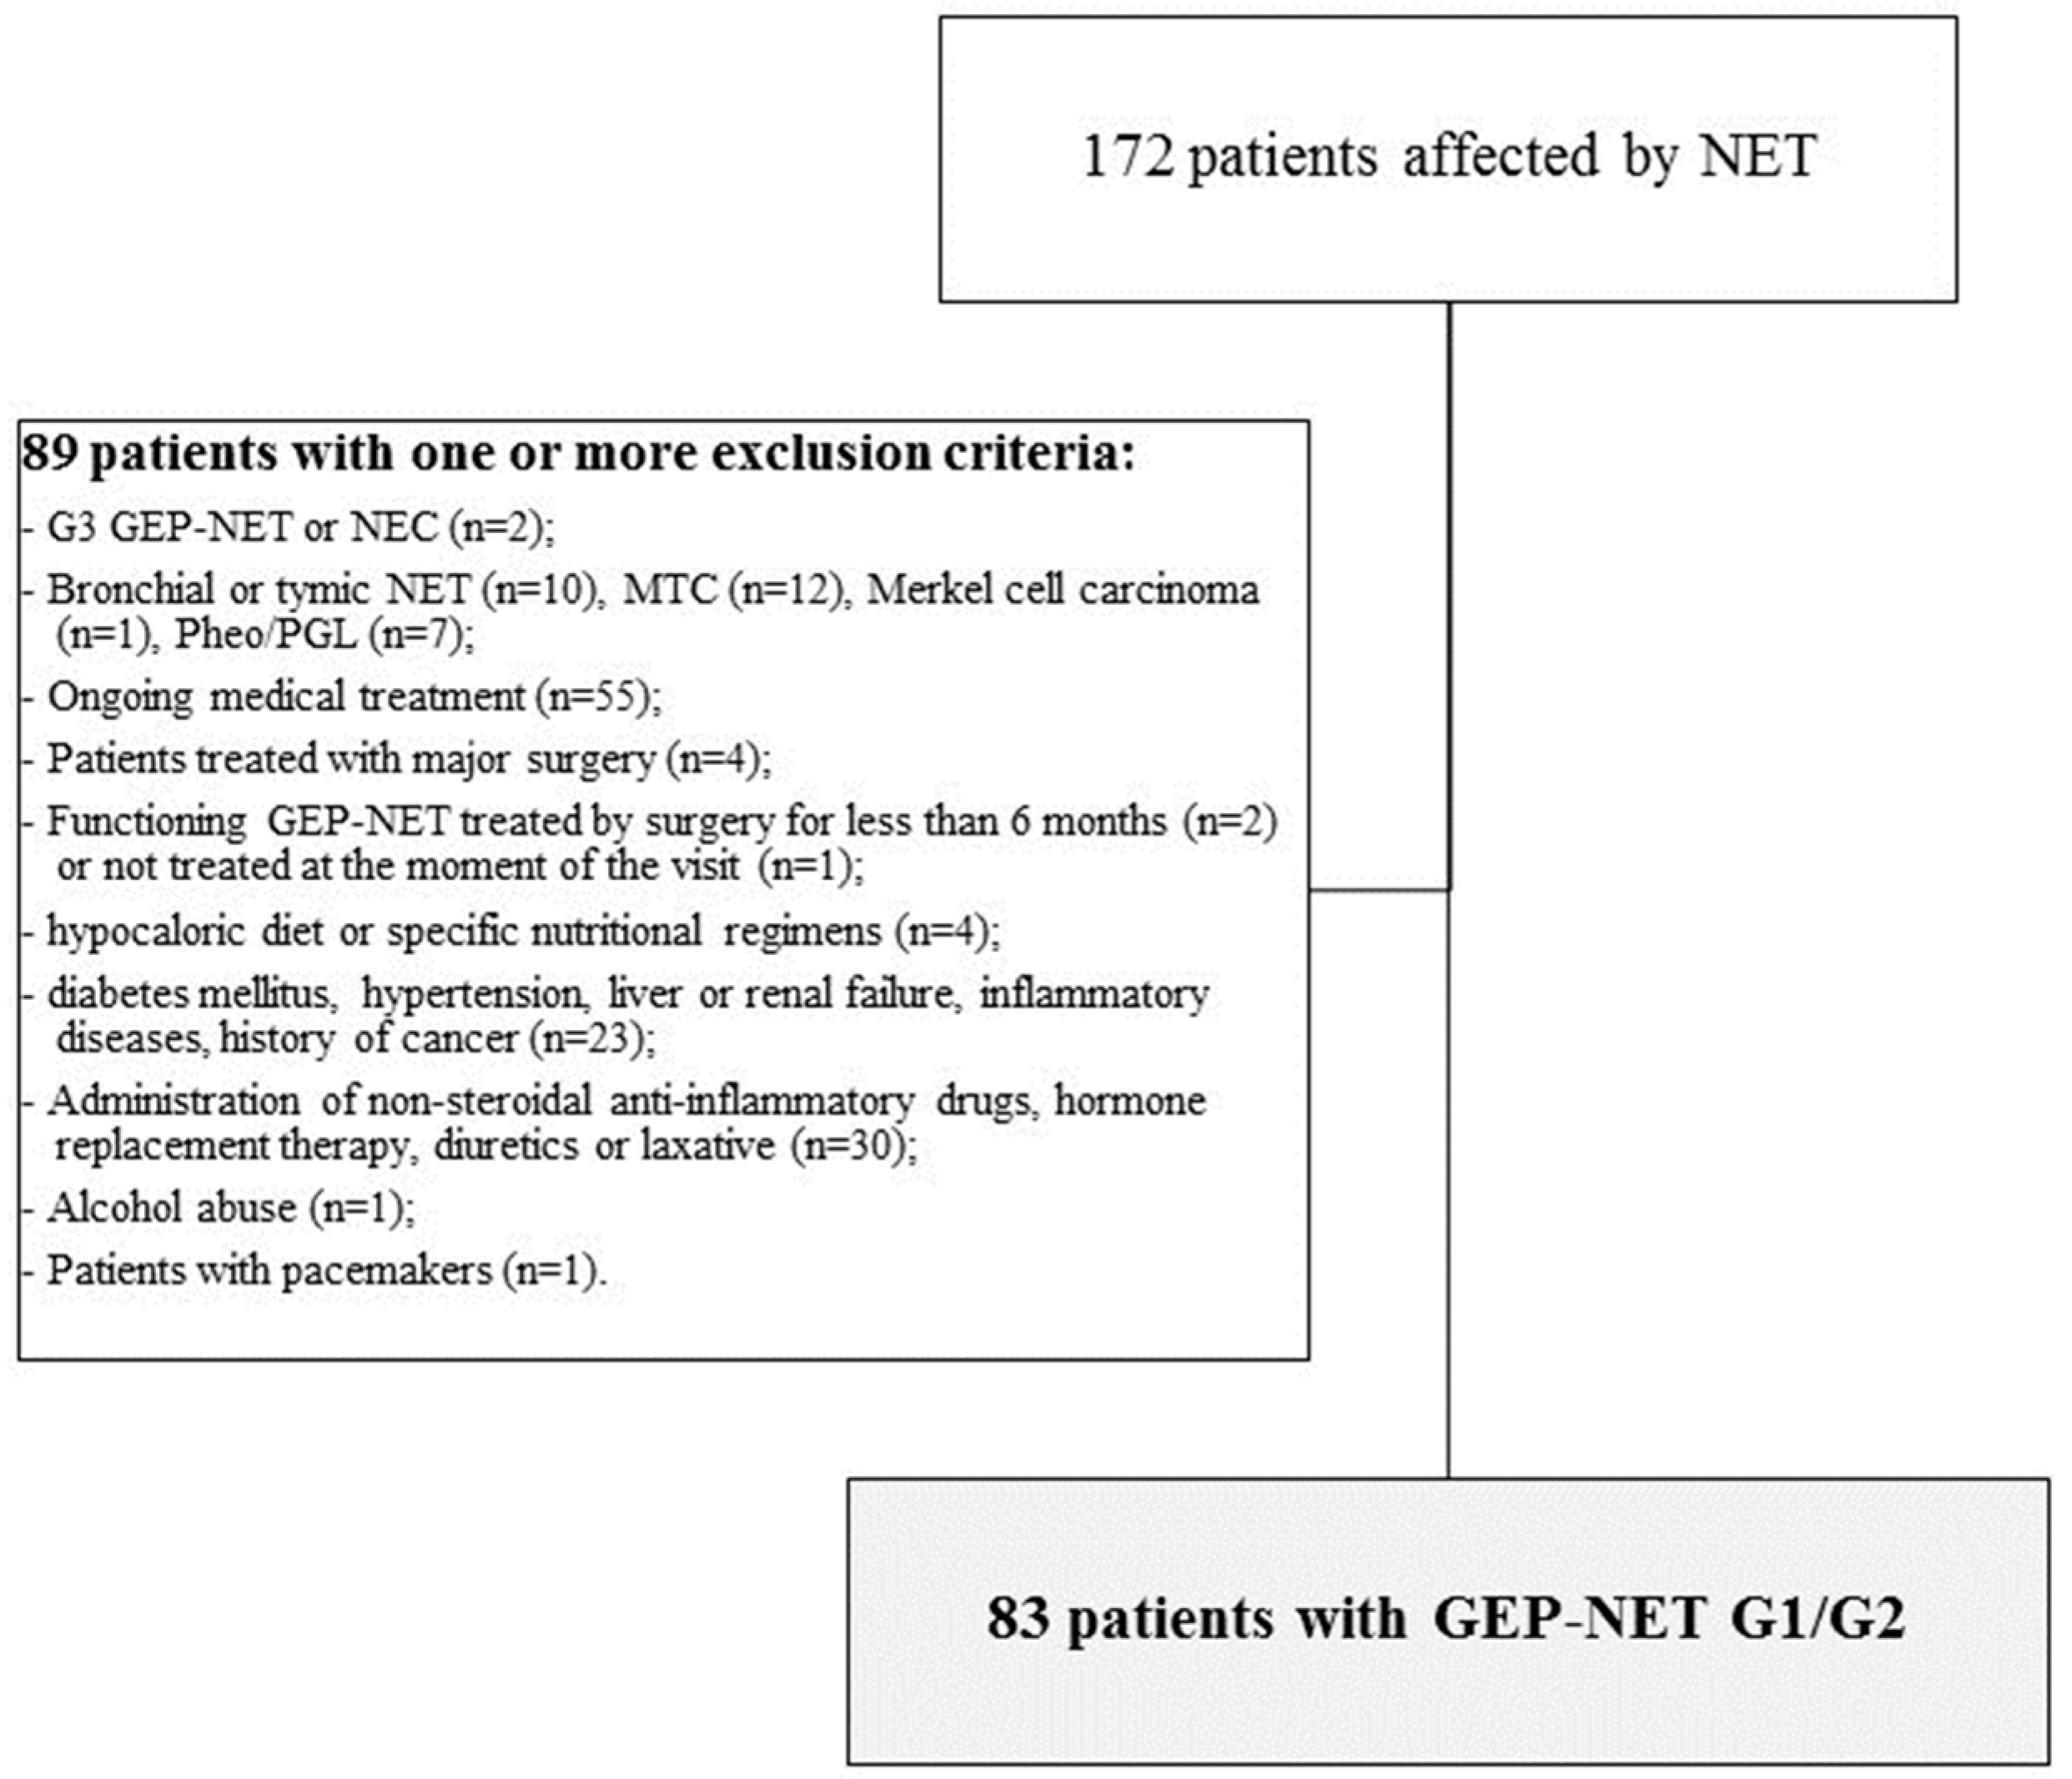
2.2. Population Study

The study was conducted on 83 adult patients affected by GEP-NET out of 172 unselected Caucasian patients with a diagnosis of NET attending the ENETS Centers of Excellence Multidisciplinary Group for Neuroendocrine Tumors, University “Federico II”, Naples. To improve the power of the study and the homogeneity of the investigated cohort, only patients with the following criteria were included:
  • Histological diagnosis of well-differentiated, low grade (G)1 and G2 GEP-NET, including sporadic tumors or patients with multiple endocrine neoplasia type 1 (MEN1) syndrome, according to classification of by the World Health Organization (WHO) [18];
  • Non-functioning GEP-NET patients that were treatment-naïve (evaluated at the moment of the diagnosis or before starting any medical treatment), or that discontinued Somatostatin Analogues (SSAs) for more than 6 months or after endoscopic surgery performed more than 6 months before the visit;
  • Functioning GEP-NET patients who underwent endoscopic tumor resection and who were biochemically free of disease for more than 6 months and who had not resumed medical treatment;
Patients with one or more of the following criteria were excluded from the study:
  • Histological diagnosis of well-differentiated/high grade G3 GEP-NET or poorly-differentiated neuroendocrine carcinomas (NEC) according to WHO classification [18], since it has been shown that patients with G3 tumors were at risk of malnutrition [8];
  • Diagnosis of bronchial or thymic NET, medullary thyroid cancer, Merkel cell carcinoma, pheochromocytoma/paraganglioma;
  • Ongoing medical treatment, including SSAs or targeted therapy, at the moment of the visit, since they could affect the gastrointestinal secretory, motor, and absorptive functions or cause anorexia and liver toxicity [5];
  • Patients who had undergone major surgery, since it could change the anatomy of the gastrointestinal tract;
  • Patients with functioning GEP-NET that had been treated with curative surgery for less than 6 months before the visit;
  • Patients with functioning GEP-NET that had not been treated at the moment of the visit, since the secretion of hormones, peptides and amines could cause malabsorption, diarrhea, steatorrhea and altered motility of the gastrointestinal tract [5];
  • Patients on a hypocaloric diet in the last three months or specific nutritional regimens, including vegan or vegetarian diets and vitamin/mineral or antioxidant supplementation;
  • Presence of clinical conditions that could influence fluid balance and metabolism, including diabetes mellitus, hypertension, liver or renal failure, acute or chronic inflammatory diseases, history of cancer, based on a complete medical examination and laboratory investigations;
  • Current administration of medicaments that could influence the fluid balance, including non-steroidal anti-inflammatory drugs, hormone replacement therapy, diuretics or laxative;
  • Abuse of alcohol defined by the Diagnostic and Statistical Manual of Mental Disorders (DSM)-V criteria [19];
Patients with pacemakers due to the potential interference with the device.
Eighty-three patients were enrolled together with healthy volunteers from the hospital and employees from the same geographical area. Controls were matched by age, sex, and Body Mass Index (BMI) and none had a history of cancer, diabetes mellitus, hypertension, liver or renal failure, inflammatory disease, alcohol abuse and none of them consumed medicaments. To avoid the overlapping enrollment, none of the controls contemporarily participated in other trials during the period of this study. All the measurements were performed between 8 and 12 AM. All subjects were measured after an overnight fast. The flow chart of the studied subjects is shown in Figure 1.

2.3. Clinicopathological Characteristics of the Tumor

Clinicopathological characteristics, such as primary tumor site and size, tumor stage, mitotic rate, ki67 index, metastases, familiar history of MEN1, hormonal secretion, comorbidity, treatment and follow-up, were collected for all patients.
Tumor size (mm) was defined as the maximum tumor diameter in the pathological specimen or in the last computed tomography (CT) scan/magnetic resonance imaging (MRI) when the patient had not undergone surgery or when the patient had multiple pancreatic nodules in case of MEN1. For these patients, the diameter of the biggest pancreatic lesion was considered for the tumor size. Only in a few cases (n = 3) was the tumor size not defined since the primary lesion had not been found. Tumor stage at diagnosis was classified according to the ENETS criteria [20]. According to this, patients were classified as those with localized disease (stage I–III) and patients with advanced disease (presence of metastases, stage IV).
For the diagnosis of NET, immunohistochemistry for chromogranin A, synaptophysin and ki67 were performed for all formalin-fixed paraffin-embedded tissue samples deriving from biopsy or surgery of the primary tumor and/or metastases [21]. Particularly, the evaluation of the mitotic rate and ki67% index were performed as previously reported [22] according to ENETS criteria [20]. Additionally, according to WHO classification [18], all GEP-NETs were divided into well-differentiated or poorly differentiated malignant neoplasms named neuroendocrine carcinomas (NECs). In this study, only patients with well-differentiated/low grade GEP-NETs, graded as G1 (ki67% ≤2% and mitoses <2) or G2 (ki67% 3–20% and mitoses 2–20) were included [18].
At the time of the visit, disease status was defined as “disease free”, when there was no biochemical and morphological evidence of the disease after tumor resection, “stable disease” or “progressive disease” according to RECIST 1.1 criteria [23].

2.4. Lifestyle Habits

Lifestyle habits, including physical activity level and smoking habits, were investigated by a standard questionnaire. Physical activity levels were expressed according to whether the participant habitually engaged at least 30 min/day of aerobic exercise (YES/NO). Subjects were considered as “current smokers” when they smoked at least one cigarette per day, “former smokers” when having stopped smoking at least one year before the interview, and “non-current smokers”. Former and non-current smoker were considered as “no-smoker” for the analyses.

2.5. Dietary Assessment

As widely reported previously [24,25,26,27], data were obtained during a face-to-face interview between the patient and a qualified nutritionist. In detail, the dietary interview enabled the quantification of food and drinks by using a photographic food atlas (≈1000 photographs) of known portion sizes to ensure accurate completion of the records [28]. Dietary data, including beverage intakes and alcohol consumption, were collected by 7-day food records that were evaluated by a nutritionist. Data were stored and processed later, using a specific software (Terapia Alimentare Dietosystem® DS-Medica, (http://www.dsmedica.info) that calculate daily caloric intake and the quantities of macronutrients (animal and plant protein; total, complex and simple carbohydrates; total fat, saturated fatty acid (SFA), monounsaturated fatty acids (MUFA), polyunsaturated fatty acids (PUFA): n-6 PUFA, n-3 PUFA).

2.6. Adherence to the Mediterranean Diet

As previously reported [17,24,25,26,29,30,31,32], the adherence to the MD was evaluated using the 14-item questionnaire for the assessment of PREvención con DIeta MEDiterránea (PREDIMED) [33]. A qualified nutritionist administered the questionnaire during a face-to-face interview to all the enrolled subjects. Briefly, for each item scores 1 and 0 were assigned; the PREDIMED score was calculated as follows: 0–5, lowest adherence; score 6–9, average adherence; score ≥10, highest adherence [33].

2.7. Anthropometric Measurements and Blood Pressure

Anthropometric measurements were obtained with subjects wearing light clothes and without shoes. BMI was calculated by weight and height (weight (kg) divided by height squared (m2), kg/m2). Height was measured to the nearest 1 cm using a wall-mounted stadiometer (Seca 711; Seca, Hamburg, Germany). Body weight was derived to the nearest 50 g using a calibrated balance beam scale (Seca 711; Seca, Hamburg, Germany). Subjects were classified by BMI according to WHO’s criteria as normal weight (BMI 18.5–24.9 kg/m2), overweight (BMI 25.0–29.9 kg/m2), grade I obesity (BMI 30.0–34.9 kg/m2), grade II obesity (BMI 35.0–39.9 kg/m2), grade III obesity (BMI ≥ 40.0 kg/m2) [34]. Waist Circumference (WC) was measured to the closest 0.1 cm at the natural indentation or at a midway level between lower edge of the rib cage and iliac crest if no natural indentation was visible using a non-stretchable measuring tape, in line with the National Center for Health Statistics (NCHS) [35]. In all individuals systolic (SBP) and diastolic (DBP) blood pressure were measured three times, every two min after the subject had been sitting for at least 10 min, with a random sphygmomanometer (Gelman Hawksley Ltd., Sussex, UK). The mean of the second and third reading was recorded.

2.8. Assay Methods

Samples were collected in the morning between 8 and 10 a.m., after an overnight fast of at least 8 h and stored at −80 °C until being processed. All biochemical analyses including fasting plasma glucose, total cholesterol, fasting plasma triglycerides were performed with a Roche Modular Analytics System in the Central Biochemistry Laboratory of our Institution. Low-density lipoprotein (LDL) cholesterol and high-density lipoprotein (HDL) cholesterol were determined by a direct method (homogeneous enzymatic assay for the direct quantitative determination of LDL and HDL cholesterol).

2.9. Bioelectrical Impedance Analysis

Bioelectrical impedance analysis was performed using a BIA phase-sensitive system by experienced observers (an 800-µA current at a frequency single-frequency of 50 kHz BIA 101 RJL, Akern Bioresearch, Florence—Italy) [36], as already amply reported in previous studies [17,29,37]. Based on the European Society of Parenteral and Enteral Nutrition (ESPEN) guidelines [38], all participants were supine with limbs slightly spread apart from the body, had refrained from eating, drinking, and exercising for six hours with no alcohol within 24 h before testing. Shoes and socks were removed and contact areas were scrubbed with alcohol immediately before electrode placement. Electrodes (BIATRODES Akern Srl; Florence—Italy) were placed on the dorsal surface of the right hand proximal to the phalangeal–metacarpal joint and on the superior surface of the right foot distal to the transverse arch. Sensor electrodes were placed on the right wrist at the midpoint between the distal prominence of the radius and ulna, and on the right ankle between the medial and lateral malleoli, as described by Kushner et al. [39]. All measurements were performed under strictly standardized conditions by the author, using the same device in order to avoid interobserver and interdevice variability. The instrument was routinely checked with resistors and capacitors of known values. Reliability for within-day and between-day measurements by the same observer were <2.7% for resistance (R), <2.9% for reactance (Xc), and <3.1% for R, <2.4% for Xc, respectively. The coefficient of variation (CV) of repeated measurements of R and Xc at 50 kHz was assessed in 14 patients (7 males and 7 females) by the same observer: CVs were 1.9% for R and 1.8% for Xc. The PhA was derived from conditions under 50 kHz according to the following formula: PhA (°, degrees) = arctangent Xc/R ((Xc/R) × (180/π)).

2.10. Statistical Analysis

The data distribution was evaluated by the Kolmogorov–Smirnov test and the abnormal data were normalized by logarithm. All variables were logarithmically transformed and back-transformed for presentation in tables and figures. The chi-square (χ2) test was used to determine the significance of differences in the frequency distribution. Differences between GEP-NETs patients and the control group were analyzed by Student’s paired t-test, while the differences among the several parameters with the disease status were analyzed by Student’s unpaired t-test, followed by Bonferroni post hoc analysis. p values < 0.05 were considered as statistically significant.
Proportional Odds Ratio (OR) models, p-value, 95% Interval Confidence (IC), and R2, were performed to assess the association among quantitative variables (grading system and metastasis). Multinomial logistic regression, χ2, p-value, and Akaike Information Criterion (AIC), were performed to model the relationship between the several parameters with the three groups of disease status (disease free, stable disease, and progressive disease). The correlations between the different variables were performed using Pearson r correlation coefficients. Receiver operator characteristic (ROC) curve analysis was performed to determine sensitivity and specificity, area under the curve (AUC), and IC, as well as cut-off values for PhA and PREDIMED score in detecting Sartorius HS score above the median values in the HS patients. Test AUC for ROC analysis was also performed. For α level the 0.05 type I error was selected and for β level the 0.20 type II error was selected. In these last analyses, only variables with a p-value < 0.05 in the univariate analysis (partial correlation) were entered. Variables with a variance inflation factor (VIF) >10 were excluded to avoid multicollinearity. Values ≤ 5% were considered statistically significant. Data were analyzed using the MedCalc® package (Version 12.3.0 1993–2012 MedCalc Software bvba-MedCalc Software, Mariakerke, Belgium) and SPSS Software (PASW Version 21.0, SPSS Inc., Chicago, IL, USA).

3. Results

3.1. Patient Population

A total of 83 patients (F:M = 43:40), mean age 56.66 (18–80) years, affected by GEP-NET were included in the study. Mean size of the tumor was 24.96 ± 23.79 mm. Primary NET were located in the pancreas (n = 47, 56.6%), stomach (n = 12, 14.5%), small intestine (n = 14, 16.9%), appendix (n = 5, 6%), colon (n = 2, 2.4%) and in a few cases the primary site was unknown (n = 3, 3.6%). The majority of patients had non-functioning GEP-NET (n = 75, 90.4%). Among patients with pancreatic NET, 39 were non-functioning (83%), 5 were insulinomas (10.6%), 2 were gastrinomas (4.2%) and 1 was VIPoma (2.2%). All patients with functioning pancreatic NET underwent endoscopic surgery of the lesion at least 6 months before the visit. Twenty two patients (26.5%) had a MEN1 syndrome.
According to the pathological parameters, the mitotic rate and ki67% index, all GEP-NET were classified as well-differentiated tumor G1 (n = 48, 57.8%) or G2 (n = 35, 42.2%). At diagnosis, 22 patients (26.5%) had metastases (stage IV), the majority of them in the liver. At the moment of the visit considered for the study, 34 patients (41%) were disease free, 28 (33.7%) had stable disease and 21 (25.3%) had progressive disease according to the RECIST1.1 criteria.

3.2. Nutritional Status in GEP-NET Patients and Control Group

Clinical and anthropometric characteristics, lifestyle habits, blood pressure, metabolic profile, and bioelectrical parameters deriving from BIA of GEP-NET patients compared to controls are shown in Table 1. To note, GEP-NET patients smoked less (p = 0.005), presented higher blood pressure values and a worse metabolic profile (p < 0.001), and had smaller PhA according to gender (p < 0.001) in comparison to the control group (Table 1).
Data on Mediterranean food frequencies were analyzed by using the 7-day food records. Even though no differences in energy intake were observed between the two groups, GEP-NET patients consumed a lower quantity of plant protein (p = 0.003), complex carbohydrate (p < 0.001), MUFA (p = 0.009) and n-3 PUFA (p < 0.001), and higher quantity of simple carbohydrate (p < 0.001) and n-6 PUFA (p < 0.001) than control subjects (Table S1).
Analyzing in details the frequency of the assumed dietary components included in the PREDIMED questionnaire, GEP-NET patients consumed vegetables less frequently (p = 0.005), fruits (p = 0.001), wine (p = 0.013), fish/seafood (p = 0.005), nuts (p < 0.001), and more frequently red/processed meats (p = 0.017), butter, cream, margarine (p = 0.001) and soda drinks (p = 0.003); Table 2. Therefore, the PREDIMED score was significantly lower in GEP-NET patients compared to control group (6.18 ± 2.25 vs. 7.39 ± 2.54; p = 0.001). The PREDIMED score was positively correlated with PhA both in males and in females, in both GEP-NET patients (r = 0.724, p < 0.001 and r = 0.682, p < 0.001; respectively) and control (r = 0.919, p < 0.001 and r = 0.859, p < 0.001; respectively).
Regarding the adherence to the MD, only 4.8% of GEP-NET patients vs 26.5% of controls presented a high adherence to this dietary regimen (p = 0.001); Table 2.

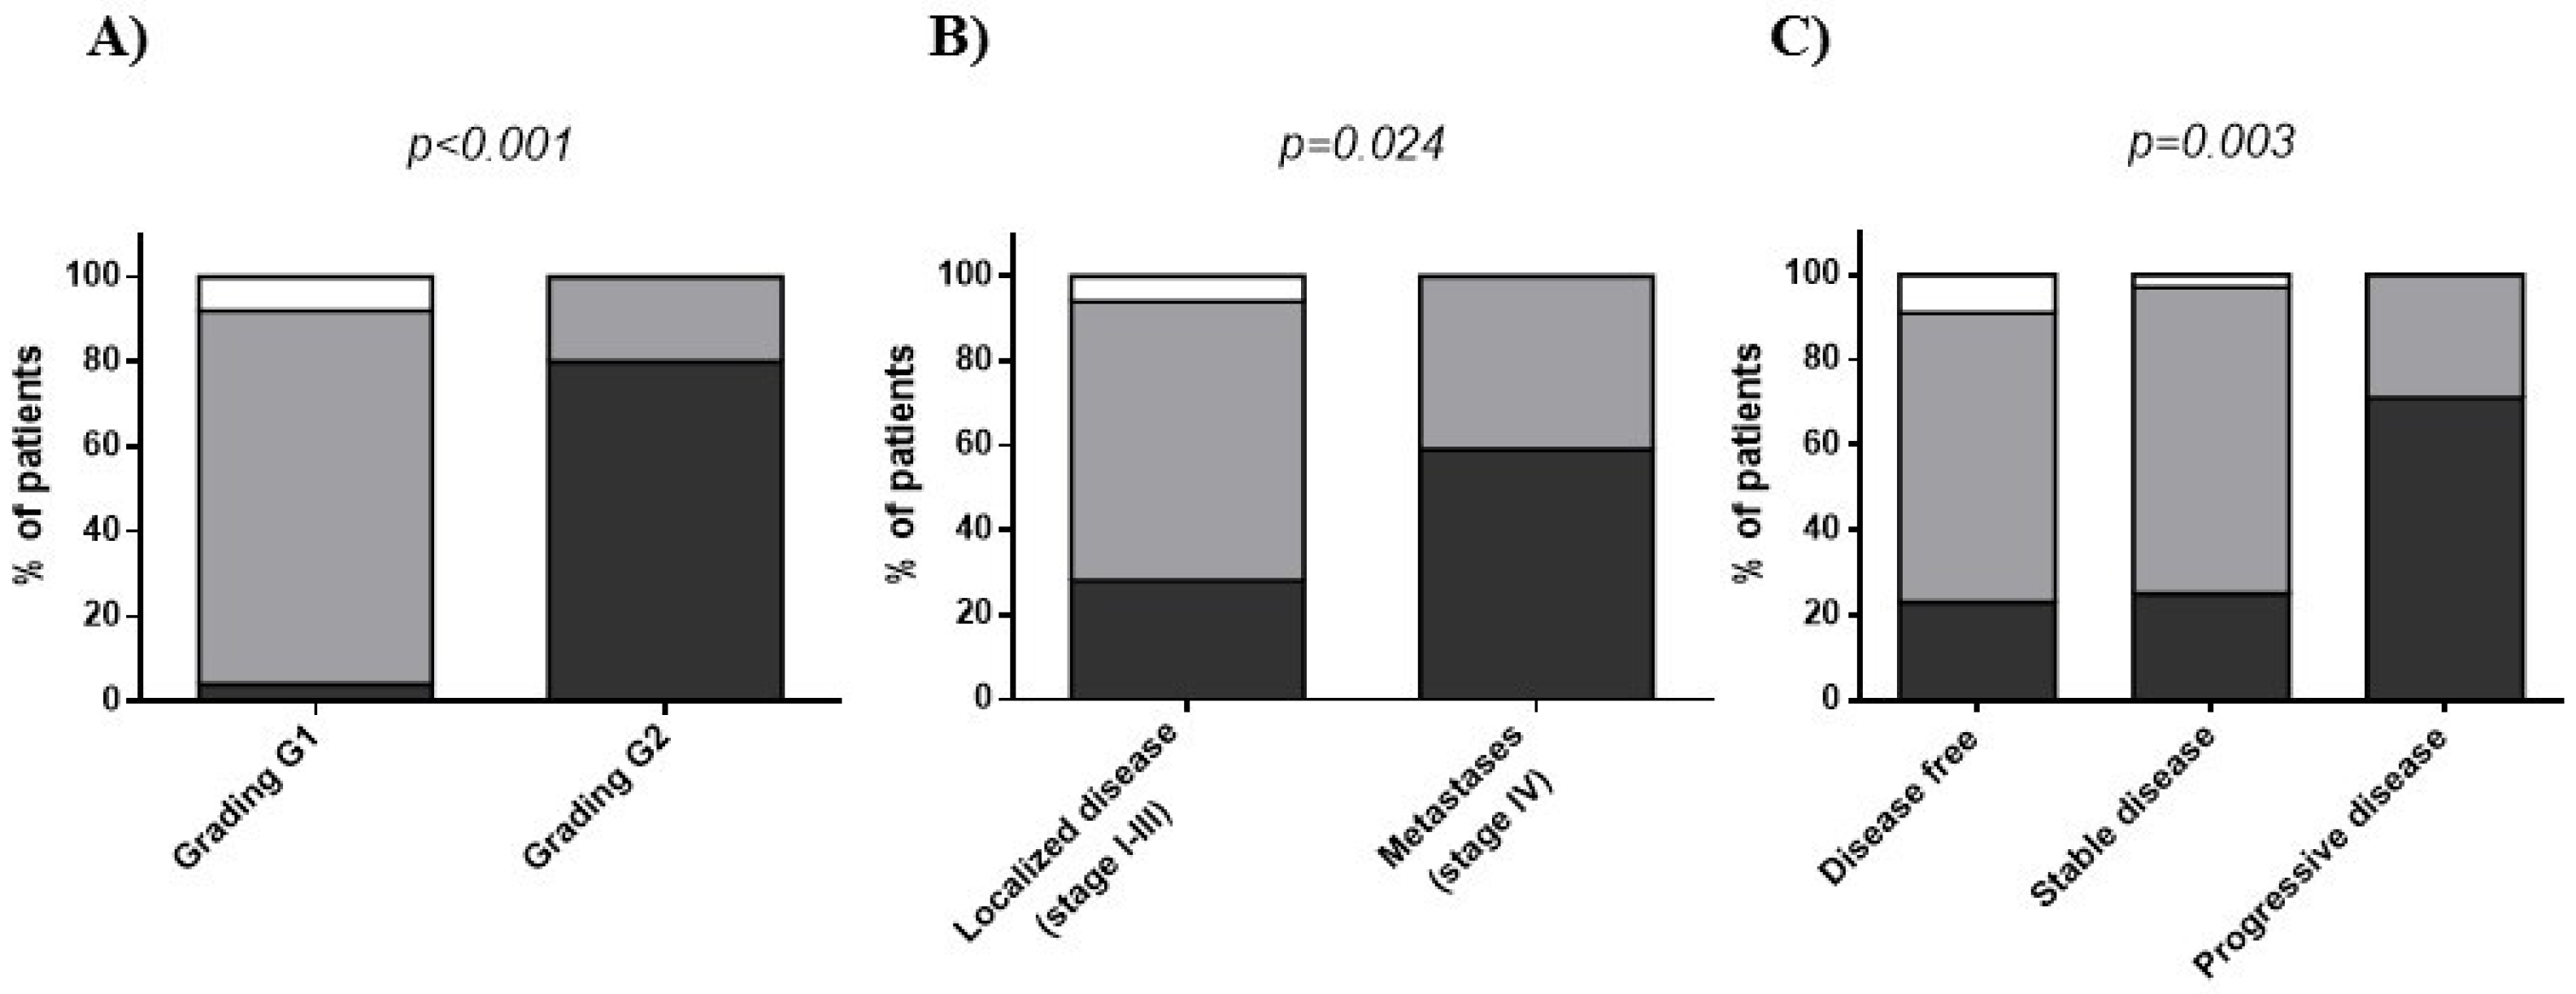
3.3. Nutritional Status in GEP-NET Patients According to Tumor Grading, Stage and Disease Status

Differences in age, anthropometric measurement, blood pressure, metabolic profile, bioelectrical variables, and nutritional assessment in the GEP-NET patients grouped by grading G1/G2 and stage are summarized in Table 3. Interestingly, patients with GEP-NET G2 and stage IV had significantly higher levels of SBP, fasting glucose, total and LDL cholesterol, triglycerides, and lower levels of HDL cholesterol as well as a lower PREDIMED score and PhA in comparison to patients with localized GEP-NET G1 (Table 3).
Similar results were observed also when these parameters were correlated with disease status. GEP-NET patients with progressive disease showed a significantly worse metabolic profile, a smaller PhA (p < 0.001), and a significantly lower PREDIMED score (p < 0.001) in comparison to patients who were free of the disease or with stable disease (Table 4).
When classified GEP-NET patients based on tumor grade G1/G2, stage and disease status, the majority of patients with aggressive disease (GEP-NET G2, stage IV and progressive disease) presented a low adherence to the MD according to PREDIMED categories (Figure 2 and Table S2).
In details, 28 out 35 (80%) patients with G2 GEP-NET, 13 out 22 (59%) patients with metastases and 15 out 21 (71.4%) patients with progressive disease had significantly lower adherence to the MD (Figure 2). On the contrary, 87.5%, 65.5%, and 67.7% of patients with GEP-NET G1, localized disease and free of disease, respectively, had an average adherence to the MD. Not one of the patients with aggressive tumor had a high adherence to the MD according to PREDIMED categories (Figure 2). No significant differences were observed when these patients were classified for gender, smoking and physical activity (Table S2).

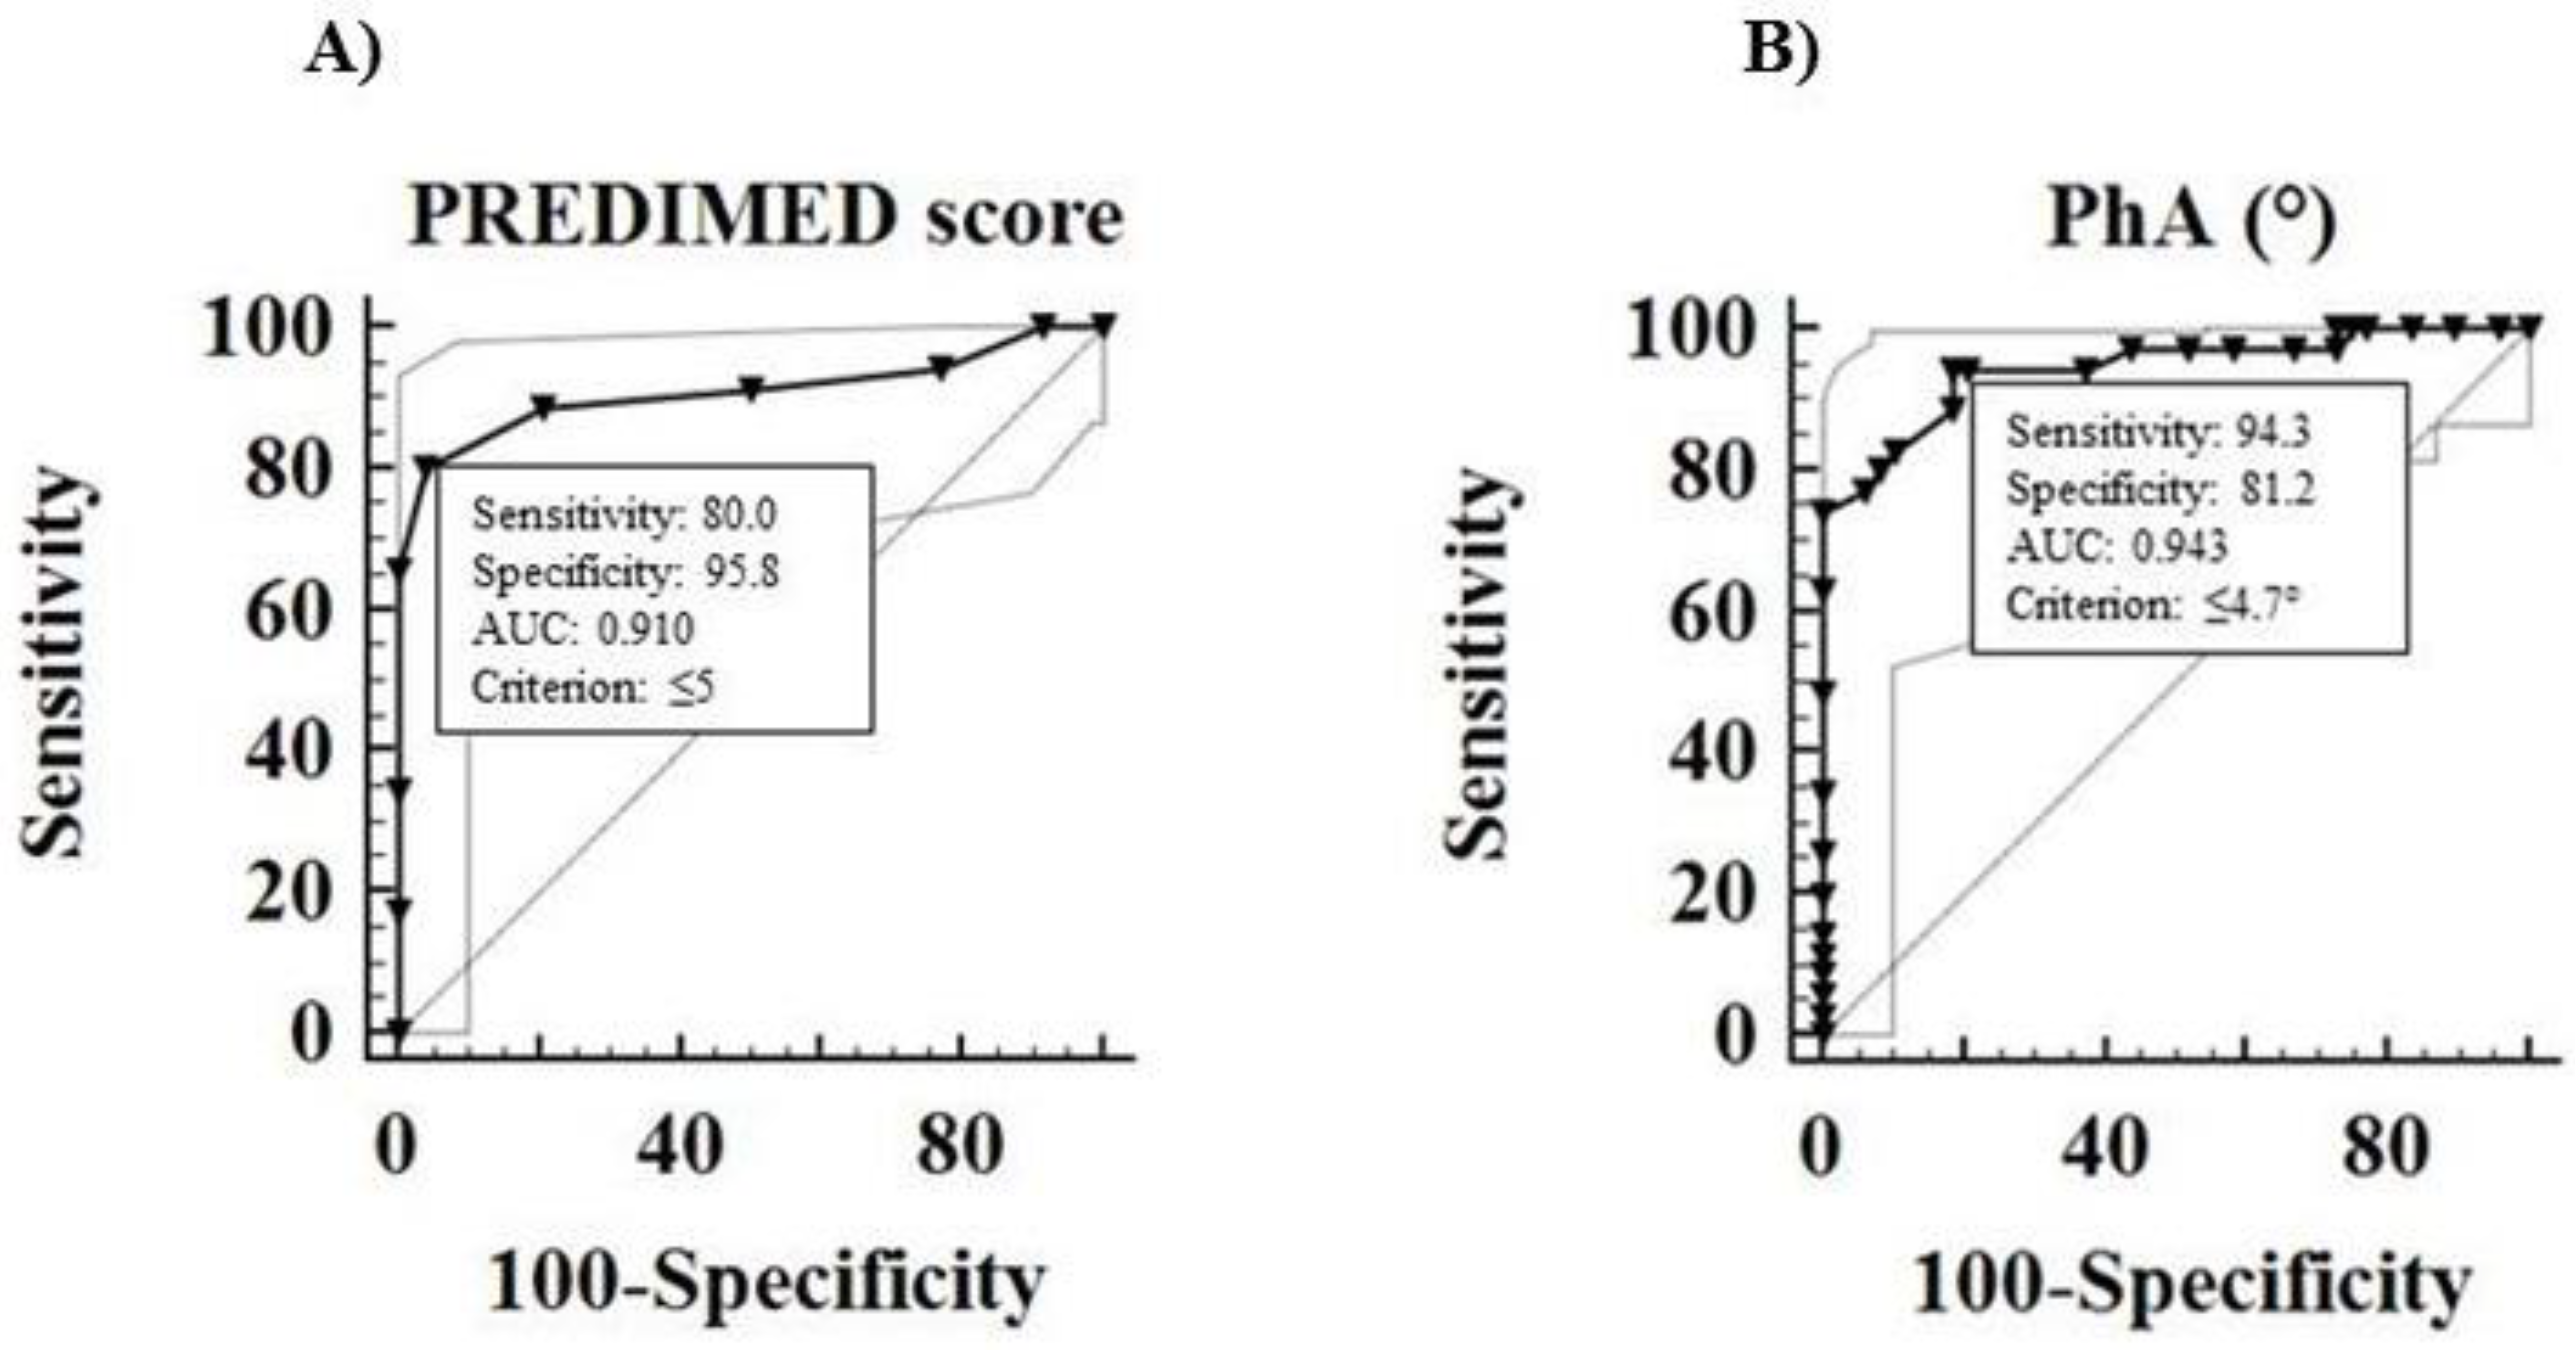
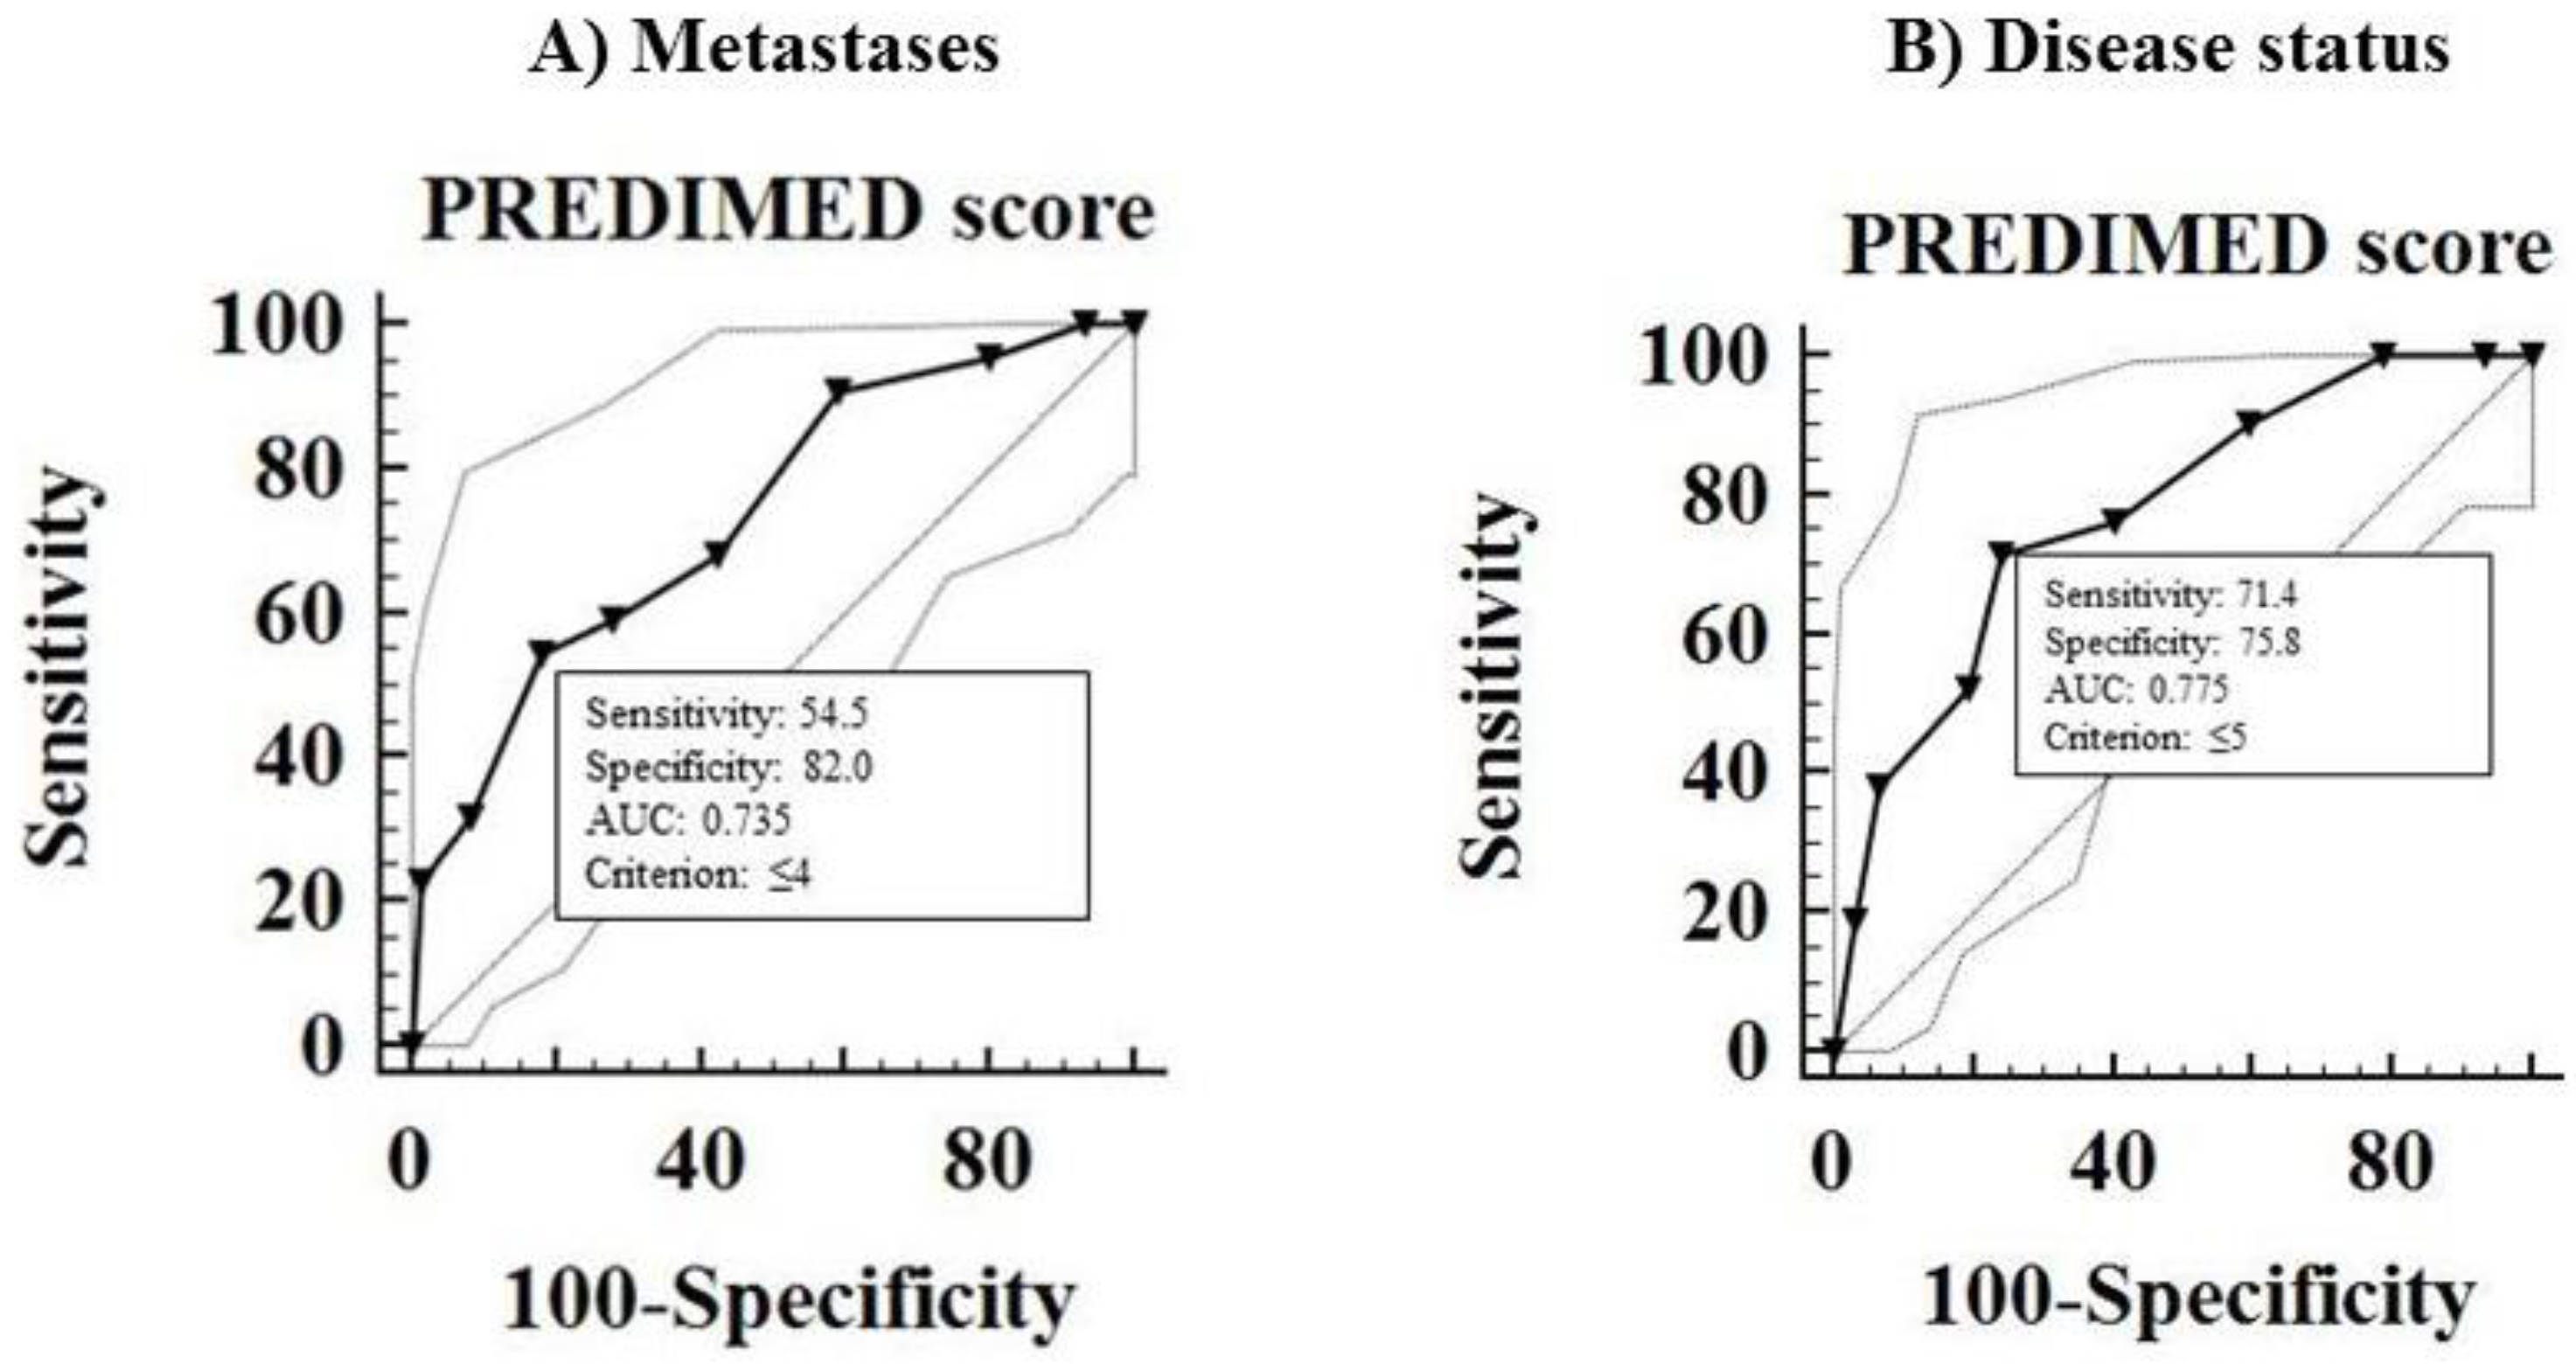
3.4. Correlation between Tumor Aggressiveness and Nutritional Status in GEP-NET Patients

Different markers, such as grading, stage, progressive disease, ki67% index, and tumor size, were evaluated to investigate tumor aggressiveness.
To assess the association of grading and stage, a bivariate proportional OR model with age, anthropometric measurement, blood pressure, metabolic profile, bioelectrical variables, and nutritional assessment was performed (Table 5).
Metastatic G2 tumor were significantly associated with higher values of WC (p = 0.049 for both), SBP (p = 0.018 and p = 0.020 for G2 and stage IV, respectively), metabolic profile (p < 0.001 for total and LDL cholesterol, p = 0.002 and p = 0.007 for fasting glucose and triglycerides, respectively, and G2; p = 0.004, p = 0.003, p = 0.005 and p = 0.001 for total cholesterol, LDL cholesterol, fasting glucose and triglycerides, respectively, and stage IV), protein consumption (p = 0.029 and p = 0.042 for G2 and stage IV, respectively), and with lower levels of HDL cholesterol (p = 0.044 and p = 0.011 for G2 and stage IV, respectively), lower PhA (p < 0.001 and p = 0.001 for G2 and stage IV, respectively) and PREDIMED score (p < 0.001 and p = 0.001 for G2 and stage IV, respectively; Table 5). In addition, GEP-NETs G2 were associated with higher consumption of simple carbohydrate (p = 0.042) and metastasized disease with lower consumption of plant protein (p = 0.002).
A multinomial logistic regression model to assess the association between patients with progressive disease and age, anthropometric measurement, blood pressure, metabolic profile, bioelectrical variables, and nutritional assessment was performed (Table 6). Progressive disease was associated with higher value of WC (p = 0.033), blood pressure (p = 0.05 and p = 0.027 for SBP and DBP, respectively), fasting glucose (p = 0.043), triglycerides (p = 0.030), and lower HDL cholesterol (p = 0.011), PhA (p = 0.010), and PREDIMED score (p = 0.005).
Correlations among ki67% index and tumor size with age, anthropometric measurement, blood pressure, metabolic profile, bioelectrical variables and nutritional assessment, are summarized in Table S3. ki67% showed significant correlations with all anthropometric measurements (p = 0.002 for BMI and p < 0.001 for WC), metabolic profile (p < 0.001), SBP (p = 0.003), PhA and PREDIMED score (p < 0.001). Tumor size correlated with SBP (p = 0.040), HDL cholesterol (p = 0.018), PhA (p = 0.001), PREDIMED score (p < 0.001), and protein consumption (p = 0.036). After adjusting for BMI and WC, all correlations for both ki67% and tumor size were maintained, except those with SBP (Table S3).
Three multiple linear regression analysis models including variables statistically correlated with each oncological category (grading, tumor stage, and disease status) were performed to compare the relative predictive power of the evaluated variables (Table 7).
Model 1 compared the relative predictive power of grading G1/G2 on WC, SBP, fasting glucose, total cholesterol, HDL cholesterol, LDL cholesterol, triglycerides, PhA, PREDIMED score, protein, and simple carbohydrate consumption. Using this model the PREDIMED score entered at the first step (p < 0.001), followed by PhA (p < 0.001), and simple carbohydrate (p = 0.005). Model 2 compared the relative predictive power of metastases (stage IV) on WC, SBP, DBP, fasting glucose, HDL cholesterol, triglycerides, PhA, and PREDIMED score. Using this model, triglycerides entered at the first step (p < 0.001), followed by the PREDIMED score (p = 0.003). In the model 3, the disease status was better predicted by PREDIMED score (p < 0.001) (Table 7).
The multiple linear regression analysis models including variables statistically correlating with ki67% index and tumor size, were reported in Table S4. In the model 1, ki67% index was better predicted by PhA (p < 0.001); in model 2 the dimension of lesion was better predicted by PREDIMED score (p < 0.001) (Table S4).
ROC analysis was performed to determine the cut off values of the PREDIMED score and PhA predictive of high grading, metastases, and disease status. A PREDIMED score ≤ 5 (p < 0.001, sensitivity 80%, specificity 95.8%; Figure 3A) and a PhA ≤ 4.7° (p < 0.001, sensitivity 94.3%, specificity 81.2%, Figure 3B), could serve as thresholds for significant increased risk of G2 tumor.
A PREDIMED score ≤4 could serve as a threshold for significantly increased risk of metastases (p < 0.001, sensitivity 54.5%, specificity 82%; Figure 4A). A PREDIMED score ≤5 was associated with a significant increased risk of progressive disease during follow-up (p < 0.001, sensitivity 71.4%, specificity 75.8%; Figure 4B).

4. Discussion

GEP-NET patients have been reported to have an impaired nutritional status (the metabolic state, the dietary pattern and body composition), mostly due to excessive secretion of gastrointestinal hormones and peptides, medical treatment, and surgical procedures [4,40]. Different studies have shown that a poor nutritional status negatively impacts the clinical outcome of patients with NET [6,8,9]. Moreover, metabolic profile has been reported to worsen the severity of non-functioning GEP-NETs being associated to a higher ki67% index and larger tumor size [5]. It has been suggested that nutritional factors, such as the adherence to the MD, could influence the aggressiveness of different tumor types, such as prostate, bladder and breast cancer [12,13,14], and that a low adherence to the MD pattern could correlate with an increased risk of metabolic syndrome [16].
In our study we reported the difference of nutritional status, evaluated by BIA and its derived parameter PhA, and dietary pattern between a selected group of GEP-NET patients and healthy control. Moreover, in GEP-NET patients we observed a significant correlation among the nutritional status the adherence to the MD and clinicopathological characteristics, including tumor grade, stage, disease status, ki67% index, and tumor size.
In comparison to healthy controls, patients affected by GEP-NET had a dietary pattern characterized by a significantly lower adherence to the MD, as assessed by PREDIMED score, consuming less frequently vegetables, fruits, wine, fish/seafood, nuts, and more frequently red/processed meats, butter, cream, margarine, and soda drinks. Moreover, in line with the tumor-preventive potential effect of some food containing specific bioactive compounds (e.g., n-3 PUFA, or MUFA) [41], we observed that GEP-NET patients in comparison to healthy controls, had a lower consumption of unsaturated fat that is beneficial for health, were associated with a lower consumption of plant protein and complex carbohydrates and had a preferential consumption of simple carbohydrate and n-6 PUFA. As already reported [16], we observed that GEP-NET patients presented a worse metabolic profile probably as a consequence of a low adherence to the MD. Indeed, the metabolic profile of these patients was characterized by an increase of waist circumference, higher blood pressure values, and significantly higher blood levels of fasting glucose, total and LDL cholesterol and triglycerides, and significantly lower levels of HDL cholesterol, all parameters that are associated with a higher risk of metabolic syndrome. Thus, we confirmed that the worse metabolic parameters correlated with higher ki67% index, as previously reported by our group [5]. However, we did not find significant correlations between these parameters and larger tumor size, except for HDL cholesterol. These contrasting results with our previous study [5] could be due to the fact that in the present study we did not consider the metabolic syndrome per se, but we focused our attention on the nutritional status and dietary pattern.
We observed that GEP-NET patients presented a decreased PhA value in comparison to healthy controls, as already reported in other diseases, such as infection disease, inflammation status, and several cancer types [11]. It has been suggested that the PhA value correlated with disease severity [11] and that a low value could be predictive of impaired prognosis (mortality, disease progression, postoperative complications) in different tumors, such as pancreatic [42], breast [43], lung [44], and colorectal cancer [45]. Moreover, we recently observed that PhA value correlated with the adherence to MD independently of confounding factors [17]. In parallel with these findings, we demonstrated that a decreased PhA, together with a lower adherence to the MD as assessed by a low PREDIMED score, were the major predictors of GEP-NET aggressiveness. The ROC analysis showed that tumor grading G2 was well predicted by a PREDIMED score ≤ 5 and a PhA value ≤ 4.7° with a sensitivity of 80% and 94.3% and a specificity of 95.8% and 81.2%, respectively. Thus, we concluded that a lower adherence to the MD, together with a decreased PhA value and a consequent worse metabolic profile, were associated with an increased GEP-NET aggressiveness, characterized by tumor grading G2, stage IV and progressive disease, also after adjustments for gender, smoking, and physical activity.
However, there are some limits of this study that should be considered. The cross-sectional nature of the study did not allow any causal association to be identified between MD or PhA and GEP-NETs and to clearly determine the prognostic value of the adherence to the MD or of PhA for predicting its clinical severity. Moreover, the suggested cut-off value of the PREDIMED score and PhAs to identify tumor aggressiveness should be viewed with caution until results in larger populations become available to perform an appropriate cross-validation. In addition, expert nutritionists are required for the assessment, execution, and interpretation of BIA measurements, such as PhA. The main strength of this study was the use of the 7-day food records. This method is the “gold standard” in validation studies of different self-administered food frequency questionnaires and allows a more accurate measurement of the dietary and macronutrient intakes compared to other questionnaires [46,47]. In order to improve the power of the study, we increased the homogeneity of the cohort of studied patients by including non-functioning treatment-naïve patients or patients who underwent curative surgery and who were biochemically free of disease for more than 6 months and who had not partaken of medical treatment. Moreover, all patients had a diagnosis of well-differentiated G1/G2 GEP-NET and both GEP-NET patients and matched controls were well characterized.

5. Conclusions

In conclusion, to the best of our knowledge, this is the first study to show a novel association between nutritional status and aggressiveness of GEP-NETs in a selected cohort of adult patients. This association potentially extends the benefit of adherence to the MD to GEP-NET patients and suggests that BIA and PhA value may be used as tools for the nutritional management of these patients and as markers of tumor aggressiveness. Moreover, this is the first study to indicate a dietary pattern that may be beneficial for GEP-NET patients and that may modulate the risk of tumor aggressiveness, offering a practical strategy for the management of these patients. Therefore, the assessment of nutritional status should be recommended as good clinical practice in the evaluation of GEP-NET patients, in order to identify high-risk subjects with a more aggressive tumor who could better benefit from a nutritional intervention promoting the Mediterranean food pattern. Thus, a skilled nutritionist should be part of the multidisciplinary health care team in NETs management, adapting the specific nutritional needs to the course of the disease. Future well-designed dietary intervention trials on larger population samples are needed to define specific dietary guidelines for NETs and elucidate the beneficial effects of the MD on the survival outcomes of GEP-NET patients.

Supplementary Materials

The following are available online at https://www.mdpi.com/2072-6643/10/12/1854/s1, Table S1: Total energy and daily macronutrients/micronutrients intake of GEP-NET patients and control group, Table S2: Grading, disease stage and disease status in GEP-NET patients according to gender, gender, smoking, physical activity and PREDIMED categories, Table S3: Correlations of ki67% index and tumor size with demographic, clinical, metabolic and bioelectrical parameters, Table S4: Multiple regression analysis models (stepwise method) with the tumor aggressiveness and nutritional parameters.

Author Contributions

The author’s responsibilities were as follow: Conceptualization, L.B., A.F. and S.S.; Data curation, L.B., B.A., D.L. and G.A.; Formal analysis, L.B. and S.S.; Funding acquisition, A.C. and A.F.; Investigation, L.B., B.A., G.M., D.L., G.A., A.C., A.F. and S.S.; Methodology, L.B., G.M., A.C. and S.S.; Project administration, L.B., A.C. and S.S.; Resources, A.C., A.F. and S.S.; Software, G.A.; Supervision, L.B.; Visualization, B.A. and G.A.; Writing—original draft, L.B. and B.A.

Funding

This research received no external funding.

Acknowledgments

We would like to thank Angela Avino for data retrieval.

Conflicts of Interest

The authors declare no conflict of interest.

References

  1. Dasari, A.; Shen, C.; Halperin, D.; Zhao, B.; Zhou, S.; Xu, Y.; Shih, T.; Yao, J.C. Trends in the Incidence, Prevalence, and Survival Outcomes in Patients With Neuroendocrine Tumors in the United States. JAMA Oncol. 2017, 3, 1335–1342. [Google Scholar] [CrossRef] [PubMed]
  2. Faggiano, A.; Ferolla, P.; Grimaldi, F.; Campana, D.; Manzoni, M.; Davi, M.V.; Bianchi, A.; Valcavi, R.; Papini, E.; Giuffrida, D.; et al. Natural history of gastro-entero-pancreatic and thoracic neuroendocrine tumors. Data from a large prospective and retrospective Italian epidemiological study: The NET management study. J. Endocrinol. Invest. 2012, 35, 817–823. [Google Scholar] [CrossRef] [PubMed]
  3. Falconi, M.; Eriksson, B.; Kaltsas, G.; Bartsch, D.K.; Capdevila, J.; Caplin, M.; Kos-Kudla, B.; Kwekkeboom, D.; Rindi, G.; Kloppel, G.; et al. ENETS Consensus Guidelines Update for the Management of Patients with Functional Pancreatic Neuroendocrine Tumors and Non-Functional Pancreatic Neuroendocrine Tumors. Neuroendocrinology 2016, 103, 153–171. [Google Scholar] [CrossRef] [PubMed] [Green Version]
  4. Go, V.L.; Srihari, P.; Kamerman Burns, L.A. Nutrition and gastroenteropancreatic neuroendocrine tumors. Endocrinol. Metab. Clin. N. Am. 2010, 39, 827–837. [Google Scholar] [CrossRef] [PubMed]
  5. Gallo, M.; Muscogiuri, G.; Pizza, G.; Ruggeri, R.M.; Barrea, L.; Faggiano, A.; Colao, A.; Group, N. The management of neuroendocrine tumours: A nutritional viewpoint. Crit. Rev. Food Sci. Nutr. 2017, 1–12. [Google Scholar] [CrossRef] [PubMed]
  6. Glazer, E.; Stanko, K.; Ong, E.; Guerrero, M. Decreased Inpatient Mortality in Obese Patients with Abdominal Nets. Endocr. Pract. 2014, 20, 1–20. [Google Scholar] [CrossRef] [PubMed]
  7. Ekeblad, S.; Skogseid, B.; Dunder, K.; Oberg, K.; Eriksson, B. Prognostic factors and survival in 324 patients with pancreatic endocrine tumor treated at a single institution. Clin. Cancer Res. 2008, 14, 7798–7803. [Google Scholar] [CrossRef] [PubMed]
  8. Maasberg, S.; Knappe-Drzikova, B.; Vonderbeck, D.; Jann, H.; Weylandt, K.H.; Grieser, C.; Pascher, A.; Schefold, J.C.; Pavel, M.; Wiedenmann, B.; et al. Malnutrition Predicts Clinical Outcome in Patients with Neuroendocrine Neoplasia. Neuroendocrinology 2017, 104, 11–25. [Google Scholar] [CrossRef] [PubMed] [Green Version]
  9. Marrache, F.; Vullierme, M.P.; Roy, C.; El Assoued, Y.; Couvelard, A.; O’Toole, D.; Mitry, E.; Hentic, O.; Hammel, P.; Levy, P.; et al. Arterial phase enhancement and body mass index are predictors of response to chemoembolisation for liver metastases of endocrine tumours. Br. J. Cancer 2007, 96, 49–55. [Google Scholar] [CrossRef] [PubMed]
  10. Barbosa-Silva, M.C.; Barros, A.J.; Wang, J.; Heymsfield, S.B.; Pierson, R.N., Jr. Bioelectrical impedance analysis: Population reference values for phase angle by age and sex. Am. J. Clin. Nutr. 2005, 82, 49–52. [Google Scholar] [CrossRef] [PubMed]
  11. Norman, K.; Stobaus, N.; Pirlich, M.; Bosy-Westphal, A. Bioelectrical phase angle and impedance vector analysis-clinical relevance and applicability of impedance parameters. Clin. Nutr. 2012, 31, 854–861. [Google Scholar] [CrossRef] [PubMed]
  12. Pascual-Geler, M.; Urquiza-Salvat, N.; Cozar, J.M.; Robles-Fernandez, I.; Rivas, A.; Martinez-Gonzalez, L.J.; Ocana-Peinado, F.M.; Lorente, J.A.; Alvarez-Cubero, M.J. The influence of nutritional factors on prostate cancer incidence and aggressiveness. Aging Male 2018, 21, 31–39. [Google Scholar] [CrossRef] [PubMed]
  13. Buckland, G.; Ros, M.M.; Roswall, N.; Bueno-de-Mesquita, H.B.; Travier, N.; Tjonneland, A.; Kiemeney, L.A.; Sacerdote, C.; Tumino, R.; Ljungberg, B.; et al. Adherence to the Mediterranean diet and risk of bladder cancer in the EPIC cohort study. Int. J. Cancer 2014, 134, 2504–2511. [Google Scholar] [CrossRef] [PubMed]
  14. Escrich, E.; Moral, R.; Solanas, M. Olive oil, an essential component of the Mediterranean diet, and breast cancer. Public Health Nutr. 2011, 14, 2323–2332. [Google Scholar] [CrossRef] [PubMed] [Green Version]
  15. Schwingshackl, L.; Schwedhelm, C.; Galbete, C.; Hoffmann, G. Adherence to Mediterranean Diet and Risk of Cancer: An Updated Systematic Review and Meta-Analysis. Nutrients 2017, 9, 1063. [Google Scholar] [CrossRef] [PubMed]
  16. Kastorini, C.M.; Milionis, H.J.; Esposito, K.; Giugliano, D.; Goudevenos, J.A.; Panagiotakos, D.B. The effect of Mediterranean diet on metabolic syndrome and its components: A meta-analysis of 50 studies and 534,906 individuals. J. Am. Coll. Cardiol. 2011, 57, 1299–1313. [Google Scholar] [CrossRef] [PubMed]
  17. Barrea, L.; Muscogiuri, G.; Macchia, P.E.; Di Somma, C.; Falco, A.; Savanelli, M.C.; Colao, A.; Savastano, S. Mediterranean Diet and Phase Angle in a Sample of Adult Population: Results of a Pilot Study. Nutrients 2017, 9, 151. [Google Scholar] [CrossRef] [PubMed]
  18. Rindi, G.; Arnold, R.; Capella, C.; Klimstra, D.S.; Klöppel, G.; Komminoth, P.; Solcia, E. Nomenclature and classification of digestive neuroendocrine tumours. In World Health Organization Classification of Tumours, Pathology and Genetics of Tumours of the Digestive System; Bosman, F., Lyon, F.C.I., Eds.; IARC: Lyons, France, 2010. [Google Scholar]
  19. Association, A.P. Diagnostic and Statistical Manual of Mental Disorders, 5th ed.; American Psychiatric Association: Washington, DC, USA, 2013. [Google Scholar]
  20. Rindi, G.; Kloppel, G.; Alhman, H.; Caplin, M.; Couvelard, A.; de Herder, W.W.; Erikssson, B.; Falchetti, A.; Falconi, M.; Komminoth, P.; et al. TNM staging of foregut (neuro)endocrine tumors: A consensus proposal including a grading system. Virchows Arch. 2006, 449, 395–401. [Google Scholar] [CrossRef] [PubMed]
  21. Inzani, F.; Petrone, G.; Fadda, G.; Rindi, G. Cyto-histology in NET: What is necessary today and what is the future? Rev. Endocr. Metab. Disord. 2017, 18, 381–391. [Google Scholar] [CrossRef] [PubMed]
  22. Circelli, L.; Sciammarella, C.; Guadagno, E.; Tafuto, S.; del Basso de Caro, M.; Botti, G.; Pezzullo, L.; Aria, M.; Ramundo, V.; Tatangelo, F.; et al. CXCR4/CXCL12/CXCR7 axis is functional in neuroendocrine tumors and signals on mTOR. Oncotarget 2016, 7, 18865–18875. [Google Scholar] [CrossRef] [PubMed] [Green Version]
  23. Eisenhauer, E.A.; Therasse, P.; Bogaerts, J.; Schwartz, L.H.; Sargent, D.; Ford, R.; Dancey, J.; Arbuck, S.; Gwyther, S.; Mooney, M.; et al. New response evaluation criteria in solid tumours: Revised RECIST guideline (version 1.1). Eur. J. Cancer 2009, 45, 228–247. [Google Scholar] [CrossRef] [PubMed]
  24. Barrea, L.; Di Somma, C.; Macchia, P.E.; Falco, A.; Savanelli, M.C.; Orio, F.; Colao, A.; Savastano, S. Influence of nutrition on somatotropic axis: Milk consumption in adult individuals with moderate-severe obesity. Clin. Nutr. 2017, 36, 293–301. [Google Scholar] [CrossRef] [PubMed]
  25. Barrea, L.; Tarantino, G.; Somma, C.D.; Muscogiuri, G.; Macchia, P.E.; Falco, A.; Colao, A.; Savastano, S. Adherence to the Mediterranean Diet and Circulating Levels of Sirtuin 4 in Obese Patients: A Novel Association. Oxid. Med. Cell. Longev. 2017, 2017, 6101254. [Google Scholar] [CrossRef] [PubMed]
  26. Barrea, L.; Macchia, P.E.; Tarantino, G.; Di Somma, C.; Pane, E.; Balato, N.; Napolitano, M.; Colao, A.; Savastano, S. Nutrition: A key environmental dietary factor in clinical severity and cardio-metabolic risk in psoriatic male patients evaluated by 7-day food-frequency questionnaire. J. Transl. Med. 2015, 13, 303. [Google Scholar] [CrossRef] [PubMed] [Green Version]
  27. Barrea, L.; Muscogiuri, G.; Di Somma, C.; Annunziata, G.; Megna, M.; Falco, A.; Balato, A.; Colao, A.; Savastano, S. Coffee consumption, metabolic syndrome and clinical severity of psoriasis: Good or bad stuff? Arch. Toxicol. 2018, 92, 1831–1845. [Google Scholar] [CrossRef] [PubMed]
  28. Turconi, G.; Guarcello, M.; Berzolari, F.G.; Carolei, A.; Bazzano, R.; Roggi, C. An evaluation of a colour food photography atlas as a tool for quantifying food portion size in epidemiological dietary surveys. Eur. J. Clin. Nutr. 2005, 59, 923–931. [Google Scholar] [CrossRef] [PubMed] [Green Version]
  29. Barrea, L.; Balato, N.; Di Somma, C.; Macchia, P.E.; Napolitano, M.; Savanelli, M.C.; Esposito, K.; Colao, A.; Savastano, S. Nutrition and psoriasis: Is there any association between the severity of the disease and adherence to the Mediterranean diet? J. Transl. Med. 2015, 13, 18–27. [Google Scholar] [CrossRef] [PubMed]
  30. Barrea, L.; Muscogiuri, G.; Di Somma, C.; Tramontano, G.; De Luca, V.; Illario, M.; Colao, A.; Savastano, S. Association between Mediterranean diet and hand grip strength in older adult women. Clin. Nutr. 2018. [Google Scholar] [CrossRef] [PubMed]
  31. Savanelli, M.C.; Barrea, L.; Macchia, P.E.; Savastano, S.; Falco, A.; Renzullo, A.; Scarano, E.; Nettore, I.C.; Colao, A.; Di Somma, C. Preliminary results demonstrating the impact of Mediterranean diet on bone health. J. Transl. Med. 2017, 15, 81. [Google Scholar] [CrossRef] [PubMed] [Green Version]
  32. Vuolo, L.; Barrea, L.; Savanelli, M.C.; Savastano, S.; Rubino, M.; Scarano, E.; Soprano, M.; Illario, M.; Colao, A.; Di Somma, C. Nutrition and Osteoporosis: Preliminary data of Campania Region of European PERsonalised ICT Supported Service for Independent Living and Active Ageing. Transl. Med. UniSa. 2015, 13, 13–18. [Google Scholar] [PubMed]
  33. Martinez-Gonzalez, M.A.; Garcia-Arellano, A.; Toledo, E.; Salas-Salvado, J.; Buil-Cosiales, P.; Corella, D.; Covas, M.I.; Schroder, H.; Aros, F.; Gomez-Gracia, E.; et al. A 14-item Mediterranean diet assessment tool and obesity indexes among high-risk subjects: The PREDIMED trial. PLoS ONE 2012, 7, e43134. [Google Scholar] [CrossRef] [PubMed] [Green Version]
  34. World Health Organization. Waist Circumference and Waist–Hip Ratio. Report of a WHO Expert Consultation, Geneva, 8–11 December 2008; World Health Organization: Geneva, Switzerland, 2008. [Google Scholar]
  35. Nishida, C.; Ko, G.T.; Kumanyika, S. Body fat distribution and noncommunicable diseases in populations: Overview of the 2008 WHO Expert Consultation on Waist Circumference and Waist-Hip Ratio. Eur. J. Clin. Nutr. 2010, 64, 2–5. [Google Scholar] [CrossRef] [PubMed]
  36. Yanovski, J.A.; Yanovski, S.Z.; Filmer, K.M.; Hubbard, V.S.; Avila, N.; Lewis, B.; Reynolds, J.C.; Flood, M. Differences in body composition of black and white girls. Am. J. Clin. Nutr. 1996, 64, 833–839. [Google Scholar] [CrossRef] [PubMed] [Green Version]
  37. Barrea, L.; Macchia, P.E.; Di Somma, C.; Napolitano, M.; Balato, A.; Falco, A.; Savanelli, M.C.; Balato, N.; Colao, A.; Savastano, S. Bioelectrical phase angle and psoriasis: A novel association with psoriasis severity, quality of life and metabolic syndrome. J. Transl. Med. 2016, 14, 130–141. [Google Scholar] [CrossRef] [PubMed] [Green Version]
  38. Kyle, U.G.; Bosaeus, I.; De Lorenzo, A.D.; Deurenberg, P.; Elia, M.; Manuel Gomez, J.; Lilienthal Heitmann, B.; Kent-Smith, L.; Melchior, J.C.; Pirlich, M.; et al. Bioelectrical impedance analysis-part II: Utilization in clinical practice. Clin. Nutr. 2004, 23, 1430–1453. [Google Scholar] [CrossRef] [PubMed]
  39. Kushner, R.F. Bioelectrical impedance analysis: A review of principles and applications. J. Am. Coll. Nutr. 1992, 11, 199–209. [Google Scholar] [PubMed]
  40. Altieri, B.; Barrea, L.; Modica, R.; Muscogiuri, G.; Savastano, S.; Colao, A.; Faggiano, A. Nutrition and neuroendocrine tumors: An update of the literature. Rev. Endocr. Metab. Disord. 2018, 19, 159–167. [Google Scholar] [CrossRef] [PubMed]
  41. Milner, J.A. Molecular targets for bioactive food components. J. Nutr. 2004, 134, S2492–S2498. [Google Scholar] [CrossRef] [PubMed]
  42. Gupta, D.; Lis, C.G.; Dahlk, S.L.; Vashi, P.G.; Grutsch, J.F.; Lammersfeld, C.A. Bioelectrical impedance phase angle as a prognostic indicator in advanced pancreatic cancer. Br. J. Nutr. 2004, 92, 957–962. [Google Scholar] [CrossRef] [PubMed] [Green Version]
  43. Gupta, D.; Lammersfeld, C.A.; Vashi, P.G.; King, J.; Dahlk, S.L.; Grutsch, J.F.; Lis, C.G. Bioelectrical impedance phase angle as a prognostic indicator in breast cancer. BMC Cancer 2008, 8, 249. [Google Scholar] [CrossRef] [PubMed]
  44. Toso, S.; Piccoli, A.; Gusella, M.; Menon, D.; Bononi, A.; Crepaldi, G.; Ferrazzi, E. Altered tissue electric properties in lung cancer patients as detected by bioelectric impedance vector analysis. Nutrition 2000, 16, 120–124. [Google Scholar] [CrossRef]
  45. Gupta, D.; Lammersfeld, C.A.; Burrows, J.L.; Dahlk, S.L.; Vashi, P.G.; Grutsch, J.F.; Hoffman, S.; Lis, C.G. Bioelectrical impedance phase angle in clinical practice: Implications for prognosis in advanced colorectal cancer. Am. J. Clin. Nutr. 2004, 80, 1634–1638. [Google Scholar] [CrossRef] [PubMed]
  46. Hu, F.B. Dietary pattern analysis: A new direction in nutritional epidemiology. Curr. Opin. Lipidol. 2002, 13, 3–9. [Google Scholar] [CrossRef] [PubMed]
  47. Hoidrup, S.; Andreasen, A.H.; Osler, M.; Pedersen, A.N.; Jorgensen, L.M.; Jorgensen, T.; Schroll, M.; Heitmann, B.L. Assessment of habitual energy and macronutrient intake in adults: Comparison of a seven day food record with a dietary history interview. Eur. J. Clin. Nutr. 2002, 56, 105–113. [Google Scholar] [CrossRef] [PubMed]
Figure 1. Flow chart of the studied subjects. A total of 83 patients affected by well differentiated GEP-NET G1/G2 selected from 172 patients with NET attending the ENETS Centers of Excellence Multidisciplinary Group for Neuroendocrine Tumors, University “Federico II”, Naples. Abbreviation: NET, Neuroendocrine Tumor; GEP-NET, Gastroenteropancreatic NET; MTC, medullary thyroid cancer; Pheo/PPG, Pheochromocytoma/paraganglioma; ENETS, European Neuroendocrine Tumor Society.
Nutrients 10 01854 g001
Figure 2. Adherence to the Mediterranean Diet according to PREDIMED categories in GEP-NET patients classified by tumor grade G1/G2 (A), stage (B), and disease status (C). Abbreviation: GEP-NET, Gastroenteropancreatic Neuroendocrine Tumor; PREDIMED, PREvención con DIeta MEDiterránea; MD, Mediterranean Diet.
Nutrients 10 01854 g002
Figure 3. ROC analysis was performed to determine the cut off values of the PREDIMED score (A) and PhA (B) predictive for the evaluation of increased risk of grading G2 Abbreviation: PREDIMED, PREvención con DIeta MEDiterránea; PhA, phase angle; ROC, Receiver operator characteristic.
Nutrients 10 01854 g003
Figure 4. ROC analysis to determine the cut off values of the PREDIMED score for the evaluation of increased risk of metastases (A) and progressive disease (B). Abbreviation: PREDIMED, PREvención con DIeta MEDiterránea; PhA, phase angle; ROC, Receiver operator characteristic.
Nutrients 10 01854 g004
Table 1. Demographic, clinical, metabolic, and bioelectrical parameters of GEP-NET patients compared to controls.
ParametersGEP-NET Patients
n. 83
Control Group
n. 83
p-Value
Clinical characteristics
Gender-male
Age-mean (range)
 
40 (48.2%)
56 (18–80)
 
40 (48.2%)
57 (23–82)
 
0.877 (χ2 = 0.02)
0.307
Lifestyle Habits
Smoking-yes
Physical activity-yes
 
32 (38.6%)
41 (49.4%)
 
51 (61.4%)
45 (54.2%)
 
0.0052 = 7.81)
0.986 (χ2 = 0.00)
Anthropometric measurement
BMI (kg/m2)
WC (cm)
 
27.79 ± 5.57
92.76 ± 15.38
 
27.54 ± 2.84
87.92 ± 10.66
 
0.859
0.050
Blood pressure
SBP (mmHg)
DBP (mmHg)
 
123.79 ± 12.16
76.99 ± 7.99
 
118.49 ± 11.93
73.86 ± 6.87
 
0.010
0.007
Metabolic profile
Fasting Glucose (mg/dL)109.52 ± 16.5189.29 ± 11.72<0.001
Total cholesterol (mg/dL)194.83 ± 41.19149.08 ± 22.41<0.001
HDL cholesterol (mg/dL)44.43 ± 14.3550.45 ± 8.67<0.001
LDL cholesterol (mg/dL)123.35 ± 40.8577.20 ± 25.00<0.001
Triglycerides (mg/dL)135.23 ± 47.81107.22 ± 26.57<0.001
Bioelectrical variables
R (Ω)514.23 ± 80.21523.54 ± 59.990.279
Xc (Ω)42.31 ± 9.5052.19 ± 8.13<0.001
PhA (°)4.73 ± 0.885.70 ± 0.55<0.001
PhA (°) males4.69 ± 0.865.76 ± 0.60<0.001
PhA (°) females4.76 ± 0.915.65 ± 0.52<0.001
A p value in bold type denotes a significant difference (p < 0.05). Abbreviation: GEP-NET, Gastroenteropancreatic Neuroendocrine Tumor; BMI, Body Mass Index; WC, Waist Circumference; SBP, Systolic Blood Pressure; DBP, Diastolic Blood Pressure; HDL, High-Density Lipoprotein; LDL, Low-Density Lipoprotein; R, Resistance; Xc, Reactance; PhA, Phase angle.
Table 2. Response frequency of dietary components included in the PREDIMED questionnaire of the GEP-NET patients and control group.
Questions of PREDIMED QuestionnaireGEP-NET
Patients
n. 83
Control
Group
n. 83
n%n%χ2p-Values
Use of extra virgin olive oil as main culinary lipid7894.07995.20.001.000
Extra virgin olive oil >4 tablespoons4959.05262.70.100.751
Vegetables ≥2 servings/day3036.14959.07.830.005
Fruits ≥3 servings/day2732.55060.211.720.001
Red/processed meats <1/day2530.14149.45.660.017
Butter, cream, margarine <1/day6375.94048.212.380.001
Soda drinks <1/day3441.05465.18.730.003
Wine glasses ≥7/week1416.92934.96.150.013
Legumes ≥3/week3845.83744.60.001.000
Fish/seafood ≥3/week1821.73643.47.930.005
Commercial sweets and confectionery ≤2/week4351.83947.00.220.641
Tree nuts ≥3/week2024.13339.821.14<0.001
Poultry more than red meats4149.44351.80.020.876
Use of sofrito sauce ≥2/week3339.83137.30.030.873
PREDIMED categories
Low adherence to the MD3036.12833.70.030.870
Average adherence to the MD4959.03339.85.420.019
High adherence to the MD44.82226.513.180.001
A p value in bold type denotes a significant difference (p < 0.05). Abbreviation: GEP-NET, Gastroenteropancreatic Neuroendocrine Tumor; PREDIMED, PREvención con DIeta MEDiterránea; MD, Mediterranean Diet.
Table 3. Demographic, clinical, metabolic, and bioelectrical parameters in the GEP-NET patients according to tumor grading and stage.
ParametersG1
n. 48
G2
n. 35
p-ValueStage I-III (Localized Disease)
n. 61
Stage IV (Metastases)
n. 22
p-Value
Age (years)54.85 ± 17.3159.14 ± 12.640.10355.72 ± 16.8259.27 ± 11.370.123
Anthropometric measurement
BMI (kg/m2)27.09 ± 5.8928.74 ± 5.010.14127.23 ± 5.7729.31 ± 4.750.081
WC (cm)90.29 ± 14.9996.15 ± 15.460.09290.72 ± 15.4298.41 ± 14.050.032
Blood pressure
SBP (mmHg)121.04 ± 11.39127.57 ± 12.320.017121.89 ± 12.08129.09 ± 10.980.014
DBP (mmHg)75.83 ± 7.8878.57 ± 8.000.13076.15 ± 7.2779.32 ± 9.540.213
Metabolic profile
Fasting Glucose (mg/dL)104.38 ± 15.61116.57 ± 15.230.001106.26 ± 16.32118.54 ± 13.640.001
Total cholesterol (mg/dL)177.54 ± 28.14218.54 ± 44.67<0.001186.74 ± 37.16217.27 ± 44.260.009
HDL cholesterol (mg/dL)46.97 ± 11.7740.94 ± 16.830.00747.00 ± 13.9437.31 ± 13.270.002
LDL cholesterol (mg/dL)106.02 ± 27.74147.13 ± 44.21<0.001114.99 ± 35.51146.55 ± 46.310.013
Triglycerides (mg/dL)122.73 ± 37.34152.37 ± 55.330.050123.75 ± 41.61167.05 ± 50.360.003
Bioelectrical variables
R (Ω)502.08 ± 75.14530.89 ± 84.950.125511.97 ± 79.39520.50 ± 84.010.693
Xc (Ω)45.89 ± 7.5637.40 ± 9.78<0.00143.70 ± 8.0938.45 ± 12.020.008
PhA (°)5.26 ± 0.624.00 ± 0.65<0.0014.93 ± 0.804.16 ± 0.86<0.001
Nutritional assessment
PREDIMED score7.56 ± 1.284.29 ± 1.87<0.0016.69 ± 2.054.77 ± 2.22<0.001
Total energy (kcal)2223.29 ± 235.672307.88 ± 235.470.1072256.96 ± 231.392264.49 ± 260.660.943
Protein (g of total kcal)94.59 ± 12.21101.77 ± 16.080.02696.21 ± 12.29101.55 ± 18.660.191
Animal (g of total kcal)70.31 ± 11.5473.77 ± 10.250.12971.68 ± 11.1171.99 ± 11.260.903
Plant (g of total kcal)24.29 ± 10.0128.01 ± 14.320.23624.52 ± 10.4229.54 ± 15.510.178
Carbohydrate (g of total kcal)300.19 ± 36.57308.89 ± 34.060.246304.80 ± 36.50301.25 ± 33.580.706
Complex (g of total kcal)188.41 ± 23.05190.63 ± 22.830.633190.53 ± 23.27186.06 ± 21.800.431
Simple (g of total kcal)111.78 ± 15.77118.27 ± 14.010.040114.27 ± 15.53115.19 ± 15.020.785
Fat (gr of total kcal)71.57 ± 7.6073.91 ± 9.570.27572.55 ± 7.6672.59 ± 10.730.879
SFA (g of total kcal)25.79 ± 5.1626.80 ± 10.300.66426.03 ± 6.5526.72 ± 10.460.829
MUFA (g of total kcal)30.94 ± 3.6531.34 ± 3.500.58731.12 ± 3.3631.07 ± 4.190.877
PUFA (g of total kcal)14.84 ± 3.9415.77 ± 5.800.56615.39 ± 5.3414.79 ± 2.900.791
n-6 PUFA (g/day)7.64 ± 3.588.83 ± 4.860.1738.21 ± 4.657.96 ± 2.570.500
n-3 PUFA (g/day)7.20 ± 1.596.94 ± 1.980.4157.18 ± 1.676.83 ± 1.990.299
A p value in bold type denotes a significant difference (p < 0.05). Abbreviation: GEP-NET, Gastroenteropancreatic Neuroendocrine Tumor; G, grading; BMI, Body Mass Index; WC, Waist Circumference; SBP, Systolic Blood Pressure; DBP, Diastolic Blood Pressure; HDL, High-Density Lipoprotein; LDL, Low-Density Lipoprotein; R, Resistance; Xc, Reactance; PhA, Phase angle; PREDIMED, PREvención con DIeta MEDiterránea; SFA, Saturated Fatty Acids; MUFA, MonoUnsaturated Fatty Acids; PUFA, PolyUnsaturated Fatty Acids.
Table 4. Demographic, clinical, metabolic and bioelectrical parameters in the GEP-NET patients according to disease status.
ParametersDisease Status
Free of the Disease
n. 34
Stable Disease
n. 28
Progressive Disease
n. 21
p-Value
Age (years)55.61 ± 17.3357.71 ± 15.2356.95 ± 13.510.720
Anthropometric measurement
BMI (kg/m2)27.21 ± 4.9427.54 ± 6.7229.06 ± 4.830.411
WC (cm)90.93 ± 16.2092.36 ± 14.4496.26 ± 15.360.458
Blood pressure
SBP (mmHg)123.08 ± 12.55121.79 ± 11.07127.62 ± 12.160.256
DBP (mmHg)76.02 ± 7.6677.14 ± 7.7578.33 ± 8.990.631
Metabolic profile
Fasting Glucose (mg/dL)105.38 ± 12.99106.82 ± 16.87119.81 ± 17.420.005
Total cholesterol (mg/dL)195.67 ± 41.66178.64 ± 32.72215.05 ± 42.990.017
HDL cholesterol (mg/dL)42.15 ± 13.9449.18 ± 12.4341.81 ± 14.350.035
LDL cholesterol (mg/dL)126.23 ± 38.67105.35 ± 33.54142.70 ± 44.650.012
Triglycerides (mg/dL)136.50 ± 41.33120.57 ± 38.41152.71 ± 62.740.327
Bioelectrical variables
R (Ω)512.71 ± 83.84507.61 ± 73.76525.52 ± 85.060.767
Xc (Ω)41.65 ± 9.8845.79 ± 7.7638.76 ± 9.840.025
PhA (°)4.66 ± 0.825.19 ± 0.714.22 ± 0.91<0.001
Nutritional assessment
PREDIMED score6.91 ± 2.256.54 ± 1.794.52 ± 2.02<0.001
Total energy (kcal)2256.94 ± 257.142254.24 ± 204.662268.51 ± 257.360.983
Protein (g of total kcal)96.82 ± 13.5097.39 ± 14.1399.22 ± 16.360.855
Animal (g of total kcal)71.87 ± 10.0671.94 ± 10.9871.37 ± 13.180.948
Plant (g of total kcal)24.96 ± 10.6225.44 ± 10.9827.85 ± 15.630.752
Carbohydrate (g of total kcal)302.62 ± 37.01303.83 ± 30.79305.91 ± 40.540.954
Complex (g of total kcal)188.00 ± 23.11189.85 ± 19.44190.84 ± 27.260.902
Simple (g of total kcal)114.61 ± 15.60113.98 ± 14.46115.07 ± 16.620.979
Fat (g of total kcal)73.24 ± 9.4972.15 ± 6.6972.00 ± 9.310.868
SFA (g of total kcal)27.26 ± 7.8725.67 ± 5.1225.24 ± 10.170.380
MUFA (g of total kcal)30.88 ± 3.7631.40 ± 3.2231.10 ± 3.860.824
PUFA (g of total kcal)15.10 ± 6.1215.08 ± 2.9615.65 ± 4.530.653
n-6 PUFA (gr/day)7.99 ± 5.087.71 ± 2.778.97 ± 4.210.385
n-3 PUFA (gr/day)7.11 ± 1.997.38 ± 1.036.68 ± 2.100.280
A p value in bold type denotes a significant difference (p < 0.05). Abbreviation: GEP-NET, Gastroenteropancreatic Neuroendocrine Tumor; BMI, Body Mass Index; WC, Waist Circumference; SBP, Systolic Blood Pressure; DBP, Diastolic Blood Pressure; HDL, High-Density Lipoprotein; LDL, Low-Density Lipoprotein; R, Resistance; Xc, Reactance; PhA, Phase angle; PREDIMED, PREvención con DIeta MEDiterránea; SFA, Saturated Fatty Acids; MUFA, MonoUnsaturated Fatty Acids; PUFA, PolyUnsaturated Fatty Acids.
Table 5. Bivariate proportional odds ratio model performed to assess the association of tumor aggressiveness with demographic, clinical, metabolic, and bioelectrical parameters.
ParametersGrading G2Stage IV (Metastases)
ORp-Value95% CIR2ORp-Value95% CIR2
Age (years)1.020.2170.99–1.050.0191.020.3590.98–1.050.010
Anthropometric measurement
BMI (kg/m2)1.060.1910.97–1.150.0211.070.1450.98–1.170.026
WC (cm)0.070.0490.99–1.060.0361.030.0491.00– 1.070.048
Blood pressure
SBP (mmHg)1.050.0181.01–1.090.0711.050.0201.00–1.100.069
DBP (mmHg)1.040.1250.99–1.110.0291.050.1140.99–1.120.031
Metabolic profile
Fasting Glucose (mg/dL)1.060.0021.02–1.090.1361.050.0051.01–1.090.108
Total cholesterol (mg/dL)1.03<0.0011.02–1.050.2411.020.0041.00–1.040.108
HDL cholesterol (mg/dL)0.970.0440.94–1.000.0450.930.0110.88–0.980.105
LDL cholesterol (mg/dL)1.03<0.0011.02–1.050.2421.020.0031.00–1.040.114
Triglycerides (mg/dL)1.010.0071.00–1.030.0941.020.0011.00–1.040.157
Bioelectical variables
R (Ω)1.000.1090.99–1.010.0321.000.6670.99–1.000.002
Xc (Ω)0.88<0.0010.83–0.950.2000.940.0310.89–0.990.060
PhA (°)0.01<0.0010.01–0.080.5290.310.0010.15–0.640.149
Nutritional assessment
PREDIMED score0.31<0.0010.19–0.500.4860.660.0010.51–0.850.137
Total energy (kcal)1.000.1131.00–1.010.0311.000.8980.99–1.000.000
Protein (g of total kcal)1.010.0291.00–1.070.0611.020.0420.99–1.060.026
Animal (g of total kcal)1.030.1640.98–1.070.0241.000.9090.96–1.050.000
Plant (g of total kcal)1.030.1710.99–1.070.0231.030.0020.99–1.080.033
Carbohydrate (g of total kcal)1.000.2720.99–1.020.0150.990.6860.98–1.010.002
Complex (g of total kcal)1.000.6610.98–1.020.0020.990.4300.97–1.010.008
Simple (g of total kcal)1.030.0420.99–1.060.0441.000.8080.97–1.040.001
Fat (gr of total kcal)1.030.2180.98–1.090.0191.000.9830.95–1.060.000
SFA (g of total kcal)1.020.5550.96–1.080.0041.010.1360.95–1.080.002
MUFA (g of total kcal)1.030.6100.91–1.170.0030.990.9540.87–1.140.000
PUFA (g of total kcal)1.040.391 0.95–1.140.0090.970.6140.87–1.090.003
n-6 PUFA (g/day)1.070.0810.96–1.200.0200.990.8070.87–1.110.001
n-3 PUFA (g/day)0.920.5020.71–1.180.0050.890.4280.68–1.180.008
A p value in bold type denotes a significant difference (p < 0.05). Abbreviation: BMI, Body Mass Index; WC, Waist Circumference; SBP, Systolic Blood Pressure; DBP, Diastolic Blood Pressure; HDL, High-Density Lipoprotein; LDL, Low-Density Lipoprotein; R, Resistance; Xc, Reactance; PhA, Phase angle; PREDIMED, PREvención con DIeta MEDiterránea; SFA, Saturated Fatty Acids; MUFA, MonoUnsaturated Fatty Acids; PUFA, PolyUnsaturated Fatty Acids; OR, Odds Ratio; IC, Interval Confidence.
Table 6. Multinomial logistic regression model to assess the association between disease status with age, anthropometric measurement, blood pressure, metabolic profile, bioelectrical variables and nutritional assessment.
Progressive Disease
Parametersχ2p ValueAIC
Age (years)107.350.054201.30
Anthropometric measurement
BMI (kg/m2)176.490.125317.39
WC (cm)156.710.033266.41
Blood pressure
SBD (mmHg)28.640.05075.82
DBD (mmHg)23.060.02756.61
Metabolic profile
Fasting Glucose (mg/dL)116.570.043215.48
Total cholesterol (mg/dL)140.080.220277.92
HDL cholesterol (mg/dL)109.250.011187.09
LDL cholesterol (mg/dL)168.170.147309.55
Triglycerides (mg/dL)159.850.030269.70
Bioelectical variables
R (Ω)156.030.233303.33
Xc (Ω)82.000.088173.49
PhA (°)85.710.010154.83
Nutritional assessment
PREDIMED score32.240.00570.80
Total energy (kcal)173.720.217326.77
Protein (g of total kcal)179.260.196332.00
Animal (g of total kcal)179.230.195332.01
Plant (g of total kcal)179.250.197331.09
Carbohydrate (g of total kcal)178.250.196332.08
Complex (g of total kcal)179.260.199332.00
Simple (g of total kcal)176.260.191331.00
Fat (g of total kcal)173.720.217326.77
SFA (g of total kcal)176.480.206329.38
MUFA (g of total kcal)173.720.217326.77
PUFA (g of total kcal)176.490.176325.39
n-6 PUFA (gr/day)176.500.206329.39
n-3 PUFA (gr/day)176.480.085309.38
A p value in bold type denotes a significant difference (p < 0.05). Abbreviation: BMI, Body Mass Index; WC, Waist Circumference; SBP, Systolic Blood Pressure; DBP, Diastolic Blood Pressure; HDL, High-Density Lipoprotein; LDL, Low-Density Lipoprotein; R, Resistance; Xc, Reactance; PhA, Phase angle; PREDIMED, PREvención con DIeta MEDiterránea; SFA, Saturated Fatty Acids; MUFA, MonoUnsaturated Fatty Acids; PUFA, PolyUnsaturated Fatty Acids.
Table 7. Multiple regression analysis models (stepwise method) with tumor aggressiveness and nutritional parameters.
ParametersMultiple Regression Analysis
Model 1–Tumor Grading-R2βtp value
PREDIMED score0.591−0.724−9.45<0.001
PhA (°)0.595−0.394−4.04<0.001
Simple carbohydrate (g of total kcal)0.6290.1942.880.005
LDL cholesterol (mg/dL)0.6460.1712.190.031
Variable excluded: WC, SBP, fasting Glucose, total cholesterol, HDL cholesterol, triglycerides, Xc, protein (g of total kcal).
Model 2–Tumor Stage-R2βtp value
Triglycerides (mg/dL)0.1510.4023.95<0.001
PREDIMED score0.232−0.306−3.080.003
Variable excluded: WC, SBP, DBP, fasting Glucose, HDL cholesterol, PhA.
Model 3–Disease Status-R2βtp value
PREDIMED score0.152−0.403−3.96<0.001
Variable excluded: WC, SBP, DBP, fasting Glucose, HDL cholesterol, triglycerides, PhA.
A p value in bold type denotes a significant difference (p < 0.05). Abbreviation: PREDIMED, PREvención con DIeta MEDiterránea; PhA, Phase angle; LDL, Low-Density Lipoprotein; WC, Waist Circumference; SBP, Systolic Blood Pressure; HDL, High-Density Lipoprotein; Xc, Reactance; DBP, Diastolic Blood Pressure.

