
Antibacterial Activity, Antioxidant Effect and Chemical Composition of Propolis from the Región del Maule, Central Chile

 ,
,  ,
,
Abstract
: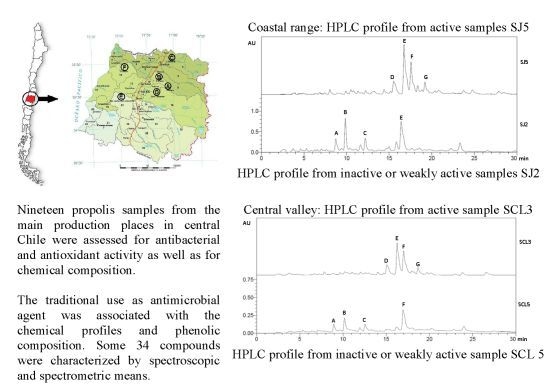
1. Introduction
2. Results and Discussion
2.1. Antibacterial Activity
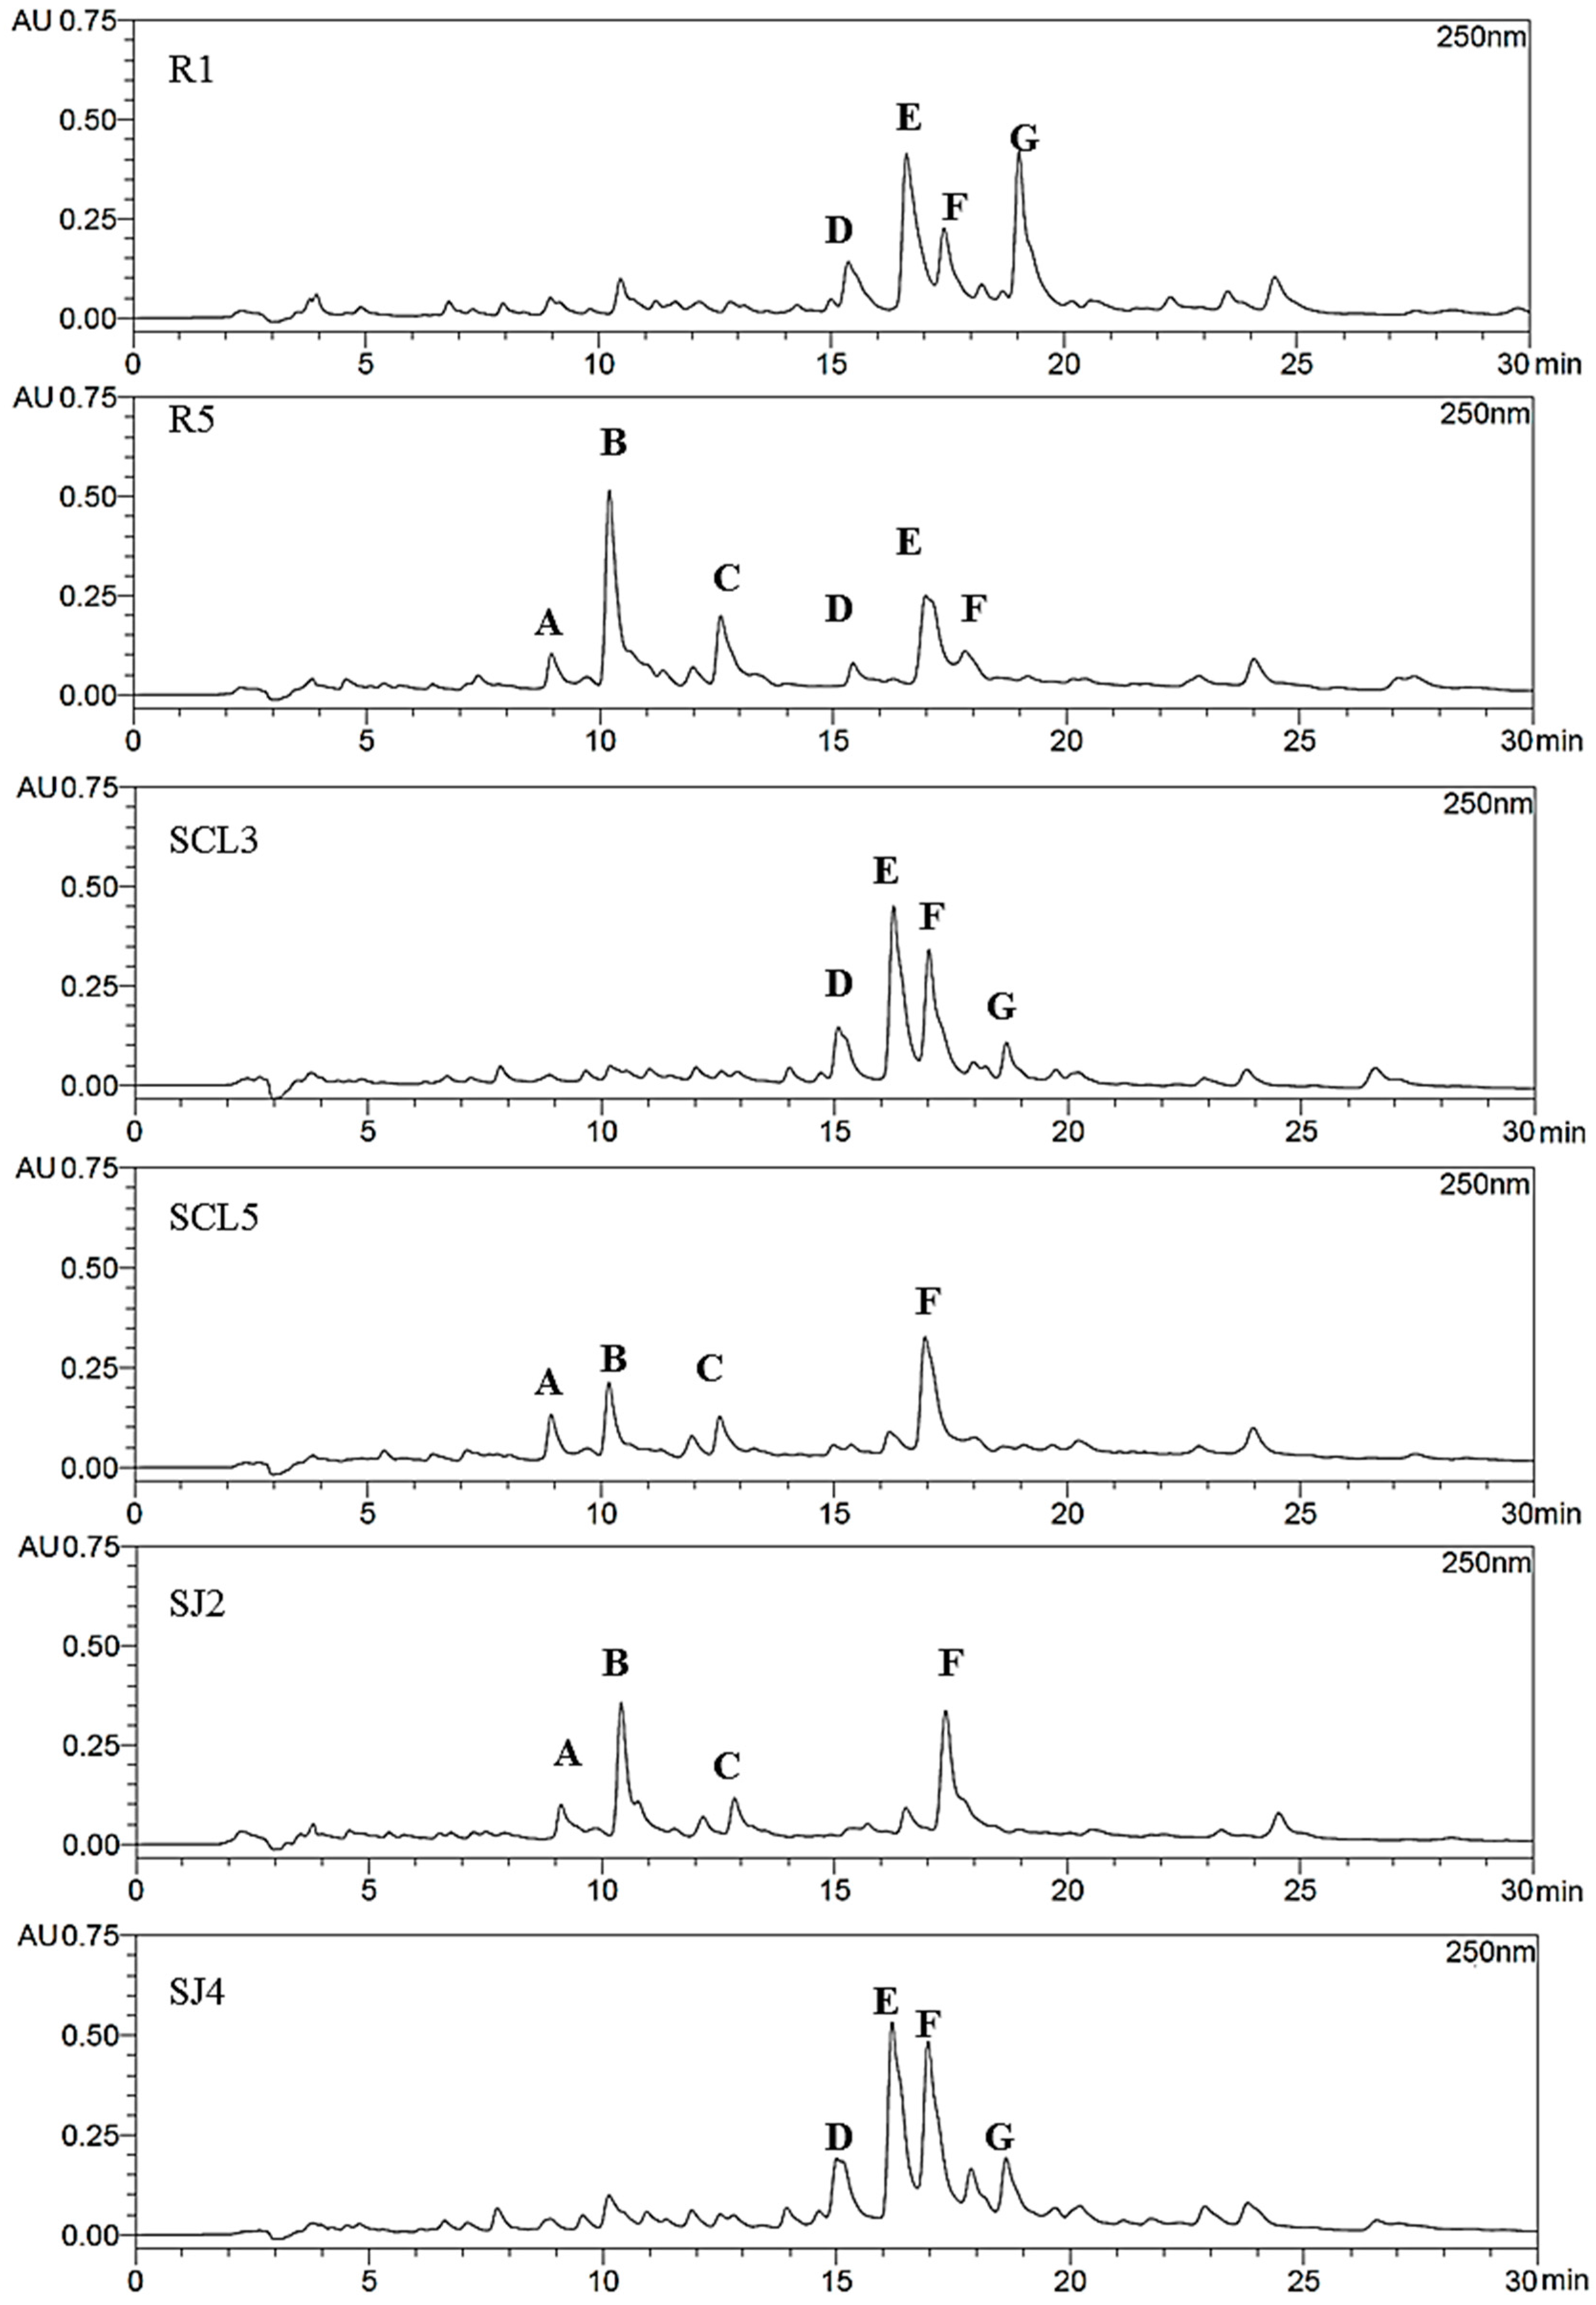
Antimicrobial Activity and Propolis Fingerprint

| Propolis Sample | Microorganisms a | |||||||||||
|---|---|---|---|---|---|---|---|---|---|---|---|---|
| Gram (+) | Gram (−) | |||||||||||
| 1 | 2 | 3 | 4 | 5 | 6 | 7 | 8 | 9 | 10 | 11 | ||
| Andean slopes | ||||||||||||
| Romeral 1 | 500 | 125 | 31.2 | 250 | 62.5 | 125 | 125 | 125 | 62.5 | 125 | 500 | |
| Romeral 2 | 250 | 125 | 62.5 | 250 | 62.5 | 125 | 62.5 | 125 | 62.5 | 250 | >1000 | |
| Romeral3 | 500 | 250 | 125 | 250 | 250 | 250 | 250 | 250 | 250 | 250 | 500 | |
| Romeral 4 | 125 | 125 | 62.5 | 500 | 125 | 125 | 125 | 125 | 125 | 250 | >1000 | |
| Romeral 5 | 1000 | 500 | 500 | 500 | 1000 | 500 | 500 | 250 | 500 | 500 | >1000 | |
| Vilches | 125 | 125 | 62.5 | 250 | 125 | 250 | 125 | 62.5 | 125 | 125 | 250 | |
| Central valley | ||||||||||||
| Cumpeo | 250 | 125 | 31.2 | 125 | 62.5 | 62.5 | 62.5 | 62.5 | 62.5 | 125 | 250 | |
| San Clemente 1 | 500 | 250 | 125 | 1000 | 250 | 250 | 250 | 250 | 250 | 250 | 500 | |
| San Clemente 2 | 125 | 250 | 31.2 | 1000 | 125 | 125 | 125 | 62.5 | 62.5 | 250 | 500 | |
| San Clemente 3 | 62.5 | 125 | 62.5 | 250 | 62.5 | 62.5 | 62.5 | 250 | 62.5 | 62.5 | 500 | |
| San Clemente 4 | 62.5 | 62.5 | 62.5 | 1000 | 125 | 250 | 125 | 62.5 | 125 | 125 | 250 | |
| San Clemente 5 | 500 | 125 | 1000 | >1000 | >1000 | 1000 | 500 | 250 | >1000 | 500 | 1000 | |
| Coastal area | ||||||||||||
| Curepto 1 | 125 | 125 | 125 | 500 | 125 | 250 | 125 | 125 | 125 | 125 | 500 | |
| Curepto 2 | 62.5 | 125 | 125 | 500 | 125 | 250 | 250 | 125 | 500 | 500 | 500 | |
| San Javier 1 | 125 | 250 | 62.5 | >1000 | 125 | 125 | 250 | 125 | 125 | 250 | >1000 | |
| San Javier 2 | >1000 | >1000 | 62.5 | >1000 | 500 | 500 | 1000 | 500 | >1000 | 500 | 1000 | |
| San Javier 3 | 500 | 250 | 125 | 250 | 250 | 250 | 250 | 250 | 250 | 250 | 500 | |
| San Javier 4 | 62.5 | 125 | 62.5 | 1000 | 125 | 125 | 62.5 | 125 | 125 | 250 | 500 | |
| San Javier 5 | 125 | 62.5 | 31.2 | 250 | 125 | 125 | 62.5 | 125 | 62.5 | 500 | 500 | |
| Cefotaxime | 0.5 | 0.5 | 0.5 | 5.0 | 0.5 | 0.5 | 7.5 | 0.5 | 12.5 | 0.5 | 0.05 | |


2.2. Total Phenolic, Total Flavonoid Content and Antioxidant Activity
2.3. Isolation of New Propolis Constituents
| Propolis Sample | % (w/w) Extraction Yield | Total Phenolics (g Gallic Acid Equivalents/100 g MeOH Extract) | Total Flavonoids (g Catechin Equivalents/100g MeOH Extract) | DPPH (SC50 in µg/mL or % Inhibition at 100 µg/mL) | FRAP (µmol Trolox Equivalents/g MeOH Extract) | TEAC (µM Trolox Equivalents/g MeOH Extract) |
|---|---|---|---|---|---|---|
| Andean slopes | ||||||
| Romeral 1 | 49.60 | 20.15 ± 0.71 | 13.95 ± 0.65 | 16.16 ± 1.87 | 1093.91 ± 63.85 | 1968.20 |
| Romeral 2 | 43.21 | 17.29 ± 0.96 | 11.09 ± 1.92 | 20.06 ± 0.80 | 866.81 ± 47.71 | 1876.35 |
| Romeral3 | 67.68 | 17.78 ± 1.04 | 8.80 ± 0.55 | 42.68 ± 0.65 | 1133.45 ± 51.81 | 2216.85 |
| Romeral 4 | 43.86 | 20.69 ± 0.15 | 14.03 ± 1.57 | 18.93 ± 1.00 | 1066.18 ± 52.19 | 2328.66 |
| Romeral 5 | 51.76 | 12.16 ± 0.41 | 5.01 ± 0.20 | 86.94 ± 1.47 | 806.87 ±35.16 | 1718.38 |
| Vilches | 49.36 | 18.27 ± 0.86 | 11.01 ± 0.61 | 24.68 ± 1.84 | 843.16 ± 55.49 | 2230.17 |
| Central valley | ||||||
| Cumpeo | 76.85 | 20.84 ± 0.55 | 13.27 ±1.94 | 15.45 ± 0.89 | 958.95 ± 44.39 | 2000.37 |
| San Clemente 1 | 67.21 | 16.72 ± 1.72 | 4.65 ± 0.17 | 51.51 ± 1.47 | 1032.34 ± 36.04 | 1730.21 |
| San Clemente 2 | 78.13 | 17.34 ± 1.10 | 9.86 ± 0.51 | 20.10 ± 1.18 | 1029.89 ± 47.67 | 1583.85 |
| San Clemente 3 | 58.85 | 19.79 ± 0.44 | 7.52 ± 0.70 | Inactive | Inactive | 1347.61 |
| San Clemente 4 | 77.27 | 20.11 ± 0.75 | 1.72 ± 0.21 | 24.82% ± 0.91% | Inactive | 1922.57 |
| San Clemente 5 | 78.65 | 18.11 ± 0.21 | 3.67 ± 0.20 | 58.51 ± 1.50 | 1151.39 ± 65.19 | 2136.81 |
| Coastal area | ||||||
| Curepto 1 | 54.38 | 15.28 ± 0.03 | 4.60 ± 0.20 | 71.65 ± 1.67 | 742.05 ± 33.93 | 2107.04 |
| Curepto 2 | 55.84 | 18.75 ± 0.82 | 9.33 ± 0.48 | 29.70 ± 1.01 | 1101.65 ± 52.98 | 2212.13 |
| San Javier 1 | 47.57 | 14.69 ± 0.29 | 5.03 ± 0.06 | 70.90 ± 1.61 | 810.13 ± 31.29 | 1763.19 |
| San Javier 2 | 39.53 | 11.49 ± 0.05 | 4.96 ± 0.43 | 91.84 ± 1.63 | 667.43 ± 42.38 | 870.64 |
| San Javier 3 | 78.89 | 18.51 ± 0.65 | 8.07 ± 0.58 | 31.13 ± 0.97 | 1241.91± 46.71 | 2146.35 |
| San Javier 4 | 69.21 | 19.62 ± 0.72 | 9.60 ± 1.30 | 10.29 ± 1.17 | 1745.03± 124.41 | 1606.90 |
| San Javier 5 | 61.11 | 19.83 ± 0.66 | 10.34 ± 1.09 | 24.11 ± 2.42 | 836.23 ± 15.49 | 1745.33 |
| Quercetin | 7.82 ± 0.30 | 10769.85 ± 164.33 | 8157.90 |
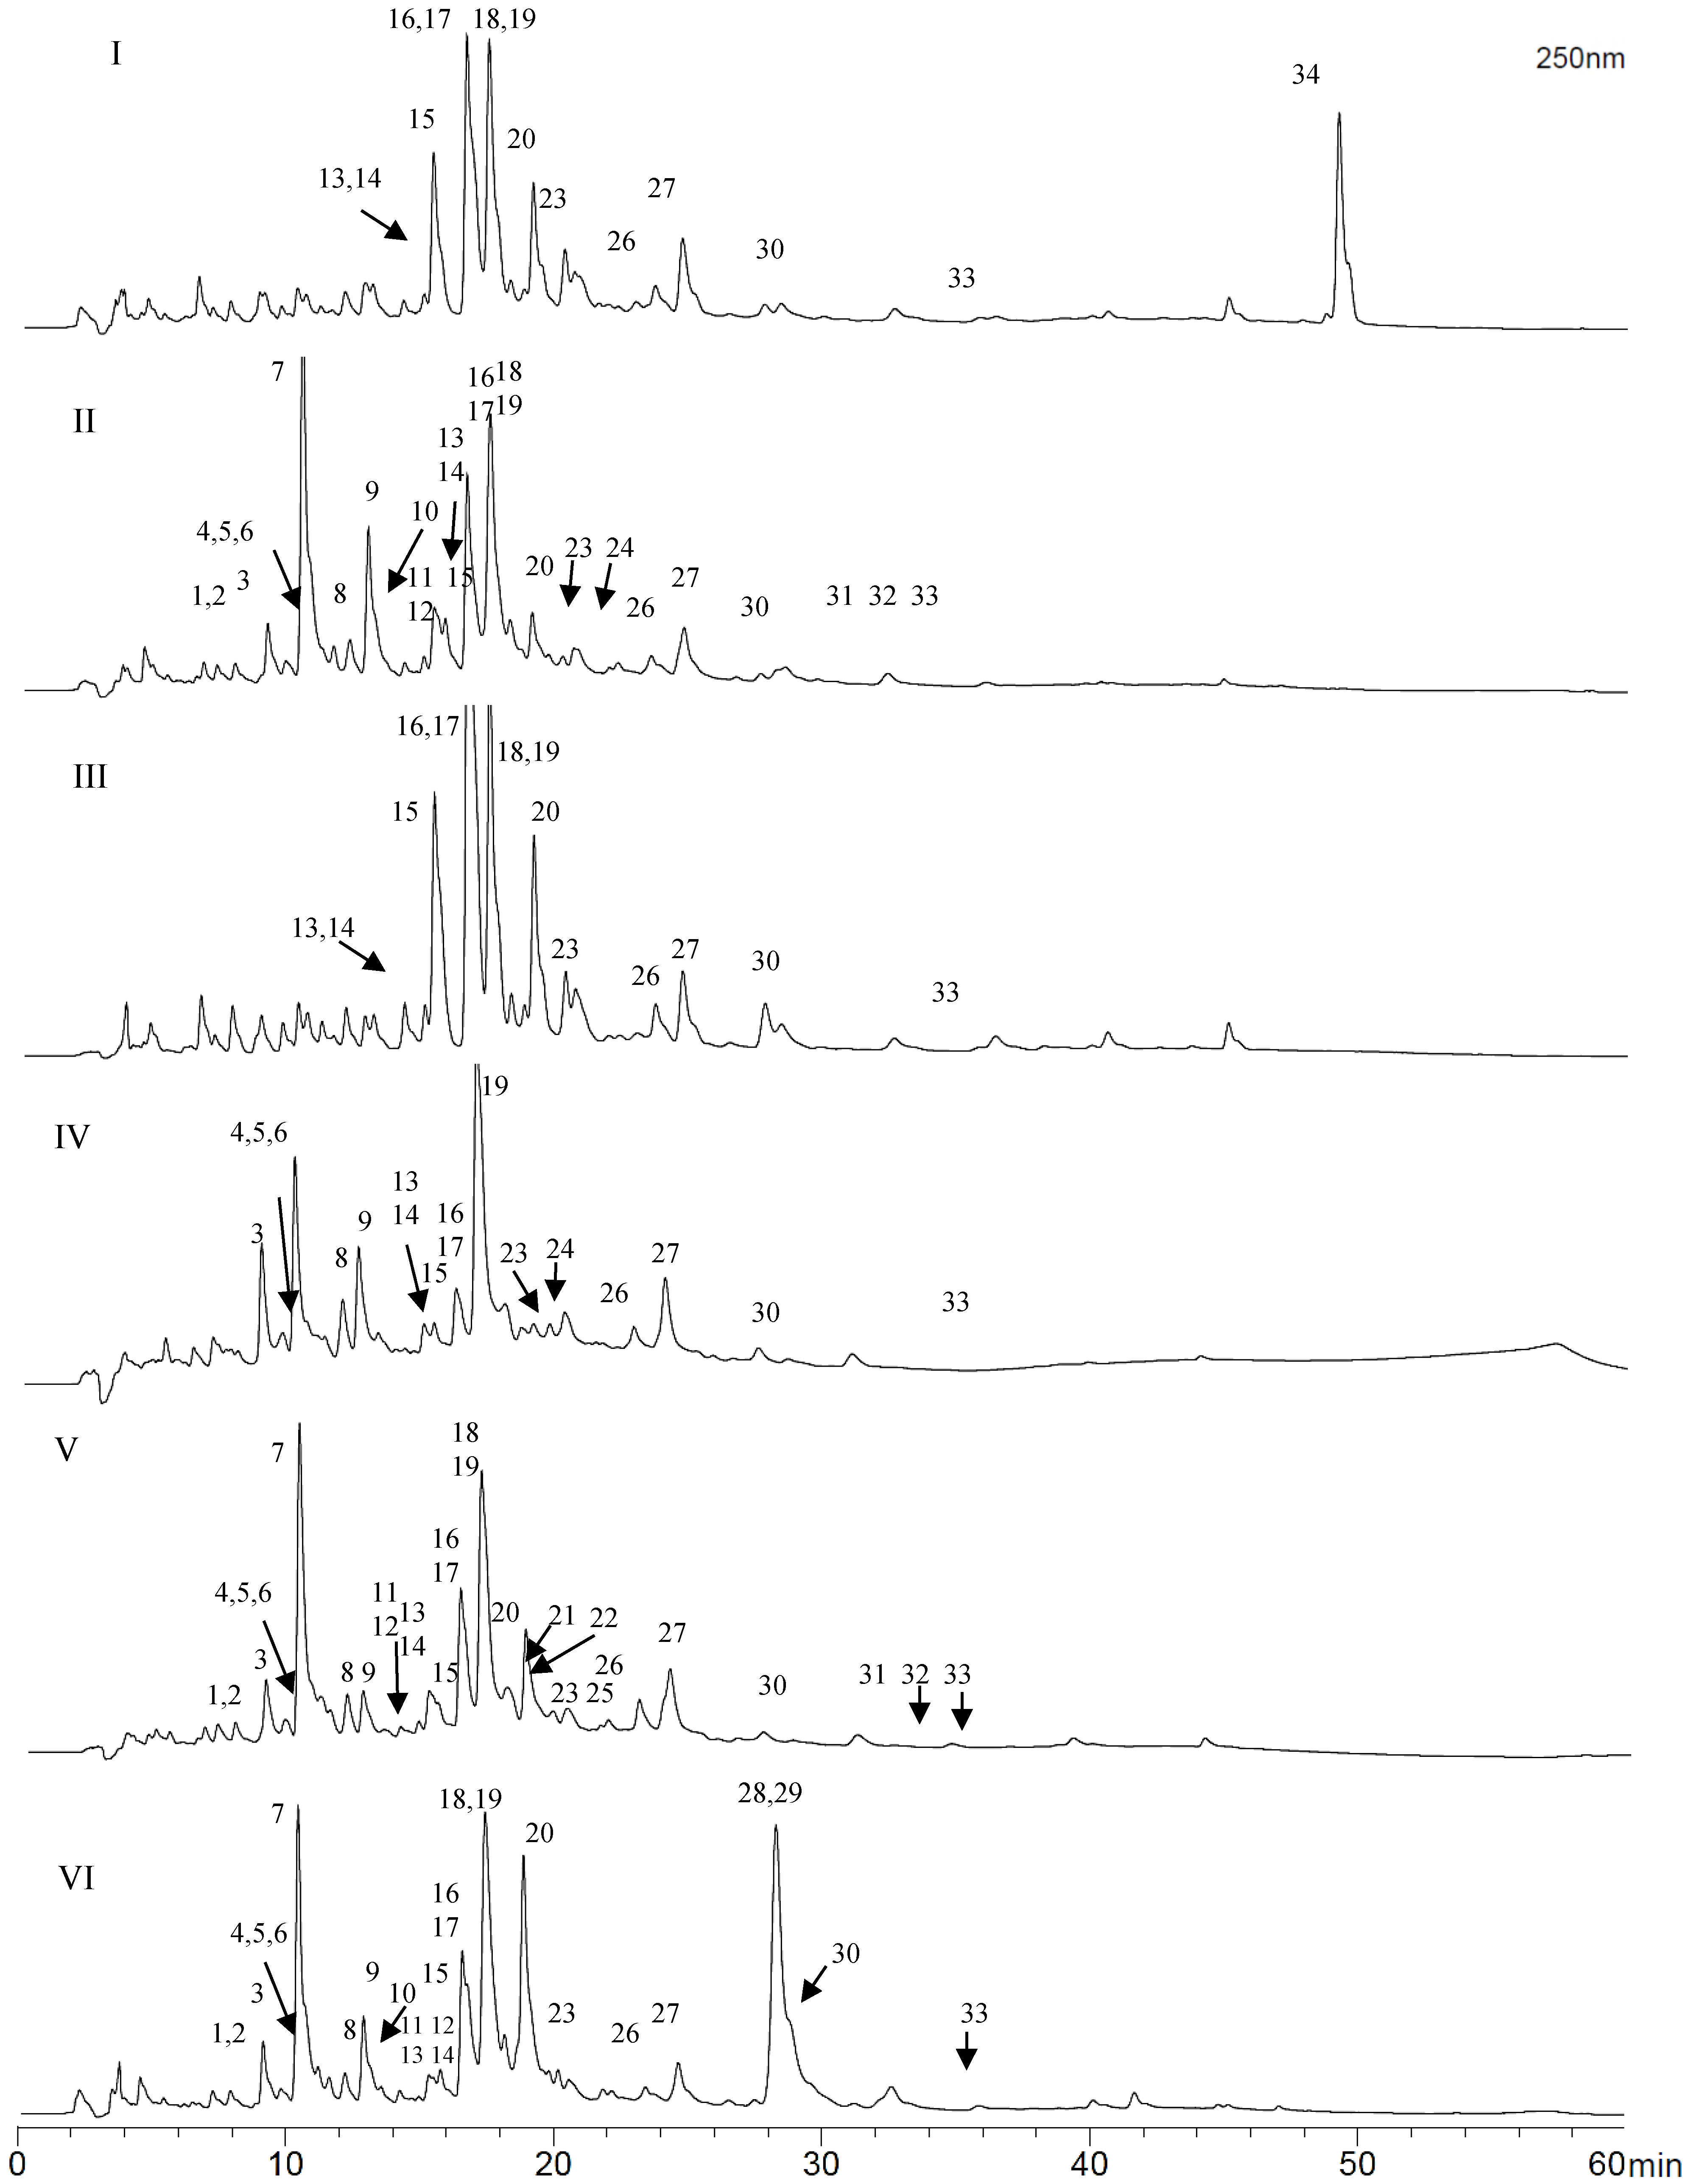
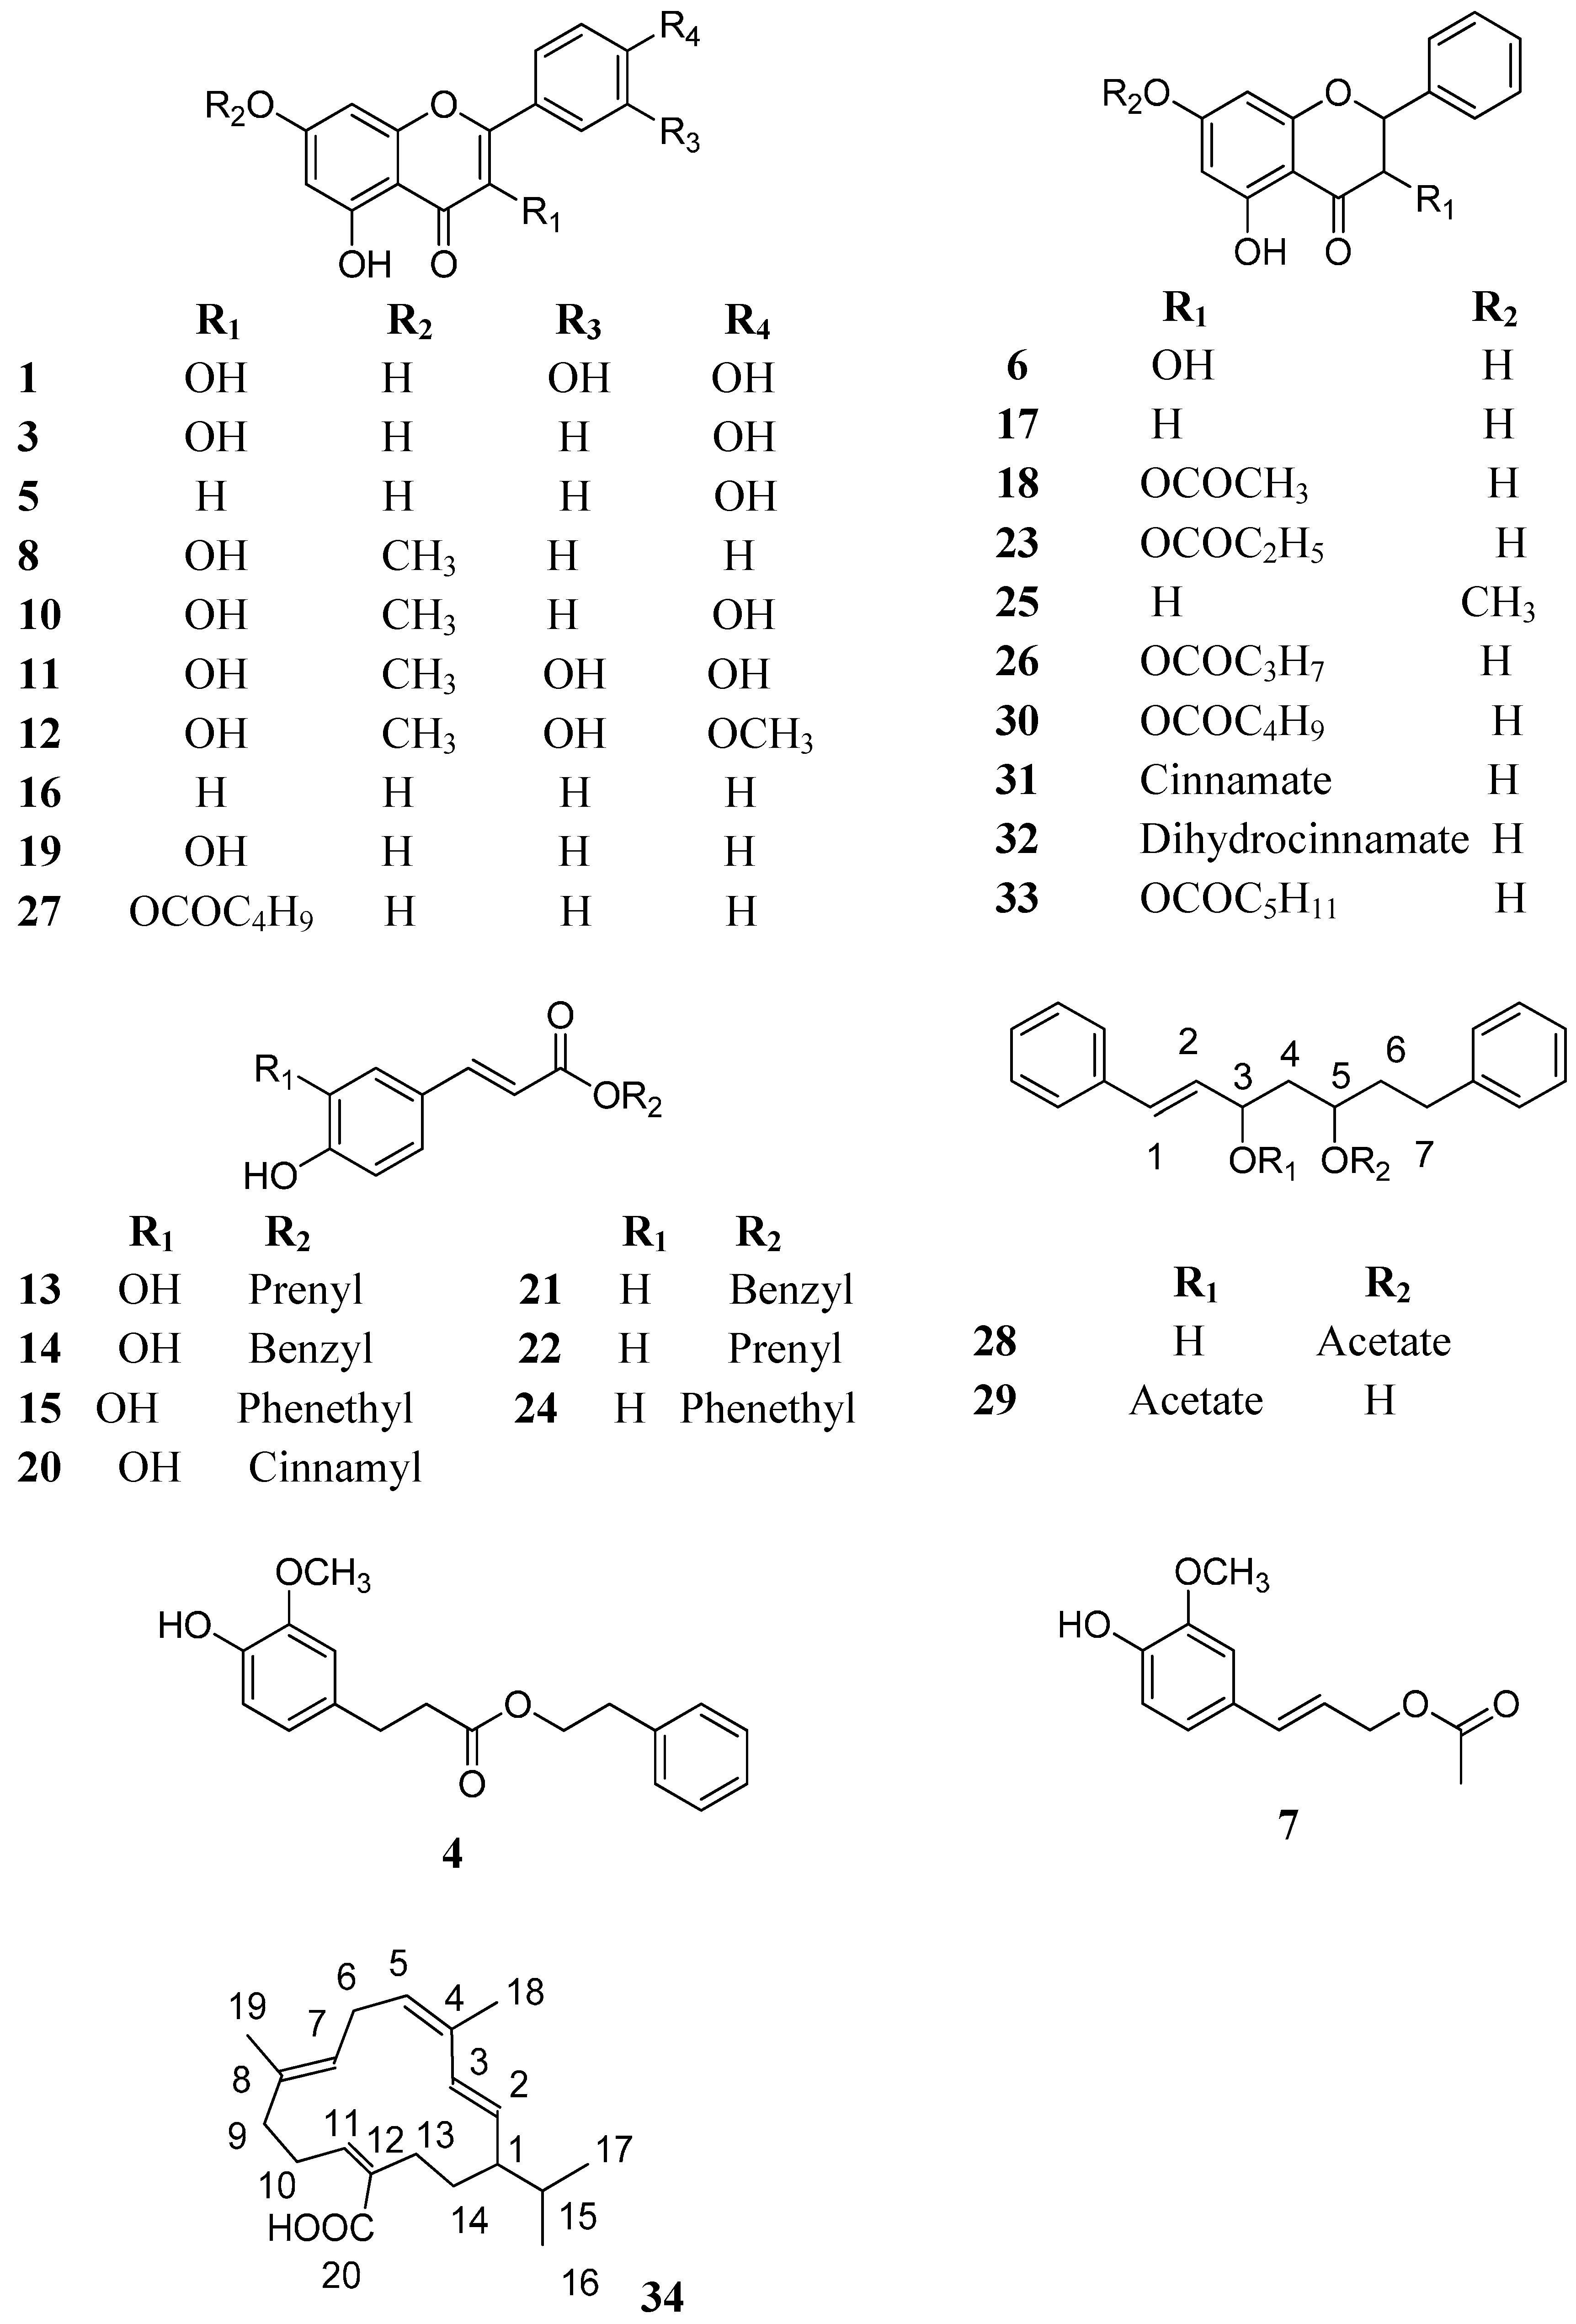
2.4. Identification of Phenolics in Propolis from the Región del Maule
3. Experimental Section
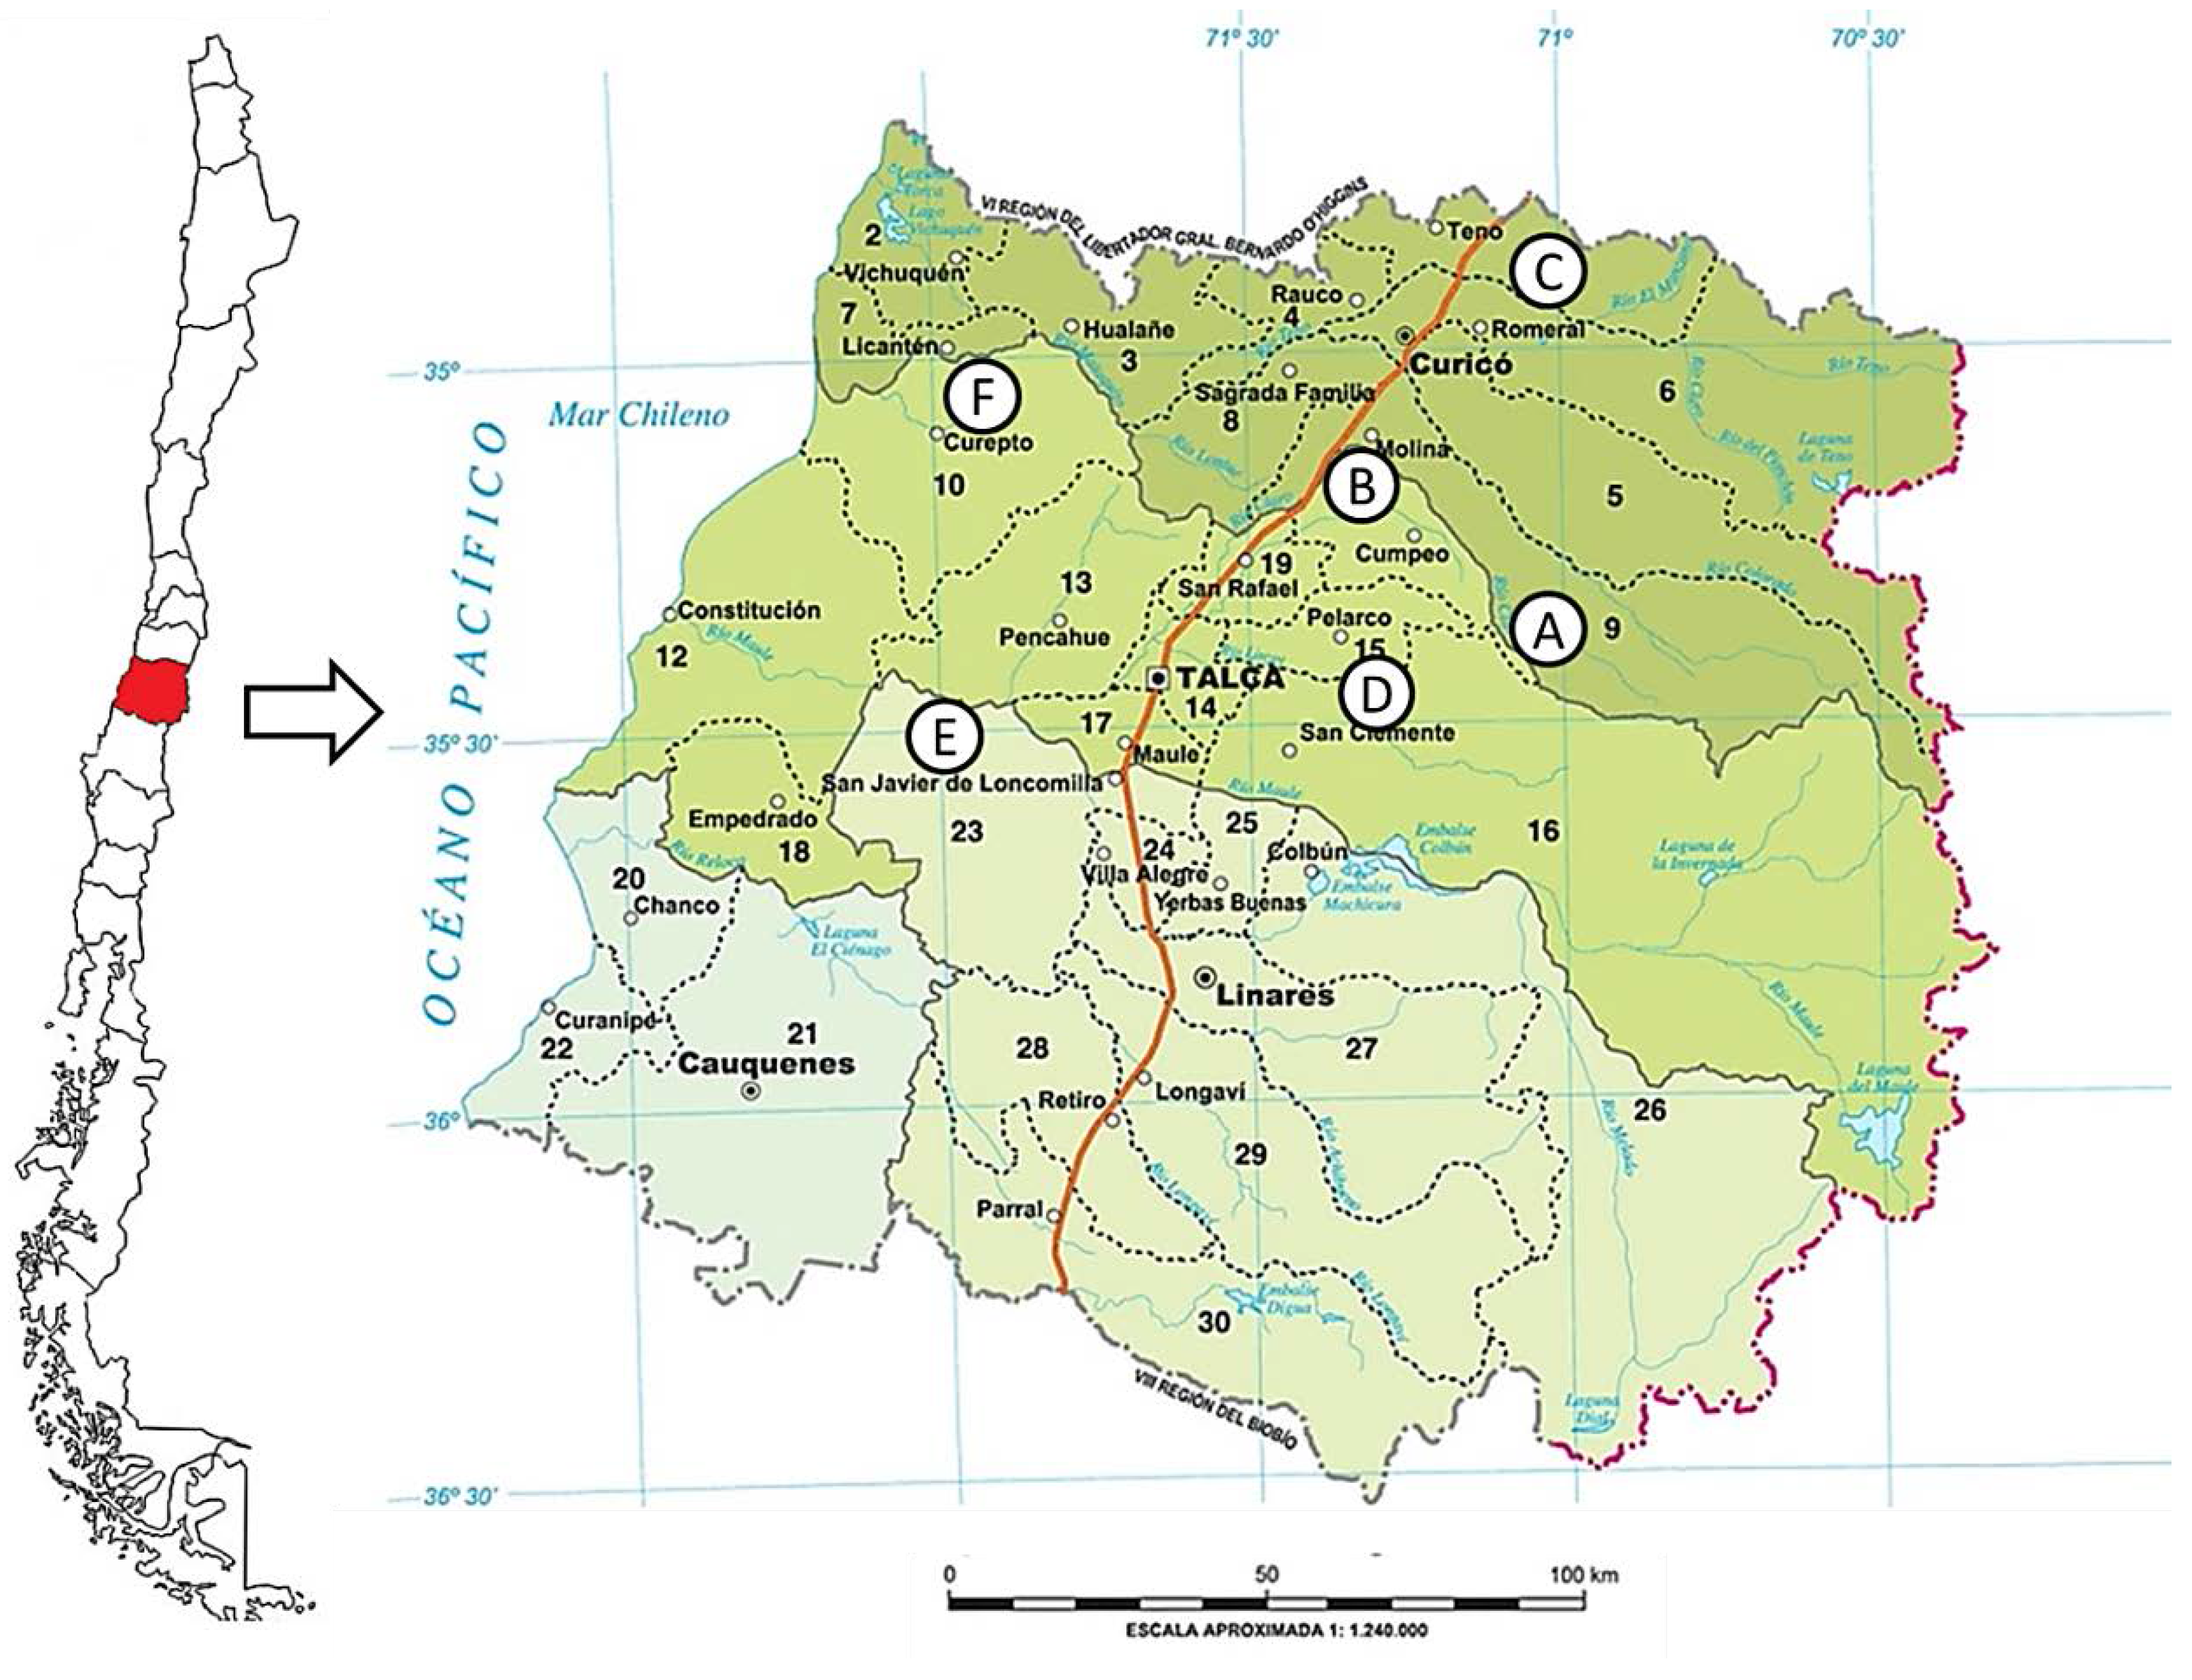
3.1. Propolis Samples: Geographic Origin and Extraction
3.2. Chemicals
| Compound | Rt (min) | UV Max | [M − H]− | MS/MS | Tentative Identification |
|---|---|---|---|---|---|
| 1 | 7.5 | - | 301 | 178, 150 | Quercetin (a,b) |
| 2 | 8.0 | - | 315 | 300 | Ellagic acid methyl ether (a) |
| 3 | 9.2 | 363, 256 | 285 | 257, 241, 229, 168, 150 | Kaempferol (a,b) |
| 4 | 9.4 | - | 299 | 284, 178, 134 | Dihydroferulic acid phenethyl ester (a) |
| 5 | 10.0 | - | 269 | 225, 150 | Apigenin (a,b) |
| 6 | 10.2 | - | 271 | 253, 225, 215, 197, 150 | Pinobanksin (a,b) |
| 7 | 10.5 | 302 sh, 266 | 221 | Coniferyl acetate (c) | |
| 8 | 12.0 | 349 sh, 301 sh, 267 | 283 | 268, 239, 211 | Galangin methyl ether (a,b) |
| 9 | 12.5 | 322, 293 sh | 415 | 371, 315, 178, 134 | Caffeic acid derivative (a) |
| 10 | 12.8 | - | 299 | 284 | Kaempferol methyl ether (a,b) |
| 11 | 13.4 | - | 315 | 300, 192, 165 | Rhamnetin (Q-methyl ether) (a,b) |
| 12 | 13.4 | - | 329 | 314 | Quercetin dimethyl ether (a,b) |
| 13 | 15.0 | 326, 297 sh | 247 | 178, 135 | Caffeic acid prenyl ester (a,b) |
| 14 | 15.0 | 326, 297 sh | 269 | 225, 177, 133 | Caffeic acid benzyl ester (a) |
| 15 | 15.5 | 330, 297 sh | 283 | 178, 135 | Caffeic acid phenylethyl ester (a,b) |
| 16 | 16.6 | 310, 268 | 253 | 209, 151 | Chrysin (a,c) |
| 17 | 16.8 | 334 sh, 280 | 255 | 213, 150 | Pinocembrin (a,c) |
| 18 | 17.5 | 288 | 313 | 253 | Pinobanksin acetate (a,c) |
| 19 | 17.5 | 357, 268 | 269 | 241, 227, 197, 166 | Galangin (a,b) |
| 20 | 19.0 | 323, 295 sh | 295 | 251, 211, 177, 133 | Caffeic acid cinnamyl ester (a) |
| 21 | 19.2 | - | 253 | 209, 161, 118 | p-Coumaric acid benzyl ester (a) |
| 22 | 19.7 | - | 231 | 187, 161, 118 | p-Coumaric acid prenyl ester (a) |
| 23 | 20.0 | 291 | 327 | 271, 253 | Pinobanksin propionate (a,b) |
| 24 | 20.5 | - | 267 | 162, 118 | p-Coumaric acid phenetyl ester (a) |
| 25 | 22.3 | - | 269 | 254, 236, 226,165 | Pinocembrin methyl ether (a,b) |
| 26 | 23.6 | - | 341 | 253 | Pinobanksin butyrate (a,b) |
| 27 | 24.5 | - | 353 | 253 | Galangin pentanoate (a) |
| 28 | 28.3 | 251 | 323 | 3-hydroxy-1,7-diphenylhept-1-ene-5-acetate(c) | |
| 29 | 28.3 | 251 | 323 | 5-hydroxy-1,7-diphenylhept-1-ene-3-acetate(c) | |
| 30 | 28.5 | - | 355 | 253 | Pinobanksin pentanoate (a,b) |
| 31 | 31.4 | - | 401 | 271, 253 | Pinobanksin cinnamate (a) |
| 32 | 33.5 | - | 403 | 271, 253 | Pinobanksin dihydrocinnamate (a) |
| 33 | 35.5 | - | 369 | 271, 253 | Pinobanksin hexanoate (a,b) |
| 34 | 49.1 | 249 | 301 | 257 | Poilaneic acid (c) |
3.3. Equipment
3.4. Antibacterial Activity
3.4.1. Microorganisms
3.4.2. Antibacterial Activity of the Extracts
3.5. Total Phenolic (TP) and Flavonoid (TF) Content
3.6. Antioxidant Activity Assays
3.6.1. DPPH Assay
3.6.2. FRAP (Ferric Reducing Antioxidant Power) Assay
3.6.3. TEAC (Trolox Equivalent Antioxidant Activity) Assay
3.7. HPLC-DAD Analysis
3.8. HPLC-ESI-MS/MS Analysis
3.9. Isolation of Main Propolis Compounds
3.9.1. High Speed Countercurrent Chromatography (HSCCC)
3.9.2. Isolation of Poilaneic Acid
3.10. Statistical Analysis
4. Conclusions
Acknowledgments
Author Contributions
Conflicts of Interest
References and Notes
- Salatino, A.; Fernandes-Silva, C.C.; Righi, A.A.; Salatino, M.L. Propolis research and the chemistry of plant products. Nat. Prod. Rep. 2011, 28, 925–936. [Google Scholar] [PubMed]
- Valcic, S.; Montenegro, G.; Timmermann, B. Lignans from Chilean propolis. J. Nat. Prod. 1998, 64, 771–775. [Google Scholar] [CrossRef] [PubMed]
- Valcic, S.; Montenegro, G.; Mujica, A.M.; Avila, G.; Franzblau, S.; Singh, M.P.; Maiese, W.M.; Timmermann, B. Phytochemical, morphological and biological investigation of propolis from Central Chile. Z. Naturforsch. C 1999, 54, 406–416. [Google Scholar] [CrossRef]
- Muñoz, O.; Peña, R.C.; Ureta, E.; Montenegro, G.; Timmermann, B.N. Propolis from Chilean matorral hives. Z. Naturforsch C. 2000, 56, 269–272. [Google Scholar] [CrossRef]
- Muñoz, O.; Peña, R.C.; Ureta, E.; Montengero, G.; Caldwell, C.; Timmermann, B.N. Phenolic compounds of propolis from central Chilean matorral. Z. Naturforsch. C 2001, 56, 272–277. [Google Scholar] [CrossRef]
- Daleprane, J.B.; Freitas, V.D.S.; Pacheco, A.; Rudnicki, M.; Faine, L.A.; Dörr, F.A.; Ikegaki, M.; Salazar, L.A.; Ong, T.P.; Abdalla, D.S.P. Anti-atherogenic and anti-angiogenic activities of polyphenols from propolis. J. Nutr. Biochem. 2012, 23, 557–566. [Google Scholar] [CrossRef] [PubMed]
- Castro, C.; Mura, F.; Valenzuela, G.; Figueroa, C.; Salinas, R.; Zuñiga, M.C.; Torres, J.L.; Fuguet, E.; Delporte, C. Identification of phenolic compounds by HPLC-ESI-MS/MS and antioxidant activity from Chilean propolis. Food Res. Int. 2014, 64, 873–879. [Google Scholar] [CrossRef]
- Valenzuela-Barra, G.; Castro, C.; Figueroa, C.; Barriga, A.; Silva, X.; de las Heras, B.; Hortelano, S.; Delporte, C. Anti-inflammatory activity and phenolic profile of propolis from two locations in Región Metropolitana de Santiago, Chile. J. Ethnopharmacol. 2015, 168, 37–44. [Google Scholar] [CrossRef] [PubMed]
- Astudillo, L.; Avila, F.; Morrison, R.; Gutierrez, C.M.; Bastida, J.; Codina, C.; Schmeda-Hirschmann, G. Biologically active compounds from Chilean propolis. Bol. Soc. Chil. Quím. 2000, 45, 577–581. [Google Scholar] [CrossRef]
- Carrillo, M.L.; Castillo, L.N.; Mauricio, R. Evaluación de la actividad antimicrobiana de extractos de propóleos de la Huasteca Potosina (México). Inf. Tecnol. 2011, 22, 21–28. [Google Scholar] [CrossRef]
- Samara-Ortega, N.; Benitez-Campo, N.; Cabezas-Fajardo, F.A. Actividad antibacteriana y composición cualitativa de propóleos provenientes de dos zonas climáticas del Departamento del Cauca. Rev. Bio. Agro. 2011, 9, 8–16. [Google Scholar]
- Silva, J.C.; Rodrigues, S.; Feás, X.; Estevinho, L.M. Antimicrobial activity, phenolic profile and role in the inflammation of propolis. Food Chem. Toxicol. 2012, 50, 1790–1795. [Google Scholar] [CrossRef] [PubMed]
- Campos, J.F.; dos Santos, U.P.; Macorini, L.F.B.; de Melo, A.M.M.F.; Balestieri, J.B.P.; Paredes-Gamero, E.J.; Cardoso, C.A.L.; Souza, K. de P.; dos Santos, E.L. Antimicrobial, antioxidant and cytotoxic activities of propolis from Melipona orbignyi (Hymenoptera, Apidae). Food Chem. Toxicol. 2014, 65, 374–380. [Google Scholar] [CrossRef] [PubMed]
- Ríos, J.L.; Recio, M.C. Medicinal plants and antimicrobial activity. J. Ethnopharmacol. 2005, 100, 80–84. [Google Scholar] [CrossRef] [PubMed]
- Moreno, M.I.N.; Isla, M.I.; Cudmani, N.G.; Vattuone, M.A.; Sampietro, A.R. Screening of antibacterial activity of Amaicha del Valle (Tucumán, Argentina) propolis. J. Ethnopharmacol. 1999, 68, 97–102. [Google Scholar] [CrossRef]
- Montenegro, G.; Salas, F.; Peña, R.C.; Pizarro, R. Actividad antibacteriana y antifúngica de mieles monoflorales de Quillaja saponaria, especie endémica de Chile. Phyton 2009, 78, 141–146. [Google Scholar]
- Kuroyanagi, M.; Noro, T.; Fukushima, S.; Aiyama, R.; Ikuta, A.; Itokawa, I.; Morita, M. Studies of constituents of seeds of Alpinia katsumadai Hayata. Chem. Pharm. Bull. 1983, 31, 1544–1550. [Google Scholar] [CrossRef]
- Ngo, K.; Brown, G.D. Stilbenes, monoterpenes, diarylheptanoids, labdanes and chalcones from Alpinia katsumadai. Phytochemistry 1998, 47, 1117–1123. [Google Scholar] [CrossRef]
- Nam, J.W.; Kang, G.Y.; Han, A.R.; Lee, D.; Lee, Y.S.; Seo, E.K. Diarylheptanoids from the Seeds of Alpinia katsumadai as heat shock factor 1 inducers. J. Nat. Prod. 2011, 74, 2109–2115. [Google Scholar] [CrossRef] [PubMed]
- Nam, J.W.; Seo, E.K. Identification of six new minor diarylheptanoids from the seeds of Alpinia katsumadai. Helv. Chim. Acta 2013, 96, 1670–1680. [Google Scholar] [CrossRef]
- An, N.; Zou, Z.; Tian, Z.; Luo, X.; Yang, S.; Xu, L. Diarylheptanoids from the rhizomes of Alpinia officinarum and their anticancer activity. Fitoterapia 2008, 79, 27–31. [Google Scholar] [CrossRef] [PubMed]
- An, N.; Zhang, H.; Xu, L.; Yang, S.; Zou, Z. New diarylheptanoids from the rhizome of Alpinia officinarum Hance. Food Chem. 2010, 119, 513–517. [Google Scholar] [CrossRef]
- Liu, D.; Liu, Y.W.; Guan, F.Q.; Liang, J.Y. New cytotoxic diarylheptanoids from the rhizomes of Alpinia officinarum Hance. Fitoterapia 2014, 96, 76–80. [Google Scholar] [CrossRef] [PubMed]
- Yadav, D.; Kushwaha, V.; Saxena, K.; Verma, R.; Murthy, P.K.; Gupta, M.M. Diarylheptanoid compounds from Alnus nepalensis express in vitro and in vivo antifilarial activity. Acta Trop. 2013, 128, 509–517. [Google Scholar] [CrossRef] [PubMed]
- Dictionary of Natural Products on DVD; CRC Press: Boca Raton, FL, USA, 2015.
- Sato, A.; Kurabayashi, M.; Ogiso, A.; Kuwano, H. Poilaneic acid, a cembranoid diterpene from Croton poilanei. Phytochemistry 1981, 20, 1915–1918. [Google Scholar] [CrossRef]
- Ngamrojnavanich, N.; Tonsiengsom, S.; Lertpratchya, P.; Roengsumran, S.; Puthong, S.; Petsom, A. Diterpenoids from the stem barks of Croton Robustus. Arch. Pharm. Res. 2003, 26, 898–901. [Google Scholar] [CrossRef] [PubMed]
- Roengsumran, S.; Sookkongwaree, K.; Singtothong, P.; Pornpakakul, S.; Sangvanich, P.; Peckwang, J. Inhibitory activity on cAMP phosphodiesterase of some cembranoids. NHJCU 2002, 27, 9–14. [Google Scholar]
- Falcão, S.I.; Vilas-Boas, M.; Estevinho, L.M.; Barros, C.; Domingues, M.R.M.; Cardoso, S.M. Phenolic characterization of Northeast Portuguese propolis: usual and unusual compound. Anal. Bioanal. Chem. 2010, 396, 887–897. [Google Scholar] [CrossRef] [PubMed]
- Falcão, S.I.; Vale, N.; Gomes, P.; Domingues, M.R.M.; Freire, C.; Cardoso, S.M.; Vilas-Boas, M. Phenolic profiling of Portuguese propolis by LC-MS spectrometry: Uncommon propolis rich in flavonoid glycosides. Phytochem. Anal. 2013, 24, 309–318. [Google Scholar] [CrossRef] [PubMed]
- Falcão, S.I.; Tomás, A.; Vale, N.; Gomes, P.; Freire, C.; Vilas-Boas, M. Phenolic quatification and botanical origin of Portuguese propolis. Ind. Crops Prod. 2013, 49, 805–812. [Google Scholar] [CrossRef]
- Pellati, F.; Orlandini, G.; Pinetti, D.; Benvenuti, S. HPLC-DAD and HPLC-ESI-MS/MS methods for metabolite profiling of propolis extracts. J. Pharm. Biomed. Anal. 2011, 55, 934–948. [Google Scholar] [CrossRef] [PubMed]
- Gardana, C.; Scaglianti, M.; Pietta, P.; Simonetti, P. Analysis of the polyphenolic fraction of propolis from different sources by liquid chromatography-tandem mass spectrometry. J. Pharm. Biomed. Anal. 2007, 45, 390–399. [Google Scholar] [CrossRef] [PubMed]
- Ristivojević, P.; Trifković, J.; Gašić, U.; Andrić, F.; Nedić, N.; Tešić, Ž.; Milojković-Opsenica, D. Ultrahigh-performance liquid chromatography and mass spectrometry (UHPLC-LTQ/Orbitrap/MS/MS) study of phenolic profile of Serbian poplar type propolis. Phytochem. Anal. 2014, 26, 127–136. [Google Scholar]
- Kumazawa, S.; Hamasaka, T.; Nakayama, T. Antioxidant activity of propolis of various geographic origins. Food Chem. 2004, 84, 329–339. [Google Scholar] [CrossRef]
- Kasote, D.; Suleman, T.; Chen, W.; Sandasi, M.; Viljoen, A.; van Vuren, S. Chemical profiling and chemometric analysis of South African propolis. Biochem. System. Ecol. 2014, 55, 156–163. [Google Scholar] [CrossRef]
- Anh, M.-R.; Kumazawa, S.; Usui, Y.; Nakamura, J.; Matsuka, M.; Zhu, F.; Nakayama, T. Antioxidant activity and constituents of propolis collected in various areas of China. Food Chem. 2007, 101, 1383–1392. [Google Scholar]
- Yang, H.; Dong, Y.; Du, H.; Shi, H.; Peng, Y.; Li, X. Antioxidant compounds from propolis collected in Anhui, China. Molecules 2011, 16, 3444–3455. [Google Scholar] [CrossRef] [PubMed]
- Lima, B.; Tapia, A.; Luna, L.; Fabani, M.P.; Schmeda-Hirschmann, G.; Podio, N.S.; Wunderlin, D.A.; Feresin, G.E. Main flavonoids, DPPH activity and metal content allow determining the geographical origin of propolis from the Province of San Juan (Argentina). J. Agric. Food Chem. 2009, 57, 2691–2698. [Google Scholar] [CrossRef] [PubMed]
- Agüero, M.B.; Gonzalez, M.; Lima, B.; Svetaz, L.; Sánchez, M.; Zacchino, S.; Feresin, G.E.; Schmeda-Hirschmann, G.; Palermo, J.; Wunderlin, D.; et al. Argentinean propolis from Zuccagnia punctata Cav. (Caesalpinieae) exudates: phytochemical characterization and antifungal activity. J. Agric. Food Chem. 2010, 58, 194–201. [Google Scholar]
- Kumazawa, S.; Hayashi, K.; Kajiya, K.; Ishii, T.; Hamasaka, T.; Nakayama, T. Studies of the constituents of Uruguayan propolis. J. Agric. Food Chem. 2014, 50, 4777–4782. [Google Scholar] [CrossRef]
- Zdero, C.; Bohlmann, F.; King, R.M. Clerodane and labdane derivatives from Olearia teretifolia. Phytochemistry 1992, 31, 1703–1711. [Google Scholar] [CrossRef]
- Laskar, R.A.; Sk, I.; Roy, N.; Begum, N.A. Antioxidant activity of Indian propolis and its chemical constituents. Food Chem. 2010, 122, 233–237. [Google Scholar] [CrossRef]
- Clinical and Laboratory Standards Institute (CLSI). Performance Standards for Antimicrobial Susceptibility Testing, 8th Informational Supplement, Document M100-S22; CLSI: Wayne, PA, USA, 2012. [Google Scholar]
- Jiménez-Aspee, F.; Quispe, C.; Soriano, M.D.P.C.; Fuentes, G.J.; Huneke, E.; Theoduloz, C.; Schmeda-Hirschmann, G. Antioxidant activity and characterization of constituents in copao fruits (Eulychnia acida Phil., Cactaceae) by HPLC-DAD-MS/MSn. Food Res. Int. 2014, 62, 286–298. [Google Scholar]
- Simirgiotis, M.J.; Silva, M.; Becerra, J.; Schmeda-Hirschmann, G. Direct characterization of phenolic antioxidants in infusions from four Mapuche medicinal plants by liquid chromatography with diode array detection (HPLC-DAD) and electrospray ionisation tandem mass spectrometry (HPLC-ESI-MS). Food Chem. 2012, 131, 318–327. [Google Scholar] [CrossRef]
- Simirgiotis, M.J.; Bórquez, J.; Schmeda-Hirschmann, G. Antioxidant capacity, polyphenolic content and tandem HPLC-DAD-ESI/MS profiling of phenolic compounds from South American berries Luma apiculata and L. chequén. Food Chem. 2013, 139, 289–299. [Google Scholar] [CrossRef] [PubMed]
- Nenadis, N.; Wang, L.F.; Tsimidou, M.; Zhang, H.Y. Estimation of scavenging activity of phenolic compounds using the ABTS+ assay. J. Agric. Food Chem. 2004, 52, 4669–4674. [Google Scholar] [CrossRef] [PubMed]
- Nina, V.; Quispe, C.; Jimenez-Aspee, F.; Theoduloz, C.; Gimenez, A.; Schmeda-Hirschmann, G. Chemical profiling and antioxidant activity of Bolivian propolis. J. Sci. Food Agric. 2015. [Google Scholar] [CrossRef] [PubMed]
- Sample Availability: Samples of the crude propolis are available from the authors.
© 2015 by the authors. Licensee MDPI, Basel, Switzerland. This article is an open access article distributed under the terms and conditions of the Creative Commons Attribution license ( http://creativecommons.org/licenses/by/4.0/).
Share and Cite
Nina, N.; Quispe, C.; Jiménez-Aspee, F.; Theoduloz, C.; Feresín, G.E.; Lima, B.; Leiva, E.; Schmeda-Hirschmann, G. Antibacterial Activity, Antioxidant Effect and Chemical Composition of Propolis from the Región del Maule, Central Chile. Molecules 2015, 20, 18144-18167. https://doi.org/10.3390/molecules201018144
Nina N, Quispe C, Jiménez-Aspee F, Theoduloz C, Feresín GE, Lima B, Leiva E, Schmeda-Hirschmann G. Antibacterial Activity, Antioxidant Effect and Chemical Composition of Propolis from the Región del Maule, Central Chile. Molecules. 2015; 20(10):18144-18167. https://doi.org/10.3390/molecules201018144
Chicago/Turabian StyleNina, Nélida, Cristina Quispe, Felipe Jiménez-Aspee, Cristina Theoduloz, Gabriela Egly Feresín, Beatriz Lima, Elba Leiva, and Guillermo Schmeda-Hirschmann. 2015. "Antibacterial Activity, Antioxidant Effect and Chemical Composition of Propolis from the Región del Maule, Central Chile" Molecules 20, no. 10: 18144-18167. https://doi.org/10.3390/molecules201018144