Architecture of the Triceps Surae Muscles Complex in Patients with Spastic Hemiplegia: Implication for the Limited Utility of the Silfverskiöld Test

 , , ,
, , ,
Abstract
:1. Introduction
2. Experimental Section
2.1. Subjects
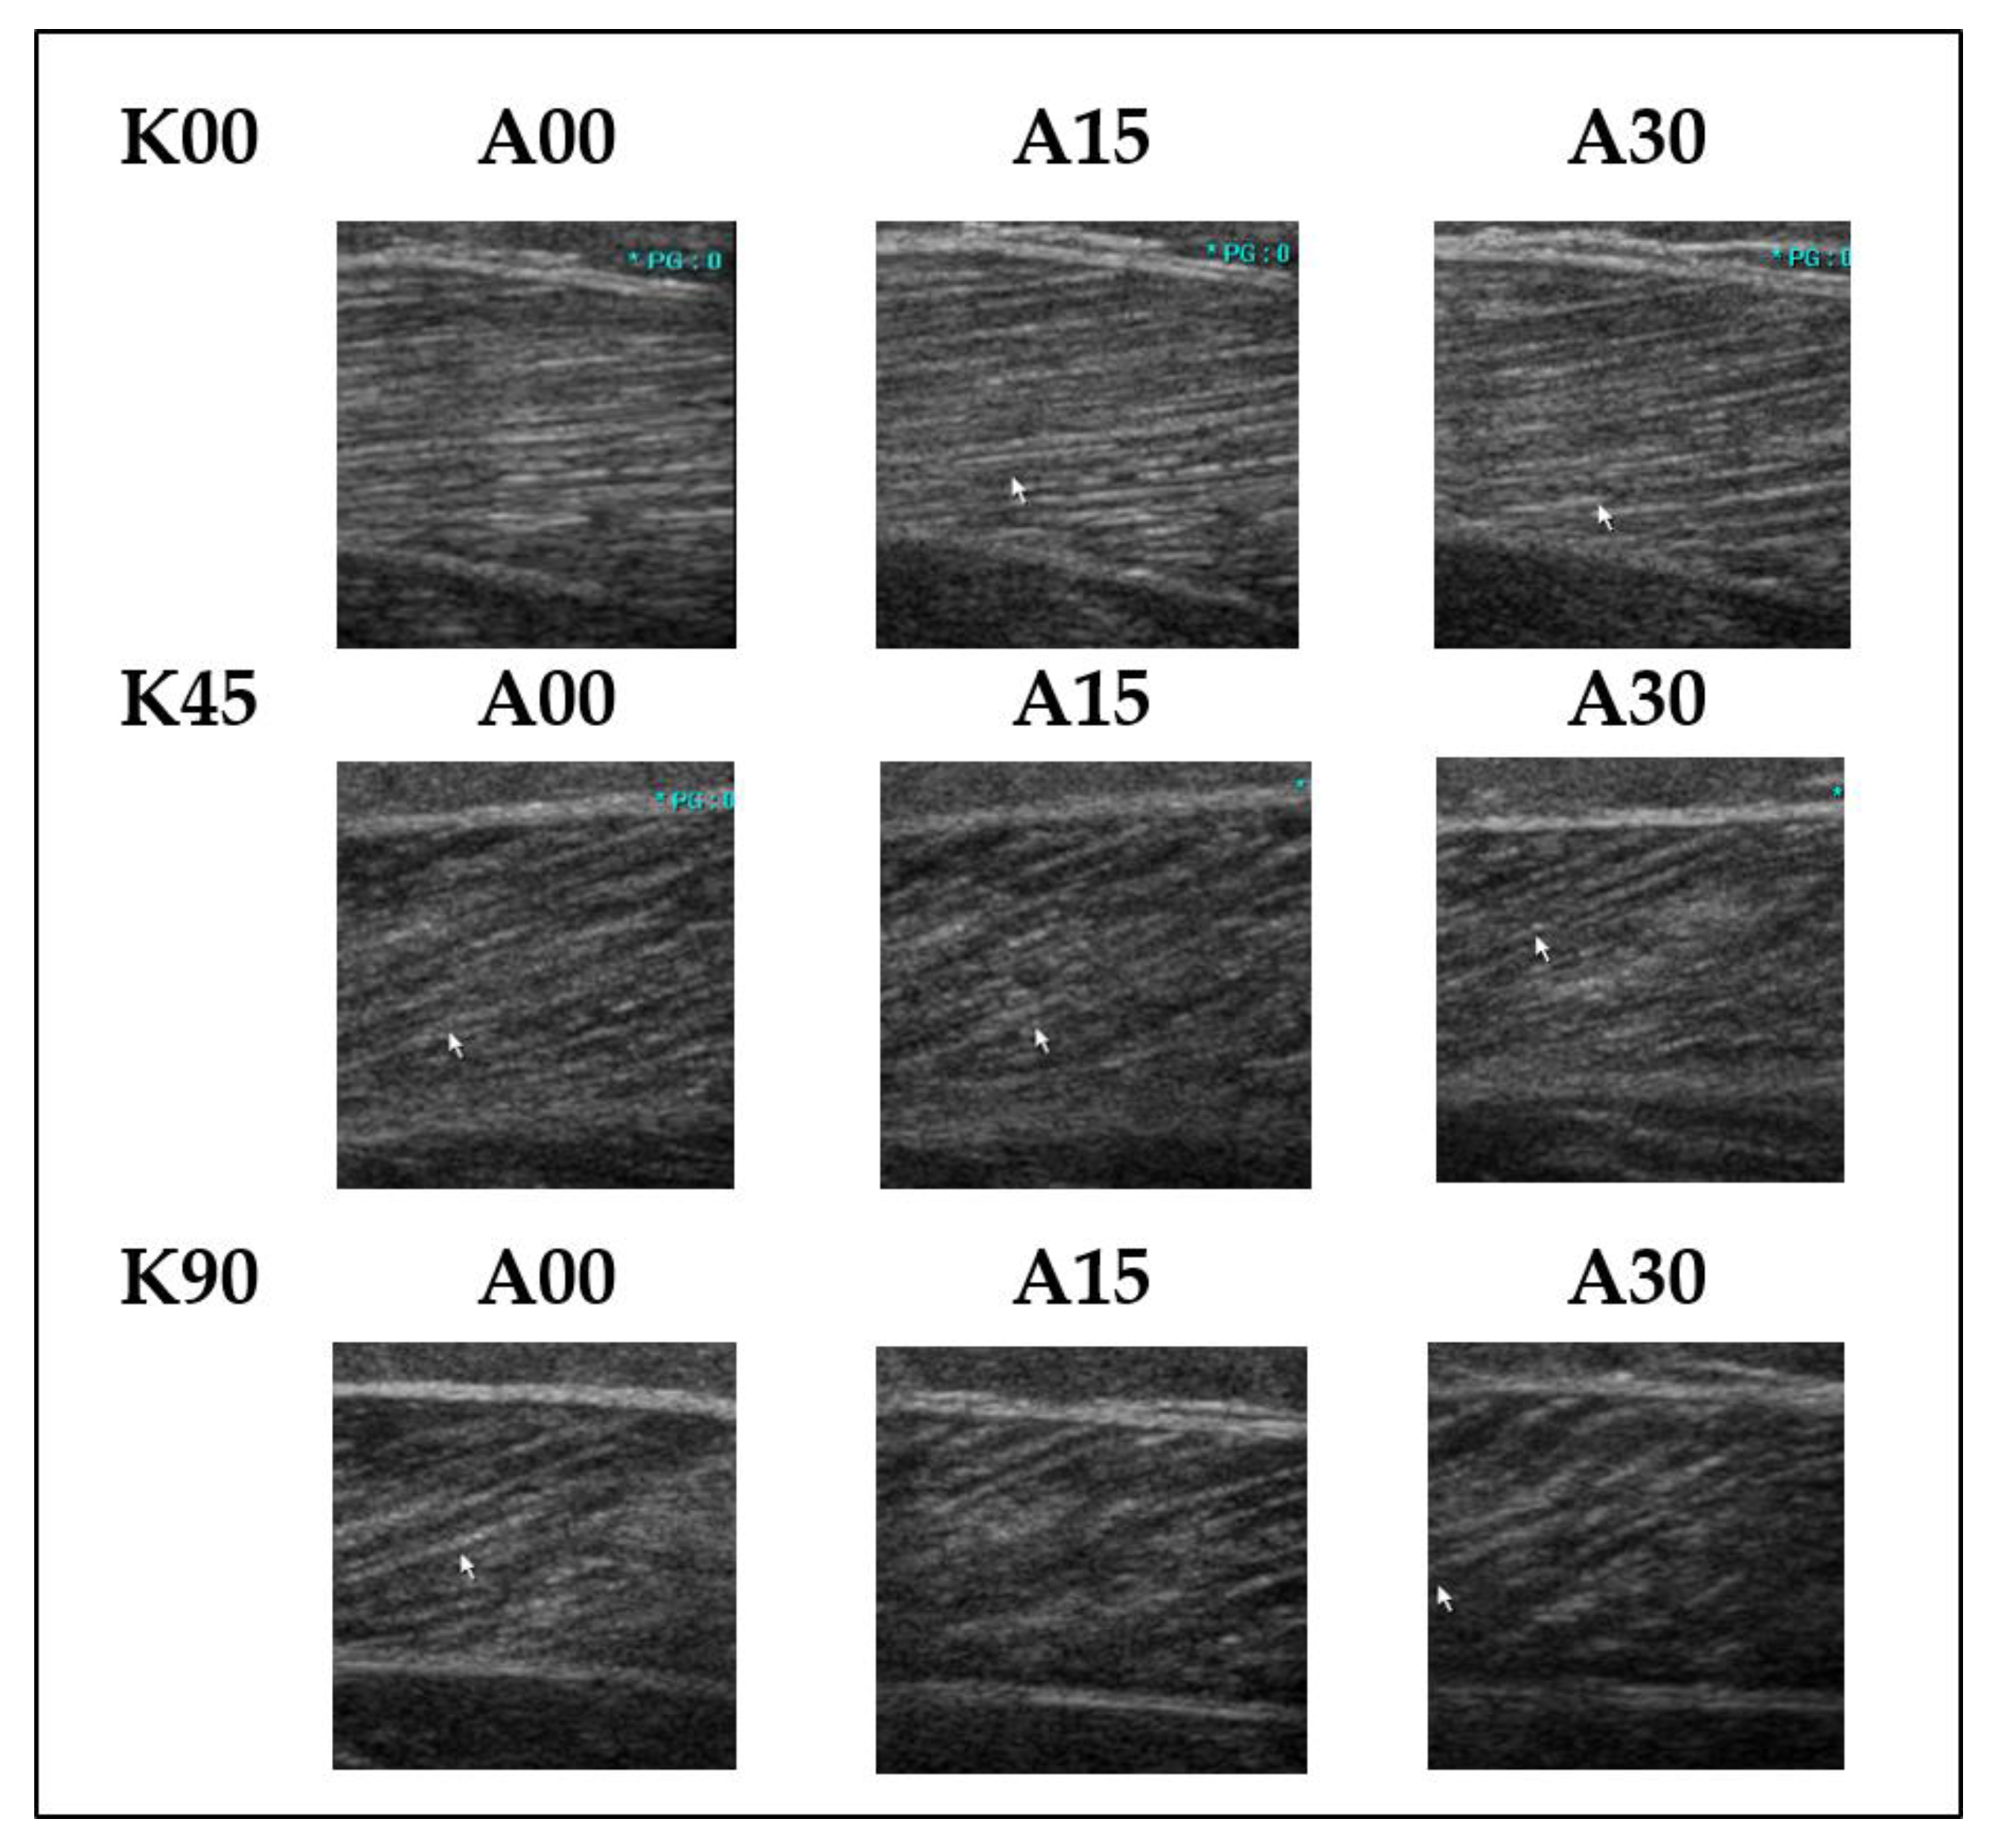
2.2. Procedure
2.3. Variables Describing Muscle Architecture
2.4. Statistical Analysis
3. Results
3.1. Study Sample
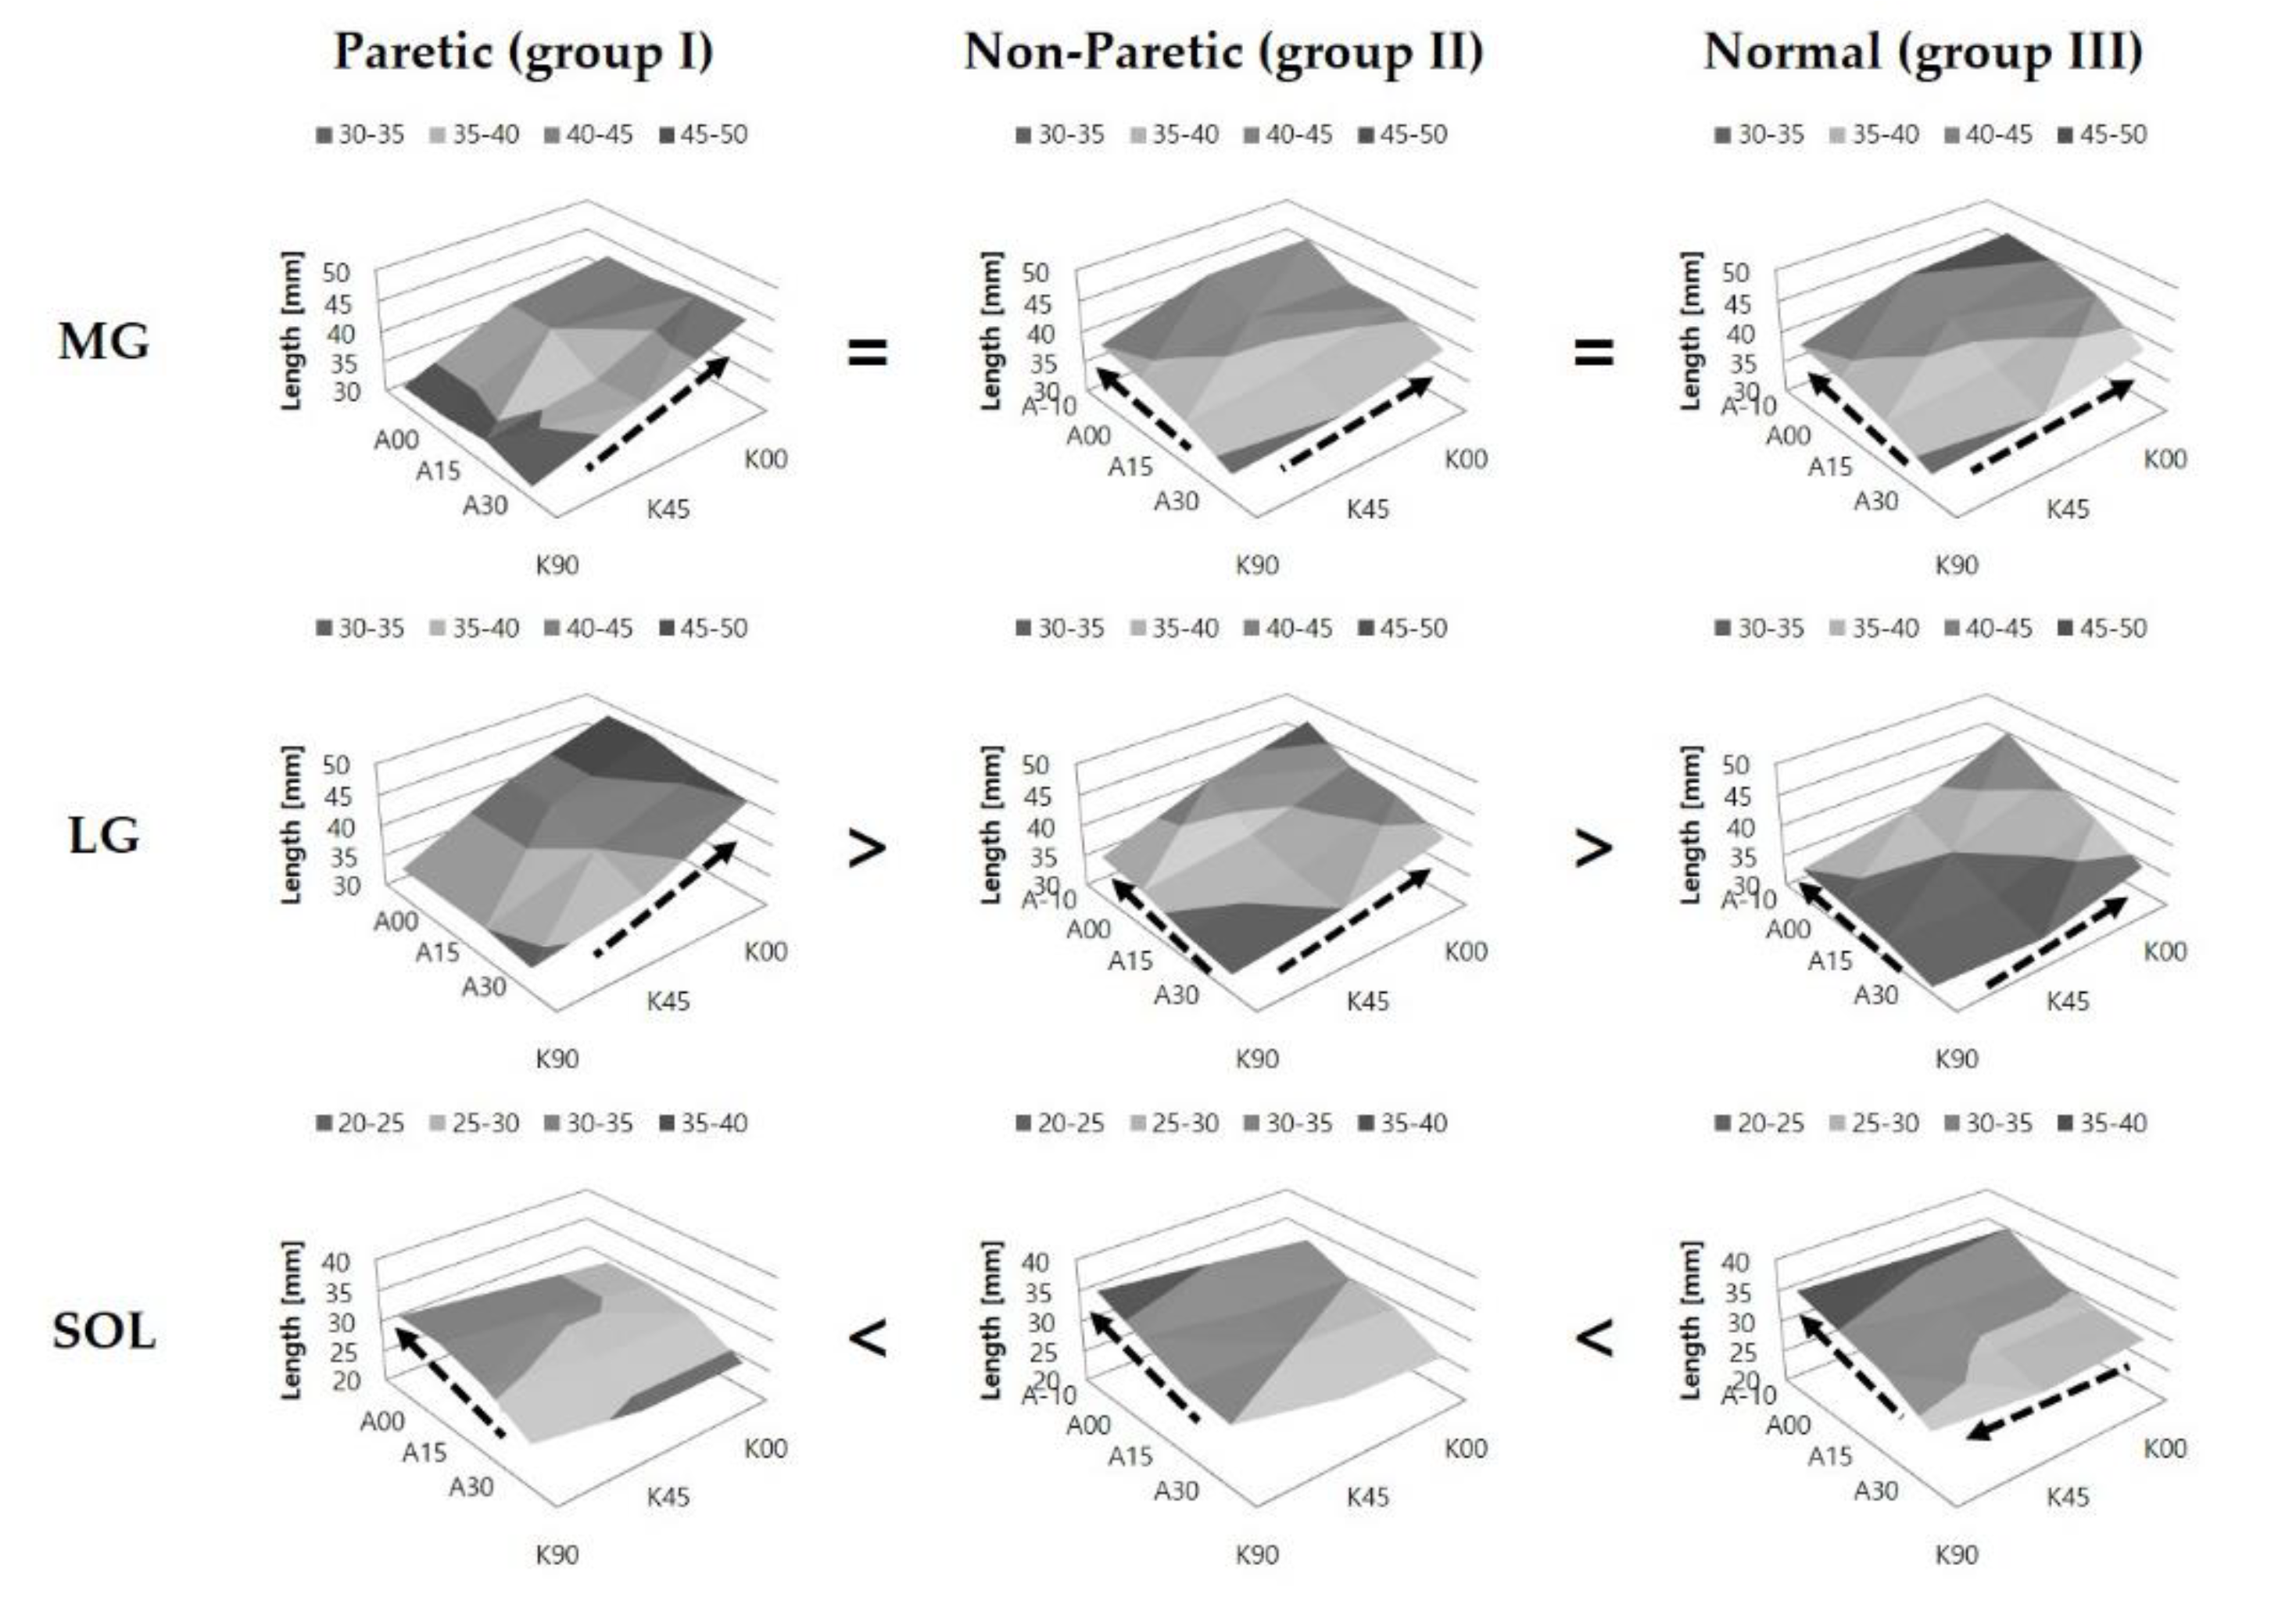
3.2. Comparison of Fascicle Length (Lf)
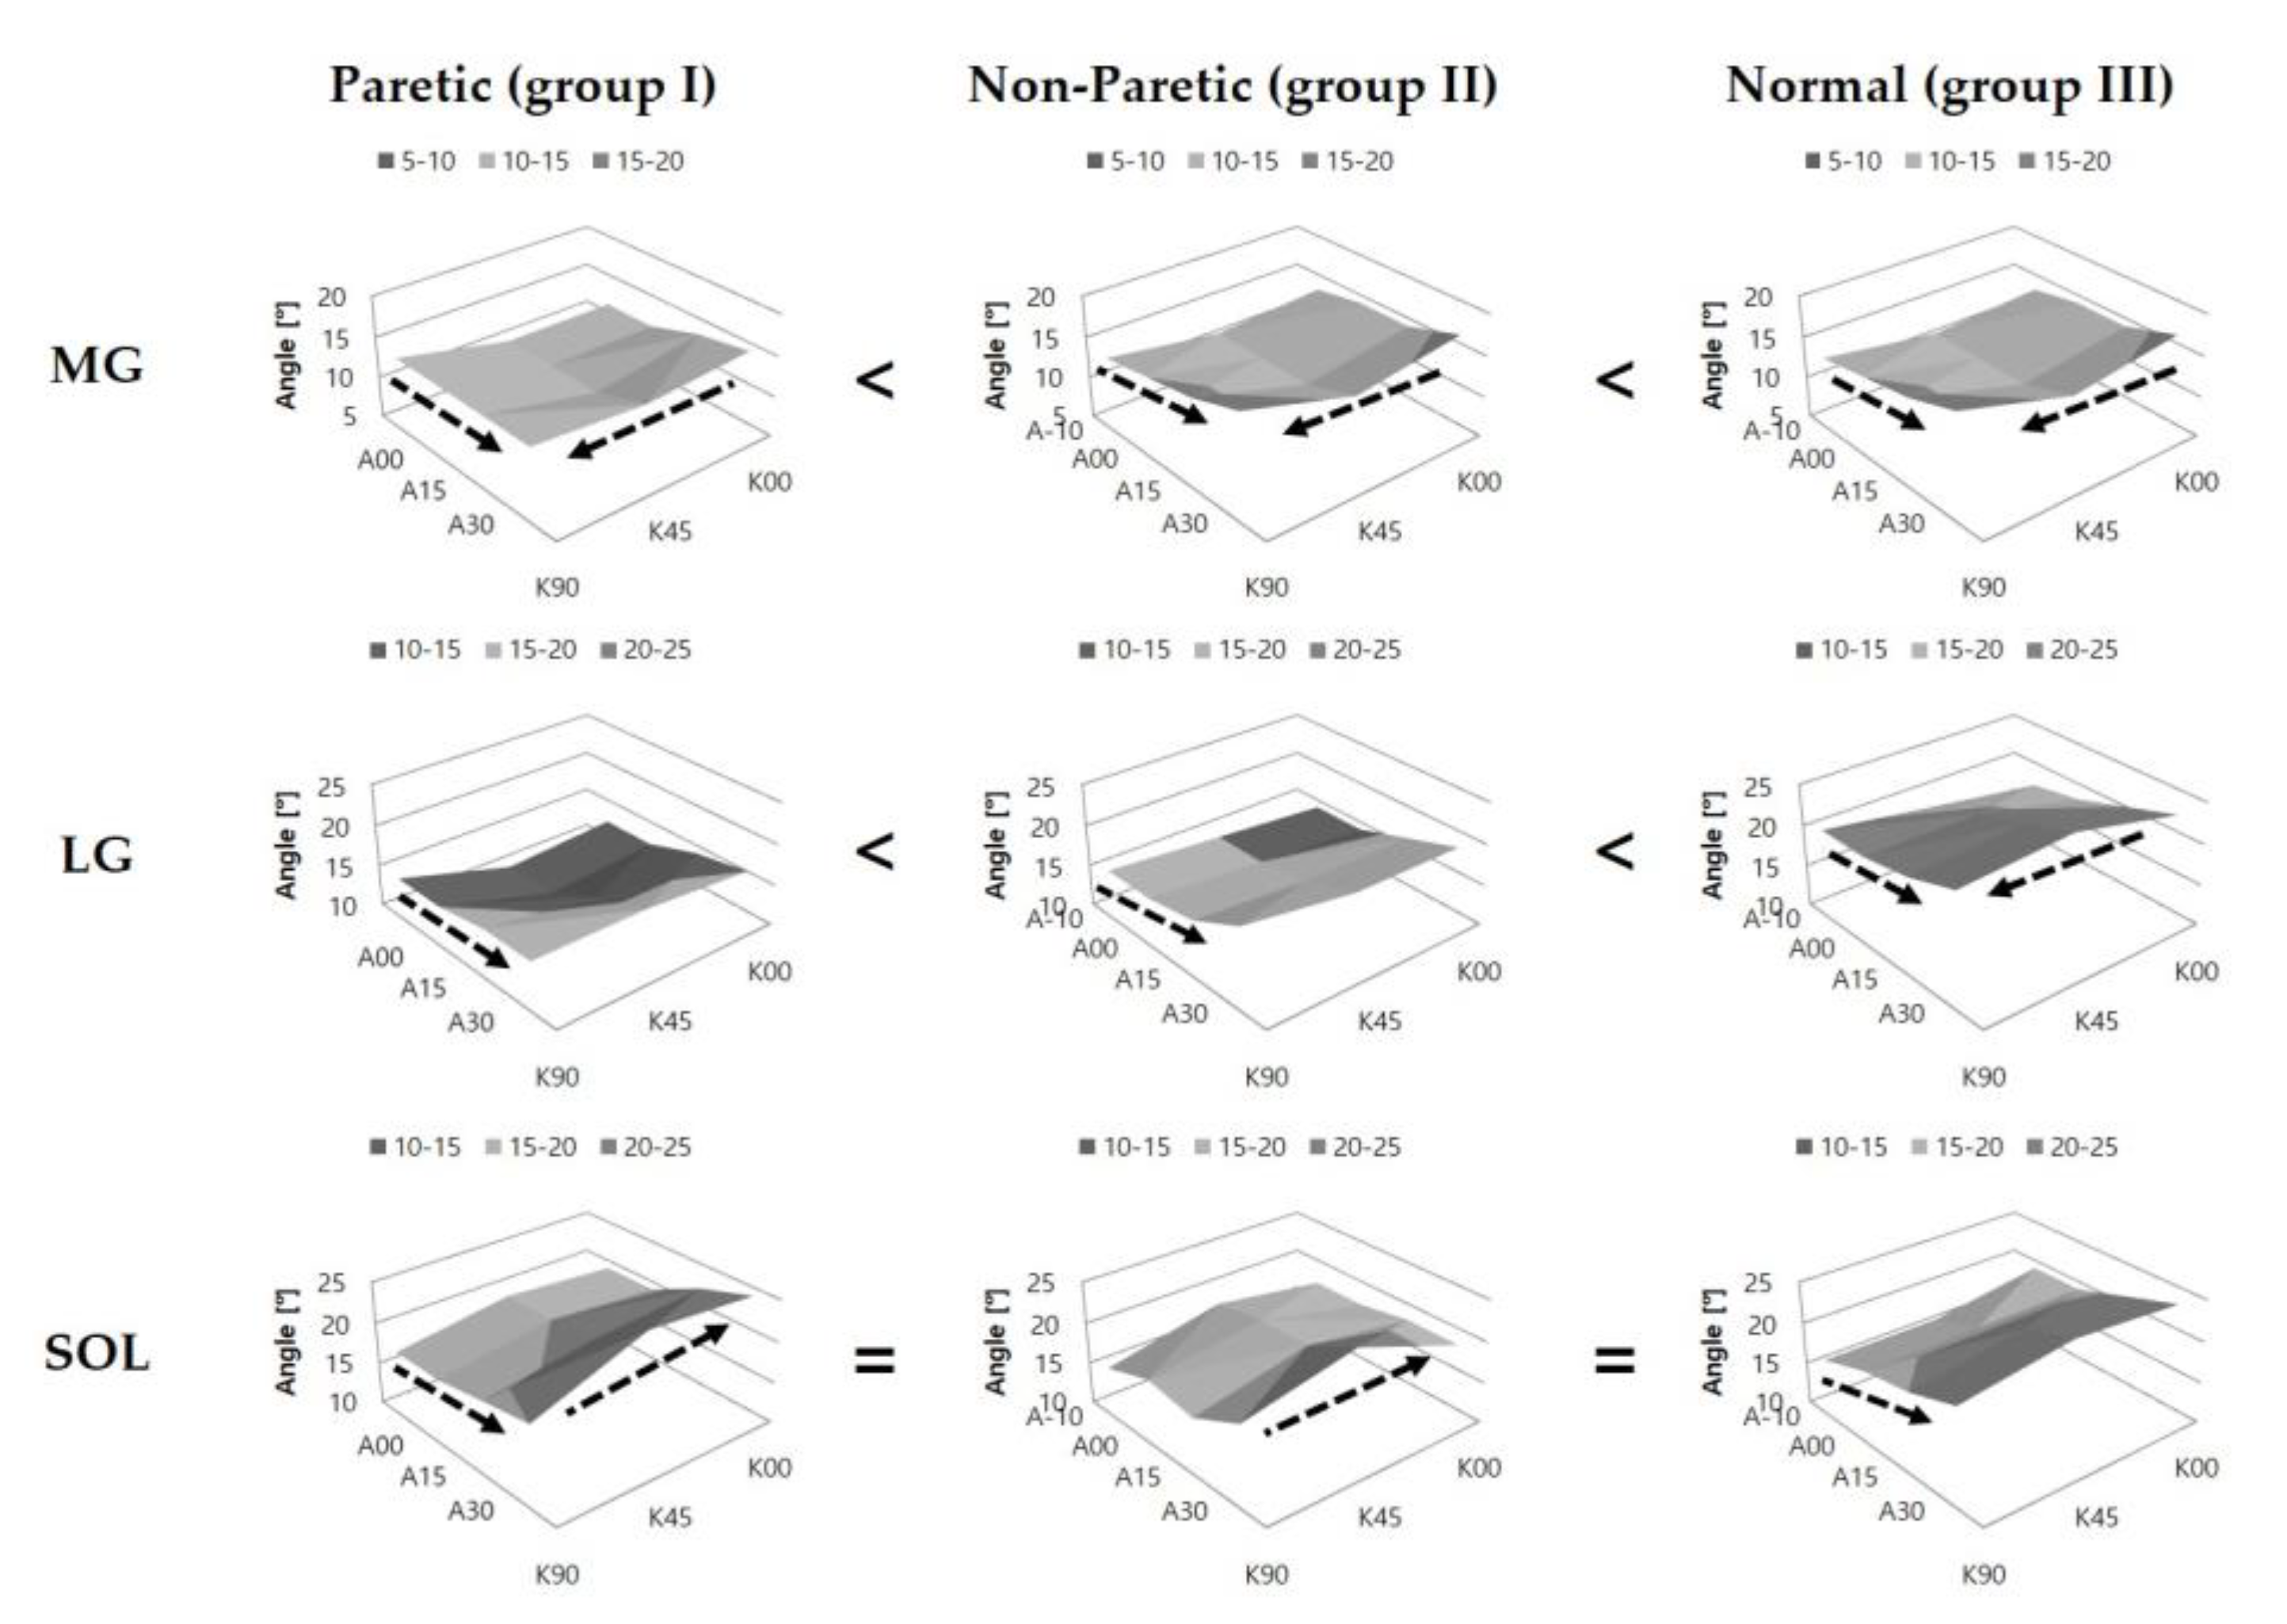
3.3. Comparison of Pennation Angle (Pa)
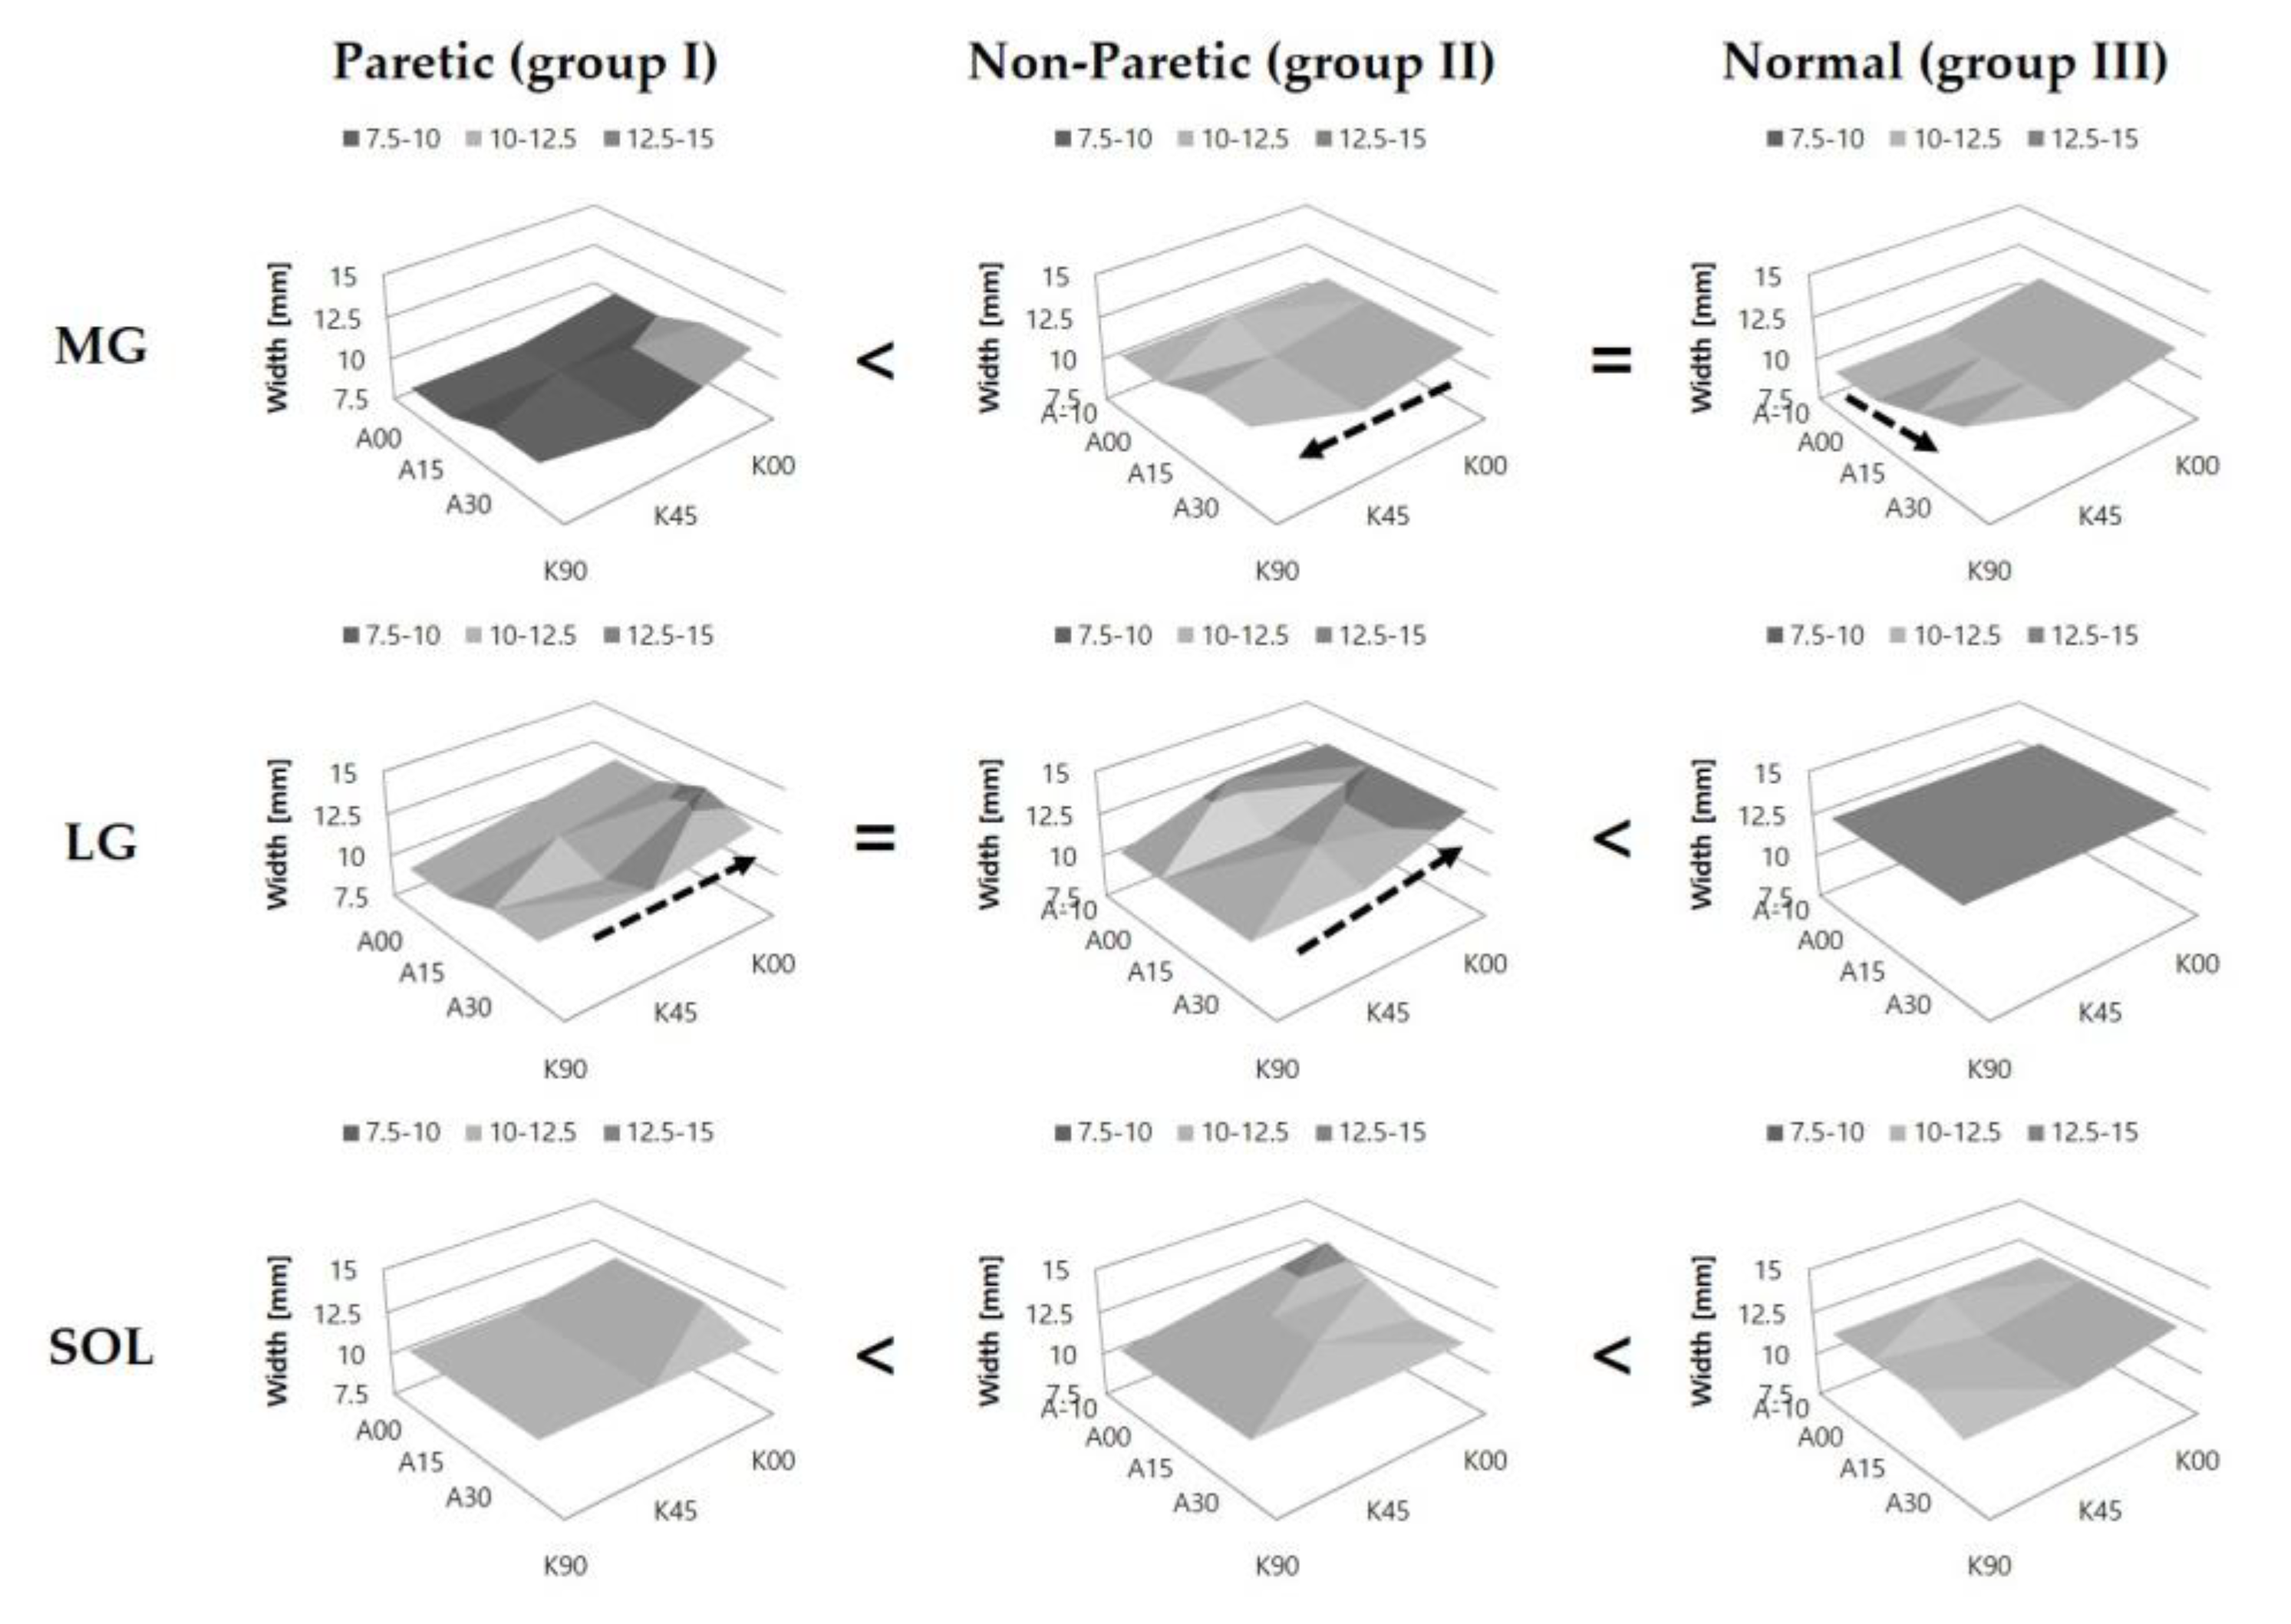
3.4. Comparison of Muscle Thickness (T)
4. Discussion
5. Conclusions
Supplementary Materials
Author Contributions
Funding
Conflicts of Interest
References
- Silfverskiöld, N. Reduction of the uncrossed two-joints muscles of the leg to one-joint muscles in spastic conditions. Acta Chir. Scand. 1924, 56, 1923–1924. [Google Scholar]
- Singh, D. Nils Silfverskiöld (1888-1957) and gastrocnemius contracture. Foot Ankle Surg. 2013, 19, 135–138. [Google Scholar] [CrossRef] [PubMed]
- Perry, J.; Hoffer, M.M.; Giovan, P.; Antonelli, D.; Greenberg, R. Gait analysis of the triceps surae in cerebral palsy. A preoperative and postoperative clinical and electromyographic study. J. Bone Jt. Surg. Am. 1974, 56, 511–520. [Google Scholar] [CrossRef]
- Wren, T.A.L.; Cheatwood, A.P.; Rethlefsen, S.A.; Hara, R.; Perez, F.J.; Kay, R.M. Achilles tendon length and medial gastrocnemius architecture in children with cerebral palsy and equinus gait. J. Pediatr. Orthop. 2010, 30, 479–484. [Google Scholar] [CrossRef]
- Gao, F.; Zhao, H.; Gaebler-Spira, D.; Zhang, L.Q. In vivo evaluations of morphologic changes of gastrocnemius muscle fascicles and achilles tendon in children with cerebral palsy. Am. J. Phys. Med. Rehabil. 2011, 90, 364–371. [Google Scholar] [CrossRef]
- Ishikawa, M.; Komi, P.V.; Grey, M.J.; Lepola, V.; Bruggemann, G.P. Muscle-tendon interaction and elastic energy usage in human walking. J. Appl. Physiol. 2005, 99, 603–608. [Google Scholar] [CrossRef]
- Bojsen-Møller, J.; Hansen, P.; Aagaard, P.; Svantesson, U.; Kjaer, M.; Peter Magnusson, S.P. Differential displacement of the human soleus and medial gastrocnemius aponeuroses during isometric plantar flexor contractions in vivo. J. Appl. Physiol. 2004, 97, 1908–1914. [Google Scholar] [CrossRef]
- DiGiovanni, C.W.; Kuo, R.; Tejwani, N.; Price, R.; Hansen, S.T., Jr.; Cziernecki, J.; Sangeorzan, B.J. Isolated gastrocnemius tightness. J. Bone Jt. Surg. Am. 2002, 84, 962–970. [Google Scholar] [CrossRef]
- Lieber, R.L.; Steinman, S.; Barash, I.A.; Chambers, H. Structural and functional changes in spastic skeletal muscle. Muscle Nerve 2004, 29, 615–627. [Google Scholar] [CrossRef]
- Multani, I.; Manji, J.; Tang, M.J.; Herzog, W.; Howard, J.J.; Graham, H.K. Sarcopenia, Cerebral Palsy, and Botulinum Toxin Type A. J. Bone Jt. Surg. Rev. 2019, 7, e4. [Google Scholar] [CrossRef]
- Kawakami, Y.; Ichinose, Y.; Fukunaga, T. Architectural and functional features of human triceps surae muscles during contraction. J. Appl. Physiol. 1998, 85, 398–404. [Google Scholar] [CrossRef] [PubMed]
- Wakahara, T.; Kanehisa, H.; Kawakami, Y.; Fukunaga, T. Effects of knee joint angle on the fascicle behavior of the gastrocnemius muscle during eccentric plantar flexions. J. Electromyogr. Kinesiol. 2009, 19, 980–987. [Google Scholar] [CrossRef] [PubMed]
- Fukunaga, T.; Ichinose, Y.; Ito, M.; Kawakami, Y.; Fukashiro, S. Determination of fascicle length and pennation in a contracting human muscle in vivo. J. Appl. Physiol. 1997, 82, 354–358. [Google Scholar] [CrossRef] [PubMed]
- Chow, R.S.; Medri, M.K.; Martin, D.C.; Leekam, R.N.; Agur, A.M.; McKee, N.H. Sonographic studies of human soleus and gastrocnemius muscle architecture: Gender variability. Eur. J. Appl. Physiol. 2000, 82, 236–244. [Google Scholar] [CrossRef] [PubMed]
- Kawakami, Y.; Abe, T.; Fukunaga, T. Muscle-fiber pennation angles are greater in hypertrophied than in normal muscles. J. Appl. Physiol. 1993, 74, 2740–2744. [Google Scholar] [CrossRef]
- Maganaris, C.N.; Baltzopoulos, V.; Sargeant, A.J. In vivo measurements of the triceps surae complex architecture in man: Implications for muscle function. J. Physiol. 1998, 512, 603–614. [Google Scholar] [CrossRef]
- Lorenzo, T.M.; Rocon, E.; Caballero, I.M.; Lara, S.L. Medial gastrocnemius structure and gait kinetics in spastic cerebral palsy and typically developing children a cross-sectional study. Medicine 2018, 97, e10776. [Google Scholar] [CrossRef]
- Lorenzo, T.M.; Rodríguez, G.A.; Rocon, E.; Caballero, I.M.; Lara, S.L. Relationship of medial gastrocnemius relative fascicle excursion and ankle joint power and work performance during gait in typically developing children: A cross-sectional study. Medicine 2017, 96, e7572. [Google Scholar] [CrossRef]
- Chen, Y.; He, L.; Xu, K.; Li, J.; Guan, B.; Tang, H. Comparison of calf muscle architecture between Asian children with spastic cerebral palsy and typically developing peers. PLoS ONE 2018, 13, e0190642. [Google Scholar] [CrossRef]
- Noble, J.J.; Fry, N.R.; Lewis, A.P.; Keevil, S.F.; Gough, M.; Shortland, A.P. Lower limb muscle volumes in bilateral spastic cerebral palsy. Brain Dev. 2014, 36, 294–300. [Google Scholar] [CrossRef]
- Herskind, A.; Ritterband-Rosenbaum, A.; Willerslev-Olsen, M.; Lorentzen, J.; Hanson, L.; Lichtwark, G.; Nielsen, J.B. Muscle growth is reduced in 15-month-old children with cerebral palsy. Dev. Med. Child Neurol. 2016, 58, 485–491. [Google Scholar] [CrossRef] [PubMed]
- Kruse, A.; Schranz, C.; Tilp, M.; Svehlik, M. Muscle and tendon morphology alterations in children and adolescents with mild forms of spastic cerebral palsy. BMC Pediatr. 2018, 18, 1–9. [Google Scholar]
- Malaiya, R.; McNee, A.E.; Fry, N.R.; Eve, L.C.; Gough, M.; Shortland, A.P. The morphology of the medial gastrocnemius in typically developing children and children with spastic hemiplegic cerebral palsy. J. Electromyogr. Kinesiol. 2007, 17, 657–663. [Google Scholar] [CrossRef] [PubMed]
- Mohagheghi, A.A.; Khan, T.; Meadows, T.H.; Giannikas, K.; Baltzopoulos, V.; Maganaris, C.N. Differences in gastrocnemius muscle architecture between the paretic and non-paretic legs in children with hemiplegic cerebral palsy. Clin. Biomech. 2007, 22, 718–724. [Google Scholar] [CrossRef] [PubMed]
- Mohagheghi, A.A.; Khan, T.; Meadows, T.H.; Giannikas, K.; Baltzopoulos, V.; Maganaris, C.N. In vivo gastrocnemius muscle fascicle length in children with and without diplegic cerebral palsy. Dev. Med. Child Neurol. 2008, 50, 44–50. [Google Scholar] [CrossRef]
- Shortland, A.P.; Harris, C.A.; Gough, M.; Robinson, R.O. Architecture of the medial gastrocnemius in children with spastic diplegia. Dev. Med. Child Neurol. 2002, 44, 158–163. [Google Scholar] [CrossRef]
- Shortland, A.P.; Fry, N.R.; Eve, L.C.; Gough, M. Changes to medial gastrocnemius architecture after surgical intervention in spastic diplegia. Dev. Med. Child Neurol. 2004, 46, 667–673. [Google Scholar] [CrossRef]
- Barber, L.; Hastings-Ison, T.; Baker, R.; Barrett, R.; Lichtwark, G. Medial gastrocnemius muscle volume and fascicle length in children aged 2 to 5years with cerebral palsy. Dev. Med. Child Neurol. 2011, 53, 543–548. [Google Scholar] [CrossRef]
- Palisano, R.; Rosenbaum, P.; Walter, S.; Russell, D.; Wood, E.; Galuppi, B. Development and reliability of a system to classify gross motor function in children with cerebral palsy. Dev. Med. Child Neurol. 1997, 39, 214–223. [Google Scholar] [CrossRef]
- Winters, T.F.; Gage, J.R.; Hicks, R. Gait patterns in spastic hemiplegia in children and young adults Patterns in Spastic and Young Hemiplegia Adults. J. Bone Jt. Surg. Am. 1987, 69, 437–441. [Google Scholar]
- Martin, D.C.; Medri, M.K.; Chow, R.S.; Oxorn, V.; Leekam, R.N.; Agur, A.M.; McKee, N.H. Comparing human skeletal muscle architectural parameters of cadavers with in vivo ultrasonographic measurements. J. Anat. 2001, 199, 429–434. [Google Scholar] [CrossRef] [PubMed]
- Bénard, M.R.; Becher, J.G.; Harlaar, J.; Huijing, P.A.; Jaspers, R.T. Anatomical information is needed in ultrasound imaging of muscle to avoid potentially substantial errors in measurement of muscle geometry. Muscle Nerve 2009, 39, 652–665. [Google Scholar] [CrossRef] [PubMed]
- Firth, G.B.; McMullan, M.; Chin, T.; Ma, F.; Selber, P.; Eizenberg, N.; Wolfe, R.; Graham, H.K. Lengthening of the gastrocnemius-soleus complex: An anatomical and biomechanical study in human cadavers. J. Bone Jt. Surg. Am. 2013, 95, 1489–1496. [Google Scholar] [CrossRef] [PubMed]
- Fry, N.R.; Gough, M.; McNee, A.E.; Shortland, A.P. Changes in the volume and length of the medial gastrocnemius after surgical recession in children with spastic diplegic cerebral palsy. J. Pediatr. Orthop. 2007, 27, 769–774. [Google Scholar] [CrossRef] [PubMed]
- Antonios, T.; Adds, P.J. The medial and lateral bellies of gastrocnemius: A cadaveric and ultrasound investigation. Clin. Anat. 2008, 21, 66–74. [Google Scholar] [CrossRef] [PubMed]
- Park, E.S.; Sim, E.; Rha, D.W.; Jung, S. Architectural Changes of the Gastrocnemius Muscle after Botulinum Toxin Type an Injection in Children with Cerebral Palsy. Yonsei Med. J. 2014, 55, 1406–1412. [Google Scholar] [CrossRef]
- Mathewson, M.A.; Lieber, R.L. Pathophysiology of muscle contractures in cerebral palsy. Phys. Med. Rehabil. Clin. N. Am. 2015, 26, 57–67. [Google Scholar] [CrossRef] [Green Version]
- Fortuna, R.; Vaz, M.A.; Sawatsky, A.; Hart, D.A.; Herzog, W. A clinically relevant BTX-A injection protocol leads to persistent weakness, contractile material loss, and an altered mRNA expression phenotype in rabbit quadriceps muscles. J. Biomech. 2015, 48, 1700–1706. [Google Scholar] [CrossRef] [Green Version]
- Morcuende, J.A.; Sanders, J.O. Embryology and Development of the Neuromuscular Apparatus. In Lovell and Winter’s Pediatric Orthopaedics, 7th ed.; Weinstein, S.L., Flynn, J.M., Eds.; Lippincott Williams & Wilkins: Philadelphia, PA, USA, 2014; Volume 1, p. 25. [Google Scholar]
- Bénard, M.R.; Harlaar, J.; Becher, J.G.; Huijing, P.A.; Jaspers, R.T. Effects of growth on geometry of gastrocnemius muscle in children: A three-dimensional ultrasound analysis. J. Anat. 2011, 219, 388–402. [Google Scholar] [CrossRef]
- Pitcher, C.A.; Elliott, C.M.; Panizzolo, F.A.; Valentine, J.P.; Stannage, K.; Reid, S.L. Ultrasound characterization of medial gastrocnemius tissue composition in children with spastic cerebral palsy. Muscle Nerve 2015, 52, 397–403. [Google Scholar] [CrossRef]
- Bolsterlee, B.; Gandevia, S.C.; Herbert, R.D. Effect of Transducer Orientation on Errors in Ultrasound Image-Based Measurements of Human Medial Gastrocnemius Muscle Fascicle Length and Pennation. PLoS ONE 2016, 11, e0157273. [Google Scholar] [CrossRef] [PubMed] [Green Version]
- Fry, N.R.; Gough, M.; Shortland, A.P. Three-dimensional realization of muscle morphology and architecture using ultrasound. Gait Posture 2004, 20, 177–182. [Google Scholar] [CrossRef] [PubMed]


| ID | Sex | Age (Month) | Height (cm) | Weight (kg) | Femoral Anteversion (°) | Tibial Torsion (°) | |||
|---|---|---|---|---|---|---|---|---|---|
| Rt | Lt | Rt | Lt | ||||||
| SHCP | 1 | M | 87 | 135 | 40 | 18 | 10 | 22 | 18 |
| 2 | M | 60 | 110 | 19 | 10 | 16 | 5 | 14 | |
| 3 | M | 60 | 105 | 18 | 23 | 22 | 29 | 19 | |
| 4 | M | 66 | 112 | 14 | 16 | 28 | 15 | 14 | |
| 5 | M | 60 | 118 | 23 | 14 | 22 | 16 | 23 | |
| 6 | F | 20 | 105 | 14 | 6 | 16 | 22 | 16 | |
| 7 | F | 109 | 163 | 55 | 12 | 24 | 20 | 22 | |
| 8 | F | 121 | 155 | 49 | 17 | 10 | 14 | 18 | |
| 9 | F | 71 | 112 | 18 | 20 | 11 | 17 | 26 | |
| 10 | M | 70 | 104 | 15 | 5 | 11 | 13 | 11 | |
| Normal children | 11 | M | 83 | 124 | 23 | 8 | 9 | 17 | 20 |
| 12 | M | 62 | 114 | 21 | 20 | 22 | 21 | 20 | |
| 13 | M | 85 | 131 | 26 | 18 | 20 | 20 | 23 | |
| 14 | M | 85 | 125 | 34 | 10 | 12 | 15 | 18 | |
| 15 | M | 84 | 126 | 26 | 13 | 11 | 16 | 18 | |
| 16 | F | 96 | 116 | 20 | 19 | 22 | 19 | 22 | |
| 17 | F | 88 | 135 | 34 | 17 | 16 | 21 | 24 | |
| 18 | F | 73 | 112 | 20 | 20 | 19 | 17 | 20 | |
| 19 | F | 76 | 128 | 22 | 16 | 14 | 23 | 22 | |
| 20 | M | 92 | 116 | 21 | 8 | 8 | 15 | 17 | |
© 2019 by the authors. Licensee MDPI, Basel, Switzerland. This article is an open access article distributed under the terms and conditions of the Creative Commons Attribution (CC BY) license (http://creativecommons.org/licenses/by/4.0/).
Share and Cite
Park, K.-B.; Joo, S.Y.; Park, H.; Rhee, I.; Shin, J.-K.; Abdel-Baki, S.W.; Kim, H.W. Architecture of the Triceps Surae Muscles Complex in Patients with Spastic Hemiplegia: Implication for the Limited Utility of the Silfverskiöld Test. J. Clin. Med. 2019, 8, 2096. https://doi.org/10.3390/jcm8122096
Park K-B, Joo SY, Park H, Rhee I, Shin J-K, Abdel-Baki SW, Kim HW. Architecture of the Triceps Surae Muscles Complex in Patients with Spastic Hemiplegia: Implication for the Limited Utility of the Silfverskiöld Test. Journal of Clinical Medicine. 2019; 8(12):2096. https://doi.org/10.3390/jcm8122096
Chicago/Turabian StylePark, Kun-Bo, Sun Young Joo, Hoon Park, Isaac Rhee, Jong-Kwan Shin, Sharkawy Wagih Abdel-Baki, and Hyun Woo Kim. 2019. "Architecture of the Triceps Surae Muscles Complex in Patients with Spastic Hemiplegia: Implication for the Limited Utility of the Silfverskiöld Test" Journal of Clinical Medicine 8, no. 12: 2096. https://doi.org/10.3390/jcm8122096