The Lipid Status in Patients with Ulcerative Colitis: Sphingolipids are Disease-Dependent Regulated

 , , ,
, , ,
Abstract
:1. Introduction
2. Experimental Section
2.1. Cohort
2.2. Isolation of White Blood Cells (WBCs) from Blood Samples
2.3. Real-Time qPCR
2.4. Liquid Chromatography Tandem Mass Spectrometry (LC-MS/MS) Analysis of Sphingolipids
2.5. Liquid Chromatography Quadrupole-time-of-flight Mass Spectrometry (LC-QTOFMS) Analysis of Lipids in Plasma
2.6. Immunohistochemistry
2.7. Statistics
3. Results
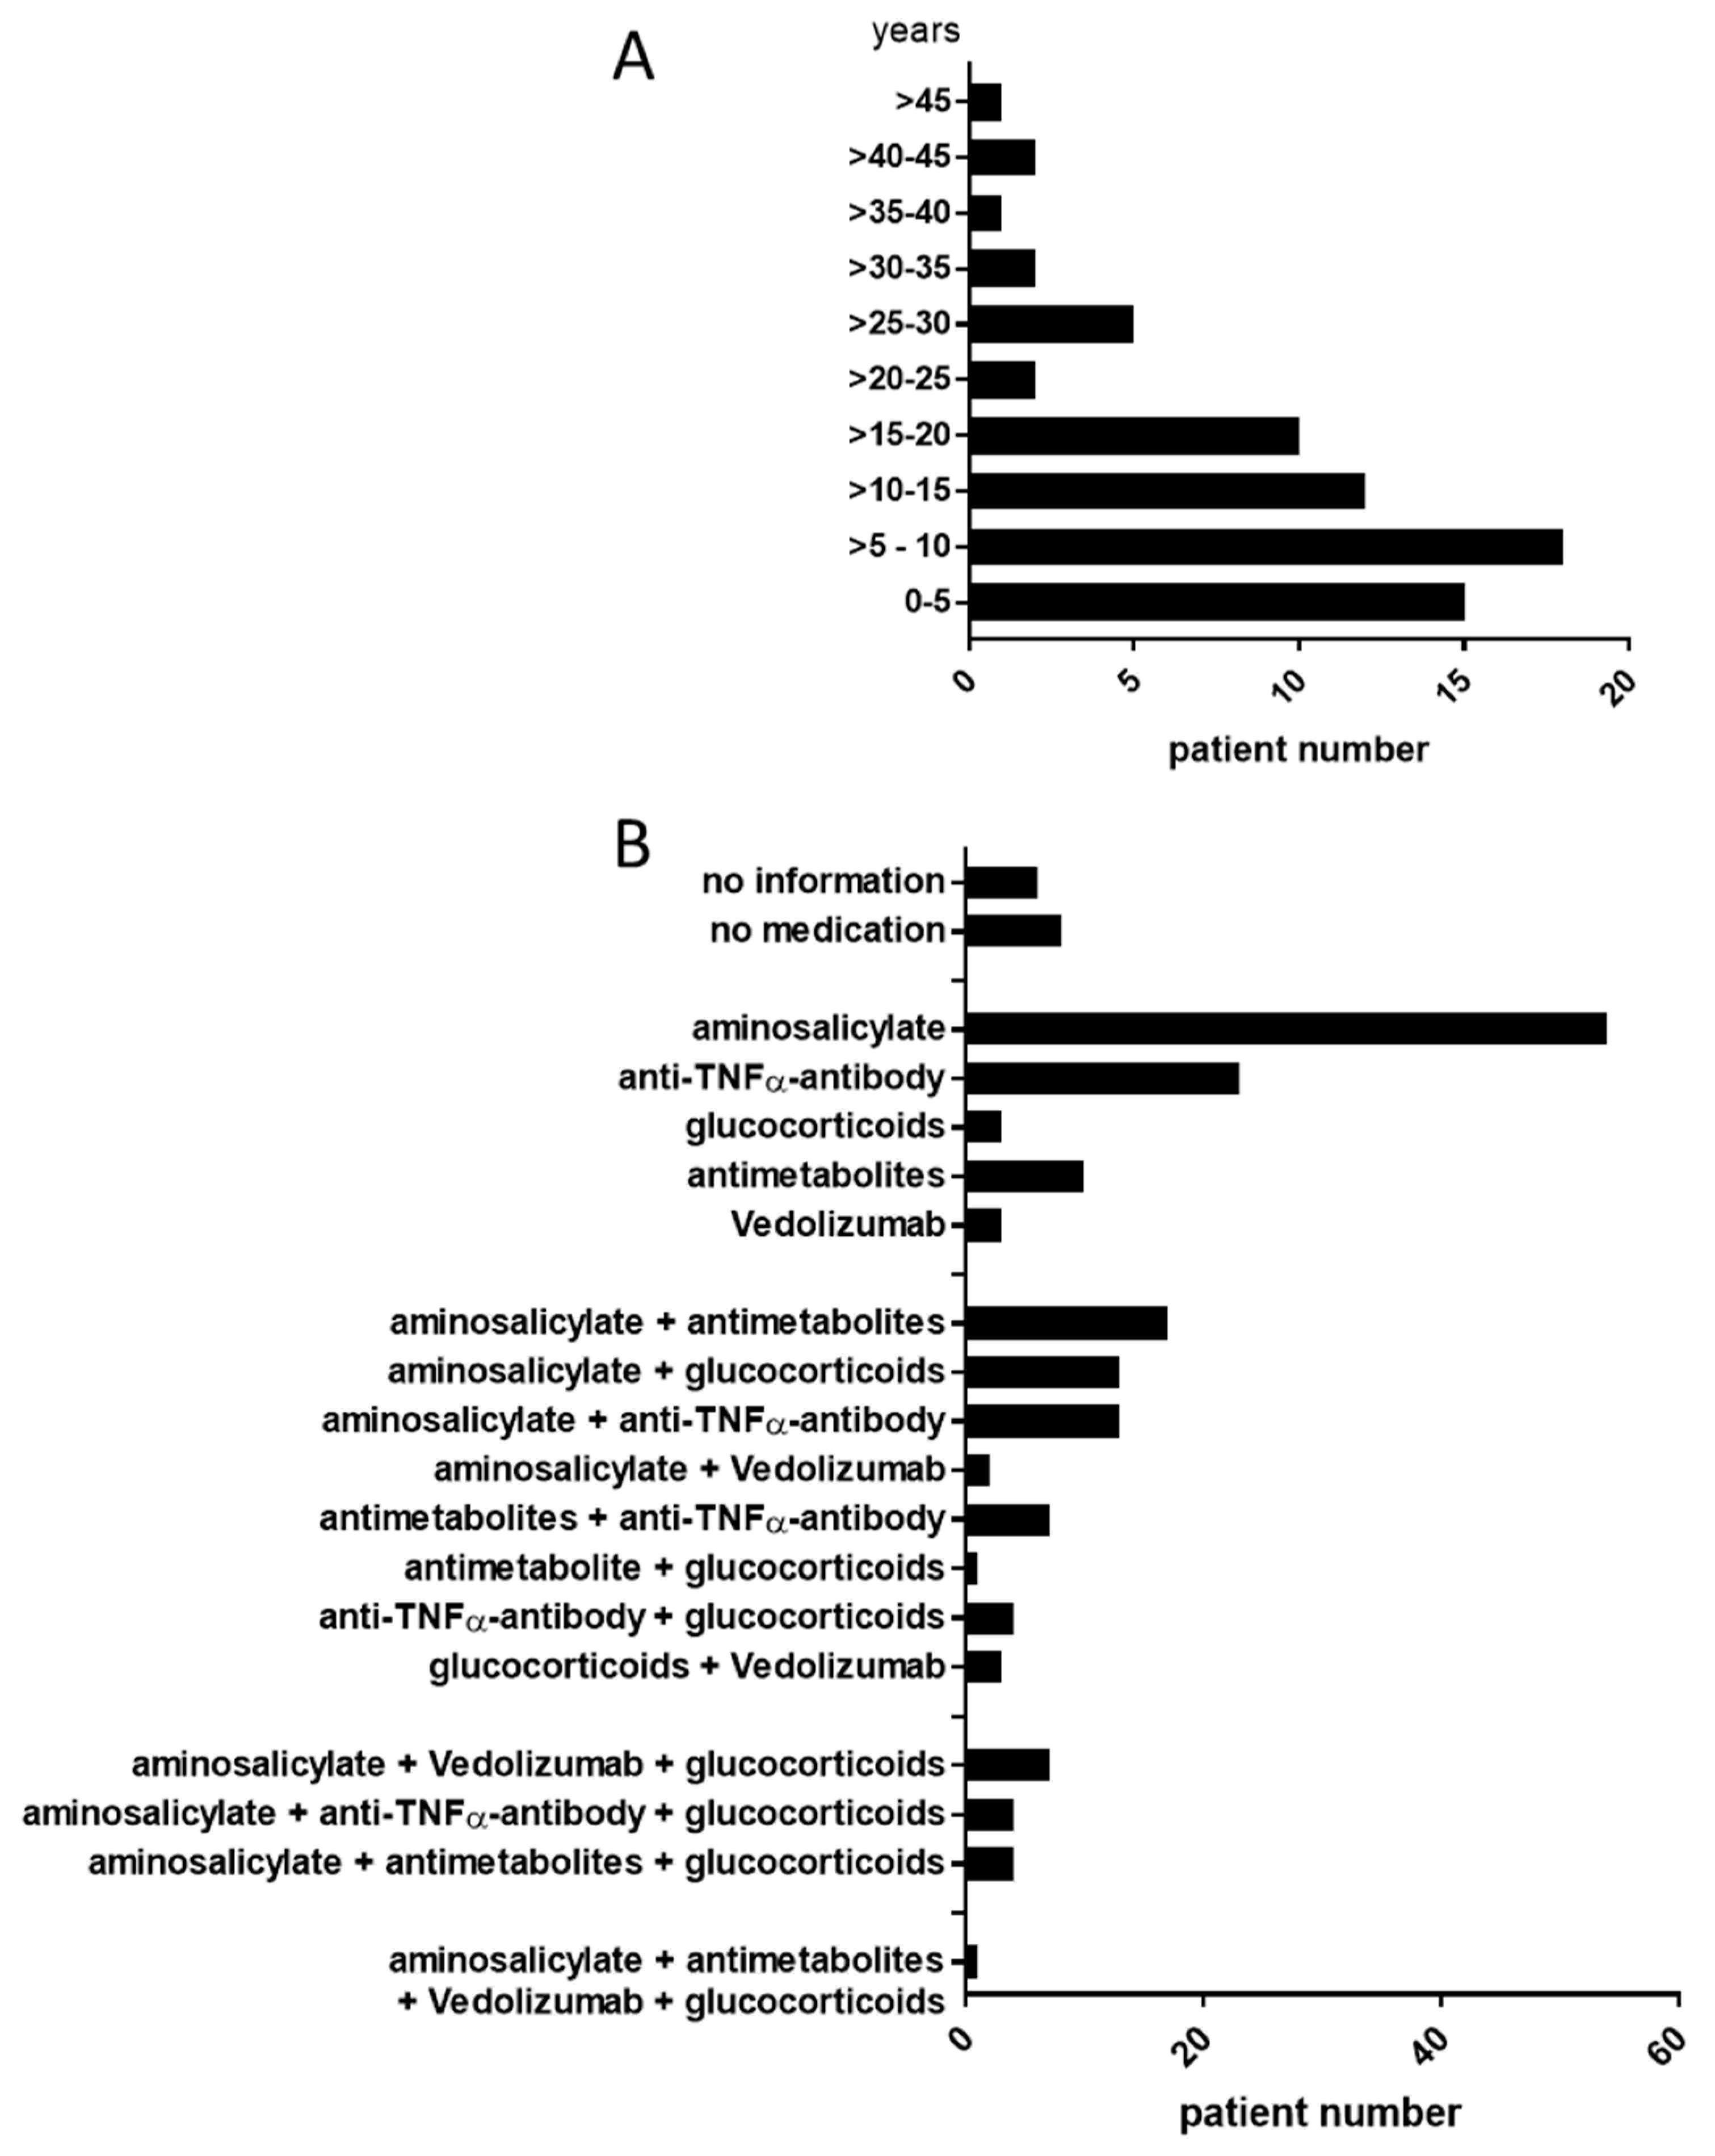
3.1. Patient Data
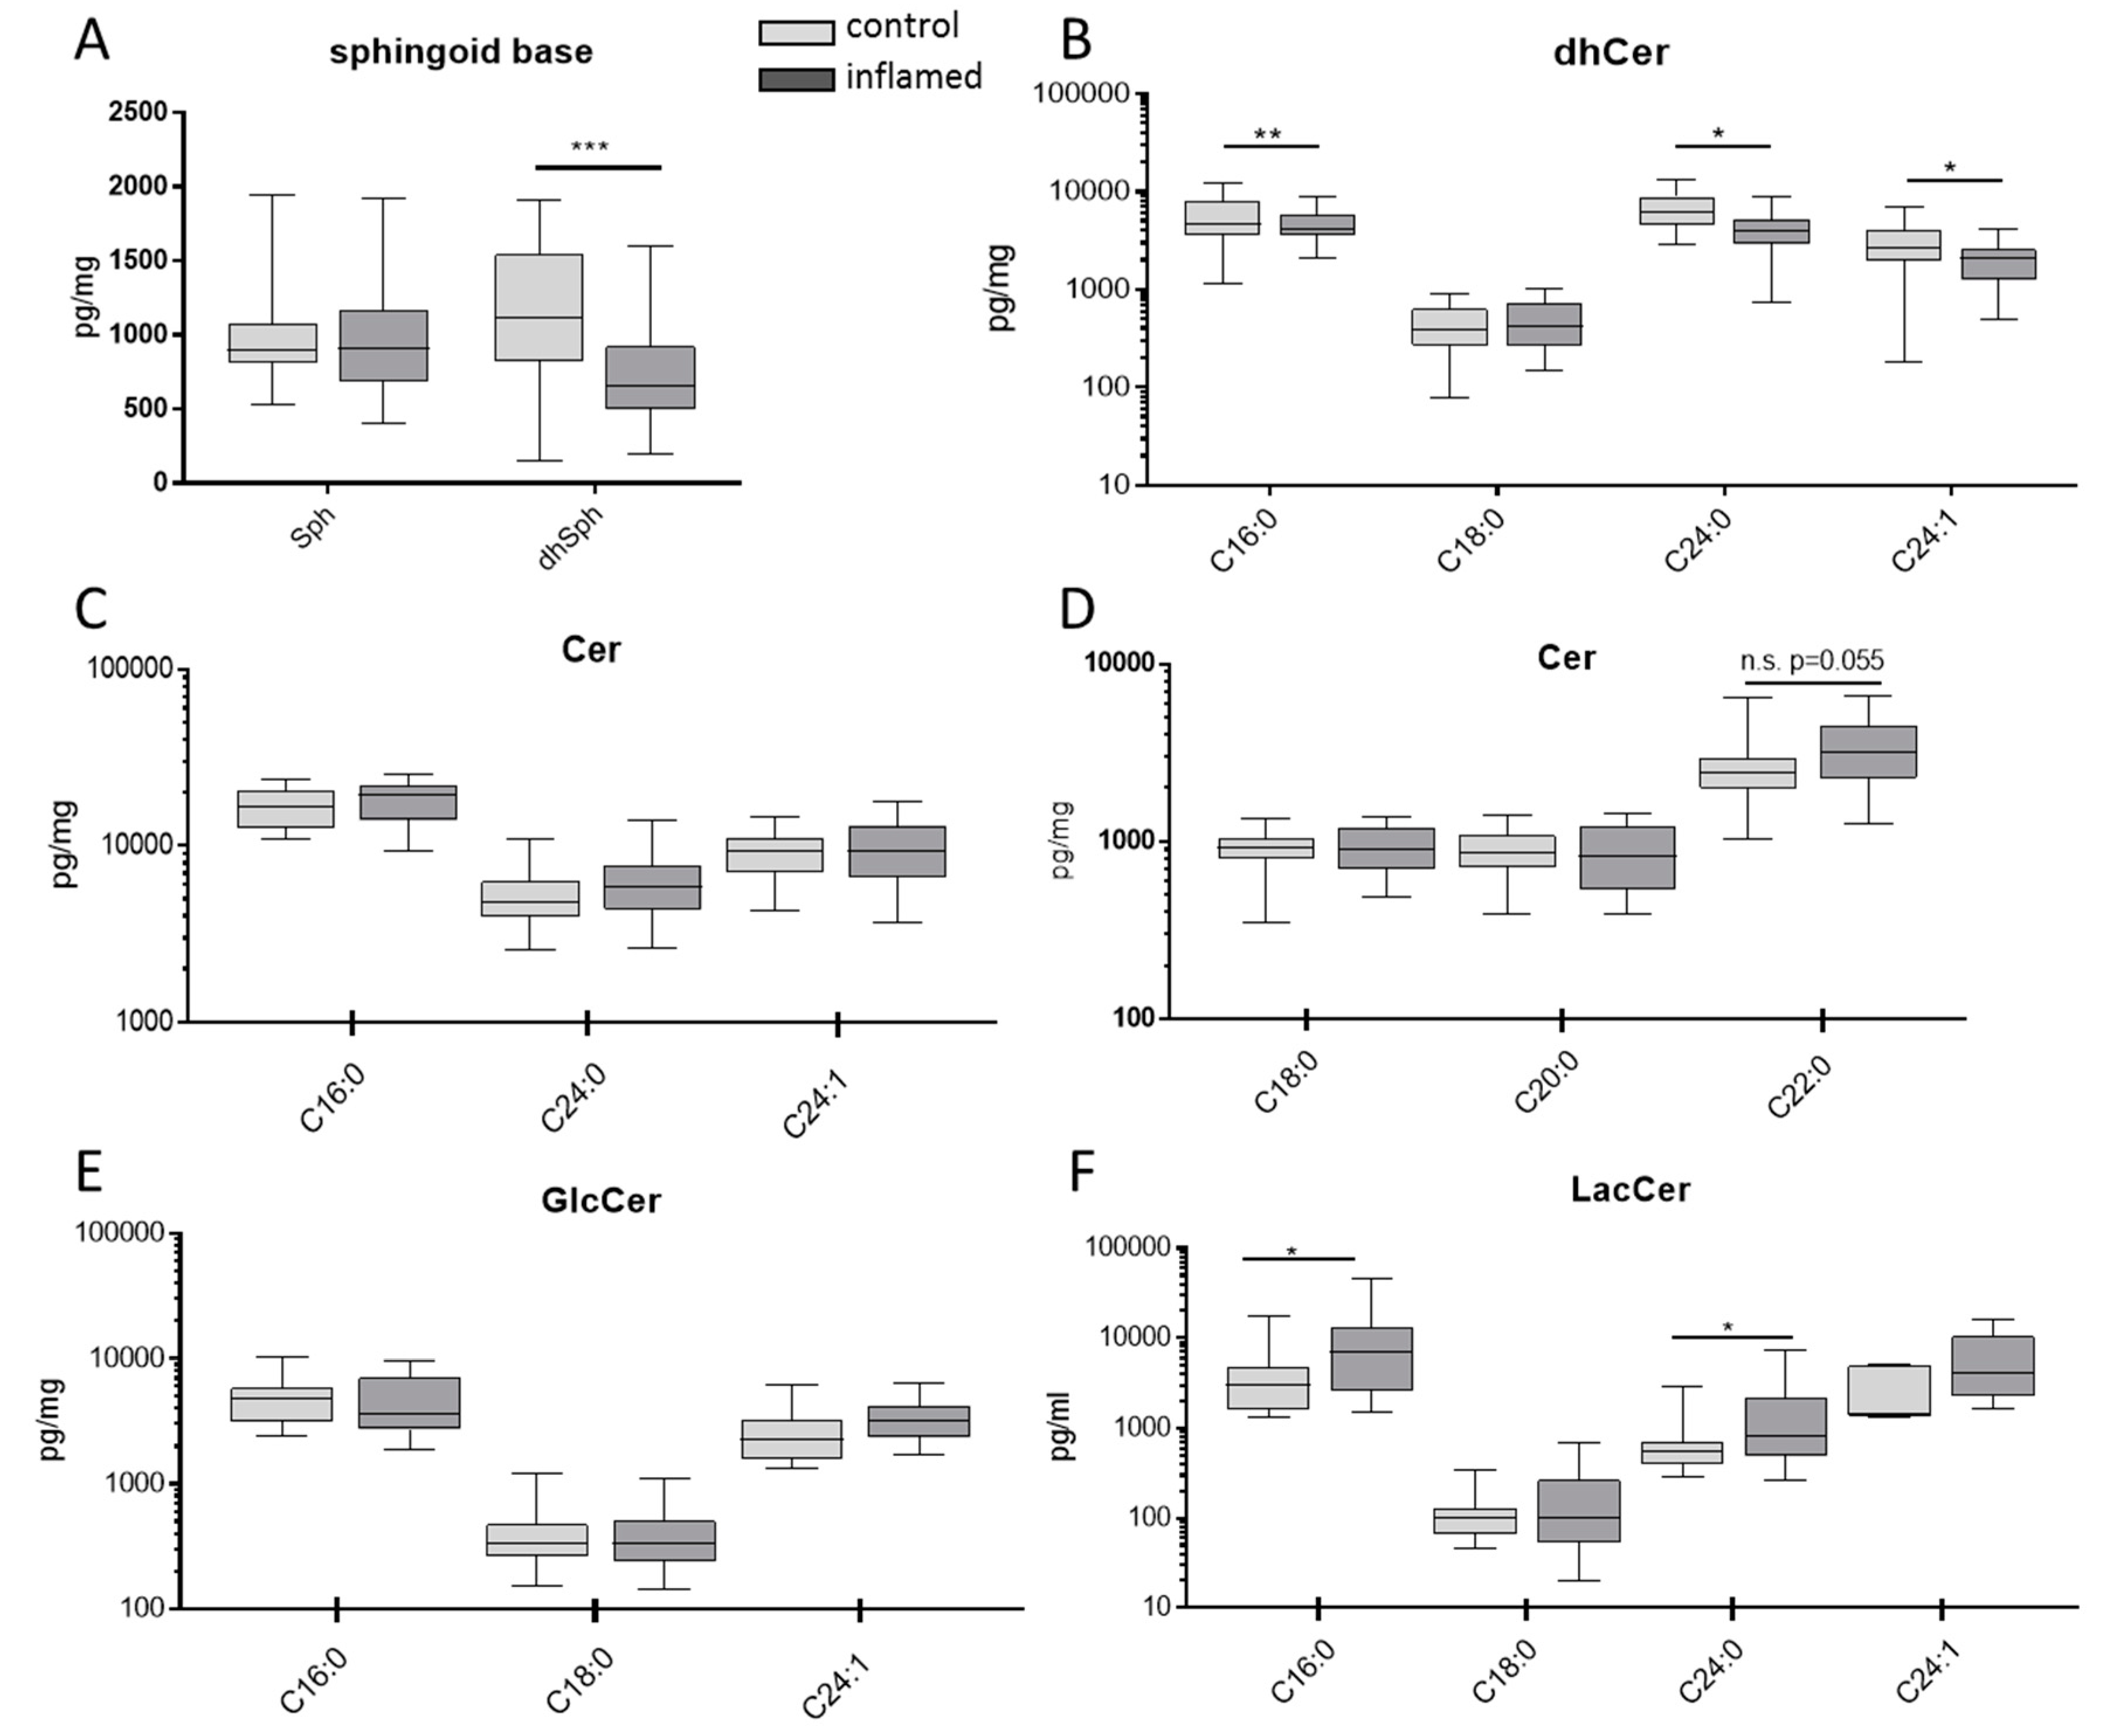
3.2. Sphingolipids in Colon Tissue
3.3. Lipids in Blood
3.3.1. Sphingolipids in Blood
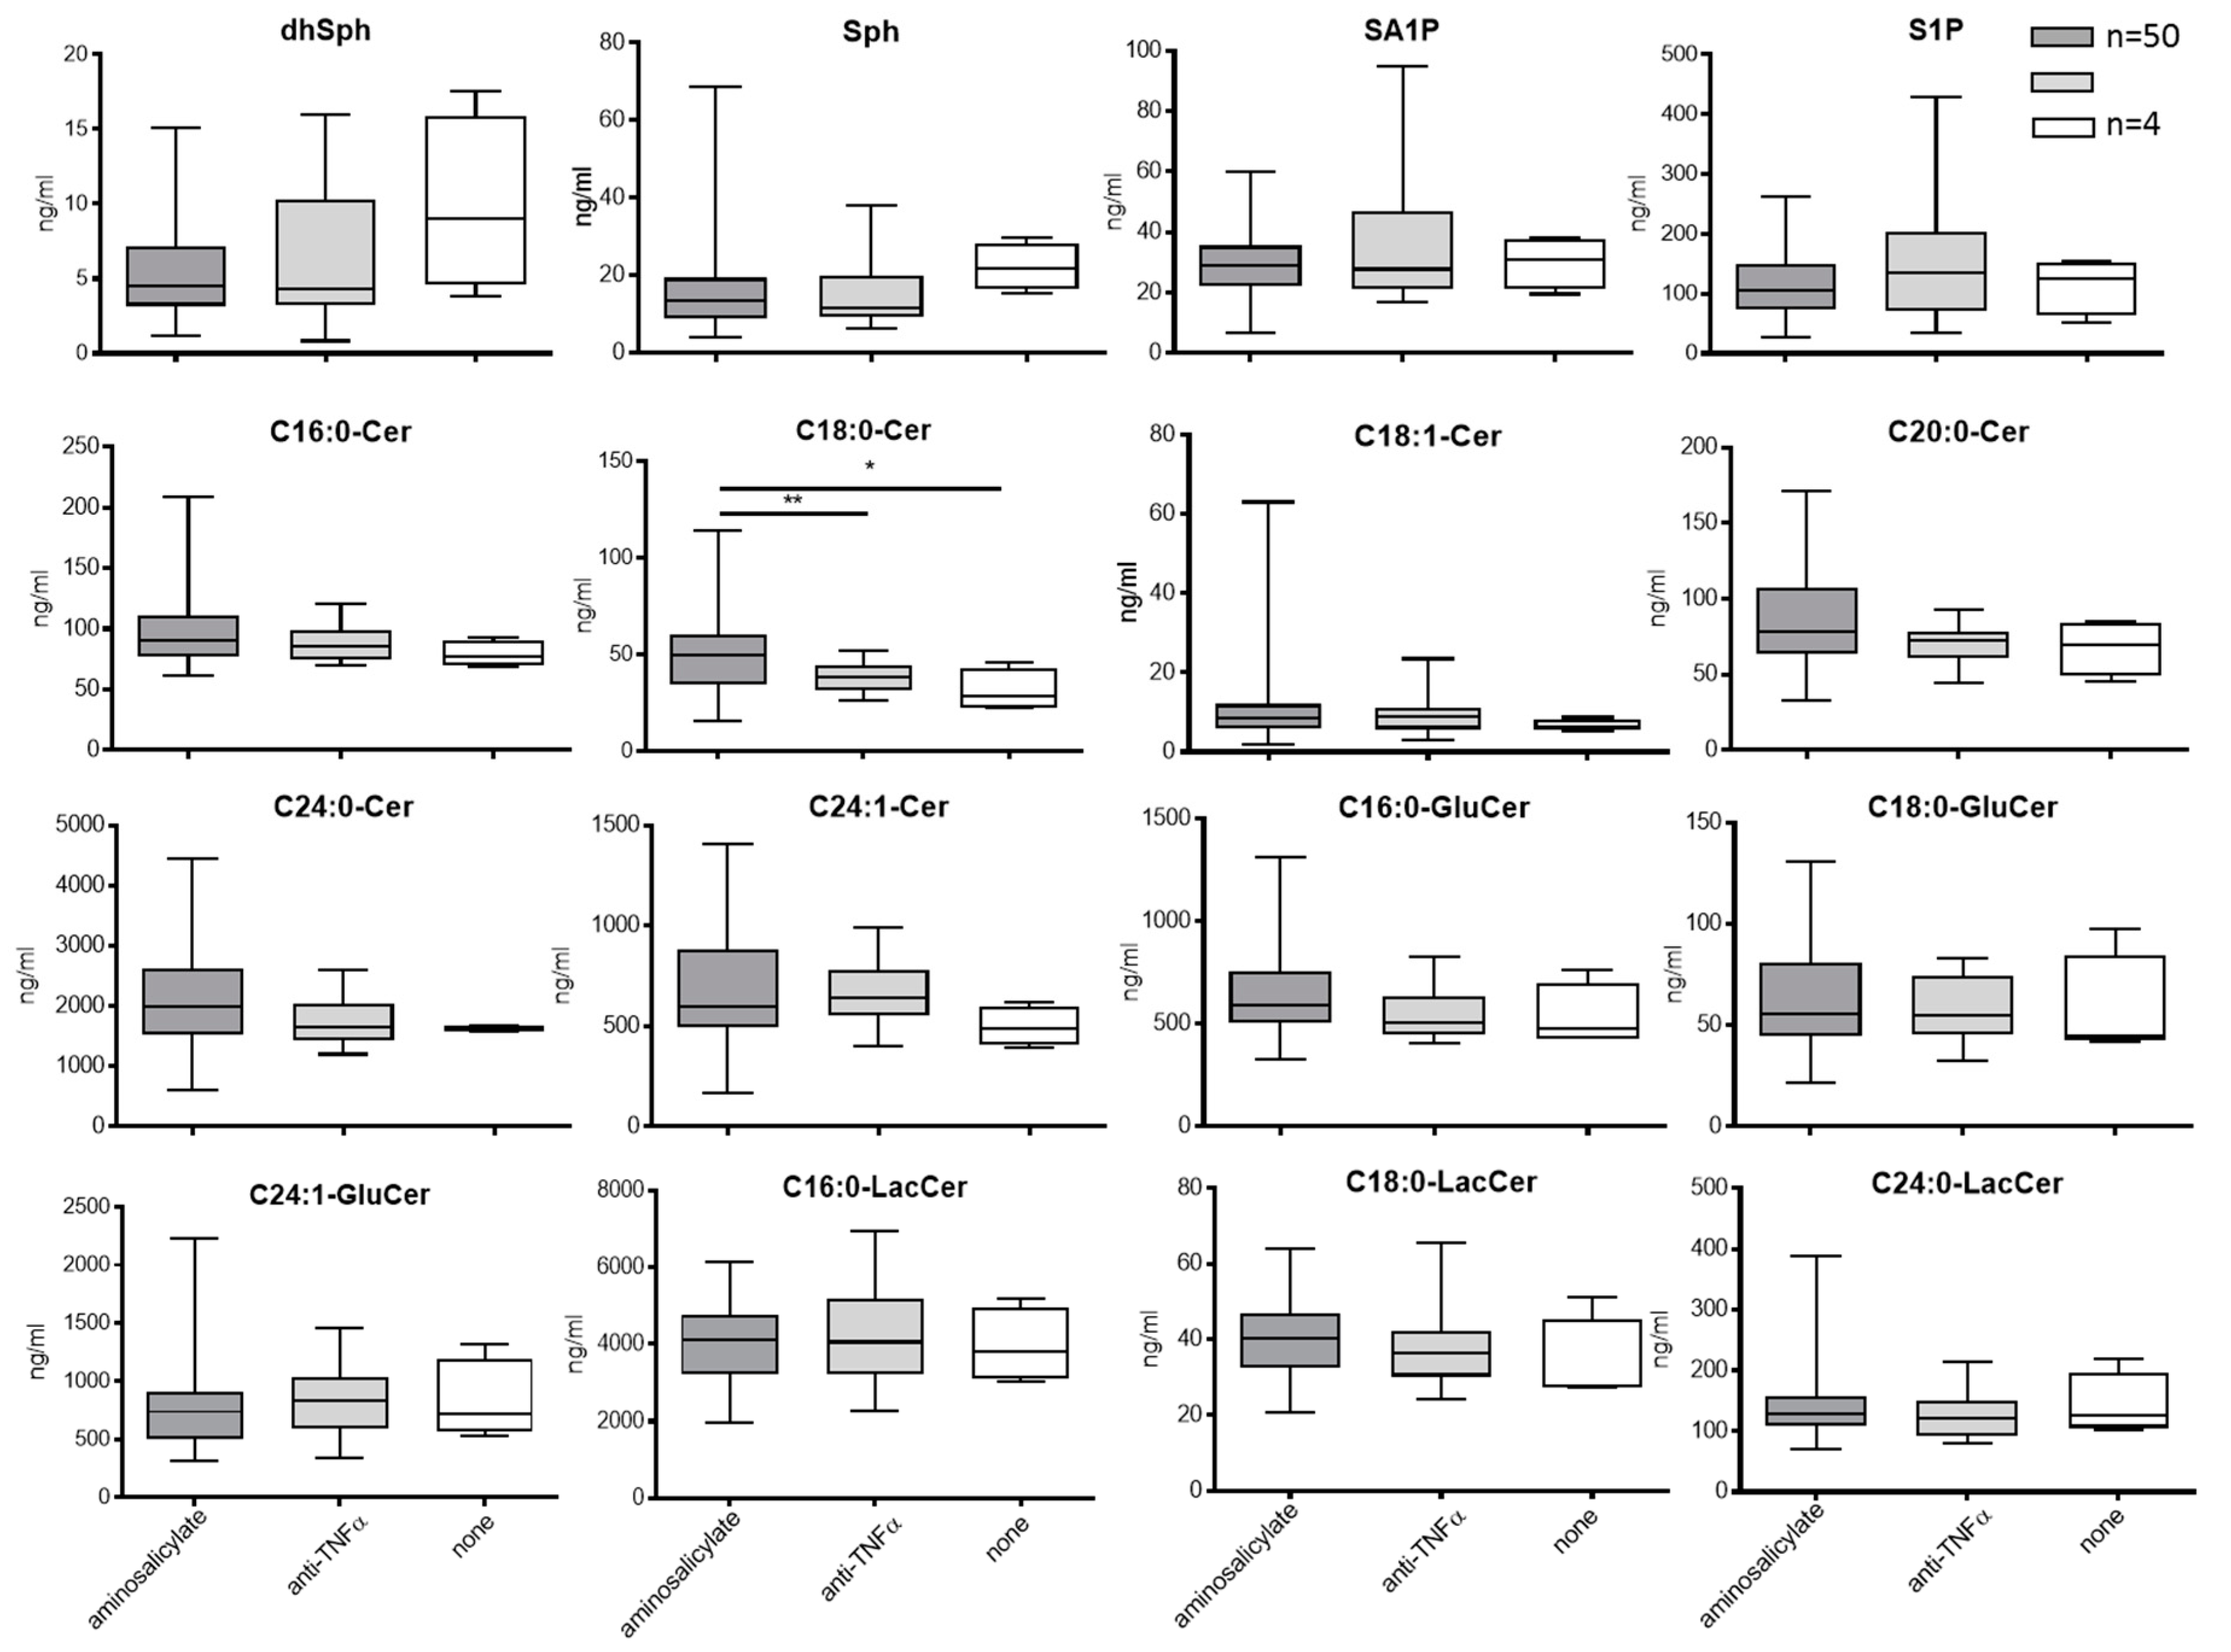
3.3.2. Blood Sphingolipids in Correlation to Treatment with Aminosalicylate or Anti-TNFa
3.3.3. Expression Level of Enzymes of the Sphingolipid De Novo Pathway
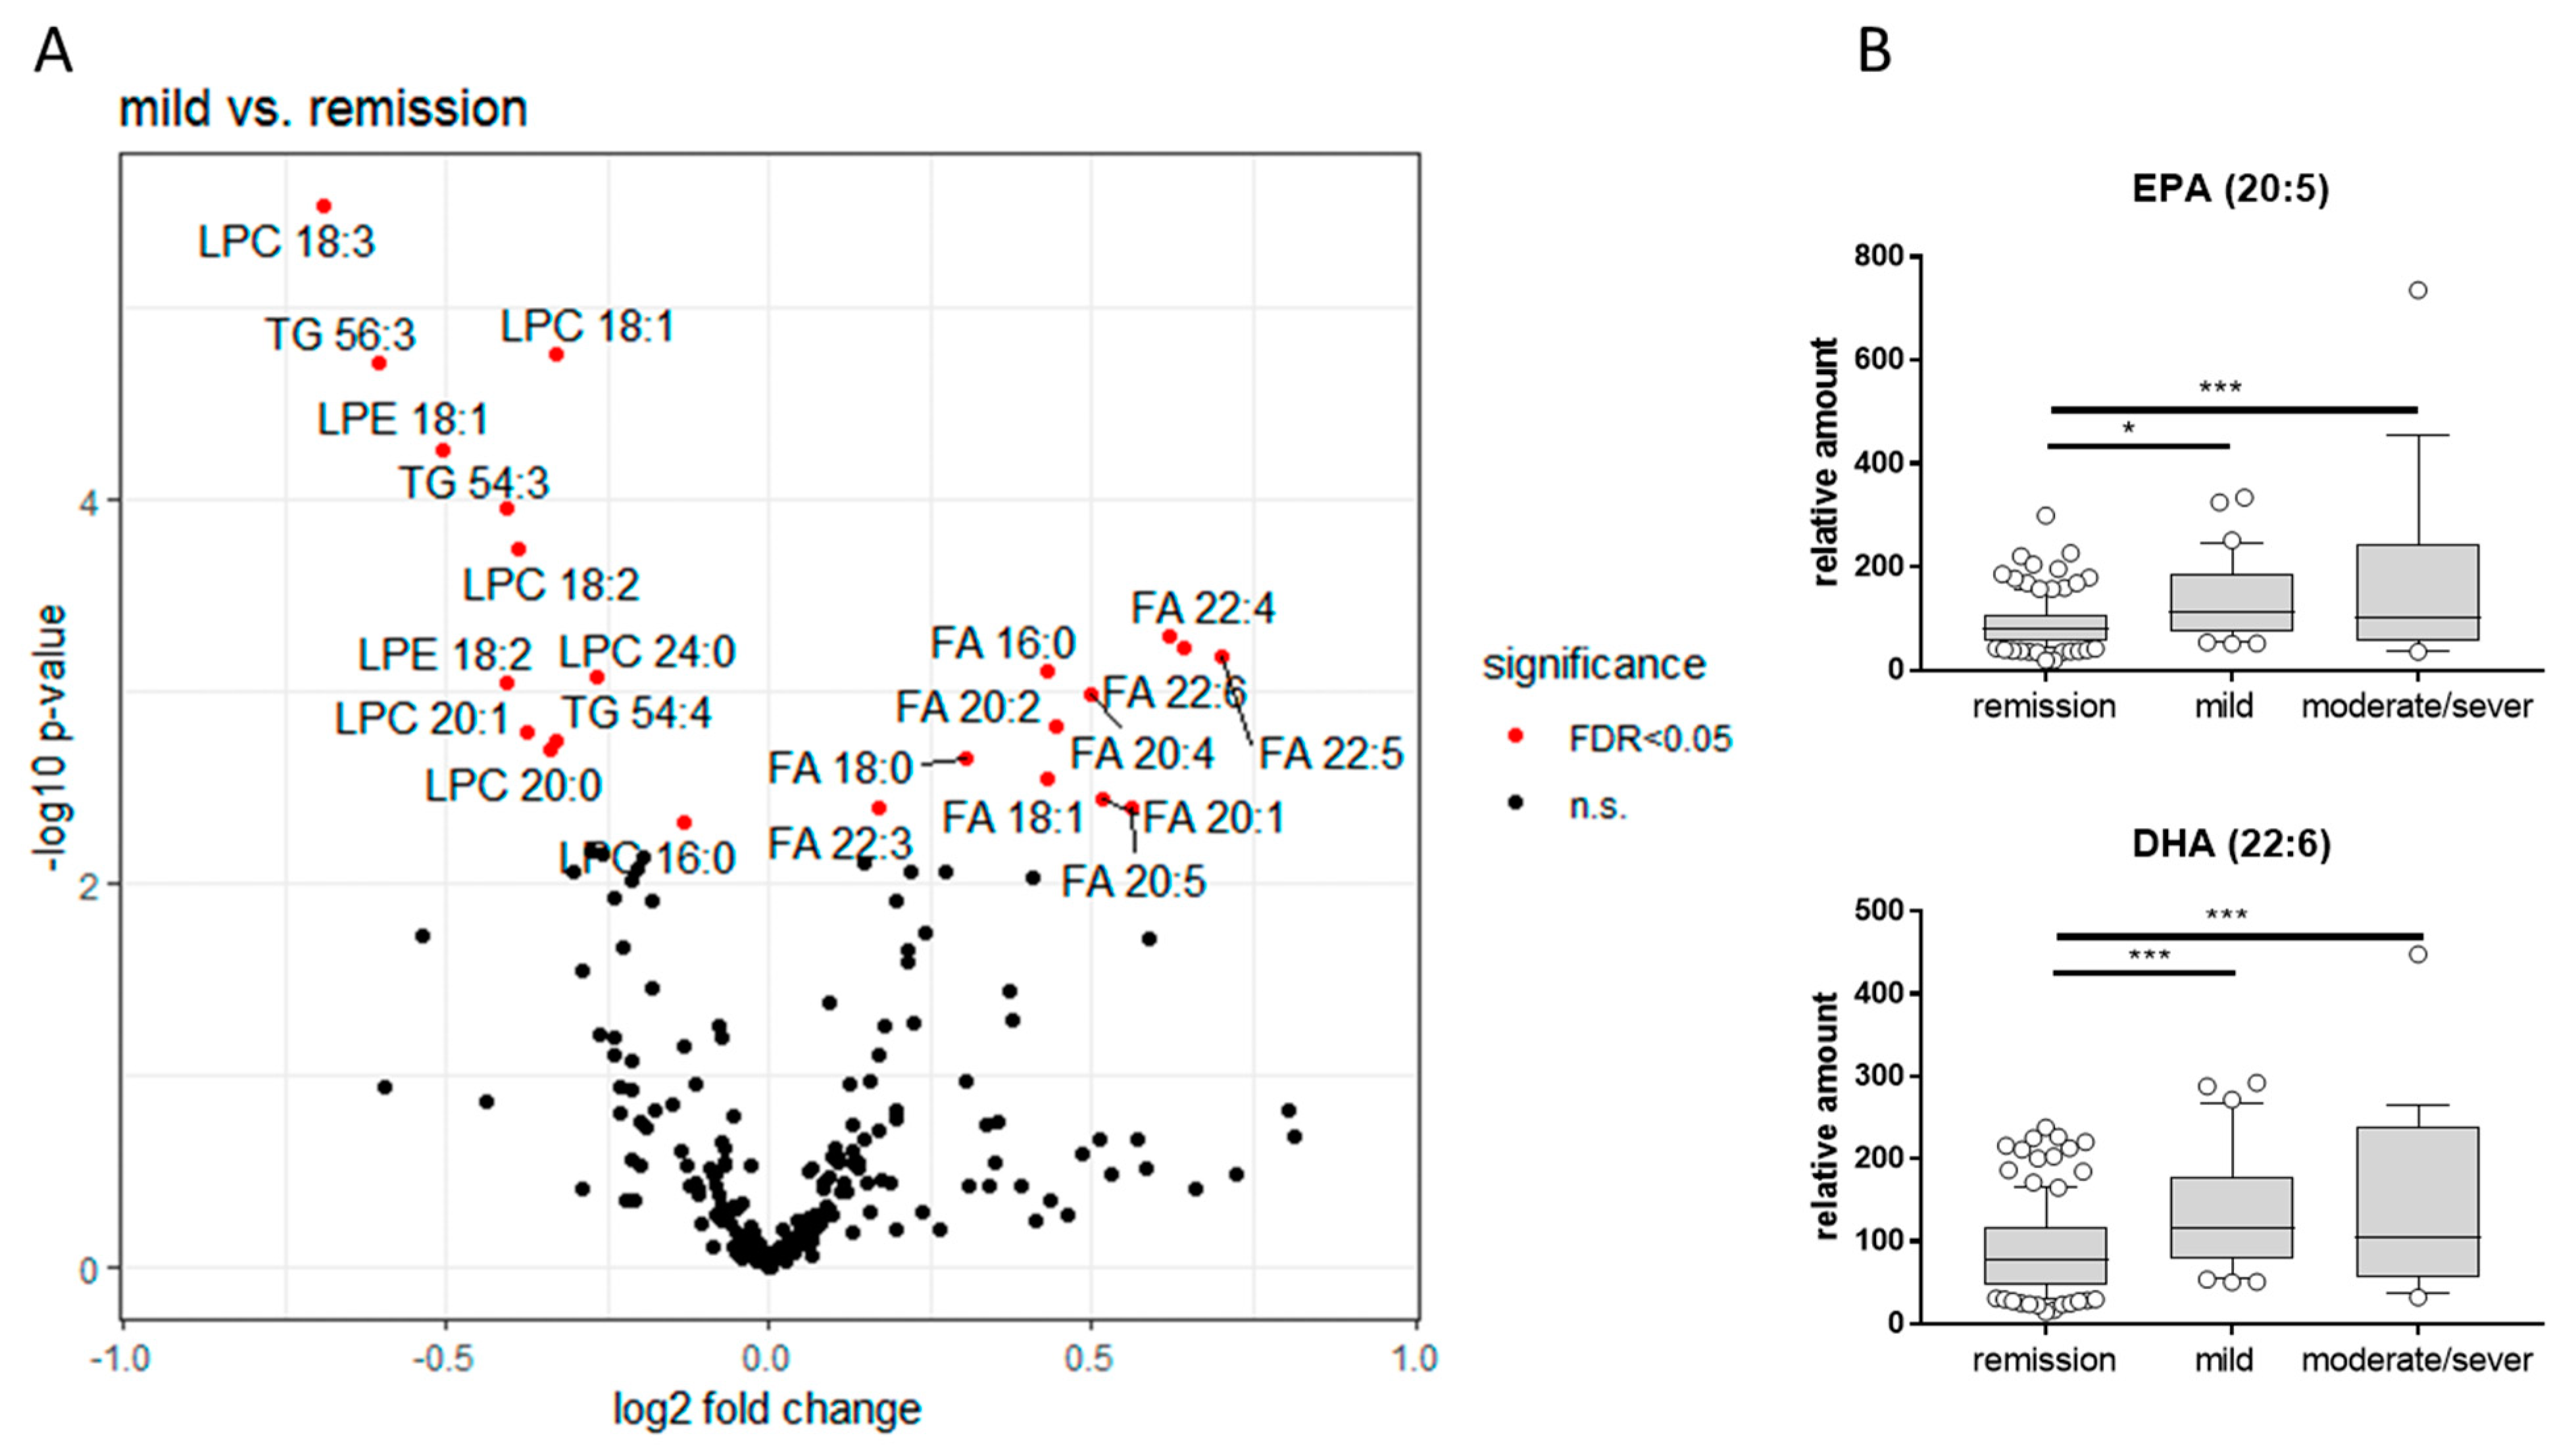
3.3.4. LC-QTOFMS Analysis of Lipids in Plasma
4. Discussion
5. Conclusions
Supplementary Materials
Author Contributions
Funding
Conflicts of Interest
Appendix A
References
- Da Silva, B.C.; Lyra, A.C.; Rocha, R.; Santana, G.O. Epidemiology, demographic characteristics and prognostic predictors of ulcerative colitis. World J. Gastroenterol. 2014, 20, 9458–9467. [Google Scholar] [CrossRef] [PubMed]
- Ng, S.C.; Shi, H.Y.; Hamidi, N.; Underwood, F.E.; Tang, W.; Benchimol, E.I.; Panaccione, R.; Ghosh, S.; Wu, J.C.Y.; Chan, F.K.L.; et al. Worldwide incidence and prevalence of inflammatory bowel disease in the 21st century: A systematic review of population-based studies. Lancet 2018, 390, 2769–2778. [Google Scholar] [CrossRef]
- Molodecky, N.A.; Soon, I.S.; Rabi, D.M.; Ghali, W.A.; Ferris, M.; Chernoff, G.; Benchimol, E.I.; Panaccione, R.; Ghosh, S.; Barkema, H.W.; et al. Increasing incidence and prevalence of the inflammatory bowel diseases with time, based on systematic review. Gastroenterology 2012, 142, 46–54.e42. [Google Scholar] [CrossRef] [PubMed]
- Peyrin-Biroulet, L.; Sandborn, W.; Sands, B.E.; Reinisch, W.; Bemelman, W.; Bryant, R.V.; D’Haens, G.; Dotan, I.; Dubinsky, M.; Feagan, B.; et al. Selecting Therapeutic Targets in Inflammatory Bowel Disease (STRIDE): Determining Therapeutic Goals for Treat-to-Target. Am. J. Gastroenterol. 2015, 110, 1324–1338. [Google Scholar] [CrossRef] [PubMed]
- Bressler, B.; Marshall, J.K.; Bernstein, C.N.; Bitton, A.; Jones, J.; Leontiadis, G.I.; Panaccione, R.; Steinhart, A.H.; Tse, F.; Feagan, B.; et al. Clinical practice guidelines for the medical management of nonhospitalized ulcerative colitis: The Toronto consensus. Gastroenterology 2015, 148, 1035–1058.e1033. [Google Scholar] [CrossRef] [PubMed]
- Harbord, M.; Eliakim, R.; Bettenworth, D.; Katsanos, K.; Karmiris, K.; Kopylov, U.; Kucharzik, T.; Molnár, T.; Raine, T.; Sebastian, S.; et al. Third European Evidence-based Consensus on Diagnosis and Management of Ulcerative Colitis. Part 2: Current Management. J. Crohns Colitis 2017, 11, 769–784. [Google Scholar] [CrossRef] [PubMed] [Green Version]
- Kucharzik, T.; Dignass, A.U.; Atreya, R.; Bokemeyer, B.; Esters, P.; Herrlinger, K.; Kannengießer, K.; Kienle, P.; Langhorst, J.; Schreiber, S.; et al. [Updated S3-Guideline Colitis ulcerosa. German Society for Digestive and Metabolic Diseases (DGVS)—AWMF Registry 021/009]. Z. Gastroenterol. 2018, 56, 1087–1169. [Google Scholar]
- Degagne, E.; Saba, J.D. S1pping fire: Sphingosine-1-phosphate signaling as an emerging target in inflammatory bowel disease and colitis-associated cancer. Clin. Exp. Gastroenterol. 2014, 7, 205–214. [Google Scholar]
- Kappos, L.; Radue, E.W.; O’Connor, P.; Polman, C.; Hohlfeld, R.; Calabresi, P.; Selmaj, K.; Agoropoulou, C.; Leyk, M.; Zhang-Auberson, L.; et al. A placebo-controlled trial of oral fingolimod in relapsing multiple sclerosis. N. Engl. J. Med. 2010, 362, 387–401. [Google Scholar] [CrossRef]
- Izzo, R.; Figliuzzi, M.M.; Monteleone, G. Sphingosine-1-phosphate receptor: A novel therapeutic target in ulcerative colitis. Expert Rev. Clin. Immunol. 2016, 12, 1137–1139. [Google Scholar] [CrossRef]
- Maceyka, M.; Harikumar, K.B.; Milstien, S.; Spiegel, S. Sphingosine-1-phosphate signaling and its role in disease. Trends Cell Biol. 2012, 22, 50–60. [Google Scholar] [CrossRef] [PubMed] [Green Version]
- Abdel Hadi, L.; Di Vito, C.; Riboni, L. Fostering Inflammatory Bowel Disease: Sphingolipid Strategies to Join Forces. Mediators Inflamm. 2016, 2016, 3827684. [Google Scholar] [CrossRef] [PubMed]
- Sandborn, W.J.; Feagan, B.G.; Wolf, D.C.; Dhaens, G.; Vermeire Md, P.S.; Hanauer, S.B.; Ghosh, S.; Smith, H.; Cravets, M.; Frohna, P.; et al. Ozanimod Induction and Maintenance Treatment for Ulcerative Colitis. N. Engl. J. Med. 2016, 374, 1754–1762. [Google Scholar] [CrossRef] [PubMed]
- Rivera, J.; Proia, R.L.; Olivera, A. The alliance of sphingosine-1-phosphate and its receptors in immunity. Nat. Rev. Immunol. 2008, 8, 753–763. [Google Scholar] [CrossRef] [PubMed] [Green Version]
- Castro, B.M.; Prieto, M.; Silva, L.C. Ceramide: A simple sphingolipid with unique biophysical properties. Prog. Lipid Res. 2014, 54, 53–67. [Google Scholar] [CrossRef] [PubMed]
- He, X.; Huang, Y.; Li, B.; Gong, C.H.; Schuchman, E.H. Deregulation of sphingolipid metabolism in Alzheimer’s disease. Neurobiol. Aging 2010, 31, 398–408. [Google Scholar] [CrossRef] [PubMed]
- Maceyka, M.; Spiegel, S. Sphingolipid metabolites in inflammatory disease. Nature 2014, 510, 58–67. [Google Scholar] [CrossRef] [PubMed] [Green Version]
- Coant, N.; Sakamoto, W.; Mao, C.; Hannun, Y.A. Ceramidases, roles in sphingolipid metabolism and in health and disease. Adv. Biol. Regul. 2017, 63, 122–131. [Google Scholar] [CrossRef] [PubMed]
- Albi, E.; Alessenko, A.; Grosch, S. Sphingolipids in Inflammation. Mediators Inflamm. 2018, 2018, 7464702. [Google Scholar] [CrossRef] [PubMed]
- Hartmann, D.; Wegner, M.S.; Wanger, R.A.; Ferreirós, N.; Schreiber, Y.; Lucks, J.; Schiffmann, S.; Geisslinger, G.; Grösch, S. The equilibrium between long and very long chain ceramides is important for the fate of the cell and can be influenced by co-expression of CerS. Int. J. Biochem. Cell Biol. 2013, 45, 1195–1203. [Google Scholar] [CrossRef] [PubMed]
- Ben-David, O.; Futerman, A.H. The role of the ceramide acyl chain length in neurodegeneration: Involvement of ceramide synthases. Neuromol. Med. 2010, 12, 341–350. [Google Scholar] [CrossRef] [PubMed]
- Eckl, K.M.; Tidhar, R.; Thiele, H.; Oji, V.; Hausser, I.; Brodesser, S.; Preil, M.L.; Onal-Akan, A.; Stock, F.; Müller, D.; et al. Impaired epidermal ceramide synthesis causes autosomal recessive congenital ichthyosis and reveals the importance of ceramide acyl chain length. J. Investig. Dermatol. 2013, 133, 2202–2211. [Google Scholar] [CrossRef] [PubMed]
- Wegner, M.S.; Schiffmann, S.; Parnham, M.J.; Geisslinger, G.; Grösch, S. The enigma of ceramide synthase regulation in mammalian cells. Prog. Lipid Res. 2016, 63, 93–119. [Google Scholar] [CrossRef] [PubMed]
- Franzosa, E.A.; Sirota-Madi, A.; Avila-Pacheco, J.; Fornelos, N.; Haiser, H.J.; Reinker, S.; Vatanen, T.; Hall, A.B.; Mallick, H.; McIver, L.J.; et al. Gut microbiome structure and metabolic activity in inflammatory bowel disease. Nat. Microbiol. 2019, 4, 293–305. [Google Scholar] [CrossRef] [PubMed]
- Suh, J.H.; Degagne, E.; Gleghorn, E.E.; Setty, M.; Rodriguez, A.; Park, K.T.; Verstraete, S.G.; Heyman, M.B.; Irek, M.; Gildengorin, G.L.; et al. Sphingosine-1-Phosphate Signaling and Metabolism Gene Signature in Pediatric Inflammatory Bowel Disease: A Matched-case Control Pilot Study. Inflamm. Bowel Dis. 2018, 24, 1321–1334. [Google Scholar] [CrossRef] [PubMed]
- Diab, J.; Hansen, T.; Goll, R.; Stenlund, H.; Ahnlund, M.; Jensen, E.; Moritz, T.; Florholmen, J.; Forsdahl, G. Lipidomics in Ulcerative Colitis Reveal Alteration in Mucosal Lipid Composition Associated With the Disease State. Inflamm. Bowel Dis. 2019. [Google Scholar] [CrossRef] [PubMed]
- Kim, Y.R.; Volpert, G.; Shin, K.O.; Kim, S.Y.; Shin, S.H.; Lee, Y.; Sung, S.H.; Lee, Y.-M.; Ahn, J.-H.; Park, W.J.; et al. Ablation of ceramide synthase 2 exacerbates dextran sodium sulphate-induced colitis in mice due to increased intestinal permeability. J. Cell Mol. Med. 2017, 21, 3565–3578. [Google Scholar] [CrossRef] [PubMed]
- Oertel, S.; Scholich, K.; Weigert, A.; Thomas, D.; Schmetzer, J.; Trautmann, S.; Wegner, M.-S.; Heinfried, H.; Radeke, H.H.; Filmann, N.; et al. Ceramide synthase 2 deficiency aggravates AOM-DSS-induced colitis in mice: Role of colon barrier integrity. Cell Mol. Life Sci. 2017, 74, 3039–3055. [Google Scholar] [CrossRef] [PubMed]
- Helke, K.; Angel, P.; Lu, P.; Garrett-Mayer, E.; Ogretmen, B.; Drake, R.; Voelkel-Johnson, C. Ceramide Synthase 6 Deficiency Enhances Inflammation in the DSS model of Colitis. Sci. Rep. 2018, 8, 1627. [Google Scholar] [CrossRef]
- Xiong, Y.; Zhu, X.D.; Wan, P.; Ren, Y.P.; Wang, C.; Yan, R.W.; Guo, Y.; Bai, A.P. Inhibition of ASM activity ameliorates DSS-induced colitis in mice. Prostaglandins Other Lipid Mediat. 2019, 140, 26–30. [Google Scholar] [CrossRef]
- Li, Z.; Kabir, I.; Tietelman, G.; Huan, C.; Fan, J.; Worgall, T.; Jiang, X.C. Sphingolipid de novo biosynthesis is essential for intestine cell survival and barrier function. Cell Death Dis. 2018, 9, 173. [Google Scholar] [CrossRef] [PubMed]
- Suzuki, S.; Tanaka, A.; Nakamura, H.; Murayama, T. Knockout of Ceramide Kinase Aggravates Pathological and Lethal Responses in Mice with Experimental Colitis. Biol. Pharm. Bull. 2018, 41, 797–805. [Google Scholar] [CrossRef] [PubMed] [Green Version]
- Huang, W.C.; Liang, J.; Nagahashi, M.; Avni, D.; Yamada, A.; Maceyka, M.; Wolen, A.R.; Kordula, T.; Milstien, S.; Oravecz, T. Sphingosine-1-phosphate phosphatase 2 promotes disruption of mucosal integrity, and contributes to ulcerative colitis in mice and humans. FASEB J. 2016, 30, 2945–2958. [Google Scholar] [CrossRef] [PubMed]
- Snider, A.J.; Wu, B.X.; Jenkins, R.W.; Sticca, J.A.; Kawamori, T.; Hannun, Y.A.; Obeid, L.M. Loss of neutral ceramidase increases inflammation in a mouse model of inflammatory bowel disease. Prostaglandins Other Lipid Mediat. 2012, 99, 124–130. [Google Scholar] [CrossRef] [PubMed] [Green Version]
- Snider, A.J.; Kawamori, T.; Bradshaw, S.G.; Orr, K.A.; Gilkeson, G.S.; Hannun, Y.A.; Obeid, L.M. A role for sphingosine kinase 1 in dextran sulfate sodium-induced colitis. FASEB J. 2009, 23, 143–152. [Google Scholar] [CrossRef] [PubMed]
- Duan, R.D.; Nilsson, A. Metabolism of sphingolipids in the gut and its relation to inflammation and cancer development. Prog. Lipid Res. 2009, 8, 62–72. [Google Scholar] [CrossRef]
- Hornemann, T.; Wei, Y.; von Eckardstein, A. Is the mammalian serine palmitoyltransferase a high-molecular-mass complex? Biochem. J. 2007, 405, 157–164. [Google Scholar] [CrossRef] [Green Version]
- Hornemann, T.; Richard, S.; Rütti, M.F.; Wei, Y.; von Eckardstein, A. Cloning and initial characterization of a new subunit for mammalian serine-palmitoyltransferase. J. Biol. Chem. 2006, 281, 37275–37281. [Google Scholar] [CrossRef]
- Tamehiro, N.; Mujawar, Z.; Zhou, S.; Zhuang, D.Z.; Hornemann, T.; von Eckardstein, A.; Fitzgerald, M.L. Cell polarity factor Par3 binds SPTLC1 and modulates monocyte serine palmitoyltransferase activity and chemotaxis. J. Biol. Chem. 2009, 284, 4881–24890. [Google Scholar] [CrossRef]
- Nakayama, H.; Ogawa, H.; Takamori, K.; Iwabuchi, K. GSL-enriched membrane microdomains in innate immune responses. Arch. Immunol. Ther. Exp. (Warsz) 2013, 61, 217–228. [Google Scholar] [CrossRef]
- Sato, T.; Iwabuchi, K.; Nagaoka, I.; Adachi, Y.; Ohno, N.; Tamura, H.; Seyama, K.; Fukuchi, Y.; Nakayama, H.; Takamori, K. Induction of human neutrophil chemotaxis by Candida albicans-derived beta-1,6-long glycoside side-chain-branched beta-glucan. J. Leukoc. Biol. 2006, 80, 204–211. [Google Scholar] [CrossRef] [PubMed]
- Maines, L.W.; Fitzpatrick, L.R.; French, K.J.; Zhuang, Y.; Xia, Z.; Keller, S.N.; Upson, J.J.; Smith, C.D. Suppression of ulcerative colitis in mice by orally available inhibitors of sphingosine kinase. Dig. Dis. Sci. 2008, 53, 997–1012. [Google Scholar] [CrossRef] [PubMed]
- Liang, J.; Nagahashi, M.; Kim, E.Y.; Harikumar, K.B.; Yamada, A.; Huang, W.C.; Hait, N.C.; Allegood, J.C.; Price, M.M.; Takabe, K. Sphingosine-1-phosphate links persistent STAT3 activation, chronic intestinal inflammation, and development of colitis-associated cancer. Cancer Cell 2013, 23, 107–120. [Google Scholar] [CrossRef] [PubMed]
- Xiao, J.; Lin, H.; Liu, B.; Xia, Z.; Zhang, J.; Jin, J. Decreased S1P and SPHK2 are involved in pancreatic acinar cell injury. Biomark. Med. 2019. [Google Scholar] [CrossRef] [PubMed]
- Winkler, M.S.; Märtz, K.B.; Nierhaus, A.; Daum, G.; Schwedhelm, E.; Kluge, S.; Gräler, M.H. Loss of sphingosine 1-phosphate (S1P) in septic shock is predominantly caused by decreased levels of high-density lipoproteins (HDL). J. Intensive Care 2019, 7, 23. [Google Scholar] [CrossRef] [PubMed]
- Wu, X.; Hou, J.; Li, H.; Xie, G.; Zhang, X.; Zheng, J.; Wang, J.; Gao, F.; Yao, Y.; Fang, X.; et al. Inverse Correlation Between Plasma Sphingosine-1-Phosphate and Ceramide Concentrations in Septic Patients and Their Utility in Predicting Mortality. Shock 2019, 51, 718–724. [Google Scholar] [CrossRef] [PubMed]
- Hsu, S.C.; Chang, J.H.; Hsu, Y.P.; Bai, K.J.; Huang, S.K.; Hsu, C.W. Circulating sphingosine-1-phosphate as a prognostic biomarker for community-acquired pneumonia. PLoS ONE 2019, 14, e0216963. [Google Scholar] [CrossRef]
- Mücke, V.T.; Jakobi, K.; Knop, V.; Thomas, D.; Mücke, M.M.; Peiffer, K.H.; Zeuzem, S.; Sarrazin, C.; Pfeilschifter, J.; Grammatikos, G. Serum sphingolipid levels associate with upcoming virologic events and HBV genotype D in a cohort of patients with HBeAg-negative HBV infection. PLoS ONE 2018, 13, e0207293. [Google Scholar] [CrossRef]
- Egom, E.E.; Shiwani, H.A.; Pharithi, R.B.; Canning, R.; Khan, B.; Hiani, Y.E.; Maher, V. Dynamic changes of the composition of plasma HDL particles in patients with cardiac disease: Spotlight on sphingosine-1-phosphate/serum amyloid A ratio. Clin. Exp. Pharmacol. Physiol. 2018, 45, 319–325. [Google Scholar] [CrossRef]
- Danese, S.; Furfaro, F.; Vetrano, S. Targeting S1P in Inflammatory Bowel Disease: New Avenues for Modulating Intestinal Leukocyte Migration. J. Crohns Colitis 2018, 12, S678–S686. [Google Scholar] [CrossRef]
- Kurz, J.; Brunkhorst, R.; Foerch, C.; Blum, L.; Henke, M.; Gabriel, L.; Ulshöfer, T.; Ferreirós, N.; Parnham, M.J.; Schiffmann, S.; et al. The relevance of ceramides and their synthesizing enzymes for multiple sclerosis. Clin. Sci. (Lond.) 2018, 132, 1963–1976. [Google Scholar] [CrossRef] [PubMed] [Green Version]
- Kurz, J.; Parnham, M.J.; Geisslinger, G.; Schiffmann, S. Ceramides as Novel Disease Biomarkers. Trends Mol. Med. 2019, 25, 20–32. [Google Scholar] [CrossRef] [PubMed]
- Hla, T.; Venkataraman, K.; Michaud, J. The vascular S1P gradient-cellular sources and biological significance. Biochim. Biophys. Acta 2008, 1781, 477–482. [Google Scholar] [CrossRef] [PubMed]
- Pienimaeki-Roemer, A.; Ruebsaamen, K.; Boettcher, A.; Orsó, E.; Scherer, M.; Liebisch, G.; Kilalic, D.; Ahrens, N.; Schmitz, G. Stored platelets alter glycerophospholipid and sphingolipid species, which are differentially transferred to newly released extracellular vesicles. Transfusion 2013, 53, 612–626. [Google Scholar] [CrossRef] [PubMed]
- Verderio, C.; Gabrielli, M.; Giussani, P. Role of sphingolipids in the biogenesis and biological activity of extracellular vesicles. J. Lipid Res. 2018, 59, 1325–1340. [Google Scholar] [CrossRef] [PubMed] [Green Version]
- Hwang, D.H.; Kim, J.A.; Lee, J.Y. Mechanisms for the activation of Toll-like receptor 2/4 by saturated fatty acids and inhibition by docosahexaenoic acid. Eur. J. Pharmacol. 2016, 785, 24–35. [Google Scholar] [CrossRef] [PubMed] [Green Version]
- Lee, J.Y.; Sohn, K.H.; Rhee, S.H.; Hwang, D. Saturated fatty acids, but not unsaturated fatty acids, induce the expression of cyclooxygenase-2 mediated through Toll-like receptor 4. J. Biol. Chem. 2001, 276, 16683–16689. [Google Scholar] [CrossRef]
- Das, U.N. Inflammatory bowel disease as a disorder of an imbalance between pro- and anti-inflammatory molecules and deficiency of resolution bioactive lipids. Lipids Health Dis. 2016, 15, 11. [Google Scholar] [CrossRef]
- Weylandt, K.H.; Kang, J.X.; Wiedenmann, B.; Baumgart, D.C. Lipoxins and resolvins in inflammatory bowel disease. Inflamm. Bowel Dis. 2007, 13, 797–799. [Google Scholar] [CrossRef]
- Schwanke, R.C.; Marcon, R.; Bento, A.F.; Calixto, J.B. EPA- and DHA-derived resolvins’ actions in inflammatory bowel disease. Eur. J. Pharmacol. 2016, 785, 156–164. [Google Scholar] [CrossRef]
- Jin, J.; Lu, Z.; Li, Y.; Cowart, L.A.; Lopes-Virella, M.F.; Huang, Y. Docosahexaenoic acid antagonizes the boosting effect of palmitic acid on LPS inflammatory signaling by inhibiting gene transcription and ceramide synthesis. PLoS ONE 2018, 13, e0193343. [Google Scholar] [CrossRef] [PubMed]
- Sharma, M.; Kaur, R.; Kaushik, K.; Kaushal, N. Redox modulatory protective effects of omega-3 fatty acids rich fish oil against experimental colitis. Toxicol. Mech. Methods 2019, 29, 244–254. [Google Scholar] [CrossRef] [PubMed]
- Cho, J.Y.; Chi, S.G.; Chun, H.S. Oral administration of docosahexaenoic acid attenuates colitis induced by dextran sulfate sodium in mice. Mol. Nutr. Food Res. 2011, 55, 239–246. [Google Scholar] [CrossRef] [PubMed]
- Stenson, W.F.; Cort, D.; Rodgers, J.; Burakoff, R.; DeSchryver-Kecskemeti, K.; Gramlich, T.L.; Beeken, W. Dietary supplementation with fish oil in ulcerative colitis. Ann. Intern. Med. 1992, 116, 609–614. [Google Scholar] [CrossRef] [PubMed]
- Scaioli, E.; Sartini, A.; Bellanova, M.; Campieri, M.; Festi, D.; Bazzoli, F.; Belluzzi, A. Eicosapentaenoic Acid Reduces Fecal Levels of Calprotectin and Prevents Relapse in Patients With Ulcerative Colitis. Clin. Gastroenterol. Hepatol. 2018, 16, 1268–1275.e1262. [Google Scholar] [CrossRef]
- Toewe, A.; Balas, L.; Durand, T.; Geisslinger, G.; Ferreirós, N. Simultaneous determination of PUFA-derived pro-resolving metabolites and pathway markers using chiral chromatography and tandem mass spectrometry. Anal. Chim. Acta 2018, 1031, 185–194. [Google Scholar] [CrossRef] [PubMed] [Green Version]


| Gene | Primer Sequence | Manufacturer |
|---|---|---|
| Sptlc2 | Fw 5′-TATGGAGCTGGAGTGTGCAG-3′ Rev 5′-GAATTCGTTGCAAATCCCAT-3′ | biomers, Ulm Germany |
| Sptlc3 | Fw 5′-GTATGATGAGTCTATGAGGAC-3′ Rev 5′-CATTCAGGAACTTAGCCACA-3′ | biomers, Ulm Germany |
| CerS1 | Fw 5′-CCTCCAGCCCAGAGAT-3′ Rev 5′-AGAAGGGGTAGTCGGTG-3′ | biomers, Ulm, Germany |
| CerS2 | Fw 5′-CCAGGTAGAGCGTTGGTT-3′ Rev 5′-CCAGGGTTTATCCACAATGAC-3′ | biomers, Ulm, Germany |
| CerS3 | Fw 5′-CCTGGCTGCTATTAGTCTGAT-3′ Rev 5′-TCACGAGGGTCCCACT-3′ | biomers, Ulm, Germany |
| CerS4 (WBC) | Fw 5′-CTG GTG GTA CCT CTT GGA GC-3′ Rev 5′-CGT CGC ACA CTT CTA ATA CC-3′ | biomers, Ulm, Germany |
| CerS4 (tissue) | Fw 5′-CTG GTG GTA CCT CTT GGA GC-3′ Rev 5′-AGC AAC ATC AGA AGC CCG TT-3′ | biomers, Ulm, Germany |
| CerS5 | Fw 5′-CAAGTATCAGCGGCTCTGT-3′ Rev 5′-ATTATCTCCCAACTCTCAAAGA-3′ | biomers, Ulm, Germany |
| CerS6 | Fw 5′-AAGCAACTGGACTGGGATGTT-3′ Rev 5′-AATCTGACTCCGTAGGTAAATACA-3′ | biomers, Ulm, Germany |
| GAPDH | Fw 5′-CCA GGA GCG AGA TCC CTC-3′ Rev 5′-GGG CAG AGA TGA TGA CCC TT-3′ | biomers, Ulm, Germany |
| Gender all patients male female colon-biopsis male female blood samples male female | number 51/98 47/98 37/59 22/59 105/183 78/183 | (%) (55) (45) (63) (37) (57) (43) |
| Median age | 43.8 (19–76) years | |
| Median disease duration | 11 (1–62) years | |
| Disease status using partial mayo score (%) remission mild moderate/severe | 109/183 45/183 29/183 | (60) (24) (16) |
| Severity of disease (%) pancolitis extensive colitis left side colitis sigmoiditis proktitis not mentioned | 86/183 9/183 43/183 25/183 14/183 6/183 | (47) (5) (23) (14) (8) (3) |
© 2019 by the authors. Licensee MDPI, Basel, Switzerland. This article is an open access article distributed under the terms and conditions of the Creative Commons Attribution (CC BY) license (http://creativecommons.org/licenses/by/4.0/).
Share and Cite
Bazarganipour, S.; Hausmann, J.; Oertel, S.; El-Hindi, K.; Brachtendorf, S.; Blumenstein, I.; Kubesch, A.; Sprinzl, K.; Birod, K.; Hahnefeld, L.; et al. The Lipid Status in Patients with Ulcerative Colitis: Sphingolipids are Disease-Dependent Regulated. J. Clin. Med. 2019, 8, 971. https://doi.org/10.3390/jcm8070971
Bazarganipour S, Hausmann J, Oertel S, El-Hindi K, Brachtendorf S, Blumenstein I, Kubesch A, Sprinzl K, Birod K, Hahnefeld L, et al. The Lipid Status in Patients with Ulcerative Colitis: Sphingolipids are Disease-Dependent Regulated. Journal of Clinical Medicine. 2019; 8(7):971. https://doi.org/10.3390/jcm8070971
Chicago/Turabian StyleBazarganipour, Sarah, Johannes Hausmann, Stephanie Oertel, Khadija El-Hindi, Sebastian Brachtendorf, Irina Blumenstein, Alica Kubesch, Kathrin Sprinzl, Kerstin Birod, Lisa Hahnefeld, and et al. 2019. "The Lipid Status in Patients with Ulcerative Colitis: Sphingolipids are Disease-Dependent Regulated" Journal of Clinical Medicine 8, no. 7: 971. https://doi.org/10.3390/jcm8070971