aP2-Cre Mediated Ablation of GHS-R Attenuates Adiposity and Improves Insulin Sensitivity during Aging

 , and
, and 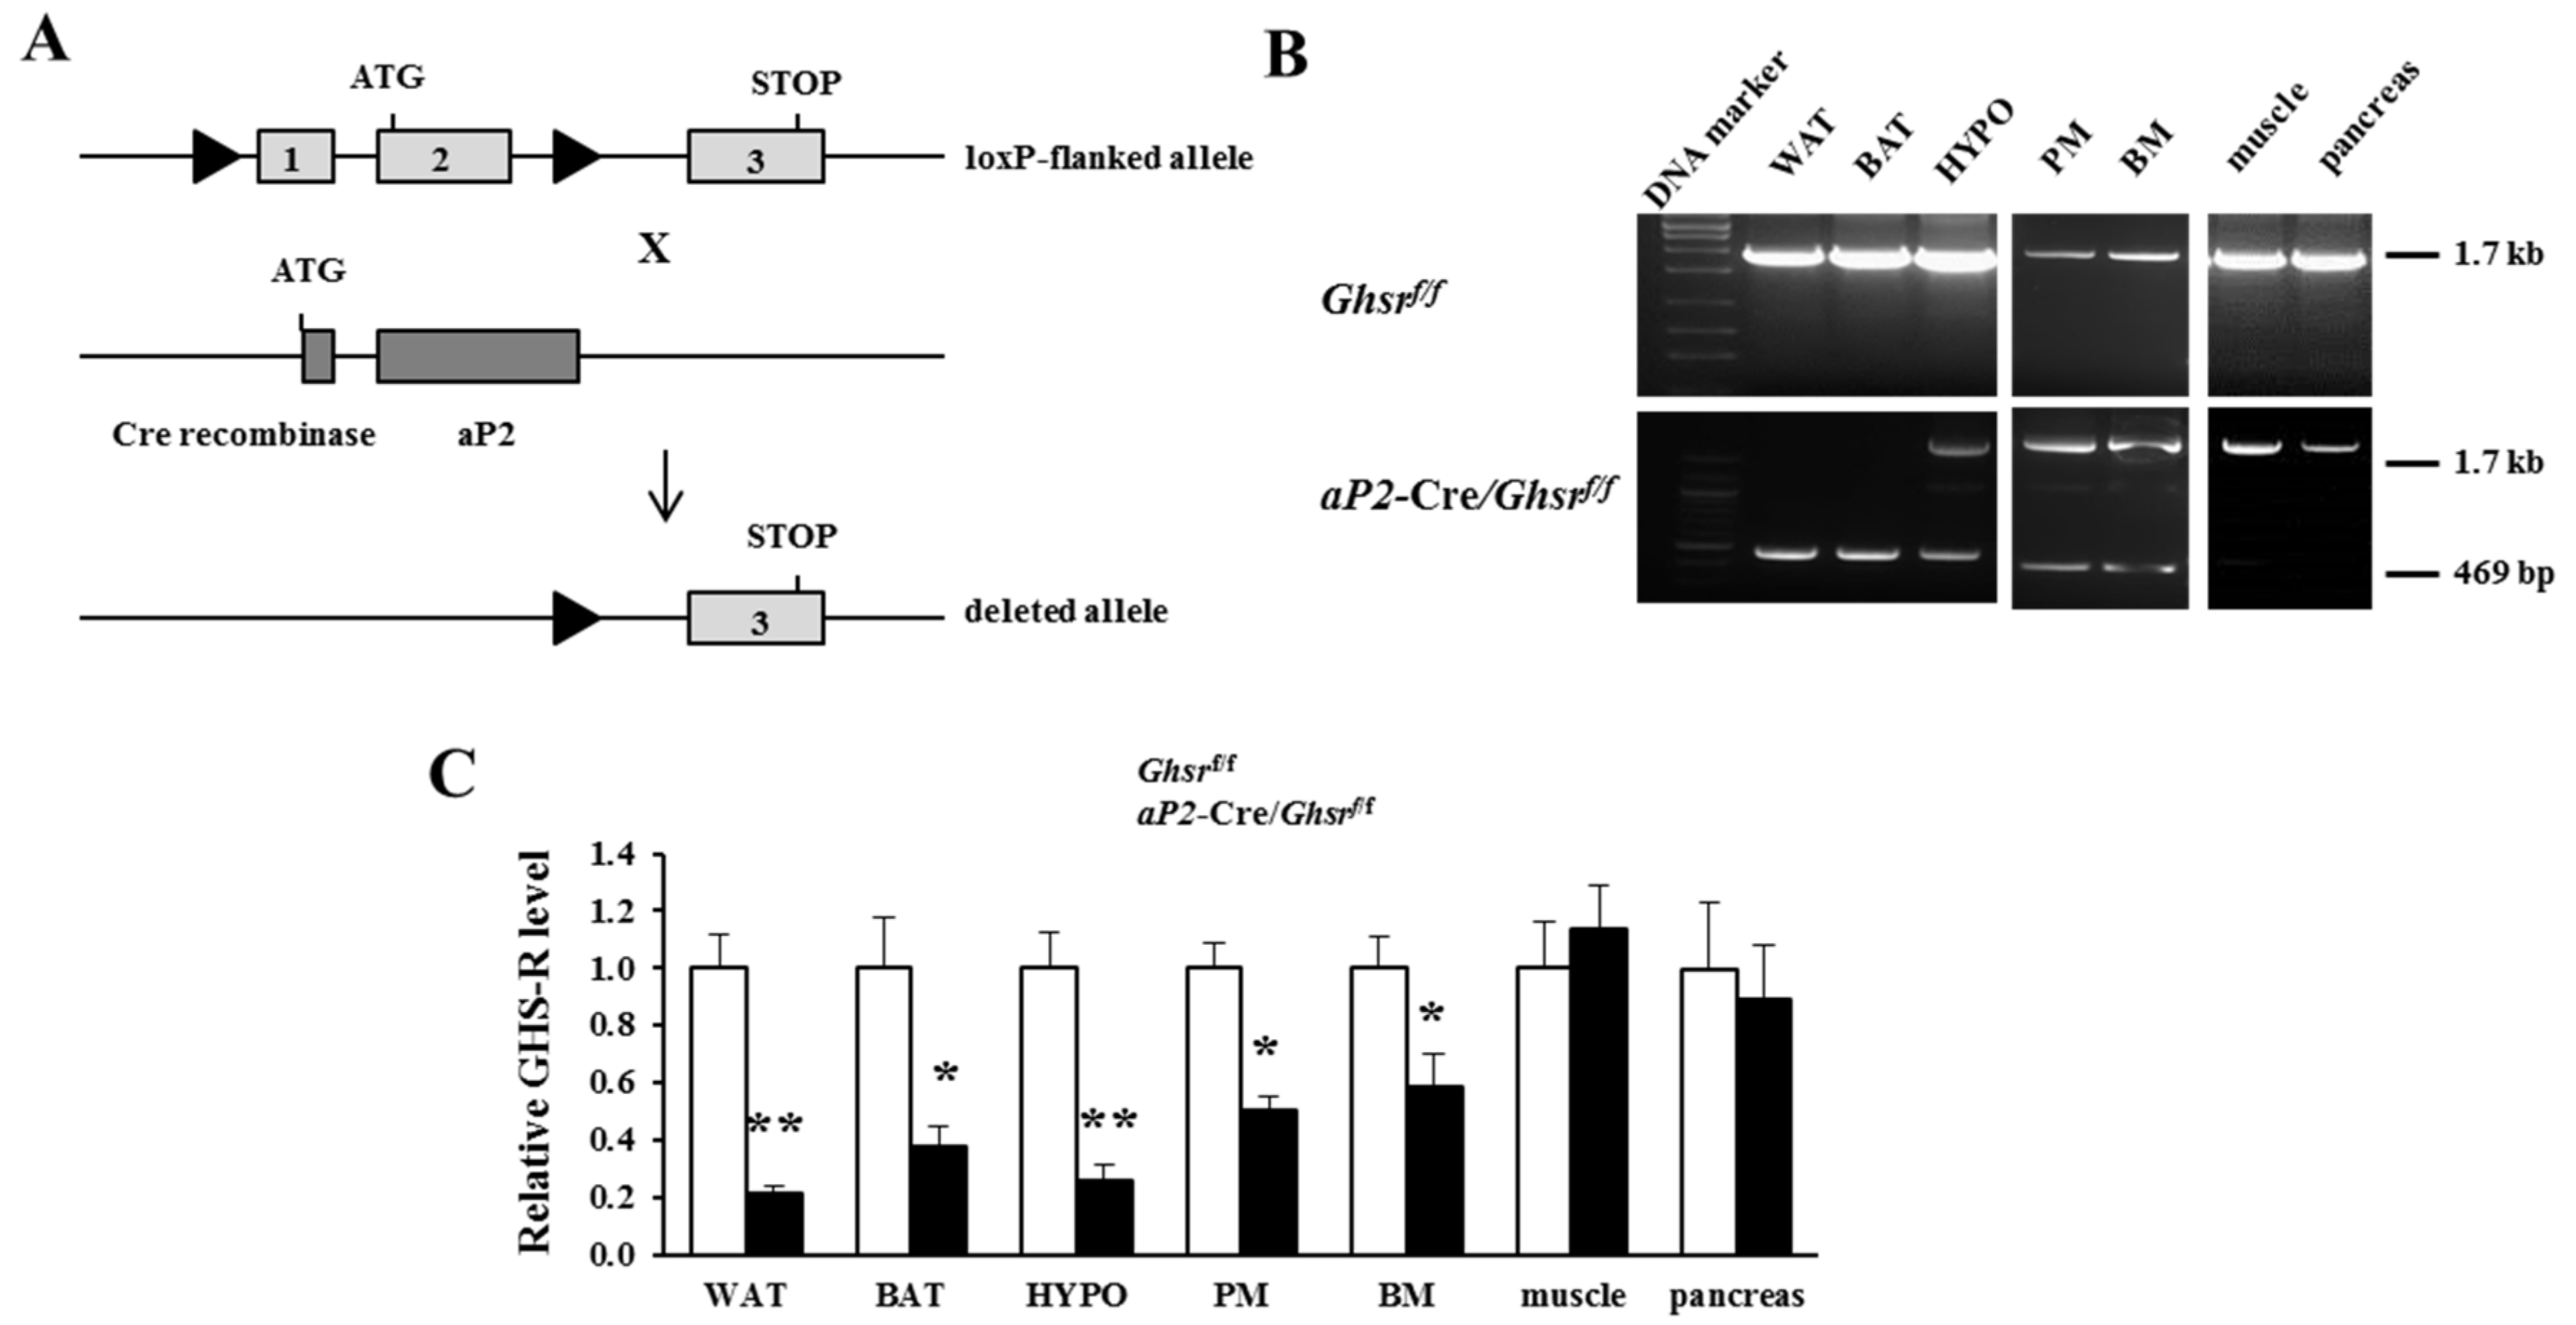
Abstract
:1. Introduction
2. Results
2.1. Generation of aP2-Cre/Ghsrf/f Mice
2.2. aP2-Cre Mediated Growth Hormone Secretagogue Receptor (GHS-R) Knockdown Abolishes Ghrelin-Induced GH Secretion and Spontaneous Food Intake
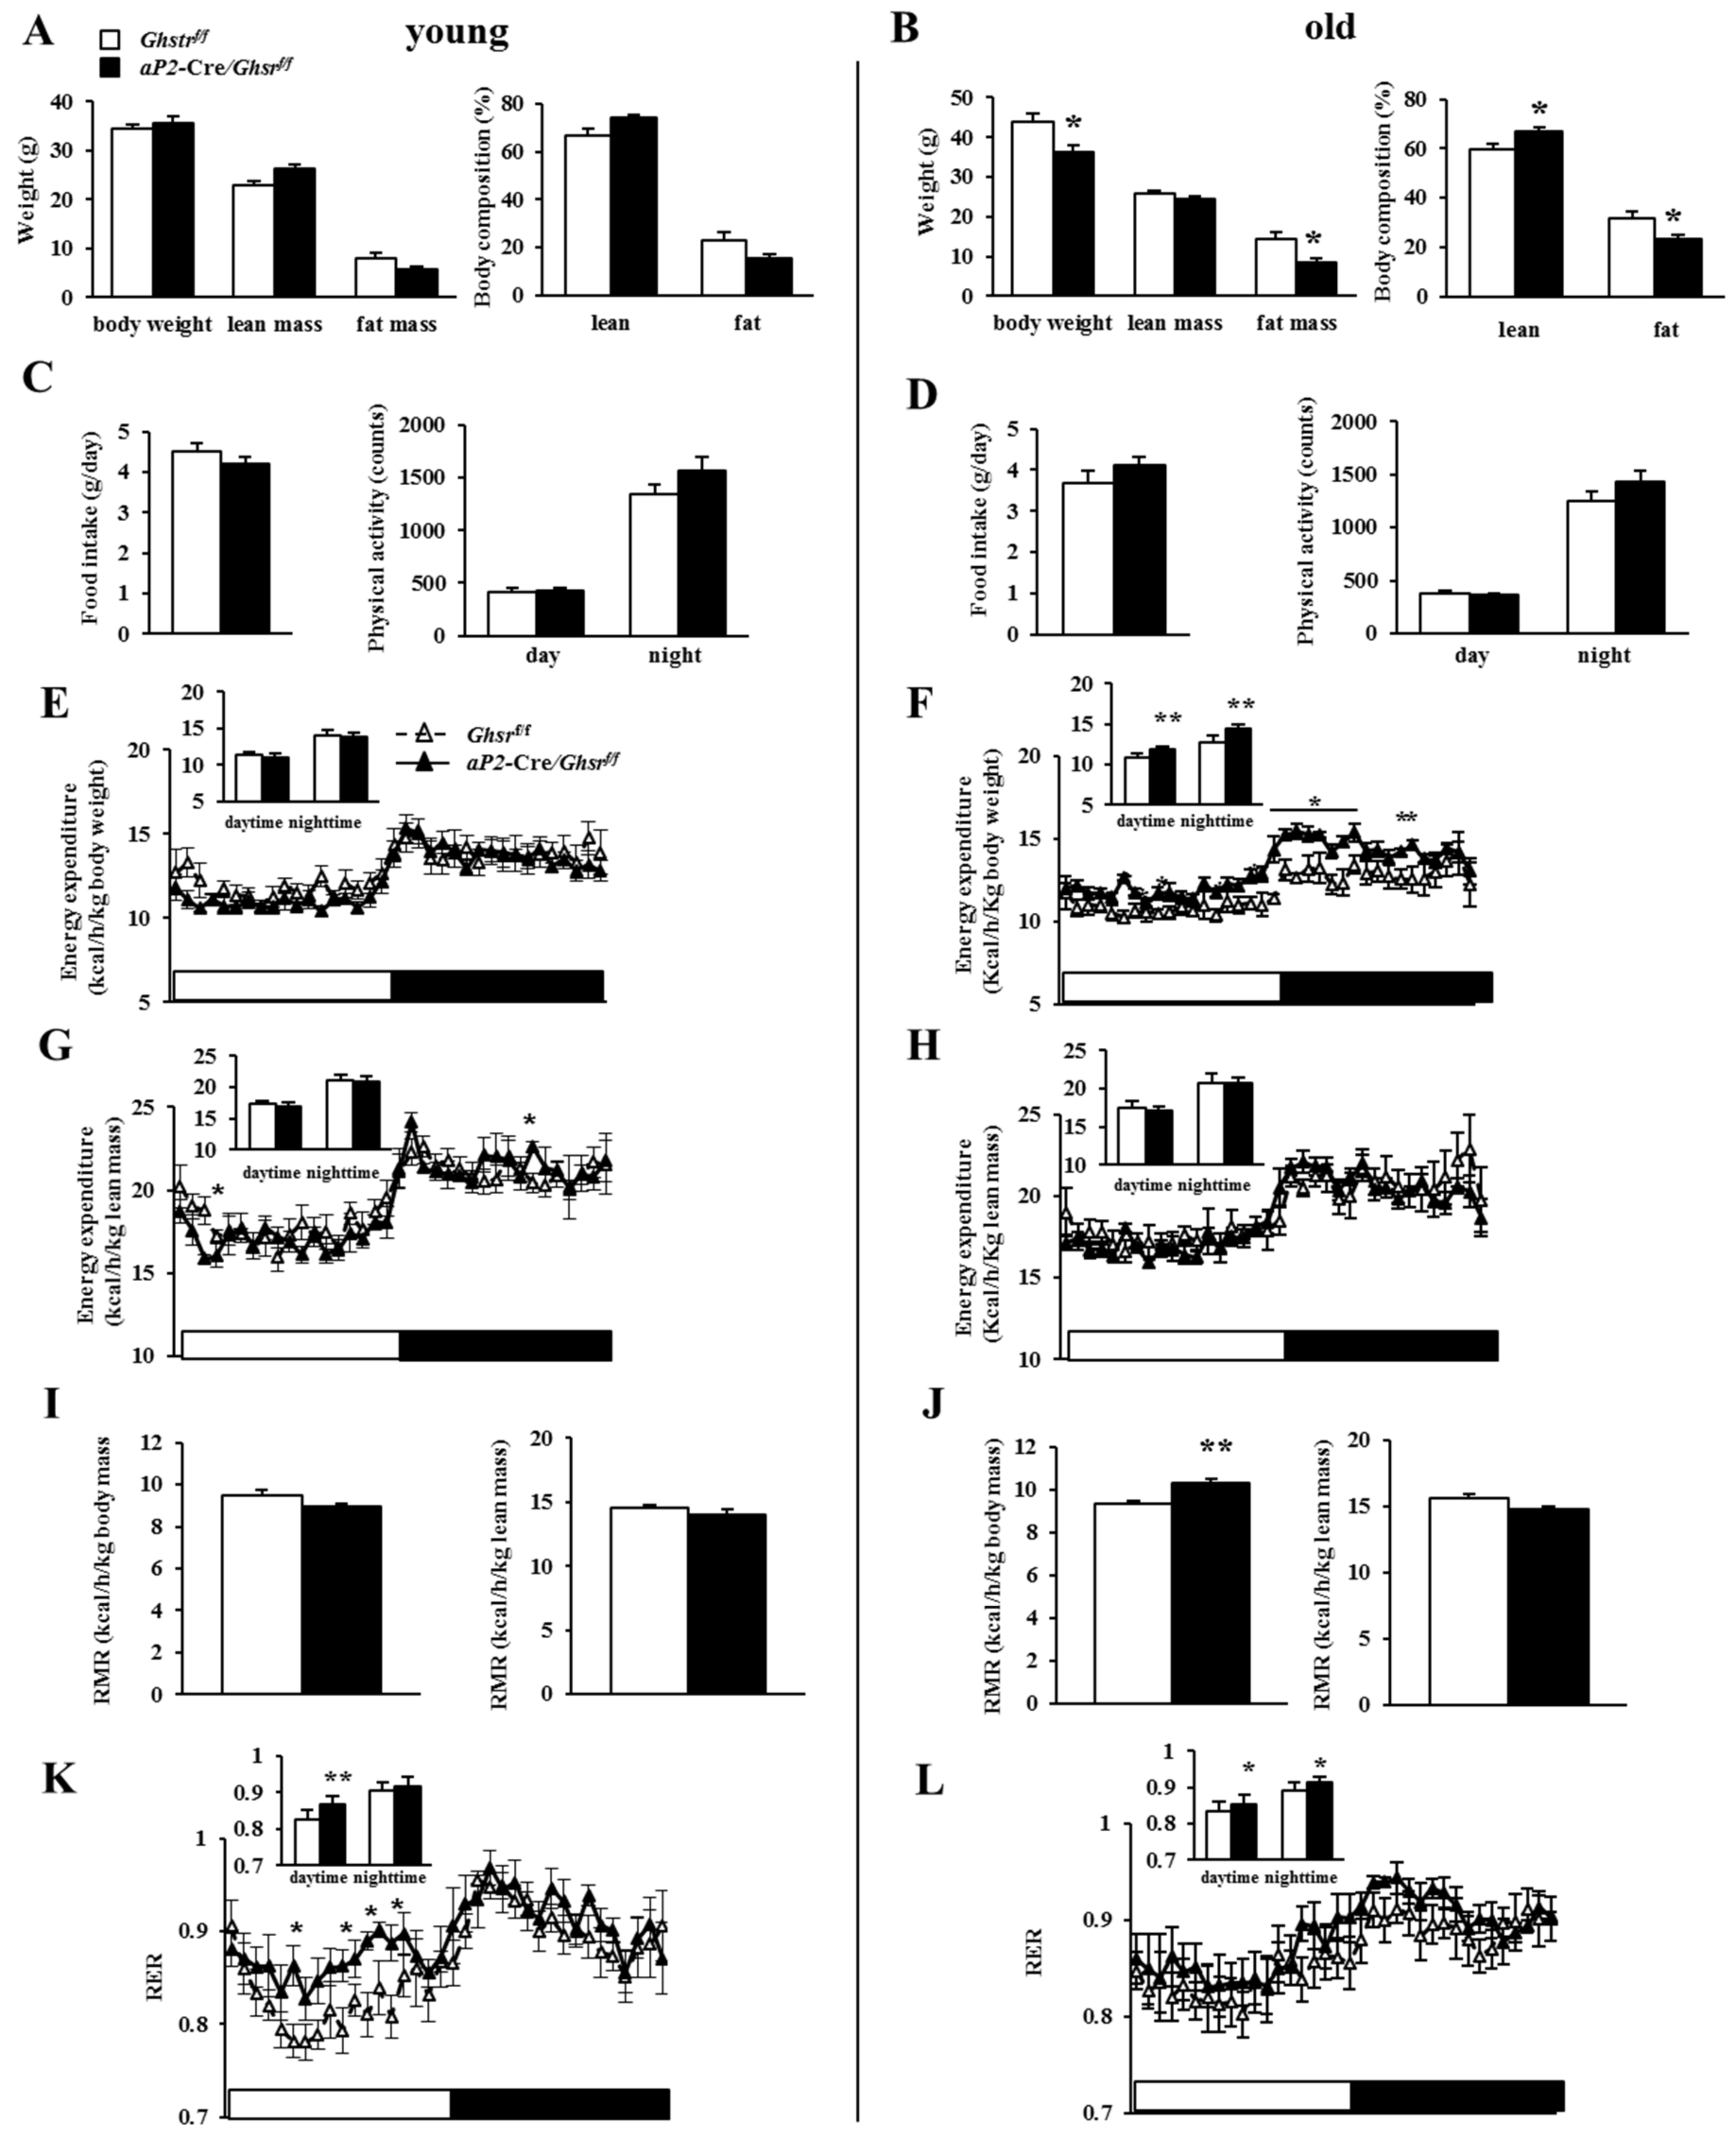
2.3. Old aP2-Cre/Ghsrf/f Mice Have Reduced Adiposity
2.4. Old aP2-Cre/Ghsrf/f Mice Have Increased Energy Expenditure and Prefer Carbohydrate as Fuel Source
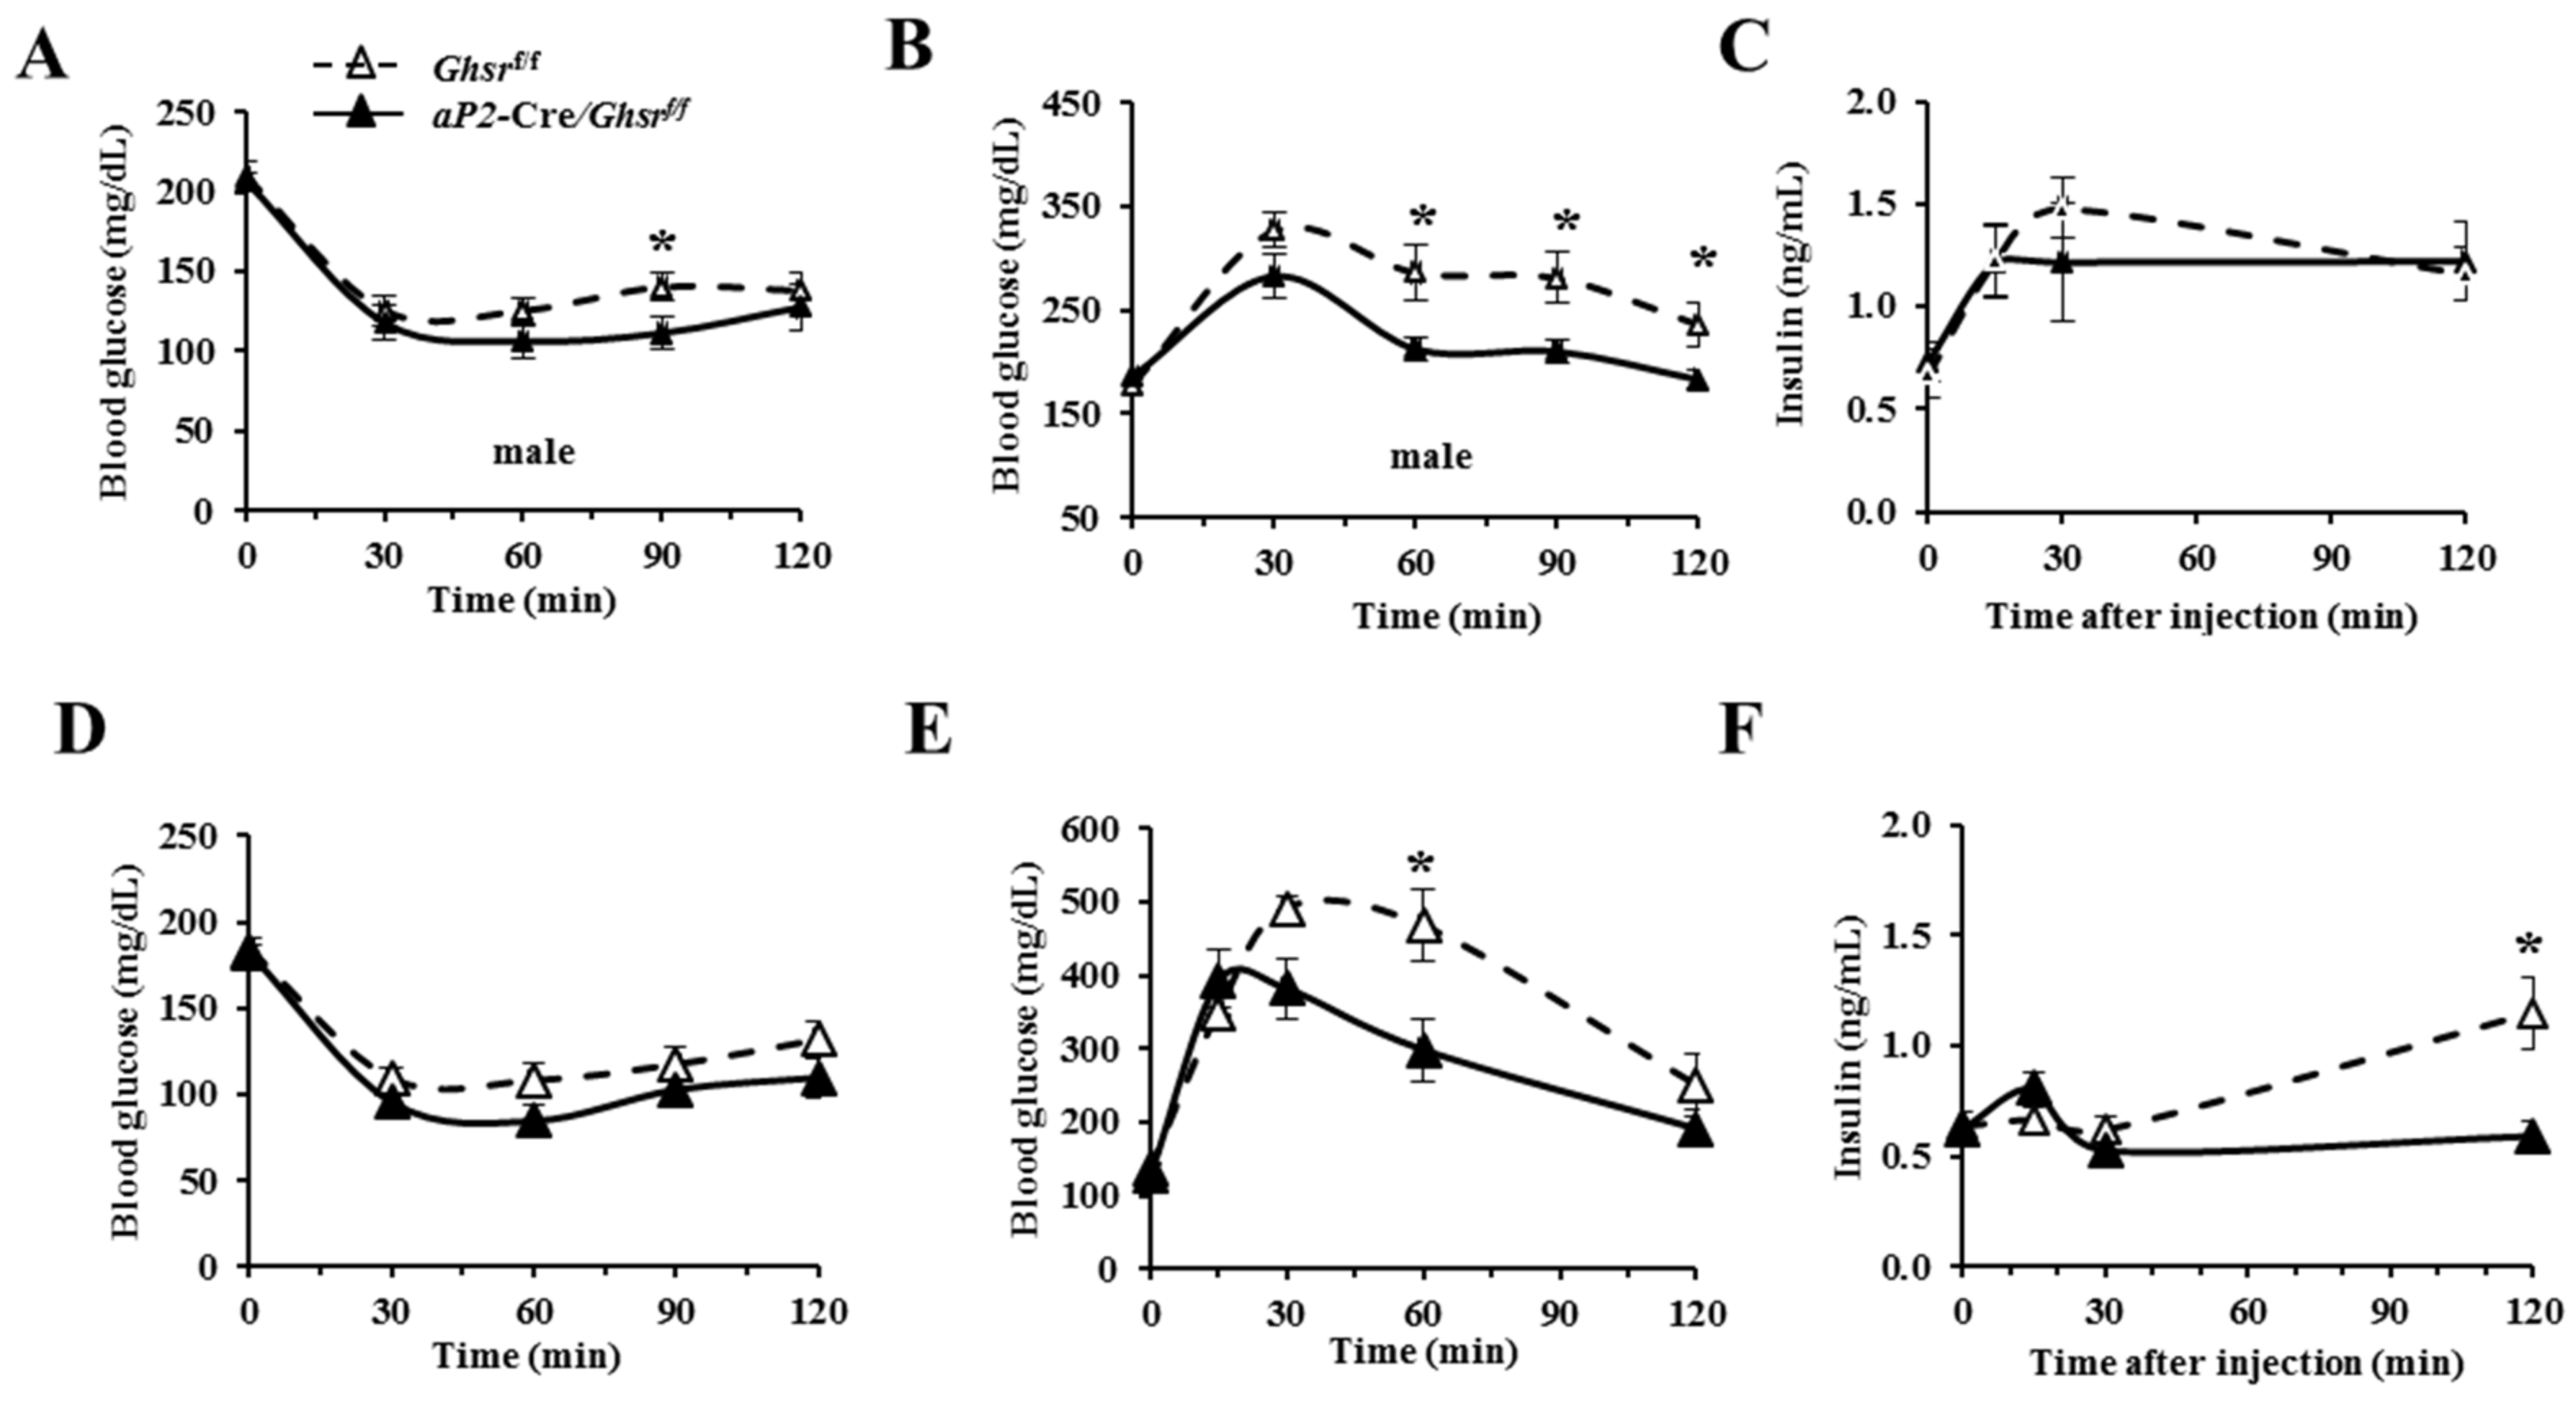
2.5. aP2-Cre-Mediated GHS-R Knockdown Mice Have Improved Insulin Sensitivity and Glucose Tolerance
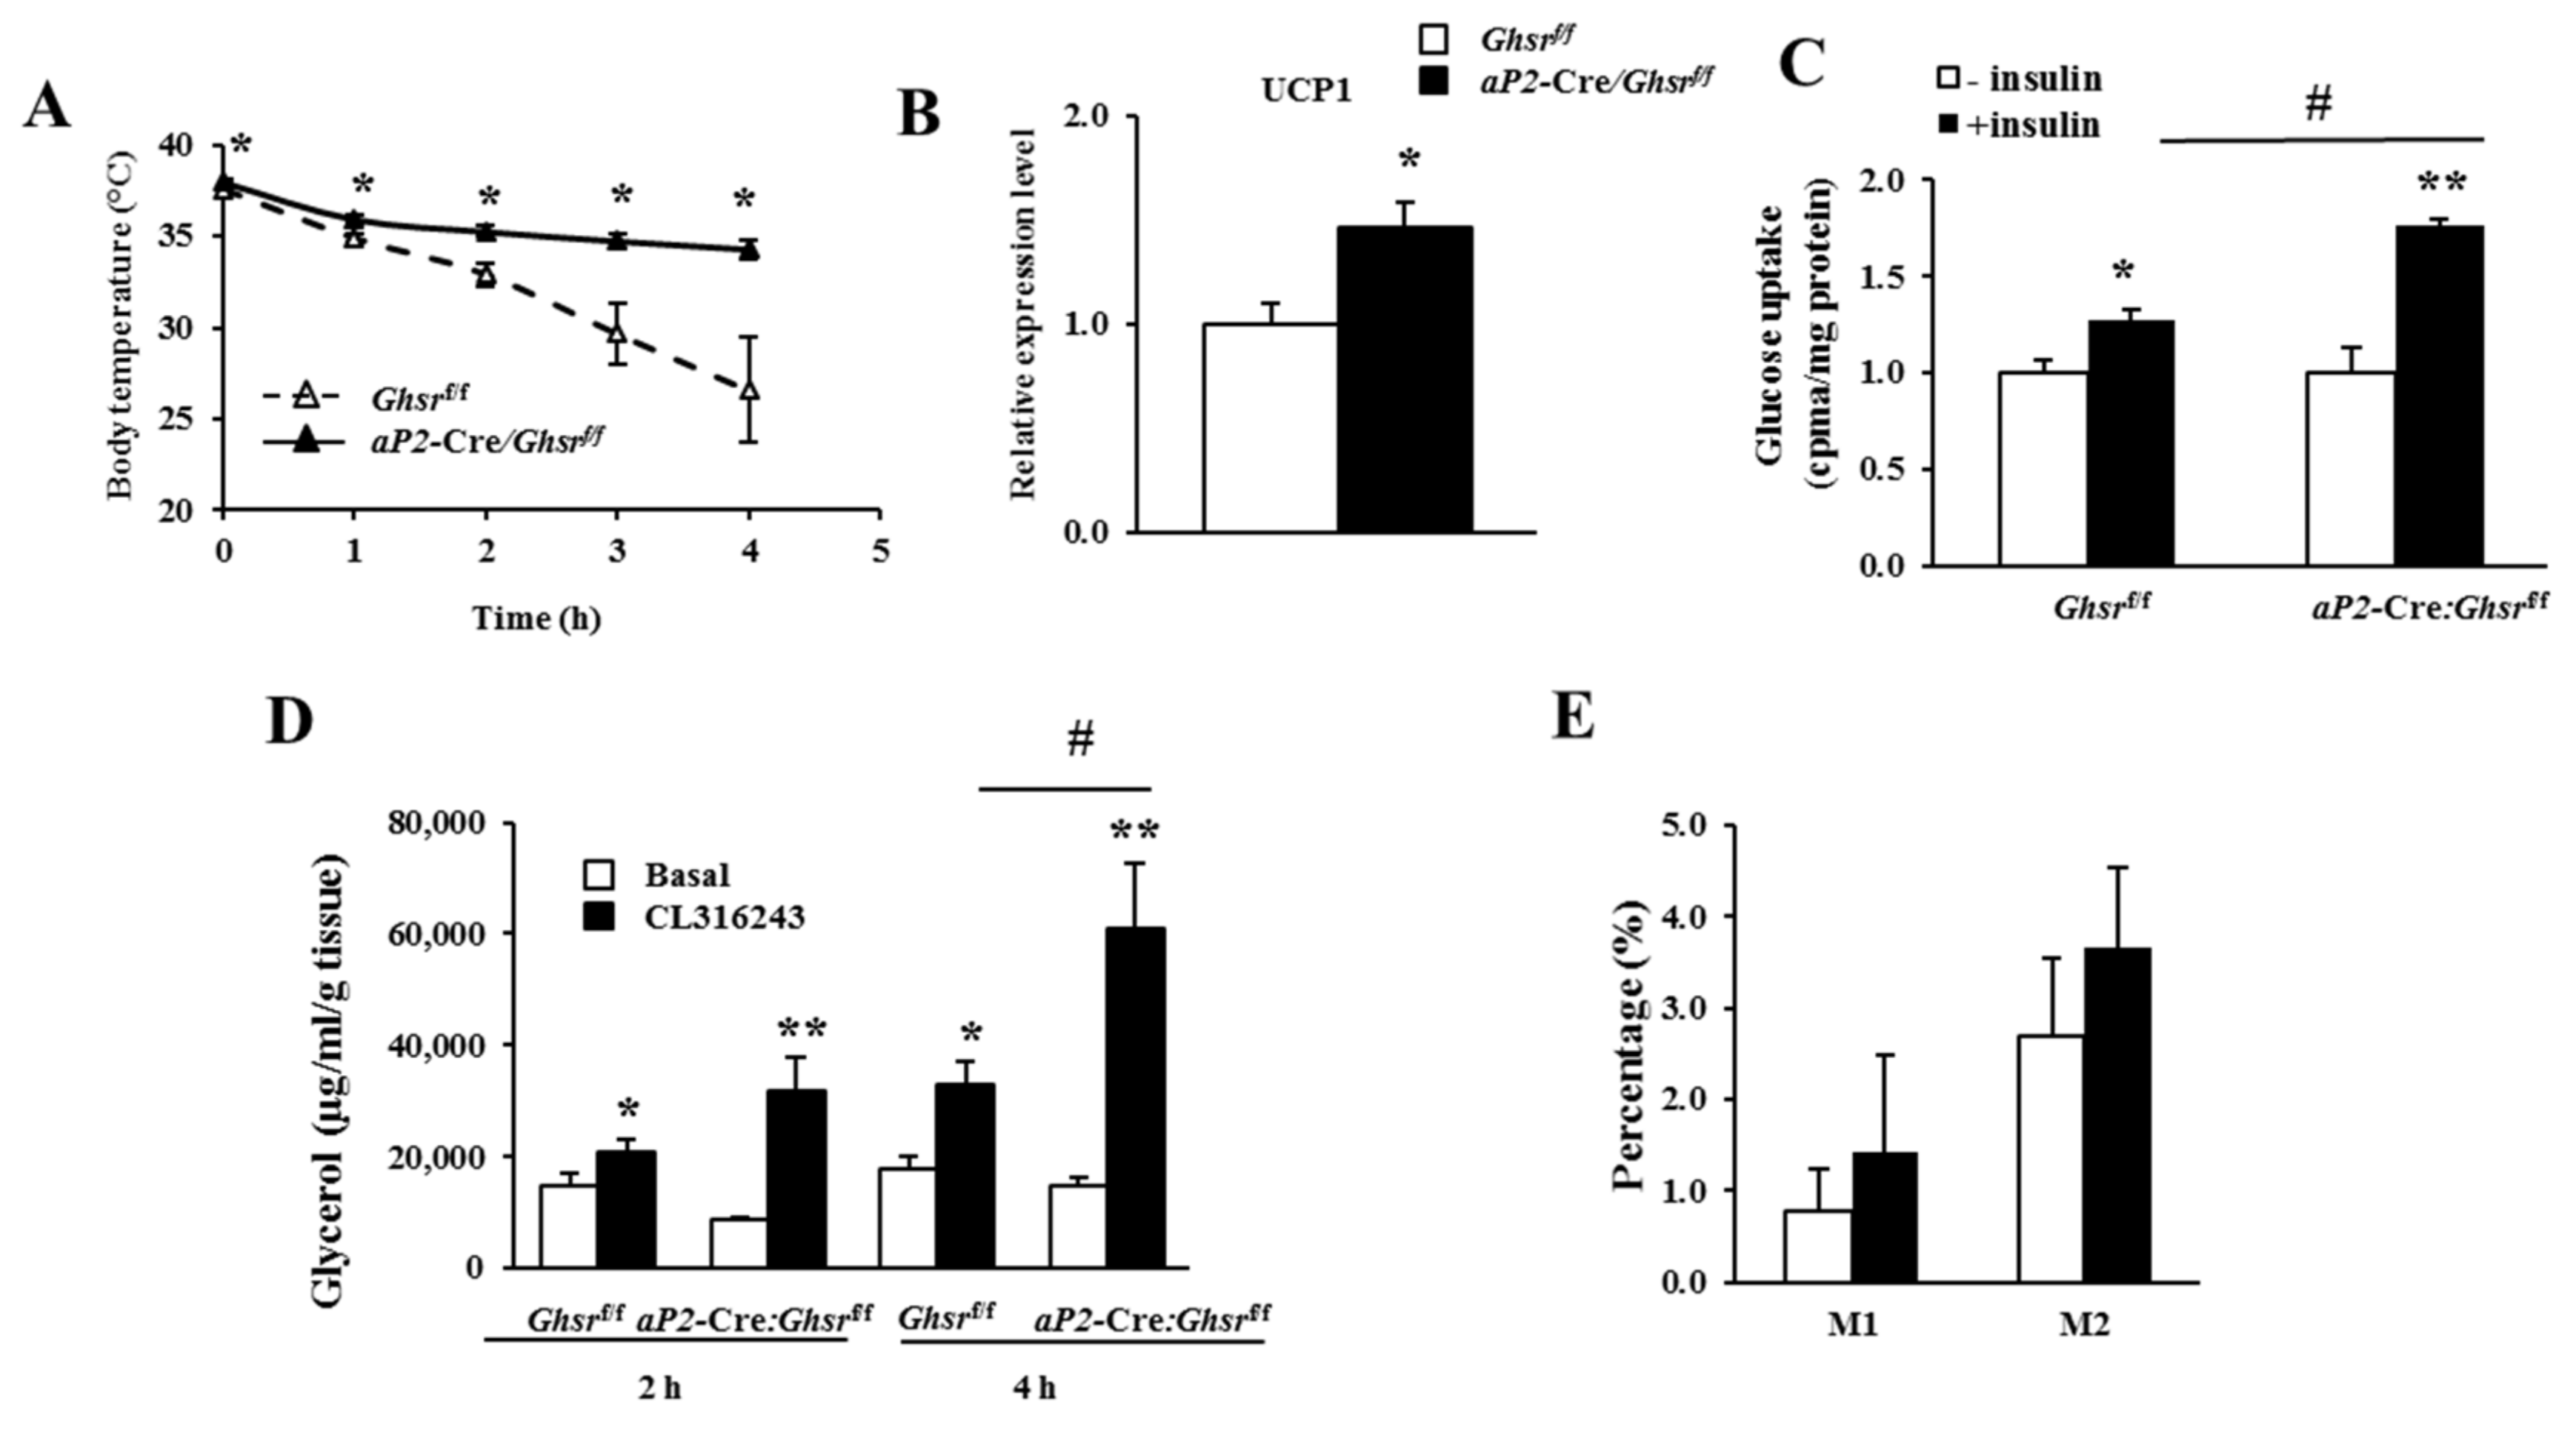
2.6. aP2-Cre-Mediated GHS-R Knockdown Improves Thermogenesis in Brown Fat, and Enhances Glucose Uptake and Lipolysis in White Fat
3. Discussion
4. Materials and Methods
4.1. Animals
4.2. Genotyping of aP2-Cre/Ghsrf/f Mice
4.3. Tissue DNA Extraction and Cre Excision Analysis
4.4. Real-Time Polymerase Chain Reaction (RT-PCR)
4.5. Body Composition and Indirect Calorimetry
4.6. Insulin Tolerance Test (ITT) and Glucose Tolerance Test (GTT)
4.7. Rectal Temperature
4.8. Glucose Uptake
4.9. Ex Vivo Lipolysis
4.10. Ghrelin-induced GH Secretion and Food Intake
4.11. Flow Cytometry Analysis
4.12. Statistical Analysis
5. Conclusions
Supplementary Materials
Author Contributions
Funding
Acknowledgments
Conflicts of Interest
Abbreviations
| AgRP | Agouti-related protein |
| aP2 | Adipocyte Protein 2 |
| BAT | Brown adipose tissue |
| BM | Bone marrow |
| EE | Energy expenditure |
| GH | Growth hormone |
| GHS-R | Growth hormone secretagogue receptor |
| GTT | Glucose tolerance test |
| HYPO | Hypothalamus |
| IGF-1 | Insulin-like growth factor-1 |
| ITT | Insulin tolerance test |
| PM | Peritoneal macrophages |
| RER | Respiratory exchange ratio |
| RMR | Resting metabolic rate |
| UCP-1 | Uncoupling protein-1 |
| WAT | White adipose tissue |
References
- Ahima, R.S. Connecting obesity, aging and diabetes. Nat. Med. 2009, 15, 996–997. [Google Scholar] [CrossRef] [PubMed]
- Amati, F.; Dube, J.J.; Coen, P.M.; Stefanovic-Racic, M.; Toledo, F.G.; Goodpaster, B.H. Physical inactivity and obesity underlie the insulin resistance of aging. Diabetes Care 2009, 32, 1547–1549. [Google Scholar] [CrossRef] [PubMed]
- Kojima, M.; Hosoda, H.; Date, Y.; Nakazato, M.; Matsuo, H.; Kangawa, K. Ghrelin is a growth-hormone-releasing acylated peptide from stomach. Nature 1999, 402, 656–660. [Google Scholar] [CrossRef] [PubMed] [Green Version]
- Tschop, M.; Smiley, D.L.; Heiman, M.L. Ghrelin induces adiposity in rodents. Nature 2000, 407, 908–913. [Google Scholar] [CrossRef] [PubMed]
- Cowley, M.A.; Smith, R.G.; Diano, S.; Tschop, M.; Pronchuk, N.; Grove, K.L.; Strasburger, C.J.; Bidlingmaier, M.; Esterman, M.; Heiman, M.L.; et al. The distribution and mechanism of action of ghrelin in the CNS demonstrates a novel hypothalamic circuit regulating energy homeostasis. Neuron 2003, 37, 649–661. [Google Scholar] [CrossRef]
- Shimbara, T.; Mondal, M.S.; Kawagoe, T.; Toshinai, K.; Koda, S.; Yamaguchi, H.; Date, Y.; Nakazato, M. Central administration of ghrelin preferentially enhances fat ingestion. Neurosci. Lett. 2004, 369, 75–79. [Google Scholar] [CrossRef] [PubMed]
- Sun, Y.; Wang, P.; Zheng, H.; Smith, R.G. Ghrelin stimulation of growth hormone release and appetite is mediated through the growth hormone secretagogue receptor. Proc. Natl. Acad. Sci. USA 2004, 101, 4679–4684. [Google Scholar] [CrossRef] [PubMed] [Green Version]
- Andrews, Z.B.; Liu, Z.W.; Walllingford, N.; Erion, D.M.; Borok, E.; Friedman, J.M.; Tschop, M.H.; Shanabrough, M.; Cline, G.; Shulman, G.I.; et al. UCP2 mediates ghrelin’s action on NPY/AgRP neurons by lowering free radicals. Nature 2008, 454, 846–851. [Google Scholar] [CrossRef] [PubMed]
- Davies, J.S.; Kotokorpi, P.; Eccles, S.R.; Barnes, S.K.; Tokarczuk, P.F.; Allen, S.K.; Whitworth, H.S.; Guschina, I.A.; Evans, B.A.; Mode, A.; et al. Ghrelin induces abdominal obesity via GHS-R-dependent lipid retention. Mol. Endocrinol. 2009, 23, 914–924. [Google Scholar] [CrossRef] [PubMed]
- Sun, Y.; Garcia, J.M.; Smith, R.G. Ghrelin and growth hormone secretagogue receptor expression in mice during aging. Endocrinology 2007, 148, 1323–1329. [Google Scholar] [CrossRef] [PubMed]
- Lin, L.; Saha, P.K.; Ma, X.; Henshaw, I.O.; Shao, L.; Chang, B.H.; Buras, E.D.; Tong, Q.; Chan, L.; McGuinness, O.P.; et al. Ablation of ghrelin receptor reduces adiposity and improves insulin sensitivity during aging by regulating fat metabolism in white and brown adipose tissues. Aging Cell 2011, 10, 996–1010. [Google Scholar] [CrossRef] [PubMed] [Green Version]
- Lin, L.; Lee, J.H.; Bongmba, O.Y.; Ma, X.; Zhu, X.; Sheikh-Hamad, D.; Sun, Y. The suppression of ghrelin signaling mitigates age-associated thermogenic impairment. Aging 2014, 6, 1019–1032. [Google Scholar] [CrossRef] [PubMed] [Green Version]
- Ma, X.; Lin, L.; Qin, G.; Lu, X.; Fiorotto, M.; Dixit, V.D.; Sun, Y. Ablations of ghrelin and ghrelin receptor exhibit differential metabolic phenotypes and thermogenic capacity during aging. PLoS ONE 2011, 6, e16391. [Google Scholar] [CrossRef] [PubMed]
- Zigman, J.M.; Nakano, Y.; Coppari, R.; Balthasar, N.; Marcus, J.N.; Lee, C.E.; Jones, J.E.; Deysher, A.E.; Waxman, A.R.; White, R.D.; et al. Mice lacking ghrelin receptors resist the development of diet-induced obesity. J. Clin. Investig. 2005, 115, 3564–3572. [Google Scholar] [CrossRef] [PubMed] [Green Version]
- Lee, J.H.; Lin, L.; Xu, P.; Saito, K.; Wei, Q.; Meadows, A.G.; Bongmba, O.Y.; Pradhan, G.; Zheng, H.; Xu, Y.; et al. Neuronal deletion of ghrelin receptor almost completely prevents diet-induced obesity. Diabetes 2016, 65, 2169–2178. [Google Scholar] [CrossRef] [PubMed] [Green Version]
- Wu, C.S.; Bongmba, O.Y.N.; Yue, J.; Lee, J.H.; Lin, L.; Saito, K.; Pradhan, G.; Li, D.P.; Pan, H.L.; Xu, A.; et al. Suppression of GHS-R in AgRP neurons mitigates diet-induced obesity by activating thermogenesis. Int. J. Mol. Sci. 2017, 18, 832. [Google Scholar] [CrossRef] [PubMed]
- Mao, J.; Yang, T.; Gu, Z.; Heird, W.C.; Finegold, M.J.; Lee, B.; Wakil, S.J. aP2-Cre-mediated inactivation of acetyl-CoA carboxylase 1 causes growth retardation and reduced lipid accumulation in adipose tissues. Proc. Natl. Acad. Sci. USA 2009, 106, 17576–17581. [Google Scholar] [CrossRef] [PubMed] [Green Version]
- Martens, K.; Bottelbergs, A.; Baes, M. Ectopic recombination in the central and peripheral nervous system by aP2/FABP4-Cre mice: Implications for metabolism research. FEBS Lett. 2010, 584, 1054–1058. [Google Scholar] [CrossRef] [PubMed] [Green Version]
- Zhang, J.; Wang, Y.; Gao, Z.; Yun, Z.; Ye, J. Hypoxia-inducible factor 1 activation from adipose protein 2-cre mediated knockout of von Hippel-Lindau gene leads to embryonic lethality. Clin. Exp. Pharmacol. Physiol. 2012, 39, 145–150. [Google Scholar] [CrossRef] [PubMed]
- Verhulst, P.J.; De Smet, B.; Saels, I.; Thijs, T.; Ver Donck, L.; Moechars, D.; Peeters, T.L.; Depoortere, I. Role of ghrelin in the relationship between hyperphagia and accelerated gastric emptying in diabetic mice. Gastroenterology 2008, 135, 1267–1276. [Google Scholar] [CrossRef] [PubMed]
- Pedersen, S.B.; Bruun, J.M.; Hube, F.; Kristensen, K.; Hauner, H.; Richelsen, B. Demonstration of estrogen receptor subtypes alpha and beta in human adipose tissue: Influences of adipose cell differentiation and fat depot localization. Mol. Cell. Endocrinol. 2001, 182, 27–37. [Google Scholar] [CrossRef]
- Mayes, J.S.; Watson, G.H. Direct effects of sex steroid hormones on adipose tissues and obesity. Obes. Rev. 2004, 5, 197–216. [Google Scholar] [CrossRef] [PubMed]
- Pallottini, V.; Bulzomi, P.; Galluzzo, P.; Martini, C.; Marino, M. Estrogen regulation of adipose tissue functions: Involvement of estrogen receptor isoforms. Infect. Disord. Drug Targets 2008, 8, 52–60. [Google Scholar] [CrossRef] [PubMed]
- Longo, K.A.; Charoenthongtrakul, S.; Giuliana, D.J.; Govek, E.K.; McDonagh, T.; Qi, Y.; DiStefano, P.S.; Geddes, B.J. Improved insulin sensitivity and metabolic flexibility in ghrelin receptor knockout mice. Regul. Pept. 2008, 150, 55–61. [Google Scholar] [CrossRef] [PubMed]
- Cannon, B.; Nedergaard, J. Brown adipose tissue: Function and physiological significance. Physiol. Rev. 2004, 84, 277–359. [Google Scholar] [CrossRef] [PubMed]
- Ross, S.R.; Graves, R.A.; Greenstein, A.; Platt, K.A.; Shyu, H.L.; Mellovitz, B.; Spiegelman, B.M. A fat-specific enhancer is the primary determinant of gene expression for adipocyte P2 in vivo. Proc. Natl. Acad. Sci. USA 1990, 87, 9590–9594. [Google Scholar] [CrossRef] [PubMed]
- Bluher, M.; Michael, M.D.; Peroni, O.D.; Ueki, K.; Carter, N.; Kahn, B.B.; Kahn, C.R. Adipose tissue selective insulin receptor knockout protects against obesity and obesity-related glucose intolerance. Dev. Cell 2002, 3, 25–38. [Google Scholar] [CrossRef]
- Tang, T.; Zhang, J.; Yin, J.; Staszkiewicz, J.; Gawronska-Kozak, B.; Jung, D.Y.; Ko, H.J.; Ong, H.; Kim, J.K.; Mynatt, R.; et al. Uncoupling of inflammation and insulin resistance by NF-kappaB in transgenic mice through elevated energy expenditure. J. Boil. Chem. 2010, 285, 4637–4644. [Google Scholar] [CrossRef] [PubMed]
- Makowski, L.; Brittingham, K.C.; Reynolds, J.M.; Suttles, J.; Hotamisligil, G.S. The fatty acid-binding protein, aP2, coordinates macrophage cholesterol trafficking and inflammatory activity. Macrophage expression of aP2 impacts peroxisome proliferator-activated receptor gamma and IkappaB kinase activities. J. Boil. Chem. 2005, 280, 12888–12895. [Google Scholar] [CrossRef] [PubMed]
- Urs, S.; Harrington, A.; Liaw, L.; Small, D. Selective expression of an aP2/Fatty Acid Binding Protein 4-Cre transgene in non-adipogenic tissues during embryonic development. Transgenic Res. 2006, 15, 647–653. [Google Scholar] [CrossRef] [PubMed]
- Theander-Carrillo, C.; Wiedmer, P.; Cettour-Rose, P.; Nogueiras, R.; Perez-Tilve, D.; Pfluger, P.; Castaneda, T.R.; Muzzin, P.; Schurmann, A.; Szanto, I.; et al. Ghrelin action in the brain controls adipocyte metabolism. J. Clin. Investig. 2006, 116, 1983–1993. [Google Scholar] [CrossRef] [PubMed] [Green Version]
- Zhang, W.Z.; Zhao, L.L.; Lin, T.R.; Chai, B.X.; Fan, Y.Y.; Gantz, I.; Mulholland, M.W. Inhibition of adipogenesis by ghrelin. Mol. Boil. Cell 2004, 15, 2484–2491. [Google Scholar] [CrossRef] [PubMed]
- Muccioli, G.; Pons, N.; Chè, C.; Catapano, F.; Granata, R.; Chigo, E. Ghrelin and des-acyl ghrelin both inhibit isoproterenol-induced lipolysis in rat adipocytes via a non-type 1a growth hormone secretagogue receptor. Eur. J. Pharmacol. 2004, 498, 27–35. [Google Scholar] [CrossRef] [PubMed]
- Choi, K.; Roh, S.G.; Hong, Y.H.; Shrestha, Y.B.; Hishikawa, D.; Chen, C.; Kojima, M.; Kangawa, K.; Sasaki, S.I. The role of ghrelin and growth hormone secretagogues receptor on rat adipogenesis. Endocrinolgy 2003, 144, 754–759. [Google Scholar] [CrossRef] [PubMed]
- Giovambattista, A.; Piermaría, J.; Suescun, M.O.; Calandra, R.S.; Gaillard, R.C.; Spinedi, E. Direct effect of ghrelin on leptin production by cultured rat white adipocytes. Obesity 2006, 14, 19–27. [Google Scholar] [CrossRef] [PubMed]
- Wang, Z.V.; Deng, Y.; Wang, Q.A.; Sun, K.; Scherer, P.E. Identification and characterization of a promoter cassette conferring adipocyte-specific gene expression. Endocrinology 2010, 151, 2933–2939. [Google Scholar] [CrossRef] [PubMed]
- Fan, H.; Gulley, M.L. DNA extraction from fresh or frozen tissues. Methods Mol. Med. 2001, 49, 5–10. [Google Scholar] [PubMed]
- Madisen, L.; Zwingman, T.A.; Sunkin, S.M.; Oh, S.W.; Zariwala, H.A.; Gu, H.; Ng, L.L.; Palmiter, R.D.; Hawrylycz, M.J.; Jones, A.R.; et al. A robust and high-throughput Cre reporting and characterization system for the whole mouse brain. Nat. Neurosci. 2010, 13, 133–140. [Google Scholar] [CrossRef] [PubMed]
- Wilkes, J.J.; Nelson, E.; Osborne, M.; Demarest, K.T.; Olefsky, J.M. Topiramate is an insulin-sensitizing compound in vivo with direct effects on adipocytes in female ZDF rats. Am. J. Physiol. Endocrinol. Metab. 2005, 288, E617–E624. [Google Scholar] [CrossRef] [PubMed]
- Lin, L.; Pang, W.; Chen, K.; Wang, F.; Gengler, J.; Sun, Y.; Tong, Q. Adipocyte expression of PU.1 transcription factor causes insulin resistance through upregulation of inflammatory cytokine gene expression and ROS production. Am. J. Physiol. Endocrinol. Metab. 2012, 302, E1550–1559. [Google Scholar] [CrossRef] [PubMed]
- Lin, L.; Lee, J.H.; Buras, E.D.; Yu, K.; Wang, R.; Smith, C.W.; Wu, H.; Sheikh-Hamad, D.; Sun, Y. Ghrelin receptor regulates adipose tissue inflammation in aging. Aging 2016, 8, 178–191. [Google Scholar] [CrossRef] [PubMed]


© 2018 by the authors. Licensee MDPI, Basel, Switzerland. This article is an open access article distributed under the terms and conditions of the Creative Commons Attribution (CC BY) license (http://creativecommons.org/licenses/by/4.0/).
Share and Cite
Lin, L.; Lee, J.H.; Wang, R.; Wang, R.; Sheikh‐Hamad, D.; Zang, Q.S.; Sun, Y. aP2-Cre Mediated Ablation of GHS-R Attenuates Adiposity and Improves Insulin Sensitivity during Aging. Int. J. Mol. Sci. 2018, 19, 3002. https://doi.org/10.3390/ijms19103002
Lin L, Lee JH, Wang R, Wang R, Sheikh‐Hamad D, Zang QS, Sun Y. aP2-Cre Mediated Ablation of GHS-R Attenuates Adiposity and Improves Insulin Sensitivity during Aging. International Journal of Molecular Sciences. 2018; 19(10):3002. https://doi.org/10.3390/ijms19103002
Chicago/Turabian StyleLin, Ligen, Jong Han Lee, Ruitao Wang, Ru Wang, David Sheikh‐Hamad, Qun S. Zang, and Yuxiang Sun. 2018. "aP2-Cre Mediated Ablation of GHS-R Attenuates Adiposity and Improves Insulin Sensitivity during Aging" International Journal of Molecular Sciences 19, no. 10: 3002. https://doi.org/10.3390/ijms19103002