3.1. Loss on Ignition (LOI)
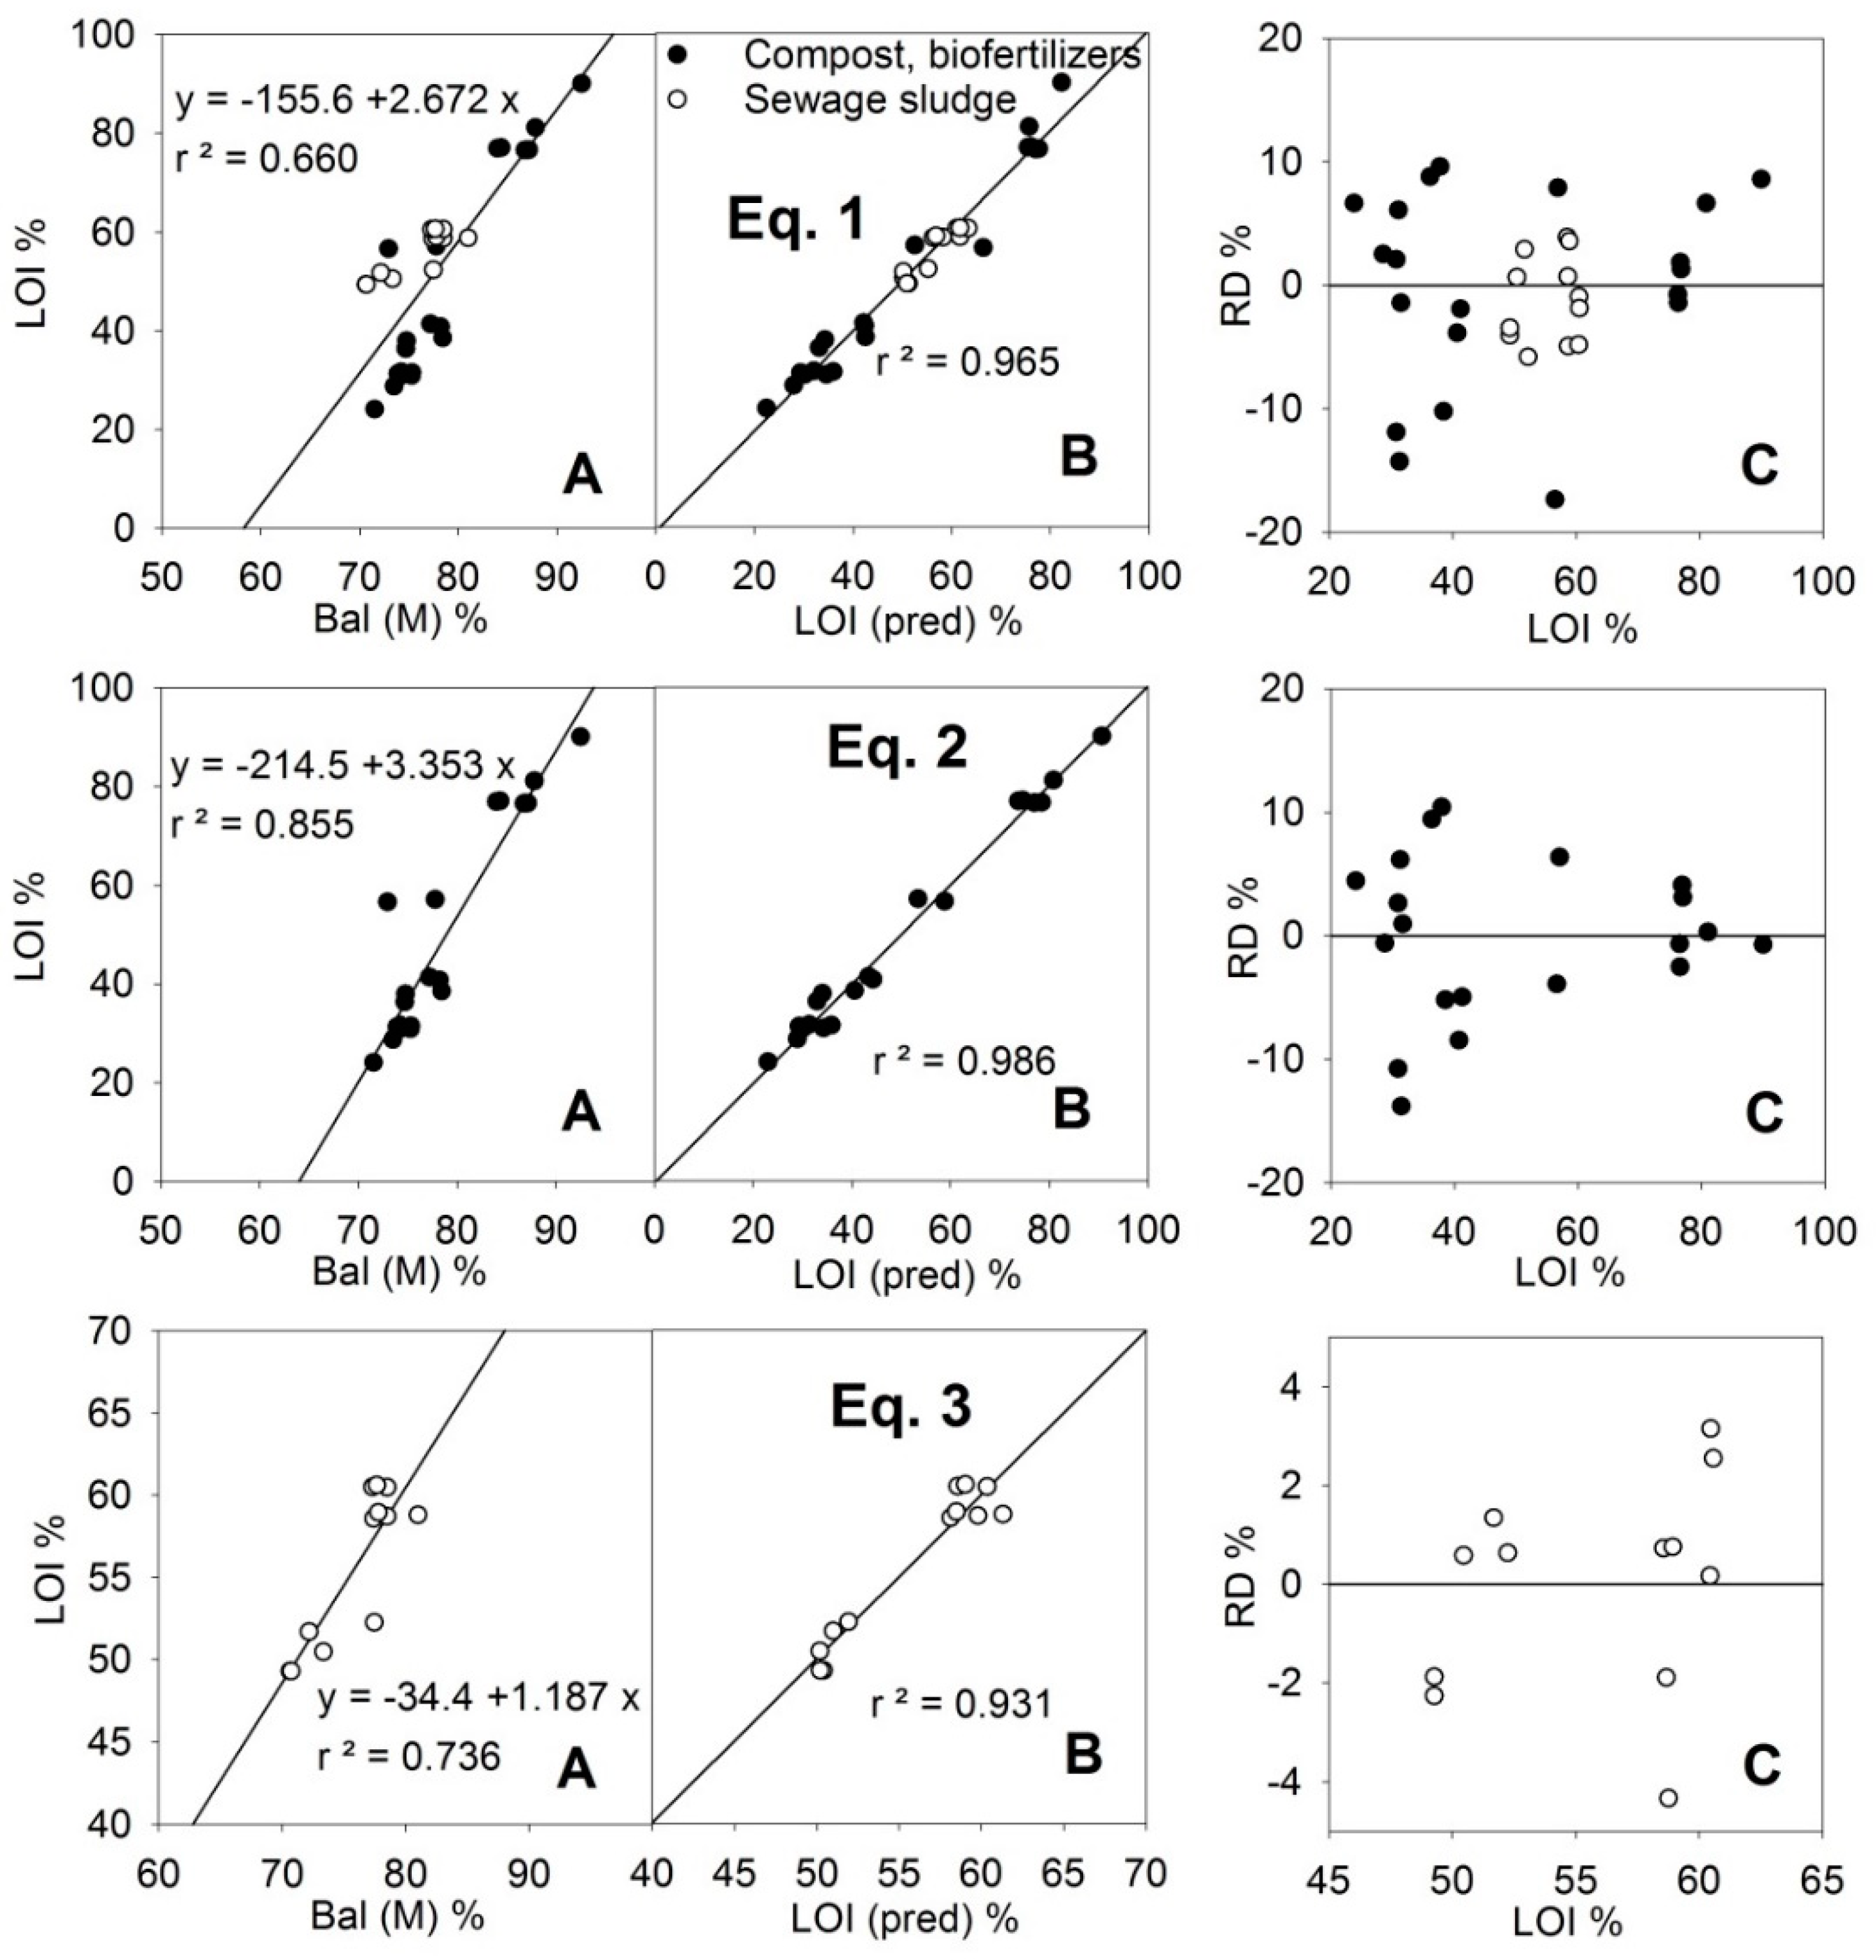
The LOI (i.e., organic matter content) is not directly determined by the PXRF instrument since the constituent elements of the organic matter (C, N, O, H) are beyond its capability. However, in the measurement method M, a result called “Bal” (balance) is given, corresponding to the difference of up to 100% that has not been assigned to other elements. Bal and LOI were correlated (
Figure 1), but the adjustment was weak (
r2 = 0.66 for all the samples), and as can be seen in
Table 1, the values for Bal were much higher than those of LOI (average data from the MARSEP programme). These two parameters adjusted well (
Figure 1, Equation (1)) if the Si (M) and Ca (M) contents were included in Linear Equation (1) (
Table 2) between LOI and Bal. Equation (1) assumed that Bal can include organic matter (LOI) and elements such as oxygen associated with silica, clay and calcium carbonate, that are likely constituents of the compost and sewage sludge samples. The stoichiometric coefficients in Equation (1) would be −0.114 for SiO
2, −0.171 for SiO
3 (silicates, clay), and −0.120 for CaCO
3. The cause of the highest absolute values for the actual coefficients in Equation (1) is likely to be because other O-binding compounds, such as phosphates, sulfates, and iron and aluminum oxides, are included in the composition of the samples. The correlation coefficient for the predicted-LOI and actual-values,
r = 0.982 > 0.98 (
r2 = 0.965), indicated the validity of the adjustment for quantification. Additionally, the slope and the y-intercept of the relationship LOI-LOI (pred) met the quality criteria (slope = 1 and y-intercept = 0) whether for Equation (1), (2) or (3).
If the samples were separated according to their type (compost or sewage sludge) an even better adjustment could be obtained for the group of compost samples using Equation (2), which included a significant P (M) term, reducing the relative error of the predictions below 15% for all the sets of samples and below 10% if the LOI value was greater than 40% (
Figure 1). For the samples of sewage sludge, the obtained adjustment (Equation (3),
Figure 1) included an Fe(M) term, but it did not improve on Equation (1), although since these samples had a LOI value >50% their relative errors were kept below 4%. The Fe (M) term was due to the high content of this element in sewage sludge (see Fe in
Figure 2).
To the best of the authors’ knowledge, there is no previous study in which the organic matter content (LOI) of organic amendments could have been inferred directly from the PXRF data. It is worth mentioning here the works of Andrade et al. [
32] and Silva et al. [
33] in which they found that Ca, P, Si and Fe, in line with the results presented here, were also among the most important variables for modeling the organic matter content in Brazilian soils. However, the
r2 values obtained in these studies were generally <0.8, possibly due the low organic content of the Brazilian soils studied.
3.2. Macroelements (Fe, Al, Ca, K, P, S)
A comparison of the contents of the certified samples SdAR-M2 and ISE 859, as determined by the M and S methods of PXRF, is shown in the
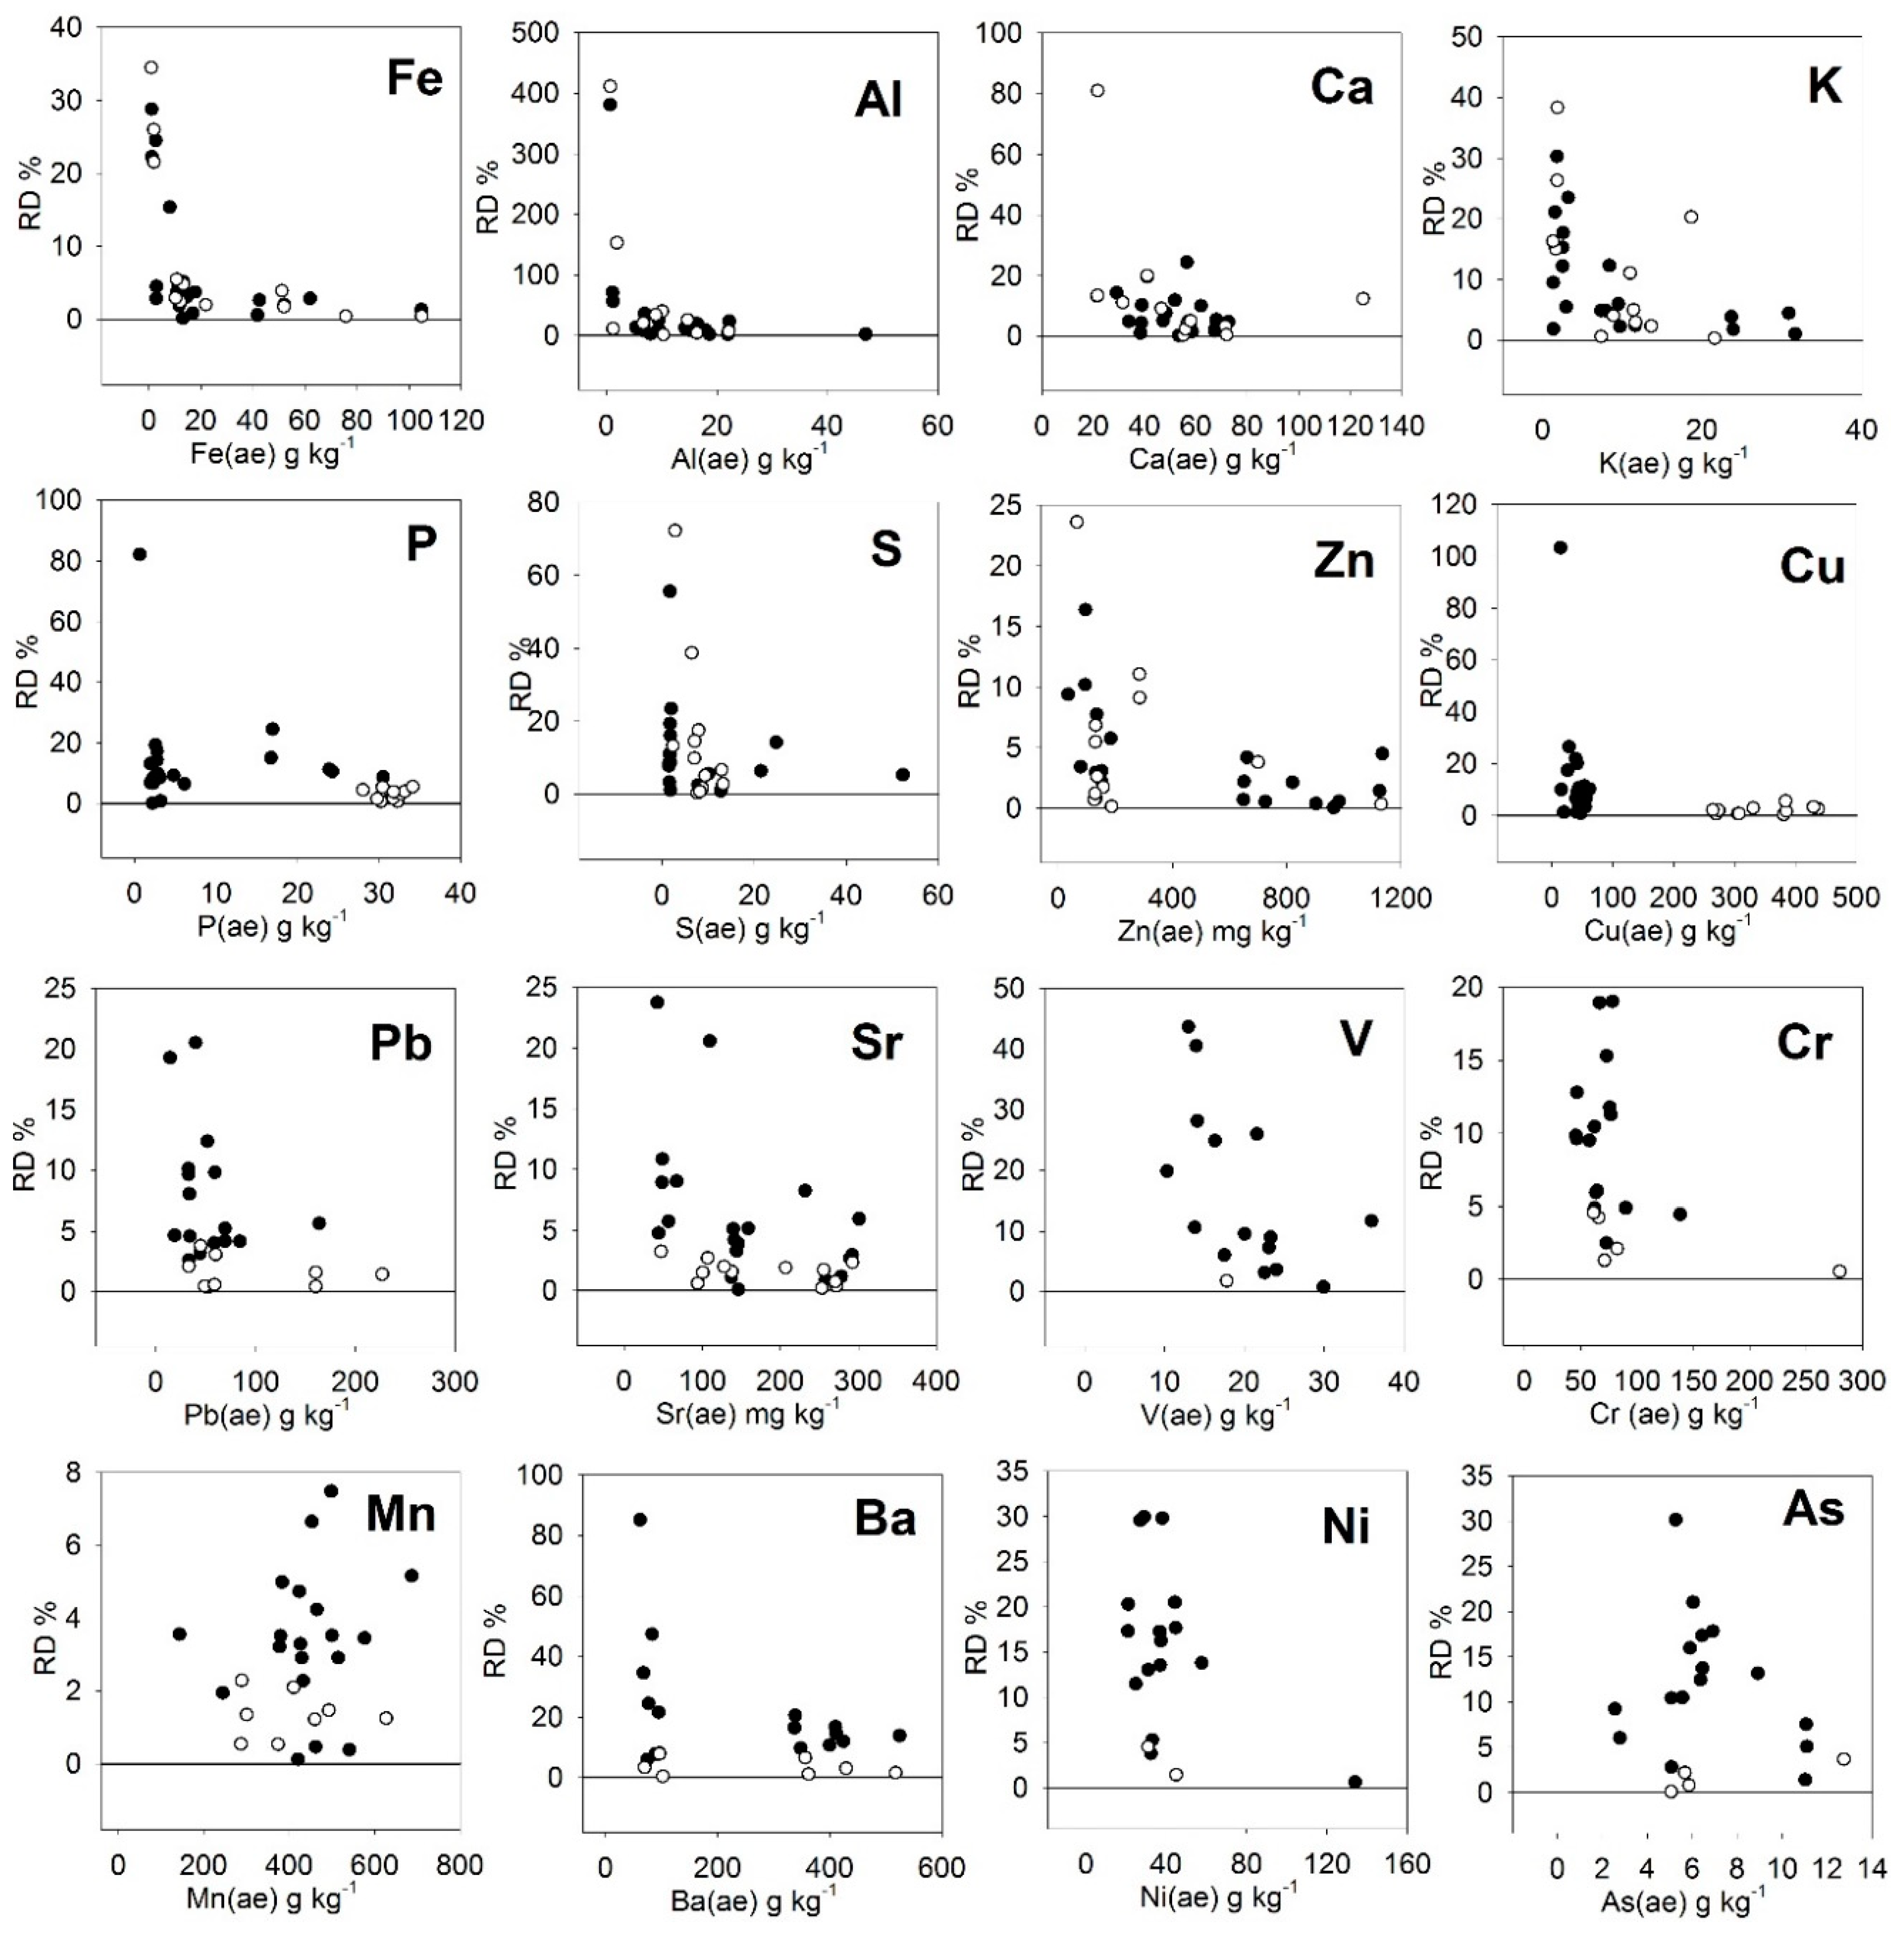
Table 3. The EPA Method 6200 [
15] indicated that the measured value for each target analyte should be within ±20 percent (% RD) of the true value for the verification check to be acceptable. The contents of Fe (M) were satisfactory for both samples, while Fe (S) readings underestimated Fe content in the SdAR-M2 sample. The Al (M) readings underestimated its content in both samples. The Ca (M) contents were satisfactory for both samples. The Ca (S) readings were also satisfactory for both samples, although the RDs were greater than those corresponding to the M method. The K (M) content was satisfactory for the ISE 859 sample but slightly exceeded the 20% error limit for the SdAR-M2 sample. On the contrary, K (S) content was satisfactory for the SdAR-M2 sample but slightly exceeded the 20% error limit for the ISE 859 sample. Considering both methods, the average absolute RD was lower for the S method. The P (M) measurement was adequate for the ISE 859 sample, but the RD was quite high for the SdAR-M2 sample. Nevertheless, the P content of this sample (0.35 g·kg
−1) was lower than the minimum P content in the organic amendments (1.01 g·kg
−1,
Table 1). The S (M) readings were imprecise. The content of S as read by the S method was satisfactory for the ISE 859 sample and slightly exceeded the 20% limit for the SdAR-M2 sample, but in this sample, the S content was lower than the minimum in the amendments (
Table 1). The content of Si (M) was satisfactory in SdAR-M2 and slightly exceeded the 20% error limit in the ISE 859 sample. The Mg (M) content in ISE 859 was underestimated due to this element requiring air to be purged from the measurement window. In any case, the Mg element was not included in the following comparisons since a small number of data from PXRF were obtained, offering inconsistent results, possibly because they were close to the detection limit of the instrument. Additionally, in the case of Cl, there was not reported data in the MARSEP reports.
It was decided to use the readings Fe (M), Ca (M), P (M), Si (M), K (S), and S (S). The manufacturer’s recommendations indicate that the M method is especially recommended for contents of metallic elements above 1%.
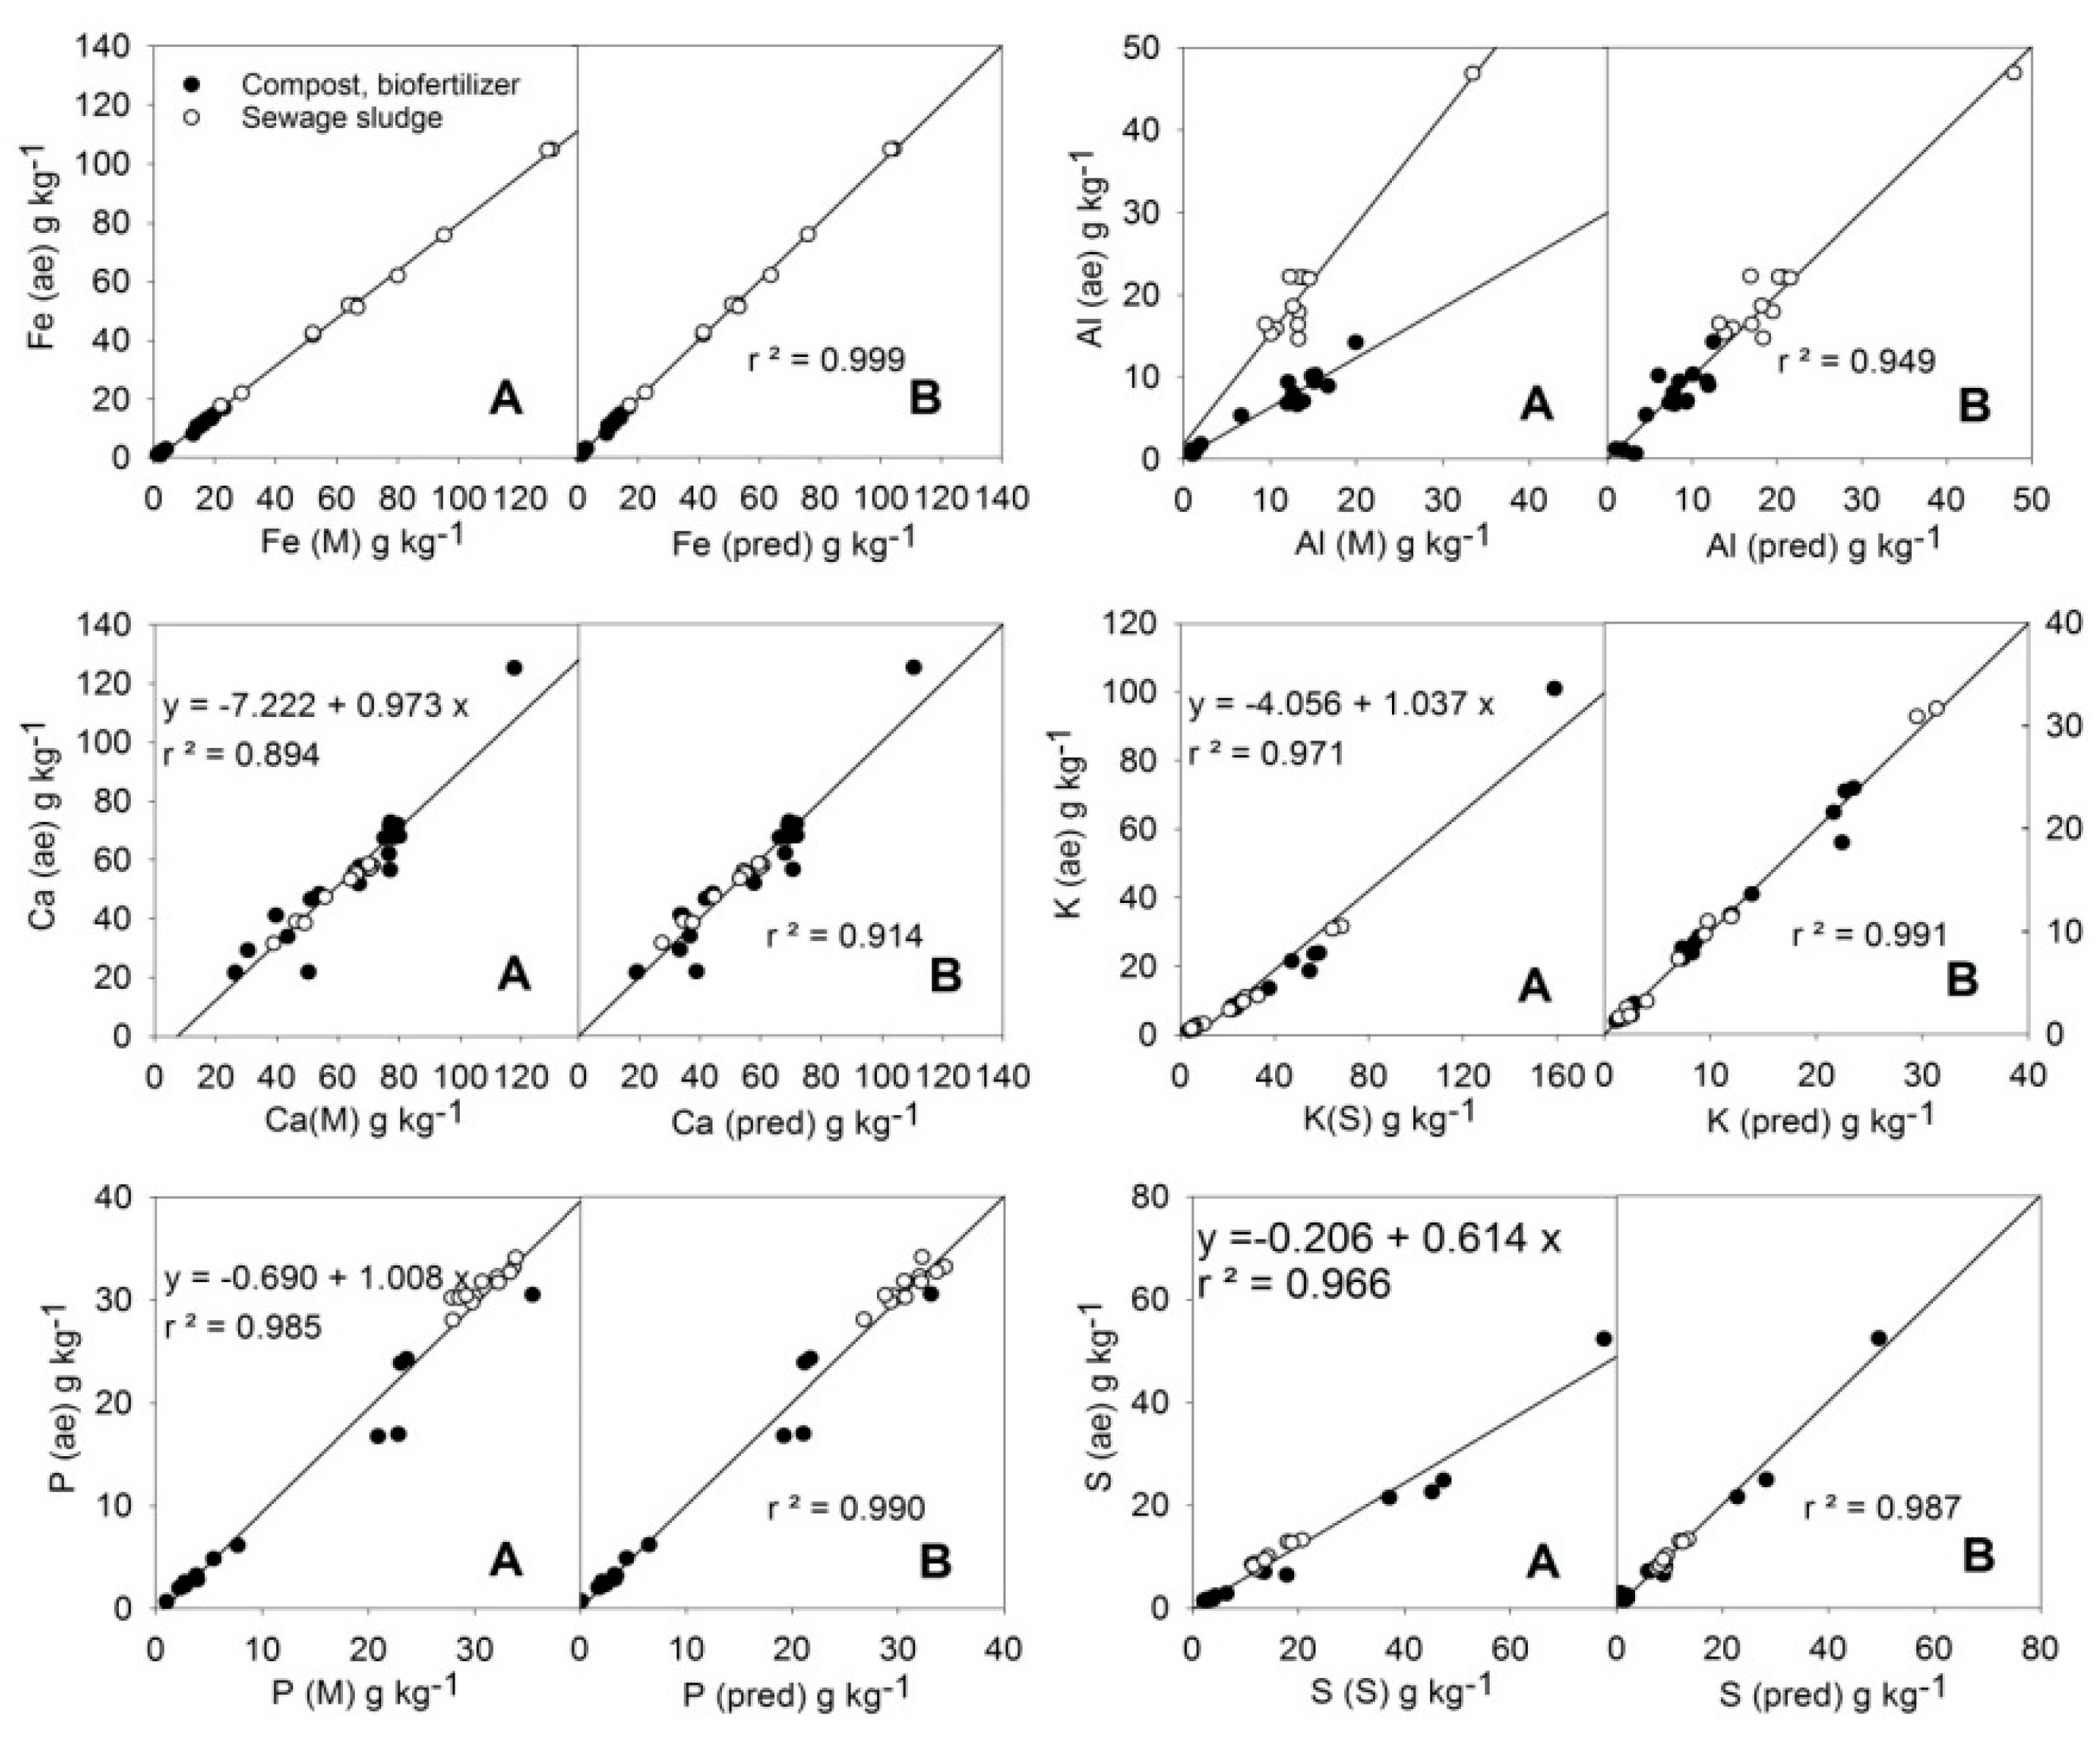
Linear relationships among the average MARSEP values (X (ae)) and the selected X (M) or X (S) readings can be observed in
Figure 2 for the elements Fe, Al, Ca, K, P, and S. In the case of Al, two different trends can be observed depending on the type of sample considered (compost or sewage sludge). The relationships between the average values of the MARSEP program (X (ae), the vertical axis in each plot) and the calculated values from the best equations found (X (pred), the right horizontal axis in each plot) for the majority elements are shown in
Figure 2. The obtained chemical linear equation for each element is shown in
Table 4, and the results of the t-test among actual and predicted
aqua regia-extractable contents are shown in
Table 5.
The linearity was excellent for Fe. However, the slope of the regression was less than 1 and the Fe (ae) results were generally 20% lower than the Fe (M) readings. Caporale et al [
17] found the soil
aqua regia-extractable content of Fe was about 10–20% lower than the measured content using a similar PXRF instrument. This indicated a fraction of Fe was highly insoluble, likely due to the crystalline structures of the clay or other silicate compounds [
17], which are probably also present in the compost and sludge samples. In the case that the Si (M) content was used to adjust the linear regression, Equation (4) in
Table 4 was obtained, with the coefficient for the Si(M) term being statistically significant (
p (C) = 0.005). The correlation coefficient (
r = 0.9999) and the results of the
t-test (
Table 5) showed a very good fitting between the actual Fe (ae) and predicted-Fe values, indicating the validity of the adjustment for quantification.
The plot of Al (M) against the corresponding MARSEP results (Al (ae)) showed two different patterns (
Figure 2). Sewage sludge samples tended to have higher Al (ae) values than Mining PXRF readings, while compost and biofertilizer samples tended to give lower Al (ae) values than Mining PXRF readings. It is likely that in both amendment types, a part of their Al was associated with Si in clay structures, but the effect was different depending on the Si content of the sample (average Si (M) content was 73.1 g·kg
−1 for the compost samples and 36.0 g kg
−1 for the sewage sludge samples). If this factor was taken into account (Equation (5),
Table 4), the coefficient obtained for the Si (M) effect was significant and only one regression line was obtained. The paired sample
t-test (
Table 5) showed no significant differences among actual and predicted Al (ae) contents, and the correlation coefficient (
r = 0.974) was close to the limit (
r > 0.98) to allow the quantification of this element despite the low performance of the direct Al(M) readings.
In the case of Ca, the slope of the regression line (0.973) being close to 1 (
Figure 2) indicated that there is not a large fraction of Ca associated with minerals not soluble in acid. However, the dots showed a certain dispersion, which is indicative of disturbing effects, as measured by PXRF. A better fit (
r2 = 0.914) with significant coefficients was obtained considering K (S) contents as independent terms in the linear regression analysis (Equation (6)). The paired
t-test (
Table 5) indicated that predicted and actual Ca (ae) data did not differ at the 99% confidence interval, but the value of
r = 0.956 < 0.98 did not allow quantification of this element. It is worth noting that the mismatch was largely due to the deviations of two points, one of them with a Ca content higher than the rest of the samples (see
Figure 2). However, no anomaly was found in the general composition of these two samples that offers an explanation for their high deviations.
The slope of the regression line of K (ae) against readings of K (S) was 0.43 (
Figure 2), indicating more than half of K was in acid-insoluble forms, likely associated to silicates. However, the best improvement in the adjustment was obtained if S (M) content was included in Equation (7) (
Table 4). One K (ae) result >100 g·kg
−1, corresponding to an organic fertilizer, was not used in the adjustment. With the S (M) correction the value of
r = 0.995 indicated good quantification from the proposed equation. The paired t-test (
Table 5) indicated that predicted and actual K (ae) data did not differ at the 99% confidence interval.
The fitting of the P(M) readings to the P (ae) data was good and direct (
Figure 2), showing a value of slope close to 1 and
r = 0.992 > 0.98, allowing the quantification of this element with the correction of a low value for the y-intercept. However, a further improvement can be achieved if the term Fe (M) is incorporated into Equation (8) (
Table 4), reaching
r = 0.995. The results of the
t-test (
Table 5) indicated equality among predicted and actual P (ae) data. The P–Fe relationship is likely based on the use of Fe salts used in wastewater treatment [
34].
It is considered that light elements, i.e., P, K, Ca, Mg, contents are difficult to be measured with XRF, at least in soil samples [
35]. In soils, Nawar et al. [
35] obtained
r2 values of 0.92–0.95 for Mg, P, K, and Ca using the random forests model for calibration. Thus, the
r2 values obtained in the present study can be considered satisfactory, since the calibration procedure based on the spectra used by Nawar et al. [
35] is more complex than the one used in this study.
For sulphur, the readings of the S method were about 40% higher than the acid extractable contents (
Figure 2). Equation (9) provided a good fit, including the terms Bal (organic matter content) and Cu (S) content, which were both significant (
Table 4). The Bal correction was negative while the Cu (S) was positive. Likely, the Cu (S) term included the effect of several metals, such as Pb, Zn, and As, which also showed correlations with the residuals (data not shown). The value
r = 0.994 > 0.98 (
Table 4) and the equality of the predicted and the actual values (
Table 5) allow the quantification of S (ae).
3.3. Trace Elements
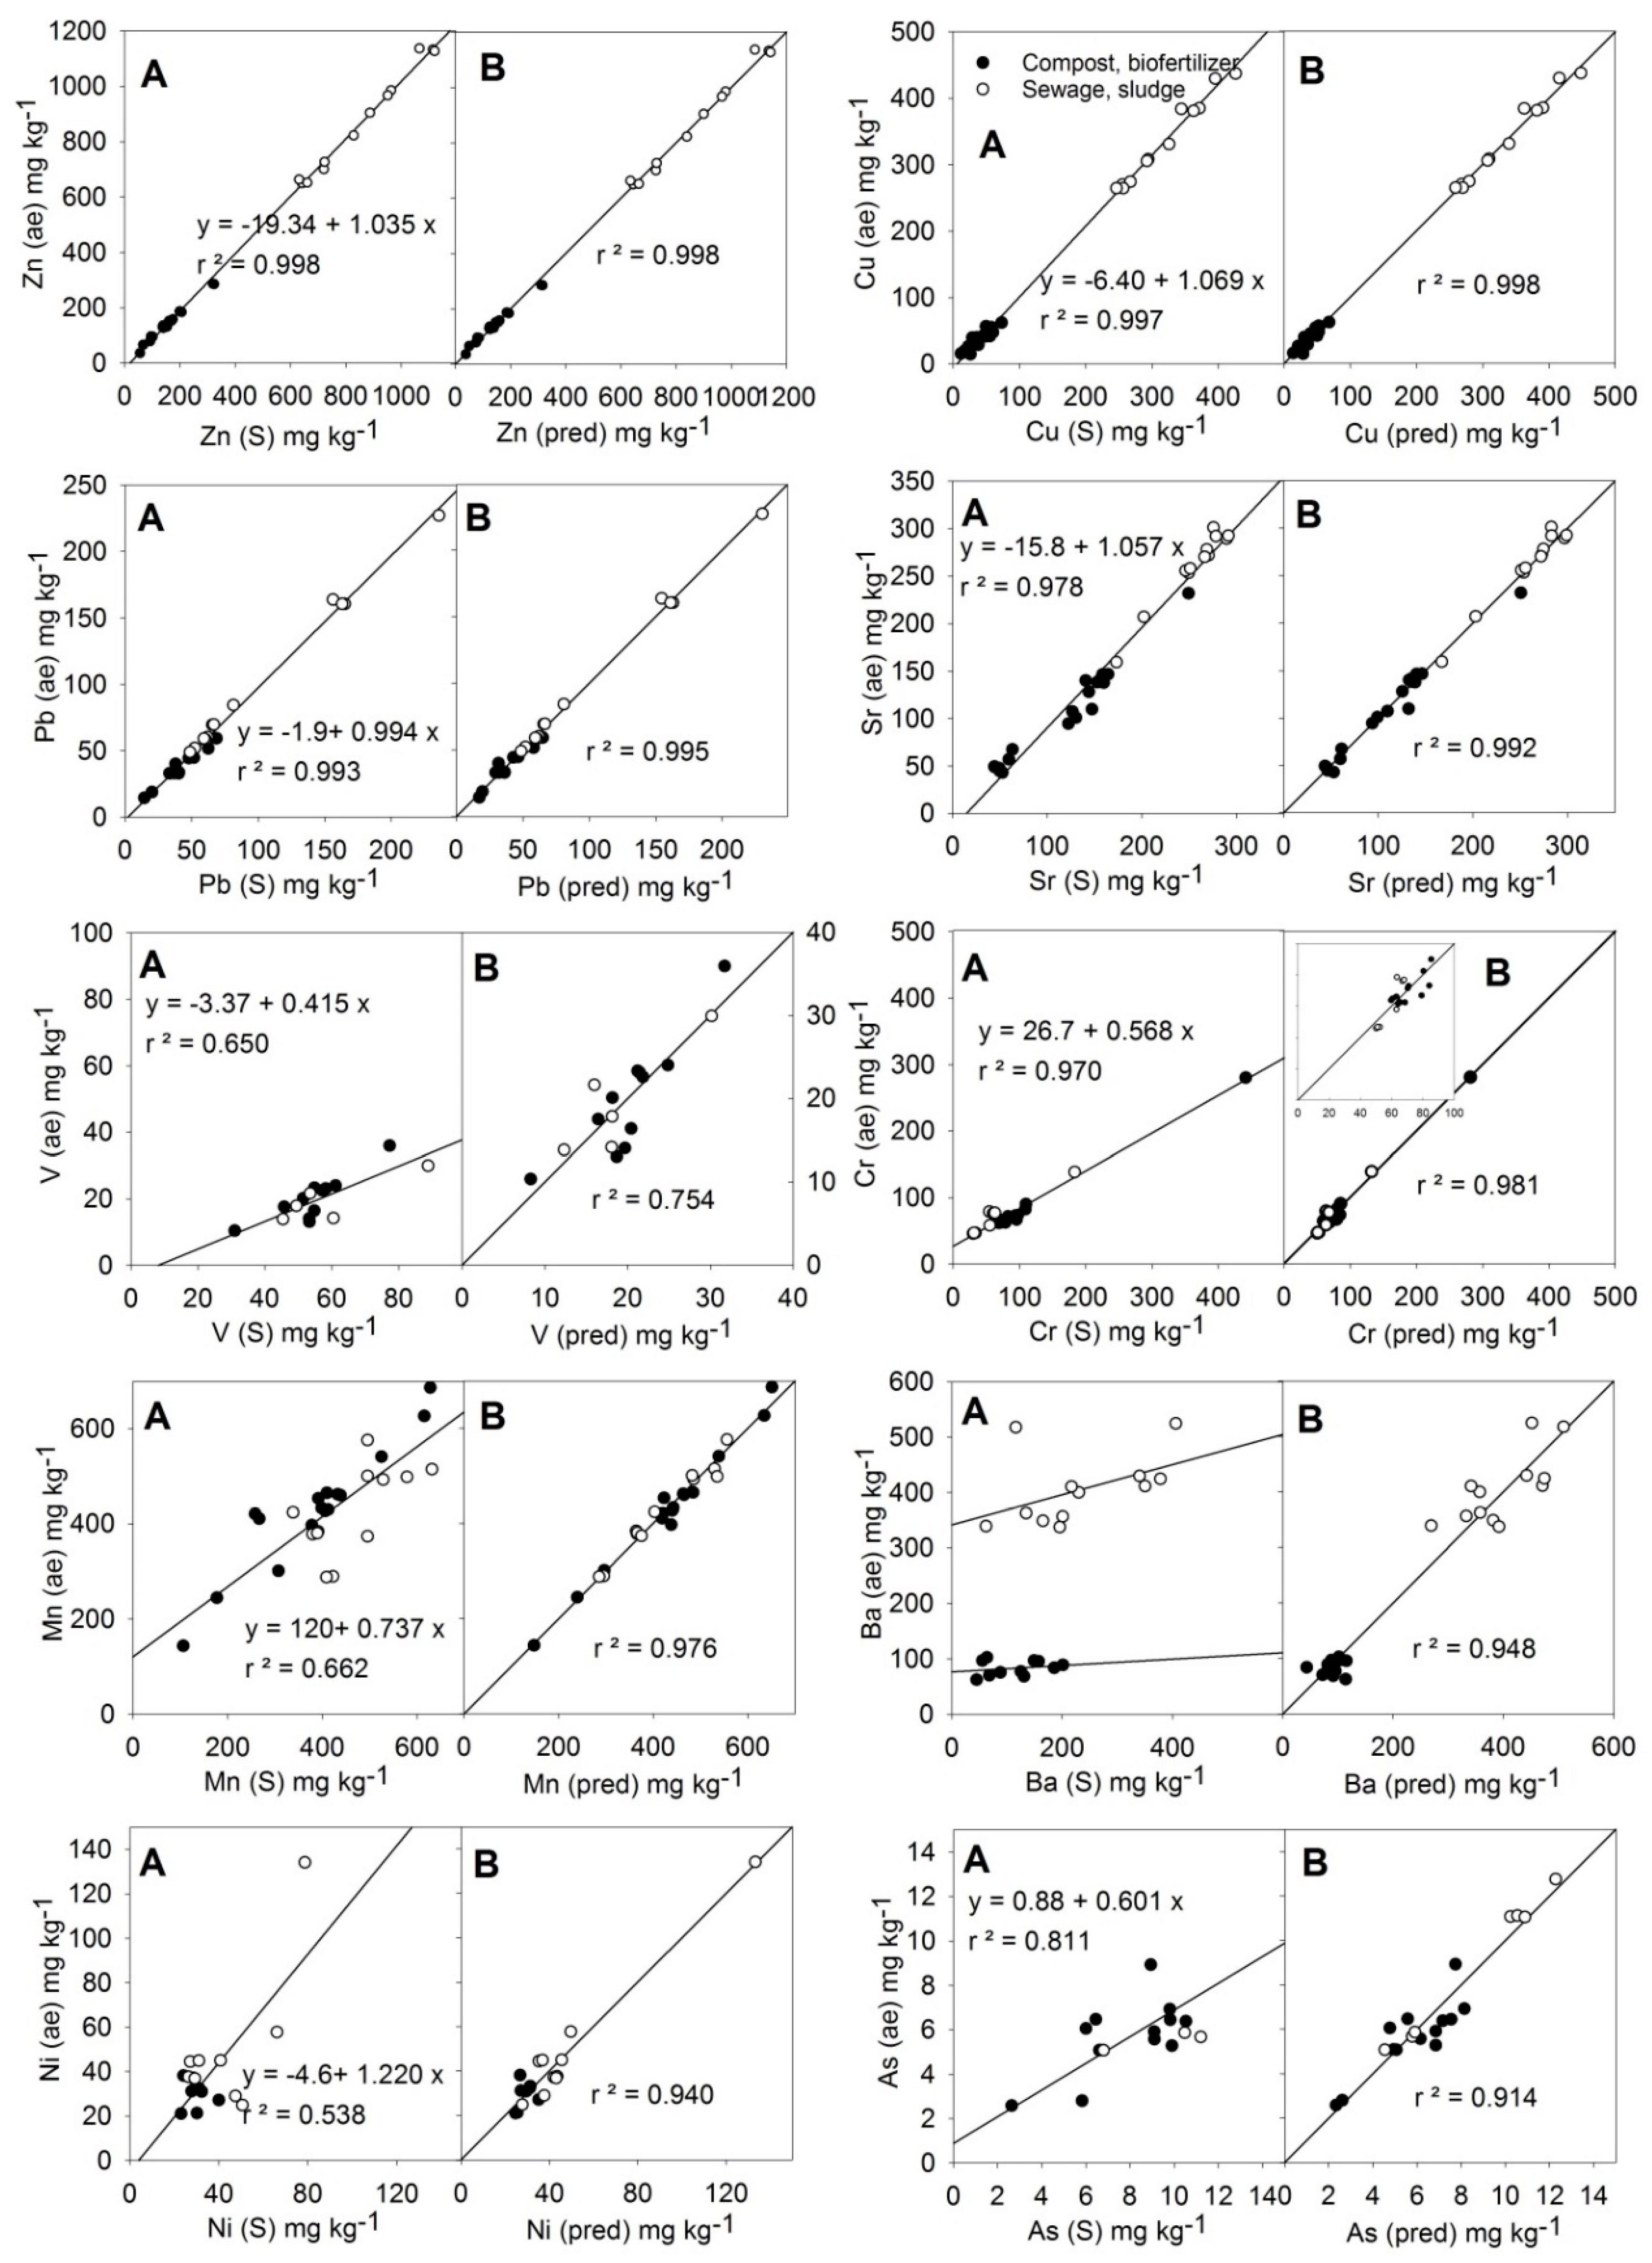
The relationships between the average values of the MARSEP program (X (ae), vertical axis in each plot) and the values measured by the S method of PXRF (X (S), left horizontal axis in each plot) or the calculated values from the best equations found (X (pred), right horizontal axis in each plot) for the trace elements Zn, Cu, Pb, Sr, Cr, Mn, Ni, Ba, As, and V are shown in
Figure 3. The obtained chemical linear equation for each element is shown in
Table 6, and the result of the
t-test among actual and predicted
aqua regia-extractable contents is shown in
Table 5.
As can be seen in
Figure 3, in the case of the metals Zn, Cu, Pb, and Sr, the PXRF instrument’s direct readings quantitatively reproduced the acid-extractable contents, with
r > 0.98 (or
r2 > 0.96) except
r = 0.978 for Sr. Only minor adjustments of the y-intercept were necessary for Zn, Cu, and Sr. No other element contents improved the Zn adjustment after the correction of the y-intercept (–19.3). Equation (10) (
Table 6) yielded predicted results equivalent to the actual contents (results of
t-test,
Table 5).
For Cu, Pb, and Sr, the introduction into the corresponding equations of a correction term, including the measurement of Si (M) (Equations (11)–(13), respectively,
Table 6), was significant. In the case of Cu and Pb the improvement of the coefficient of determination (
r2) was small because r
2 was already close to 1 only with the single regression adjustment (
Figure 3), but in the case of Sr, the adjustment (
r2) improved appreciably. The
t-test results (
Table 5) and the
r values > 0.98 (
Table 6) indicated that the elements Zn, Cu, Pb, and Sr can be quantified using the given equations.
For the elements V, Cr, Mn, Ba, Ni, and As, the values measured by the S method of PXRF (X(S) did not correspond to the contents given by the MARSEP program (X (ae) (
Figure 3). In the case of V, Cr, and As, the PXRF readings were greater than the MARSEP values (slope < 1). In the case of Mn and Ni, dispersion in the results was observed. In the case of Ba, compost samples and sewage sludge samples behaved differently.
Fitting Equations (14), (15), and (17) for V, Cr, and Ba, respectively, included a correction term based on Si (M) content. As was observed in relation to the majority elements, the influence of Si content probably indicated the presence of silicates and clays from soil particles in the compost and sewage samples. Vanadium could be incorporated in the mineral structures of clays, Cr occurs in soils mainly in the immobile residual fraction, and Ba may be present in some silicate mineral as impurities [
36]. The fitting for V (0.7 <
r = 0.868 < 0.9) and the t-test (
Table 5) qualified the quality of the predicted data was sufficient for it to be considered as screening level data. The r for Cr (
Table 6) indicated its quantification was feasible using Equation (15). Equation (17) for Ba also included a significant Al (M) term, which likely is related to aluminosilicates. In the case of Ba, r did not reach the quality criteria for quantification (
r = 0.973 < 0.98), but the data were grouped into a single set and the level of the data quality was definitive (
r > 0.9).
The relationship among Mn (ae) results and Mn (S) readings (
Figure 2) was inadequate to allow the quantitative determination of this metal by the PXRF instrument, despite the contents of this metal being relatively high (106–631 mg·kg
−1,
Table 1). Equation (16) for Mn required several terms based on Fe (M) content, Bal (i.e., organic matter content), Ca (M), and Zr (S), which were all significant (
Table 6). Manganese is a member of the iron family and both elements are closely associated with geochemical processes, and Mn oxides (as well as Fe oxides) are considered to be the most abundant compounds of the Earth’s surface, which could explain why several correction factors were required [
36]. The adjustment for Mn improved very notably with Equation (16), with the prediction of quantitative quality.
Similar to the case of Mn, the relationship among the Ni (ae) results and Ni (S) readings was poor (
r2 = 0.538,
Figure 3). The equation for Ni (Equation (18),
Table 6) included the corresponding reading of the S method, and two significant terms based on Bal (organic matter) and Al (M) readings. Although the quality of predicted Ni contents should be considered definitive (
r = 0.970,
Table 6), there was a lack of dots in the range of intermediate contents (60–120 kg·kg
−1) and additional samples will be needed to obtain a better chemical regression equation.
Equation (19) for As (
Table 6) included a Ca (M) term, and allowed us to obtain definitive data (r = 0.921 > 0.9) for this element despite its low concentrations (average As (S) = 9.8 mg·kg
−1,
Table 1). The guideline detection limit given by the manufacturer for this element is 10 mg·kg
−1 [
37], so many of the readings obtained only slightly exceeded this limit.
3.5. Practical Implications of this Study
The results of this study clearly indicate that rapid and accurate analysis of organic amendments using XRF instruments is possible. Considering that these types of analysis are high in cost, time consuming, and use disposable laboratory ware and potentially hazardous reagents used in the conventional laboratory methods for the characterization (nutrients, trace elements, and organic matter content), the proposed alternative would be not only viable but also recommended. Above all, the XRF analytical approach proposed would be very useful for quality control tasks in waste treatment facilities (composting plants, sewage treatment plants), organic fertilizer factories, nursery growing media, and for field control in small farms scale, i.e., urban agriculture or experimental or research trials. In these situations, we believe that the XRF technique represents a valuable decision support tool aimed at the proper management of farms/factories.
The calibration equations obtained in this study were obtained with well characterised set of samples from composts, manure, sewage sludge, and biofertilizers from four countries in Central Europe. The applicability of the equations should be checked with other types of organic samples. Continuous and local or regional calibrations are also recommended to reinforce and generalize the relationships found or to find specifically-fitted ones. Interlaboratory trials are also desirable in order to adapt and improve the resolution of the technique for specific organic matrices and the cross-check of equipment from different brands and suppliers.
The XRF equipment used did not reach an adequate detection limit for elements such as Cd and Hg that are of interest in organic amendments. It would be necessary to look for calibrations to infer the contents of these elements. Such calibrations could be specific in terms of geographical area or sample type. It would also be useful to find calibrations allowing to infer other relevant properties for the characterization of amendments or organic fertilizers, such as electrical conductivity, as has been already done in soils [
39]. Future work is also envisaged to investigate the potential combination of data from XRF with that obtained using other techniques like near- and mid-infrared spectroscopy that may provide complementary information to infer other variables relative to the composition or particular properties of organic amendments.

 ,
, 

