Relationship between Secondhand Smoke Exposure and Depressive Symptoms: A Systematic Review and Dose–Response Meta-Analysis


Abstract
:1. Introduction
2. Method
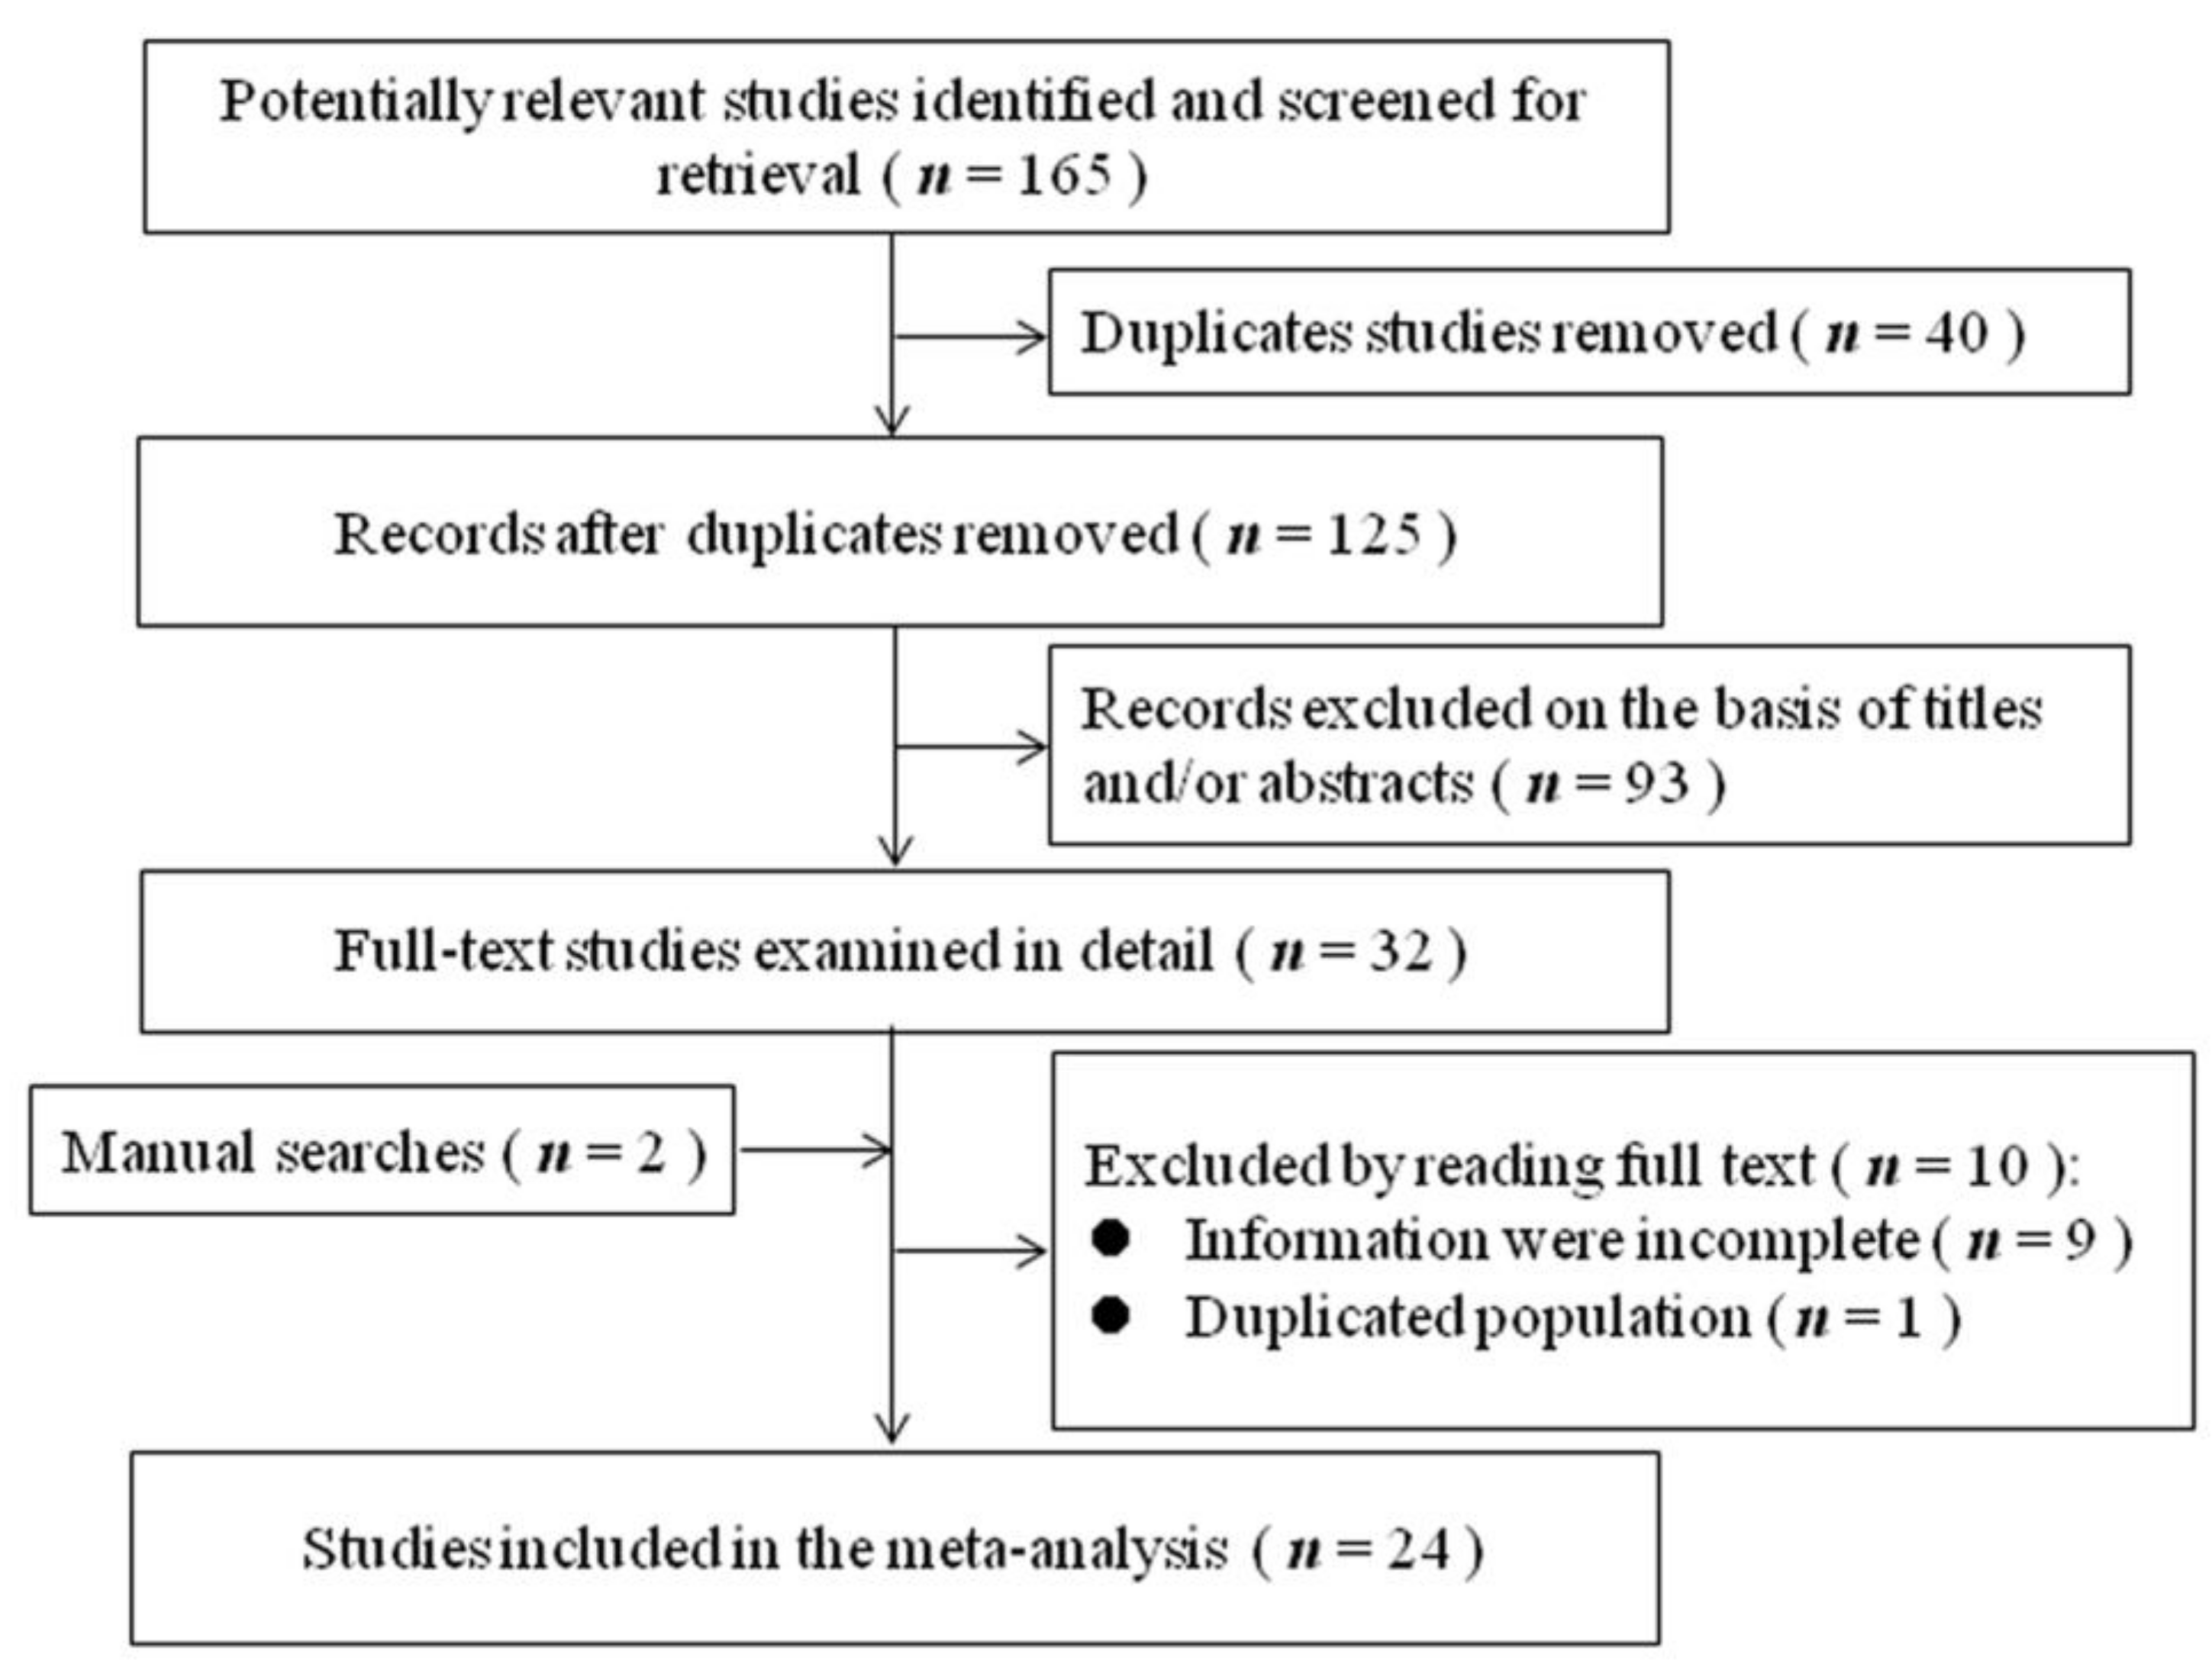
2.1. Search Strategy
2.2. Inclusion and Exclusion Criteria
2.3. Data Extraction
2.4. Study Variables
2.5. Quality Assessment
2.6. Statistical Analysis
3. Results
3.1. Characteristics of Studies
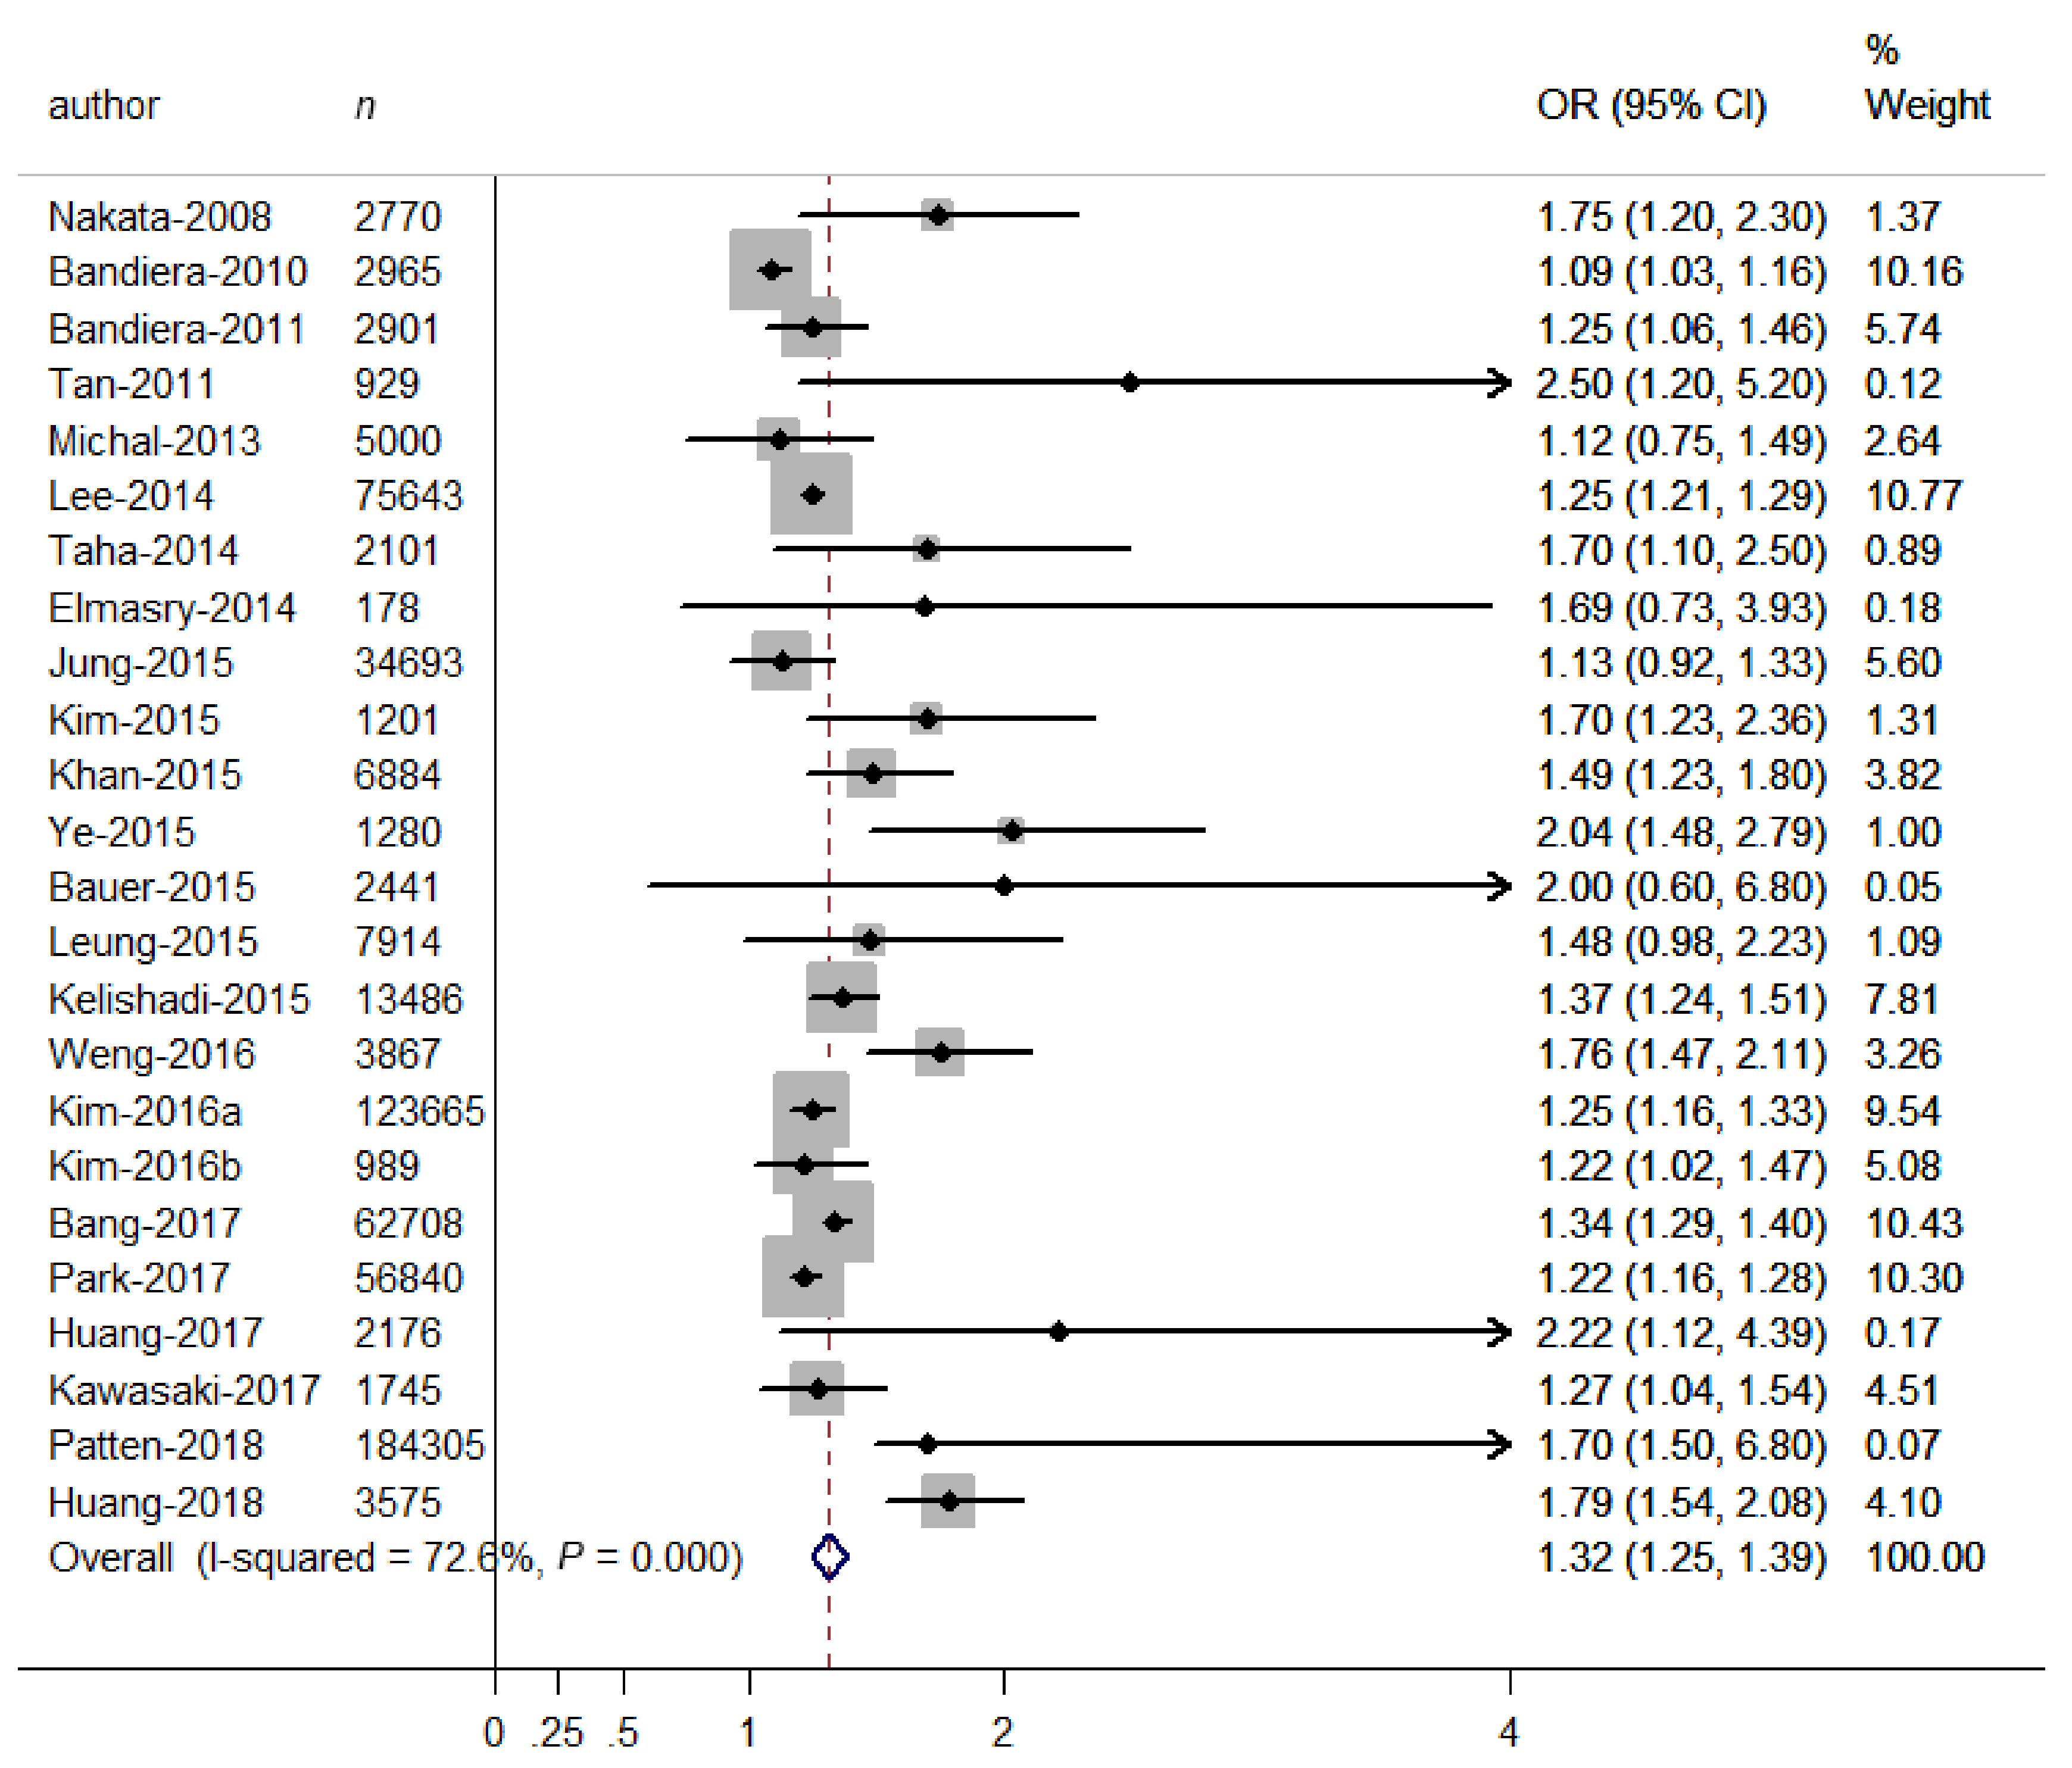
3.2. Relationship between Binary SHS Exposure and Depressive Symptoms
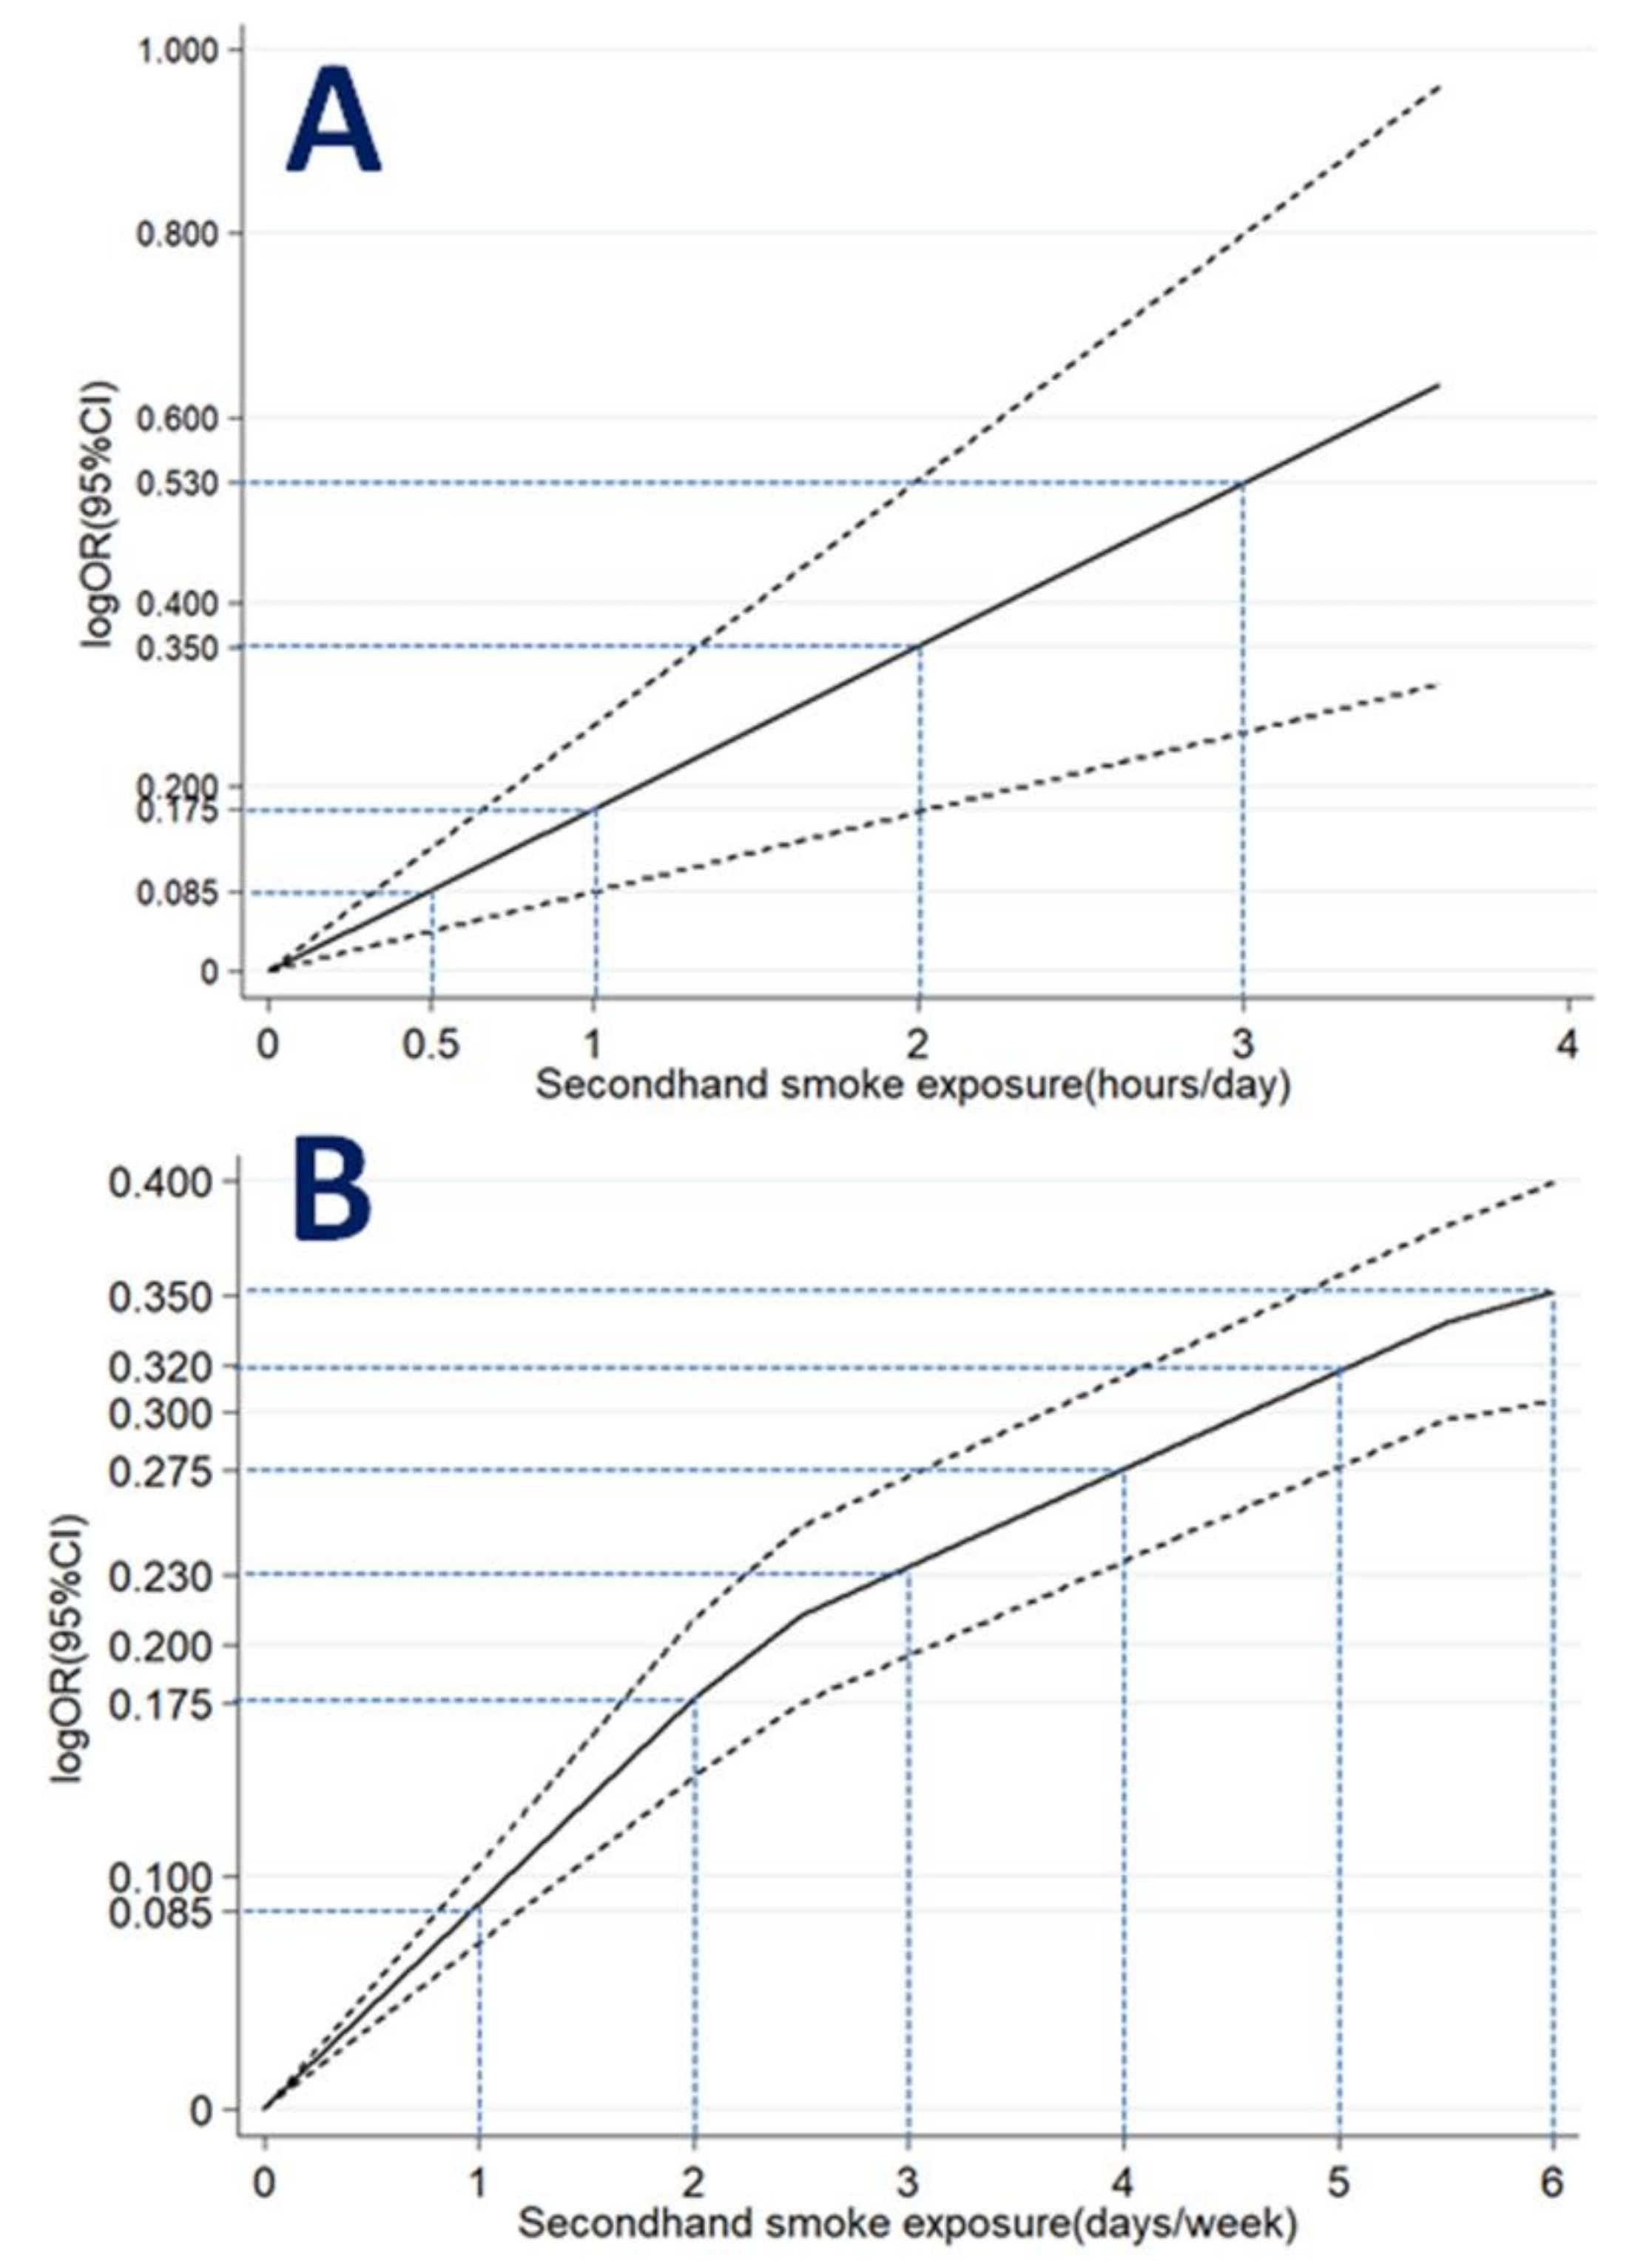
3.3. Relationship between SHS Exposure Expressed as a Continuous Variable and Depressive Symptoms
3.4. Relationship between SHS Exposure Expressed as Ordinal Variables and Depressive Symptoms
4. Discussion
5. Conclusions
Author Contributions
Funding
Conflicts of Interest
References
- Lim, S.S.; Vos, T.; Flaxman, A.D.; Danaei, G.; Shibuya, K.; Adair-Rohani, H.; Amann, M.; Anderson, H.R.; Andews, K.G.; Aryee, M.; et al. A comparative risk assessment of burden of disease and injury attributable to 67 risk factors and risk factor clusters in 21 regions, 1990–2010: A systematic analysis for the Global Burden of Disease Study 2010. Lancet 2012, 380, 2224–2260. [Google Scholar] [CrossRef]
- Edwards, A.C.; Maes, H.H.; Pedersen, N.L.; Kendler, K.S. A population-based twin study of the genetic and environmental relationship of major depression, regular tobacco use and nicotine dependence. Psychol. Med. 2011, 41, 395–405. [Google Scholar] [CrossRef] [PubMed]
- Bertrand, D. The possible contribution of neuronal nicotinic acetylcholine receptors in depression. Dialogues Clin. Neurosci. 2005, 7, 207–216. [Google Scholar]
- Torres, S.; Merino, C.; Paton, B.; Correig, X.; Ramirez, N. Biomarkers of Exposure to Secondhand and Thirdhand Tobacco Smoke: Recent Advances and Future Perspectives. Int. J. Environ. Res. Public Health 2018, 15, 2693. [Google Scholar] [CrossRef]
- Makadia, L.D.; Roper, P.J.; Andrews, J.O.; Tingen, M.S. Tobacco Use and Smoke Exposure in Children: New Trends, Harm, and Strategies to Improve Health Outcomes. Curr. Allergy Rep. 2017, 17, 55. [Google Scholar] [CrossRef] [PubMed]
- Oberg, M.; Jaakkola, M.S.; Woodward, A.; Peruga, A.; Prüss-Ustün, A. Worldwide burden of disease from exposure to second-hand smoke: A retrospective analysis of data from 192 countries. Lancet 2011, 377, 139–146. [Google Scholar] [CrossRef]
- Ye, X.; Li, L.; Gao, Y.; Zhou, S. Dose-response relations between second-hand smoke exposure and depressive symptoms among middle-aged women. Psychiatry Res. 2015, 229, 533–538. [Google Scholar] [CrossRef] [PubMed]
- Huang, J.; Wen, G.; Yang, W.; Yao, Z.; Wu, C.; Ye, X. The association between second-hand smoke exposure and depressive symptoms among pregnant women. Psychiatry Res. 2017, 256, 469–474. [Google Scholar] [CrossRef] [PubMed]
- Bauer, N.S.; Anand, V.; Carroll, A.E.; Downs, S.M. Secondhand smoke exposure, parental depressive symptoms and preschool behavioral outcomes. J. Pediatr. Nurs. 2015, 30, 227–235. [Google Scholar] [CrossRef] [PubMed]
- Michal, M.; Wiltink, J.; Reiner, I.; Kirschner, Y.; Wild, P.S.; Schulz, A.; Zwiener, I.; Blettner, M.; Beutel, M.E. Association of mental distress with smoking status in the community: Results from the Gutenberg Health Study. J. Affect. Disord. 2013, 146, 355–360. [Google Scholar] [CrossRef]
- Zeng, Y.N.; Li, Y.M. Secondhand smoke exposure and mental health in adults: A meta-analysis of cross-sectional studies. Soc. Psychiatry Psychiatr. Epidemiol. 2016, 51, 1339–1348. [Google Scholar] [CrossRef] [PubMed]
- Moher, D.; Liberati, A.; Tetzlaff, J.; Altman, D.G. Preferred reporting items for systematic reviews and meta-analyses: The PRISMA statement. J. Clin. Epidemiol. 2009, 62, 1006–1012. [Google Scholar] [CrossRef] [PubMed]
- Hu, J.; Dong, Y.; Chen, X.; Liu, Y.; Ma, D.; Liu, X.; Zheng, R.; Mao, X.; Chen, T.; He, W. Prevalence of suicide attempts among Chinese adolescents: A meta-analysis of cross-sectional studies. Compr. Psychiatry 2015, 61, 78–89. [Google Scholar] [CrossRef] [PubMed]
- Mantel, N.; Haenszel, W. Statistical aspects of the analysis of data from retrospective studies of disease. J. Natl. Cancer Inst. 1959, 22, 719–748. [Google Scholar] [PubMed]
- DerSimonian, R.; Laird, N. Meta-analysis in clinical trials. Control. Clin. Trials 1986, 7, 177–188. [Google Scholar] [CrossRef]
- Higgins, J.P.; Thompson, S.G. Quantifying heterogeneity in a meta-analysis. Stat. Med. 2002, 21, 1539–1558. [Google Scholar] [CrossRef]
- Begg, C.B.; Mazumdar, M. Operating characteristics of a rank correlation test for publication bias. Biometrics 1994, 50, 1088–1101. [Google Scholar] [CrossRef]
- Orsini, N.; Bellocco, R.; Greenland, S. Generalized Least Squares for Trend Estimation of Summarized Dose-Response Data. Stata J. 2006, 6, 40–57. [Google Scholar] [CrossRef]
- Ye, X.; Fu, J.; Yang, Y.; Chen, S. Dose-risk and duration-risk relationships between aspirin and colorectal cancer: A meta-analysis of published cohort studies. PLoS ONE 2013, 8, e57578. [Google Scholar] [CrossRef]
- Bandiera, F.C.; Arheart, K.L.; Caban-Martinez, A.J.; Fleming, L.E.; McCollister, K.; Dietz, N.A.; Leblanc, W.G.; Davila, E.P.; Lewis, J.E.; Serdar, B.; et al. Secondhand smoke exposure and depressive symptoms. Psychosom. Med. 2010, 72, 68–72. [Google Scholar] [CrossRef]
- Bandiera, F.C.; Kalaydjian Richardson, A.; Lee, D.J.; He, J.-P.; Merikangas, K.R. Secondhand smoke exposure and mental health among children and adolescents. Arch. Pediatr. Adolesc. Med. 2011, 165, 332–338. [Google Scholar] [CrossRef] [PubMed]
- Bang, I.; Jeong, Y.J.; Park, Y.Y.; Moon, N.-Y.; Lee, J.; Jeon, T.-H. Secondhand smoking is associated with poor mental health in Korean adolescents. Tohoku J. Exp. Med. 2017, 242, 317–326. [Google Scholar] [CrossRef]
- Elmasry, H.; Goodwin, R.D.; Terry, M.B.; Tehranifar, P. Early life exposure to cigarette smoke and depressive symptoms among women in midlife. Nicotine Tob. Res. Off. J. Soc. Res. Nicotine Tob. 2014, 16, 1298–1306. [Google Scholar] [CrossRef] [PubMed]
- Huang, J.; Xu, B.; Guo, D.; Jiang, T.; Huang, W.; Liu, G.; Ye, X. Dose–response relationships between second-hand smoke exposure and depressive symptoms among adolescents in Guangzhou, China. Int. J. Environ. Res. Public Health 2018, 15, 985. [Google Scholar] [CrossRef] [PubMed]
- Jung, S.J.; Shin, A.; Kang, D. Active smoking and exposure to secondhand smoke and their relationship to depressive symptoms in the Korea national health and nutrition examination survey (KNHANES). BMC Public Health 2015, 15, 1053. [Google Scholar] [CrossRef] [PubMed]
- Kawasaki, Y.; Miyake, Y.; Tanaka, K.; Furukawa, S.; Arakawa, M. Smoking and secondhand smoke exposure and prevalence of depressive symptoms during pregnancy in Japan: Baseline data from the Kyushu Okinawa Maternal and Child Health Study. Tob. Induc. Dis. 2017, 15. [Google Scholar] [CrossRef] [PubMed]
- Kelishadi, R.; Babaki, A.E.; Qorbani, M.; Ahadi, Z.; Heshmat, R.; Motlagh, M.E.; Ardalan, G.; Ataie-Jafari, A.; Asayesh, H.; Mohammadi, R. Joint association of active and passive smoking with psychiatric distress and violence behaviors in a representative sample of Iranian children and adolescents: The CASPIAN-IV study. Int. J. Behav. Med. 2015, 22, 652–661. [Google Scholar] [CrossRef] [PubMed]
- Khan, S.; Arif, A.A.; Laditka, J.N.; Racine, E.F. Prenatal exposure to secondhand smoke may increase the risk of postpartum depressive symptoms. J. Public Health (Oxf. Engl.) 2015, 37, 406–411. [Google Scholar] [CrossRef]
- Kim, N.H.; Choi, H.; Kim, N.R.; Shim, J.S.; Kim, H.C. Secondhand smoke exposure and mental health problems in Korean adults. Epidemiol. Health 2016, 38, e2016009. [Google Scholar] [CrossRef] [PubMed]
- Kim, N.H.; Kim, H.C.; Lee, J.Y.; Lee, J.-M.; Suh, I. Association between environmental tobacco smoke and depression among Korean women. BMJ Open 2015, 5, e007131. [Google Scholar] [CrossRef]
- Kim, N.H.; Park, J.H.; Choi, D.P.; Lee, J.Y.; Kim, H.C. Secondhand smoke exposure and depressive symptoms among Korean adolescents: JS high school study. PLoS ONE 2016, 11. [Google Scholar] [CrossRef]
- Lee, K.J. Current smoking and secondhand smoke exposure and depression among Korean adolescents: Analysis of a national cross-sectional survey. BMJ Open 2014, 4, e003734. [Google Scholar] [CrossRef]
- Leung, C.Y.; Leung, G.M.; Schooling, C.M. Early second-hand smoke exposure and child and adolescent mental health: Evidence from Hong Kong’s ‘Children of 1997’ birth cohort. Addiction 2015, 110, 1811–1824. [Google Scholar] [CrossRef] [PubMed]
- Nakata, A.; Takahashi, M.; Ikeda, T.; Hojou, M.; Nigam, J.A.; Swanson, N.G. Active and passive smoking and depression among Japanese workers. Prev. Med. 2008, 46, 451–456. [Google Scholar] [CrossRef] [PubMed]
- Park, S. Associations between household secondhand smoke exposure and health problems among non-smoking adolescents in the Republic of Korea. J. Prim. Prev. 2017, 38, 385–402. [Google Scholar] [CrossRef]
- Patten, S.B.; Williams, J.V.A.; Lavorato, D.H.; Woolf, B.; Wang, J.L.; Bulloch, A.G.; Sajobi, T. Major depression and secondhand smoke exposure. J. Affect. Disord. 2018, 225, 260–264. [Google Scholar] [CrossRef] [PubMed]
- Taha, F.; Goodwin, R.D. Secondhand smoke exposure across the life course and the risk of adult-onset depression and anxiety disorder. J. Affect. Disord. 2014, 168, 367–372. [Google Scholar] [CrossRef] [PubMed]
- Tan, S.; Courtney, L.P.; El-Mohandes, A.A.; Gantz, M.G.; Blake, S.M.; Thornberry, J.; El-Khorazaty, M.N.; Perry, D.; Kiely, M. Relationships between self-reported smoking, household environmental tobacco smoke exposure and depressive symptoms in a pregnant minority population. Matern. Child Health J. 2011, 15 (Suppl. 1), S65–S74. [Google Scholar] [CrossRef]
- Weng, S.C.; Huang, J.P.; Huang, Y.-L.; Lee, T.S.-H.; Chen, Y.-H. Effects of tobacco exposure on perinatal suicidal ideation, depression, and anxiety. BMC Public Health 2016, 16, 623. [Google Scholar] [CrossRef]
- Matthey, S.; Henshaw, C.; Elliott, S.; Barnett, B. Variability in use of cut-off scores and formats on the Edinburgh Postnatal Depression Scale: Implications for clinical and research practice. Arch. Women’s Ment. Health 2006, 9, 309–315. [Google Scholar] [CrossRef]
- Kroenke, K.; Spitzer, R.L.; Williams, J.B. The PHQ-9: Validity of a brief depression severity measure. J. Gen. Intern. Med. 2001, 16, 606–613. [Google Scholar] [CrossRef]
- Radloff, L.S. The CES-D Scale: A self-report depression scale for research in the general population. Appl. Psychol. Meas. 1977, 1, 385–401. [Google Scholar] [CrossRef]
- Hammen, C. Stress and depression. Annu. Rev. Clin. Psychol. 2005, 1, 293–319. [Google Scholar] [CrossRef]
- Nakai, Y.; Inoue, T.; Toda, H.; Toyomaki, A.; Nakato, Y.; Nakagawa, S.; Kitaichi, Y.; Kameyama, R.; Hayashishita, Y.; Wakatsuki, Y.; et al. The influence of childhood abuse, adult stressful life events and temperaments on depressive symptoms in the nonclinical general adult population. J. Affect. Disord. 2014, 158, 101–107. [Google Scholar] [CrossRef]
- Bhattacharya, R.; Shen, C.; Sambamoorthi, U. Excess risk of chronic physical conditions associated with depression and anxiety. BMC Psychiatry 2014, 14, 10. [Google Scholar] [CrossRef]
- Petty, F.; Kramer, G.L.; Fulton, M.; Moeller, F.G.; Rush, A.J. Low plasma GABA is a trait-like marker for bipolar illness. Neuropsychopharmacol. Off. Publ. Am. Coll. Neuropsychopharmacol. 1993, 9, 125–132. [Google Scholar] [CrossRef]
- Petty, F. GABA and mood disorders: A brief review and hypothesis. J. Affect. Disord. 1995, 34, 275–281. [Google Scholar] [CrossRef]
- Jefferis, B.J.; Lowe, G.D.; Welsh, P.; Rumley, A.; A Lawlor, D.; Ebrahim, S.; Carson, C.; Doig, M.; Feyerabend, C.; McMeekin, L.; et al. Secondhand smoke (SHS) exposure is associated with circulating markers of inflammation and endothelial function in adult men and women. Atherosclerosis 2010, 208, 550–556. [Google Scholar] [CrossRef]
- Dowlati, Y.; Herrmann, N.; Swardfager, W.; Liu, H.; Sham, L.; Reim, E.K.; Lanctôt, K.L. A meta-analysis of cytokines in major depression. Biol. Psychiatry 2010, 67, 446–457. [Google Scholar] [CrossRef]


| Author | Location | Design | Outcome Diagnosis | SHS Diagnosis | n | OR (95% CI) | Quality Score |
|---|---|---|---|---|---|---|---|
| Nakata-2008 | Asia | CS | scale | BT | 2770 | 1.75 (1.20–2.30) | 6 |
| Bandiera-2010 | USA | CS | scale | BT | 2965 | 1.09 (1.03–1.16) | 6 |
| Bandiera-2011 | USA | CS | scale | BT | 2901 | 1.25 (1.06–1.46) | 7 |
| Tan-2011 | USA | CS | scale | SR | 929 | 2.50 (1.20–5.20) | 6 |
| Michal-2013 | Europe | CS | scale | SR | 5000 | 1.12 (0.75–1.49) | 6 |
| Lee-2014 | Asia | CS | unstructured question | SR | 75,643 | 1.25 (1.21–1.29) | 8 |
| Taha-2014 | USA | CS | scale | SR | 2101 | 1.70 (1.10–2.50) | 8 |
| Elmasry-2014 | USA | cohort | scale | SR | 178 | 1.69 (0.73–3.93) | 6 |
| Jung-2015 | Asia | CS | unstructured question | SR | 34,693 | 1.13 (0.92–1.33) | 7 |
| Kim-2015 | Asia | CS | scale | SR | 1201 | 1.70 (1.23–2.36) | 7 |
| Khan-2015 | USA | CS | unstructured question | SR | 6884 | 1.49 (1.23–1.80) | 6 |
| Ye-2015 | Asia | CS | scale | SR | 1280 | 2.04 (1.48–2.79) | 8 |
| Bauer-2015 | Asia | CS | scale | SR | 2441 | 2.00 (0.60–6.80) | 6 |
| Leung-2015 | Asia | cohort | scale | SR | 7914 | 1.48 (0.98–2.23) | 7 |
| Kelishadi-2015 | Asia | CS | scale | SR | 13,486 | 1.37 (1.24–1.51) | 7 |
| Weng-2016 | Asia | CS | scale | SR | 3867 | 1.76 (1.47–2.11) | 6 |
| Kim-2016a | Asia | CS | unstructured question | SR | 123,665 | 1.25 (1.16–1.33) | 8 |
| Kim-2016b | Asia | CS | scale | SR | 989 | 1.22 (1.02–1.47) | 8 |
| Bang-2017 | Asia | CS | unstructured question | BT | 62,708 | 1.34 (1.29–1.40) | 7 |
| Park-2017 | Asia | CS | unstructured question | SR | 56,840 | 1.22 (1.16–1.28) | 7 |
| Huang-2017 | Asia | CS | scale | SR | 2176 | 2.22 (1.12–4.39) | 8 |
| Kawasaki-2017 | Asia | CS | scale | SR | 1745 | 1.27 (1.04–1.54) | 7 |
| Huang-2018 | Asia | CS | scale | SR | 3575 | 1.79 (1.54–2.08) | 7 |
| Patten-2018 | USA | CS | scale | SR | 184,305 | 1.70 (1.50–6.80) | 7 |
| Subgroups | No. of Studies | OR (95% CI) | Statistical Method | p-Value for Heterogeneity b | |
|---|---|---|---|---|---|
| All studies | 24 | 1.32 (1.25–1.39) | random | ||
| Location | Asia | 16 | 1.33 (1.26–1.40) | random | 0.539 |
| USA | 7 | 1.30 (1.09–1.51) | random | ||
| Europe | 1 | 1.12 (0.75–1.49) | fixed | ||
| Study design | cross-sectional | 22 | 1.32 (1.25–1.39) | random | 0.524 |
| cohort | 2 | 1.51 (0.93–2.09) | fixed | ||
| SHS diagnosis | self-report | 22 | 1.34 (1.27–1.41) | random | <0.001 |
| biological test | 2 | 1.11 (1.04–1.17) | fixed | ||
| Outcome diagnosis | psychological scale | 18 | 1.45 (1.29–1.61) | random | 0.037 |
| unstructured question | 6 | 1.27 (1.21–1.32) | random | ||
| Types of psychological scales | CES-D | 6 | 1.67 (1.35–1.99) | random | <0.001 |
| PHQ-9 | 3 | 1.10 (1.03–1.16) | fixed | ||
| BDI | 3 | 1.30 (1.09–1.51) | fixed | ||
| Others a | 12 | 1.29 (1.24–1.35) | random | ||
| Sample size | >500 | 23 | 1.32 (1.25–1.39) | random | 0.651 |
| ≤500 | 1 | 1.69 (0.73–3.93) | fixed | ||
| Excluding smokers | Yes | 16 | 1.33 (1.23–1.42) | random | 0.183 |
| No | 8 | 1.26 (1.22–1.30) | random | ||
| Age group | adolescent | 9 | 1.31 (1.24–1.38) | random | 0.394 |
| adult | 14 | 1.38 (1.23–1.52) | random | ||
| Sex group | female | 14 | 1.28 (1.20–1.35) | random | 0.370 |
| male | 6 | 1.24 (1.20–1.29) | fixed | ||
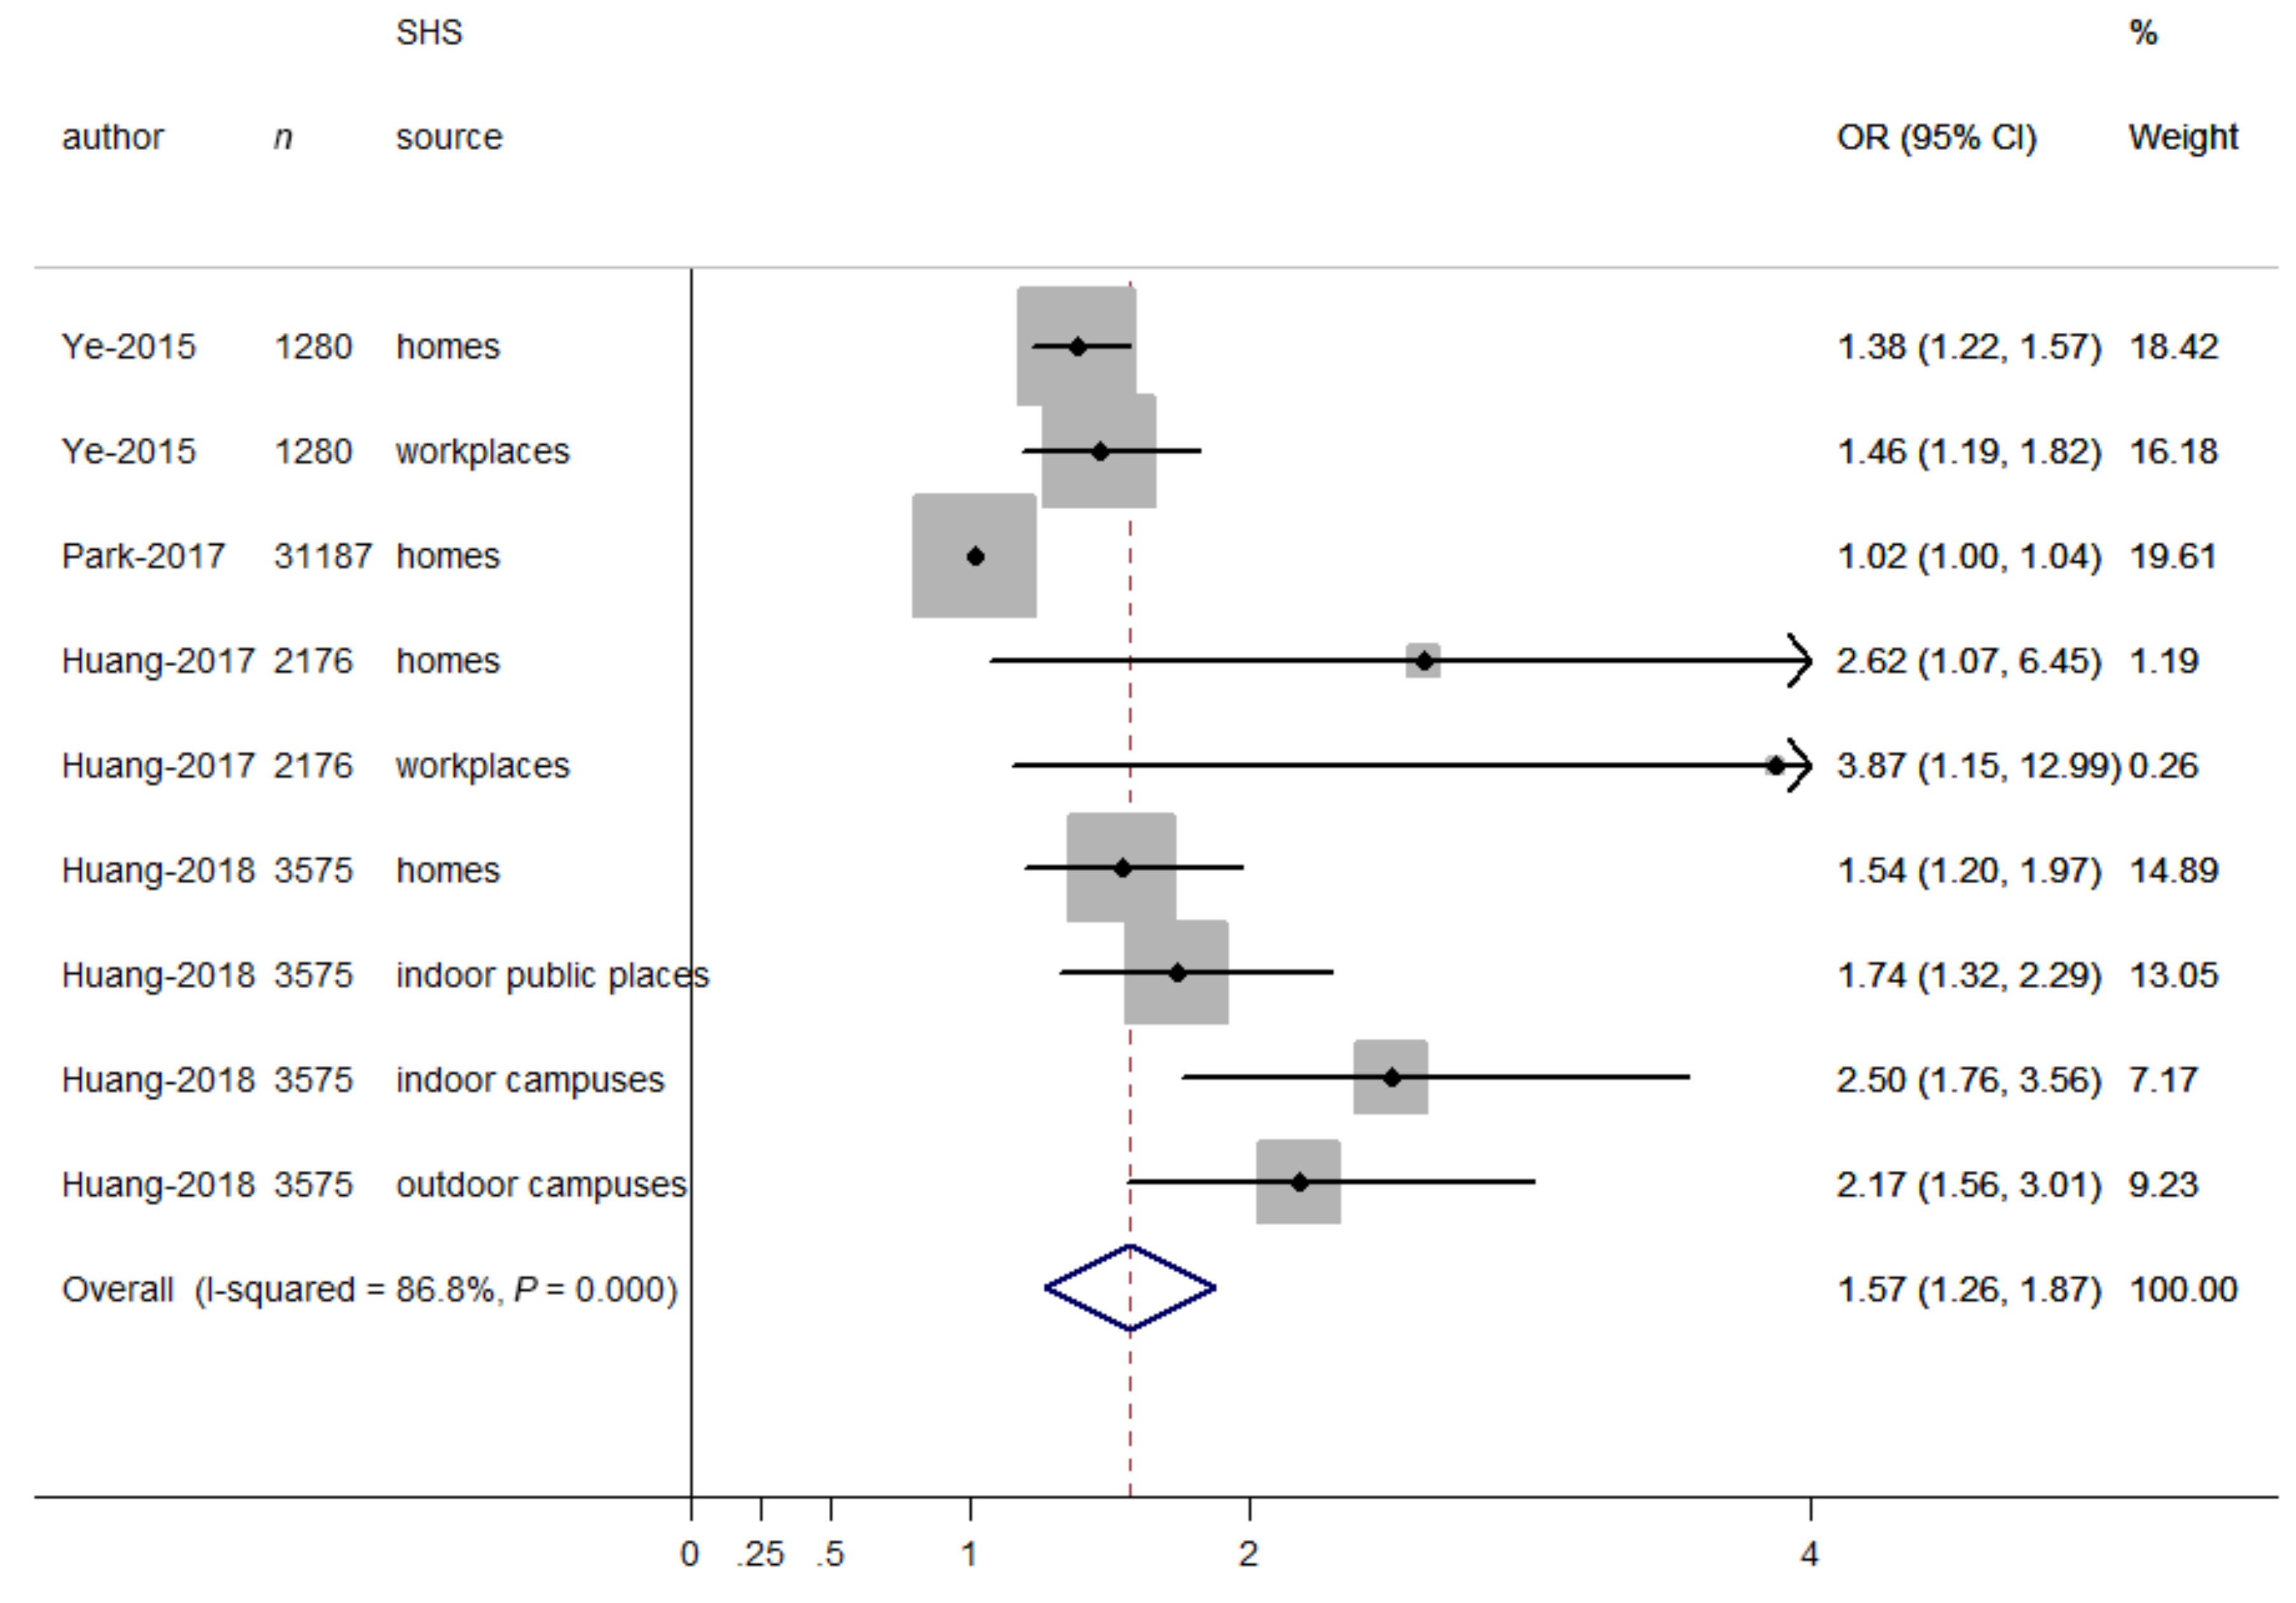
| SHS source | home | 18 | 1.30 (1.24–1.35) | random | 0.426 |
| workplace | 5 | 1.53 (1.03–2.02) | random | ||
| public place | 3 | 1.44 (1.26–1.63) | fixed | ||
| campus | 2 | 1.32 (1.25–1.38) | random | ||
| Adjustment for social support | |||||
| yes | 3 | 1.84 (1.59–2.08) | fixed | <0.001 | |
| no | 21 | 1.28 (1.22–1.34) | random | ||
| Adjustment for negative life events | |||||
| yes | 6 | 1.67 (1.31–2.04) | random | 0.040 | |
| no | 18 | 1.28 (1.21–1.36) | random | ||
| Adjustment for disease history | |||||
| yes | 11 | 1.37 (1.24–1.49) | random | 0.070 | |
| no | 13 | 1.25 (1.22–1.29) | fixed | ||
| Author | SHS Source | SHS Frequency (Hours/Day) | Midpoint Frequency (Hours/Day) a | OR (95% CI) |
|---|---|---|---|---|
| Jung-2015 (male) | workplace | 0 | 0 | 1.00 |
| <1 | 0.5 | 0.92 (0.77–1.09) | ||
| ≥1 | 1.2 | 1.23 (0.97–1.54) | ||
| Jung-2015 (female) | workplace | 0 | 0 | 1.00 |
| <1 | 0.5 | 0.89 (0.76–1.04) | ||
| ≥1 | 1.2 | 1.32 (1.06–1.64) | ||
| Jung-2015 (male) | home | 0 | 0 | 1.00 |
| <1 | 0.5 | 0.90 (0.65–1.23) | ||
| ≥1 | 1.2 | 1.21 (0.69–2.13) | ||
| Jung-2015 (female) | home | 0 | 0 | 1.00 |
| <1 | 0.5 | 1.18 (1.02–1.35) | ||
| ≥1 | 1.2 | 1.71 (1.34–2.18) | ||
| Kim-2016 (male) | home | 0 | 0 | 1.00 |
| <1 | 0.5 | 0.99 (0.66–1.48) | ||
| 1–2.9 | 2.0 | 2.01 (1.04–3.86) | ||
| ≥3 | 3.6 | 1.87 (1.43–2.44) | ||
| Kim-2016 (female) | home | 0 | 0 | 1.00 |
| <1 | 0.5 | 0.98 (0.87–1.11) | ||
| 1–2.9 | 2.0 | 1.37 (1.07–1.75) | ||
| ≥3 | 3.6 | 1.56 (1.42–1.72) |
| Author | SHS Source | SHS Frequency (Days/Week) | Midpoint Frequency (Days/Week) a | OR (95% CI) |
|---|---|---|---|---|
| Lee-2015 | home | 0 | 0 | 1.00 |
| 1–4 | 2.5 | 1.22 (1.17–1.27) | ||
| ≥5 | 6.0 | 1.36 (1.29–1.43) | ||
| Ye-2015 | home | 0 | 0 | 1.00 |
| 1–3 | 2.0 | 2.12 (1.41–3.21) | ||
| 4–7 | 5.5 | 2.53 (1.70–3.78) | ||
| Ye-2015 | workplace | 0 | 0 | 1.00 |
| 1–3 | 2.0 | 2.08 (1.25–3.45) | ||
| 4–7 | 5.5 | 2.58 (1.16–3.73) | ||
| Huang-2017 | home | 0 | 0 | 1.00 |
| 1–3 | 2.0 | 1.73 (0.66–4.49) | ||
| 4–7 | 5.5 | 2.36 (1.09–5.13) | ||
| Huang-2017 | workplace | 0 | 0 | 1.00 |
| 1–3 | 2.0 | 1.42 (0.31–6.54) | ||
| 4–7 | 5.5 | 3.19 (1.17–8.74) | ||
| Huang-2018 | public place | 0 | 0 | 1.00 |
| 1–4 | 2.5 | 1.28 (1.06–1.53) | ||
| 5–7 | 6.0 | 1.66 (1.30–2.10) | ||
| Huang-2018 | home | 0 | 0 | 1.00 |
| 1–4 | 2.5 | 0.98 (0.78–1.24) | ||
| 5–7 | 6.0 | 1.50 (1.22–1.85) | ||
| Huang-2018 | indoor campus | 0 | 0 | 1.00 |
| 1–4 | 2.5 | 1.36 (1.08–1.71) | ||
| 5–7 | 6.0 | 2.13 (1.56–2.91) | ||
| Huang-2018 | outdoor campus | 0 | 0 | 1.00 |
| 1–4 | 2.5 | 1.37 (1.11–1.68) | ||
| 5–7 | 6.0 | 1.83 (1.38–2.44) |
© 2019 by the authors. Licensee MDPI, Basel, Switzerland. This article is an open access article distributed under the terms and conditions of the Creative Commons Attribution (CC BY) license (http://creativecommons.org/licenses/by/4.0/).
Share and Cite
Han, C.; Liu, Y.; Gong, X.; Ye, X.; Zhou, J. Relationship between Secondhand Smoke Exposure and Depressive Symptoms: A Systematic Review and Dose–Response Meta-Analysis. Int. J. Environ. Res. Public Health 2019, 16, 1356. https://doi.org/10.3390/ijerph16081356
Han C, Liu Y, Gong X, Ye X, Zhou J. Relationship between Secondhand Smoke Exposure and Depressive Symptoms: A Systematic Review and Dose–Response Meta-Analysis. International Journal of Environmental Research and Public Health. 2019; 16(8):1356. https://doi.org/10.3390/ijerph16081356
Chicago/Turabian StyleHan, Changlin, Yangqun Liu, Xiao Gong, Xiaohua Ye, and Junli Zhou. 2019. "Relationship between Secondhand Smoke Exposure and Depressive Symptoms: A Systematic Review and Dose–Response Meta-Analysis" International Journal of Environmental Research and Public Health 16, no. 8: 1356. https://doi.org/10.3390/ijerph16081356
APA StyleHan, C., Liu, Y., Gong, X., Ye, X., & Zhou, J. (2019). Relationship between Secondhand Smoke Exposure and Depressive Symptoms: A Systematic Review and Dose–Response Meta-Analysis. International Journal of Environmental Research and Public Health, 16(8), 1356. https://doi.org/10.3390/ijerph16081356