Review

Remote Sensing-Driven Climatic/Environmental Variables for Modelling Malaria Transmission in Sub-Saharan Africa

by
Osadolor Ebhuoma
* and
Michael Gebreslasie
School of Agricultural, Earth and Environmental Sciences, University of KwaZulu-Natal, Westville Campus, Durban 4000, South Africa
*
Author to whom correspondence should be addressed.
Int. J. Environ. Res. Public Health 2016, 13(6), 584; https://doi.org/10.3390/ijerph13060584
Submission received: 8 April 2016 / Revised: 2 June 2016 / Accepted: 8 June 2016 / Published: 14 June 2016

Abstract

:
Malaria is a serious public health threat in Sub-Saharan Africa (SSA), and its transmission risk varies geographically. Modelling its geographic characteristics is essential for identifying the spatial and temporal risk of malaria transmission. Remote sensing (RS) has been serving as an important tool in providing and assessing a variety of potential climatic/environmental malaria transmission variables in diverse areas. This review focuses on the utilization of RS-driven climatic/environmental variables in determining malaria transmission in SSA. A systematic search on Google Scholar and the Institute for Scientific Information (ISI) Web of KnowledgeSM databases (PubMed, Web of Science and ScienceDirect) was carried out. We identified thirty-five peer-reviewed articles that studied the relationship between remotely-sensed climatic variable(s) and malaria epidemiological data in the SSA sub-regions. The relationship between malaria disease and different climatic/environmental proxies was examined using different statistical methods. Across the SSA sub-region, the normalized difference vegetation index (NDVI) derived from either the National Oceanic and Atmospheric Administration (NOAA) Advanced Very High Resolution Radiometer (AVHRR) or Moderate-resolution Imaging Spectrometer (MODIS) satellite sensors was most frequently returned as a statistically-significant variable to model both spatial and temporal malaria transmission. Furthermore, generalized linear models (linear regression, logistic regression and Poisson regression) were the most frequently-employed methods of statistical analysis in determining malaria transmission predictors in East, Southern and West Africa. By contrast, multivariate analysis was used in Central Africa. We stress that the utilization of RS in determining reliable malaria transmission predictors and climatic/environmental monitoring variables would require a tailored approach that will have cognizance of the geographical/climatic setting, the stage of malaria elimination continuum, the characteristics of the RS variables and the analytical approach, which in turn, would support the channeling of intervention resources sustainably.

1. Introduction

Malaria remains the number one killer of all infectious diseases in Sub-Saharan Africa (SSA) [1]. In 2013, an estimated 198 million malaria cases and 584,000 malaria deaths were recorded. About 90% of the malaria deaths recorded were from the SSA region [2]. Out of all known malaria parasites, viz. Plasmodium falciparum, P. vivax, P. ovale, P. malariae and P. knowlesi [2], P. falciparum is the most prevalent of the human malaria parasites in SSA, while the P. vivax malaria parasite is more common across the Horn of Africa [3]. The spatial and temporal variation of malaria disease is known to be influenced by socio-economic/human, ecological/environmental and climatic factors [4,5]. The climatic variables suggested to possess a direct and indirect influence on malaria transmission are rainfall, temperature, altitude and humidity [6,7,8,9,10,11,12]. Rainfall expands mosquito breeding habitats, which in turn, increases its population densities and risk of malaria transmission [13]. Nevertheless, excessive rainfall is also capable of flushing the breeding sites [14]. The completion of the malaria life cycle is suited to temperatures between 15 °C and 40 °C and between 16 °C and 33 °C for the development and survival of mosquitoes [13,15]. Regarding bite rates and feeding habits, at 17 °C, mosquitoes take a human blood meal every four days, while at 25 °C, they feed on humans every two days [13]. Altitude has an indirect relationship with temperature, and as such, areas above 1500 m in Africa have little or no risk of malaria transmission [16]. Relative humidity above 60% does not substantially affect the longevity of mosquitoes, but relative humidity lower than 10% results in death within hours [17], while malaria parasites develop between 55% and 80% humidity [18]. The aforementioned climatic variables have been shown to be important malaria transmission indicators that can be used to determine and predict the spatial and temporal distribution of the disease. Consequently, this can guide malaria control managers in decision and policy making in distributing cost-effective intervention resources in time and space [19].
There has been a wide interest in the development of reliable malaria risk maps, forecast models or integrated malaria early warning systems based on the combination of historical malaria case data and selected climatic/environmental variables [6,8,9,10,11,12,20] so that intervention resources can be channeled before an epidemic occurs [19]. This further indicates the importance of acquiring and utilizing historic climatic variables to adequately study and understand the role they play in the temporal and spatial heterogeneity of malaria. Historical climatic variables obtained from meteorological stations have proven to be vital in identifying and modelling malaria transmission [21]. However, limited numbers of meteorological stations, which are additionally located far apart, and malfunctioning of meteorological station resources make it challenging to obtain historical and spatially-continuous observations of climatic/environmental variables on a wider geographical scale in SSA [22]. Therefore, the need to search for and acquire alternative, indirect or proxy data from remote sensing (RS) is essential [20,22].
The emergence of RS satellites provided a wide array of environmental variables at different spatial and temporal scales [23,24,25,26,27,28], which then created an avenue to increase our understanding of the association between malaria disease and a variety of environmental/climatic variables [4,29,30]. Detailed assessment, evaluation and understanding of this technology in relation to malaria is needed to adequately harness its potential, which in turn, would enhance spatial risk modelling and identification of reliable malaria transmission predictors. Therefore, the aim of this review is to appraise the utilization and applications of RS technology and to discuss its contribution in enhancing the understanding of malaria transmission dynamics in SSA with a focus on RS-driven climatic/environmental variables. This paper will serve as a framework for health practitioners and researchers aiming to identify relevant climatic/environmental variables that are highly related to malaria in particular localities and regions in SSA.
The paper is organized in the following main sections. Initially, we described how the reviewed articles were searched and retrieved. Secondly, we illustrated the malaria risk stratification of the study region, and thirdly, we summarized studies by region (East, Southern, West and Central Africa) that used RS-derived variables in modelling malaria transmission and risk. Finally, we discussed the relevance and implication of the RS-derived variables peculiar to regions and the possible rationale behind their usage. Furthermore, we suggested ways in which the usage of RS-derived variables can be maximized in determining reliable malaria transmission predictors.

2. Materials and Methods

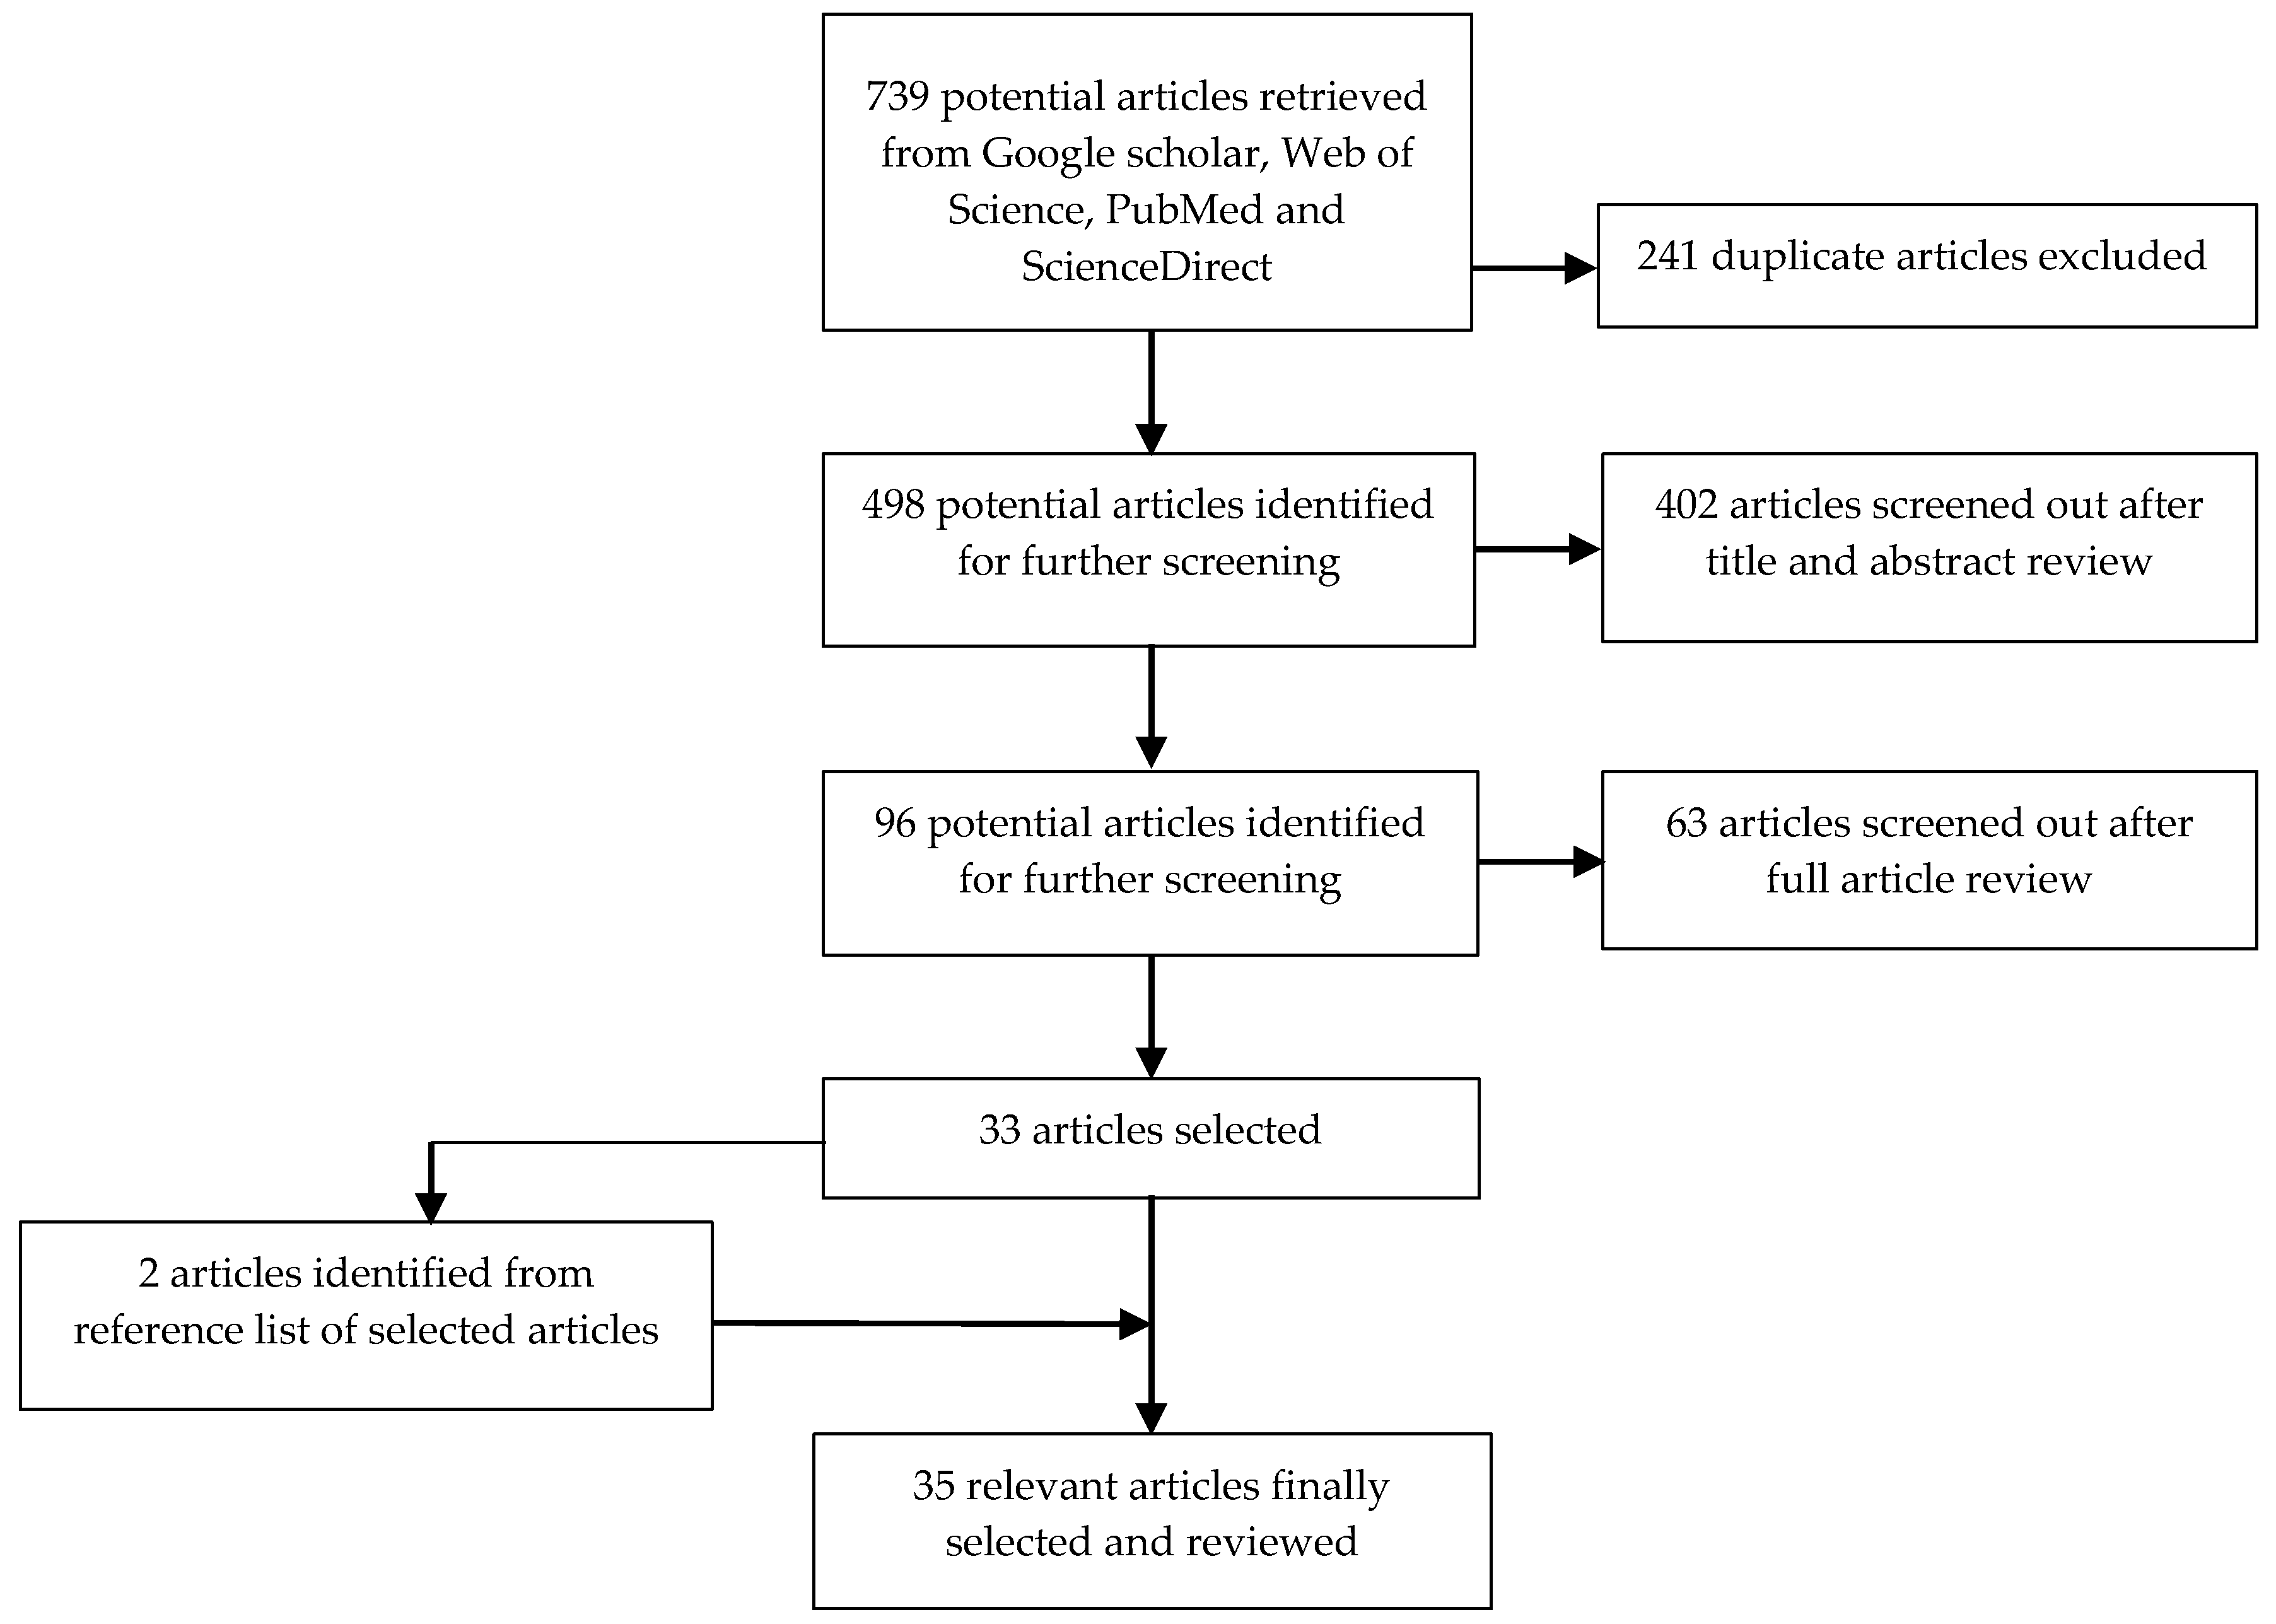
2.1. Search Strategy

A systematic search to retrieve relevant literature and referenced articles began in September 2014, and the final search was conducted in March 2015. The search was aimed at identifying epidemiological studies in SSA that utilized RS-derived climatic/environmental variables in mapping, modeling or forecasting malaria by carrying out a search on Google Scholar and the ISI Web of KnowledgeSM databases: PubMed, Web of Science and ScienceDirect. The database queries were formulated using Boolean operators to combine two or more keywords. The keywords were identified and selected from public and environmental health studies, epidemiological studies and subject headings. The keywords were “remote sensing”, “geographical information system”, “Earth observation”, “spatial techniques”, “geo-spatial analysis”, “geo-spatial techniques”, “malaria”, “forecasting”, “modelling”, “mapping”, “prediction”, “epidemic”, “climate change”, “climatic factors”, “climatic variables”, “environmental proxies”, “temperature”, “rainfall”, “normalized difference vegetation index (NDVI)”, “humidity”, “EL Nino Southern Oscillation”, “West Africa”, “Central Africa”, “East Africa”, “Southern Africa” and “Sub-Saharan Africa”. Titles and abstracts were initially examined to determine their relevance. Thereafter, the full texts were downloaded to ascertain if they met the selection criteria listed below. Finally, the reference list of each relevant article was assessed to identify other relevant article(s). The search strategy, screening and selection processes are illustrated in Figure 1.

2.2. Selection Criteria

The selection criteria involved post hoc inclusion and exclusion criteria suggested by Arksey and O’Malley [31] and Levac et al. [32]. They were developed based on familiarity with the subject matter through reading articles and reviews around malaria epidemiology. The authors discussed and agreed on the study inclusion and exclusion criteria at the beginning of the selection process, and various stages of the conceptual review stages and the selection criteria were refined until the final selection criteria were accepted. This enables us to eliminate studies that were outside the scope of our study aim and ensured consistency.
The articles finally selected were:
  • Original peer-reviewed articles published in English between 1 January 2000 and 31 December 2014. The search period was selected because since 2000, robust appreciation and application of RS in malaria studies occurred, which can be attributed to the easy access of RS data and the emergence of improved remote sensing sensors. Furthermore, this period coincides with the availability of MODIS data [33].
  • Articles that applied RS-derived climatic/environmental variables and/or climatic proxy indicators in evaluating malaria risk, distribution, transmission and mapping.
  • Studies that assessed the impact of inter-annual climate variability on malaria transmission. Studies in which climate change projections were used to estimate future malaria distribution were excluded.
  • Publications that used malaria incidence and/or prevalence data in their epidemiological study design (descriptive/explorative, spatial and/or temporal analysis and time series analysis). Studies that used only entomological data were excluded.
  • Studies conducted in Sub-Saharan Africa. Continental-wide studies were excluded because many African countries have made significant progress in fighting malaria, and malaria is clustered in small areas.

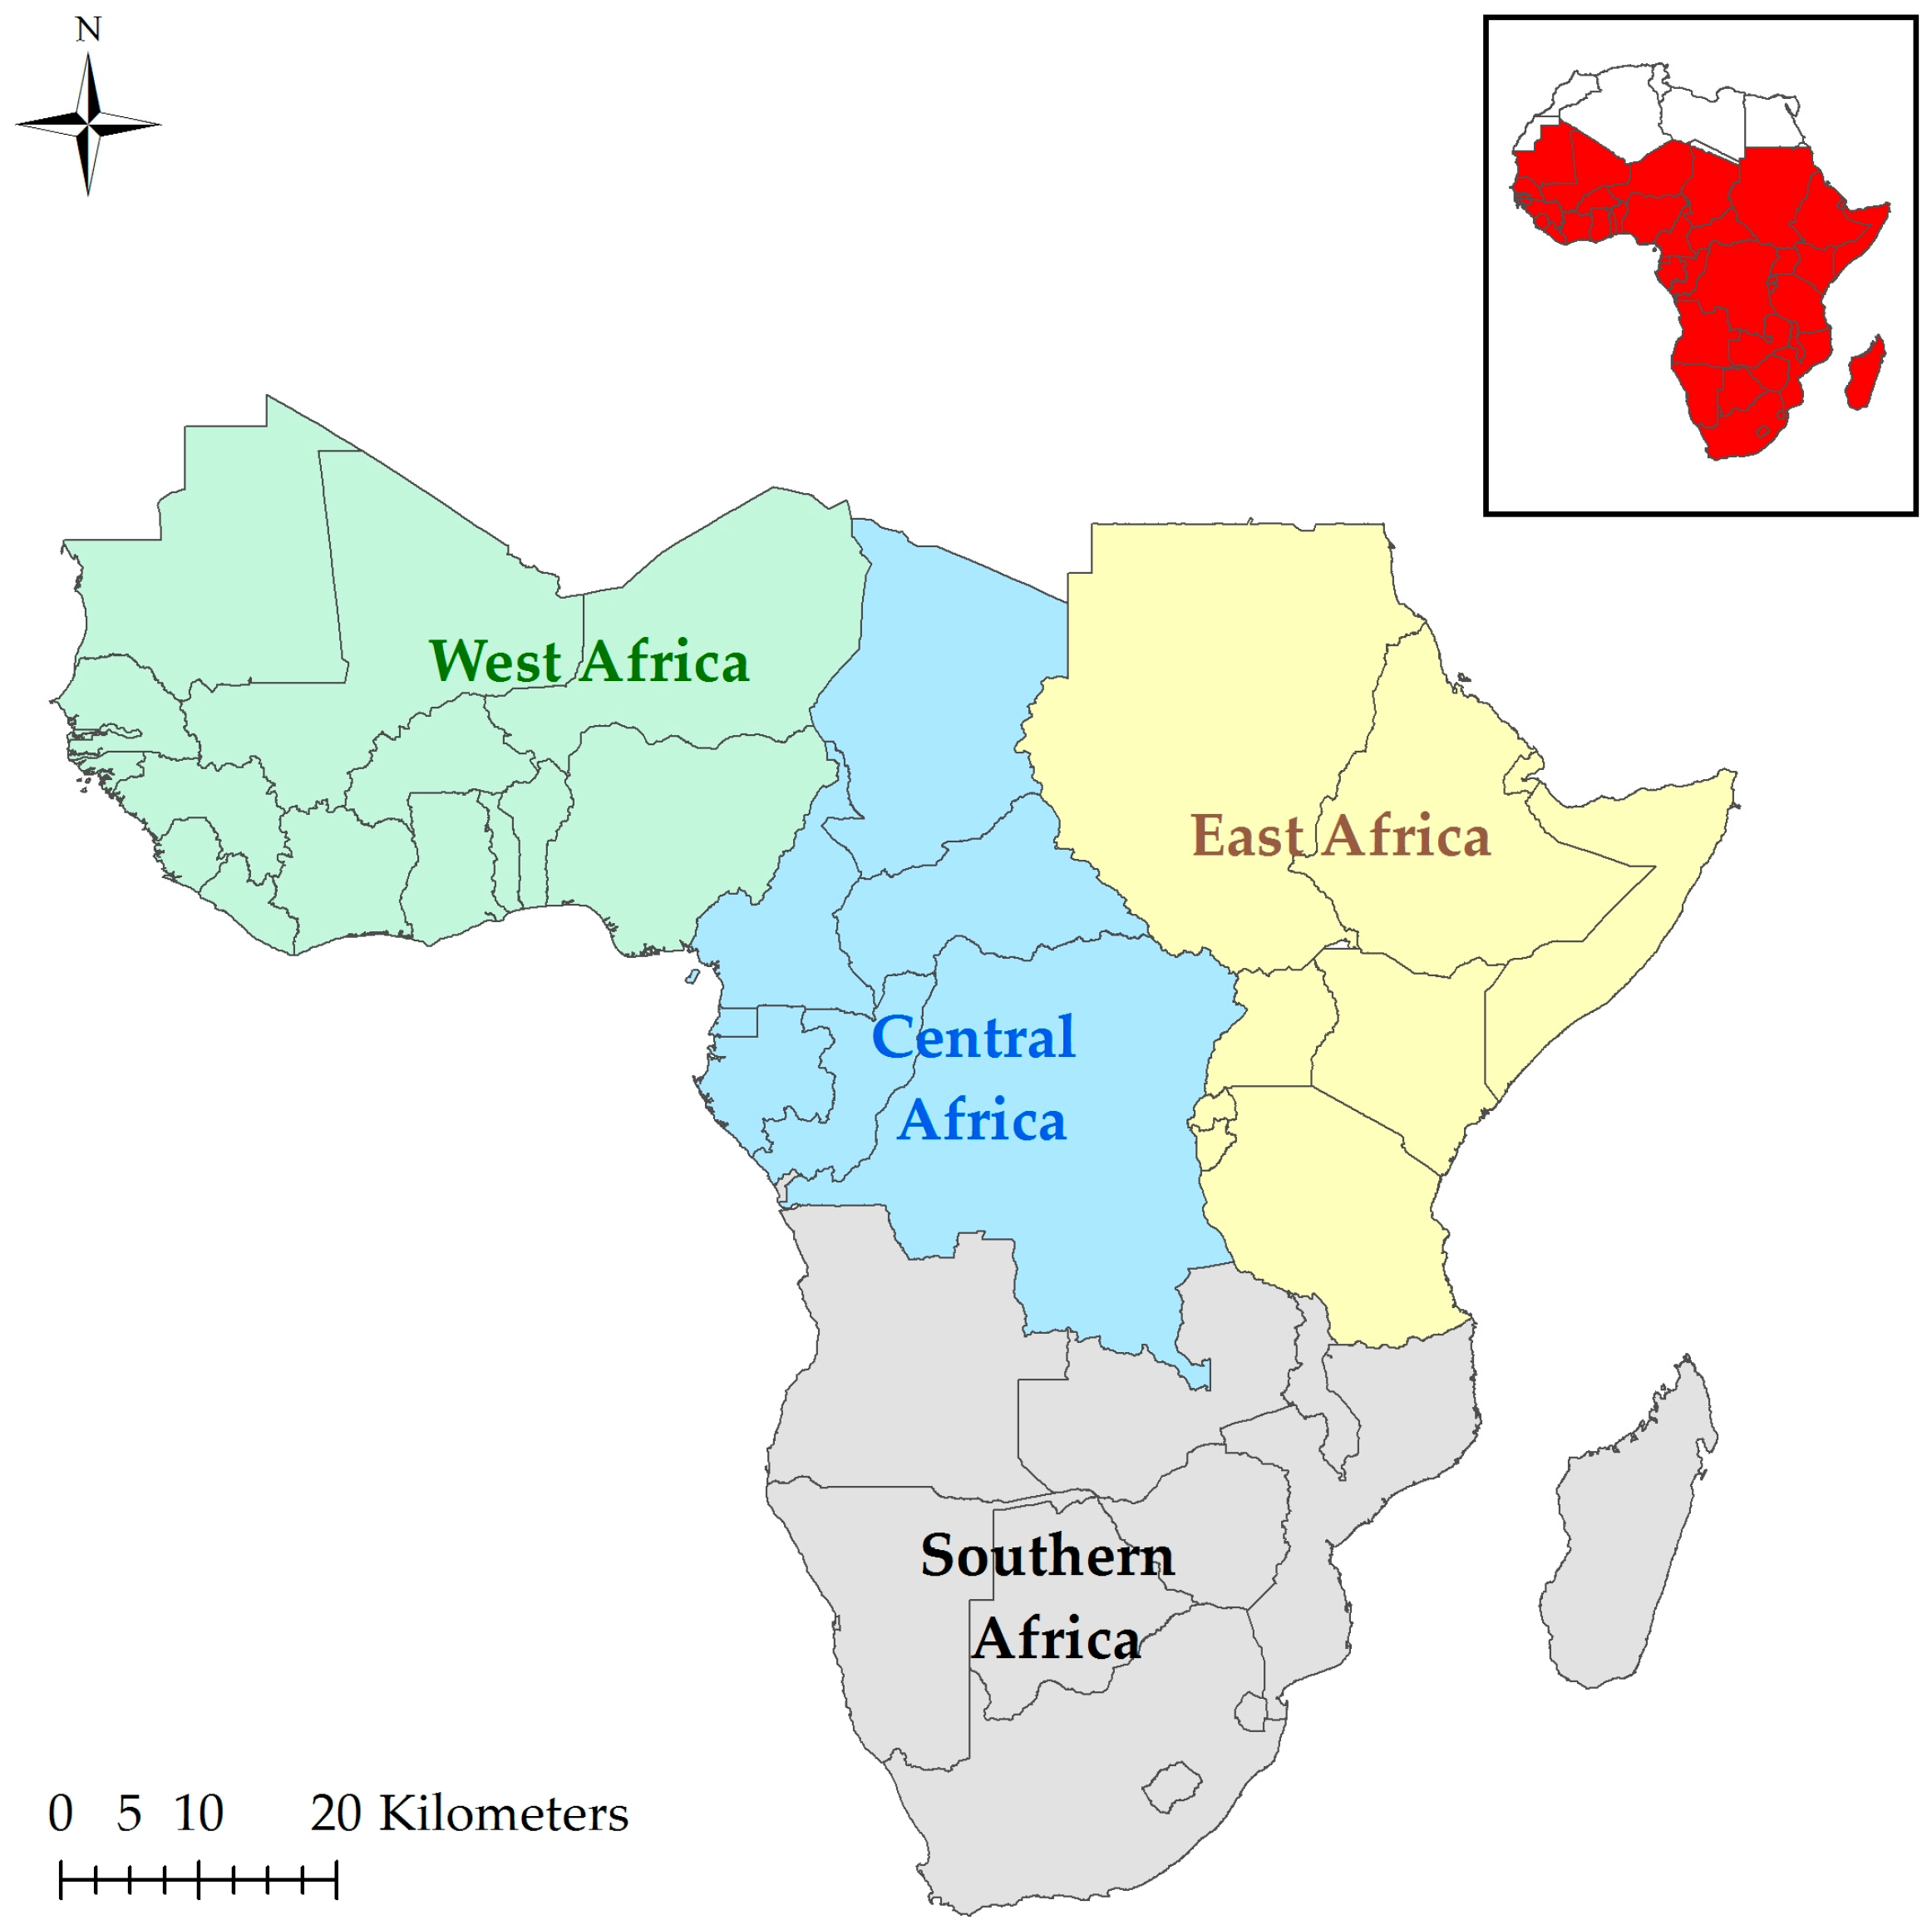
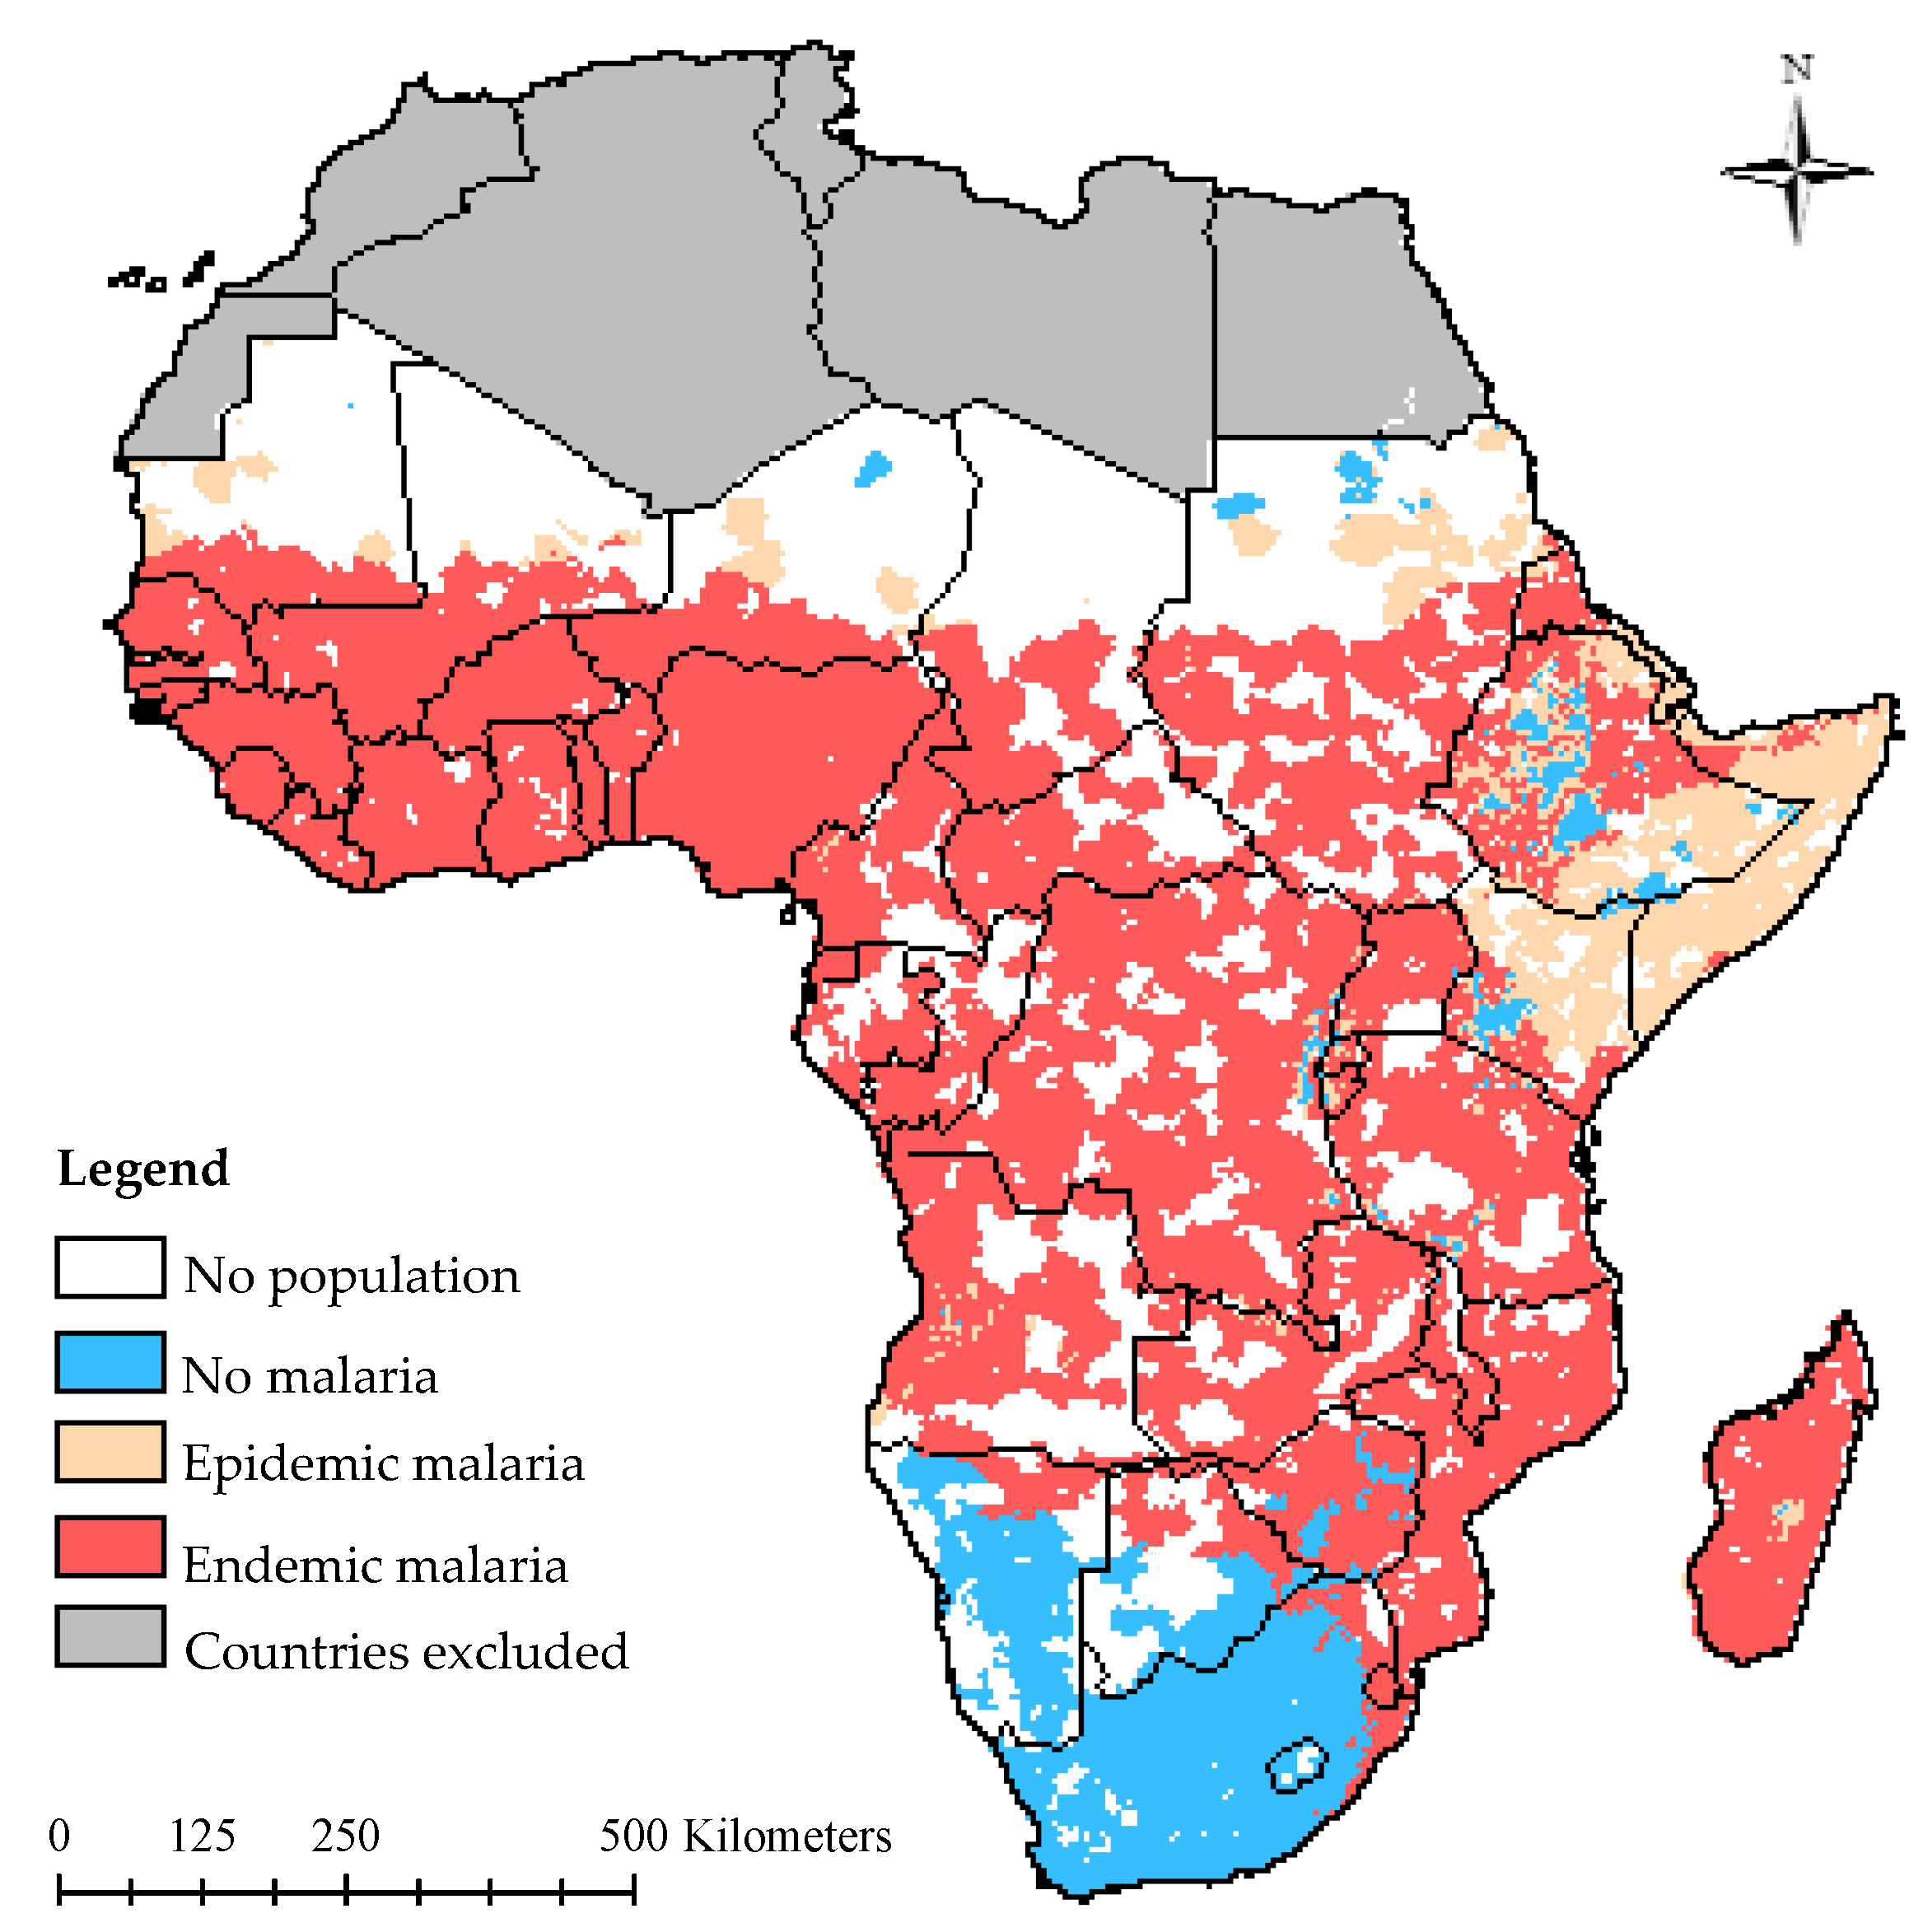
2.3. Description of the Study Region

SSA can be sub-divided into four regions (East, West, Central and Southern Africa) as shown in Figure 2. Malaria is endemic in a substantial part of SSA where the climate supports 20%–100% suitability (Figure 3) [34]. At the fringes of this region, there are areas where malaria rarely occurs because the climate is not always suitable. Nevertheless, variation in weather or climatic conditions could instigate an epidemic. The changes in climatic conditions are normally due to higher than normal rainfall and temperature in desert and highland fringes, respectively [34,35].
Malaria stratification in East Africa varies notably and can be attributed to the varying and complex climate associated with the region [36]. The climate of the endemic parts of East Africa favors a seasonal and perennial transmission of malaria, while in substantial parts of Kenya and parts of the Horn of Africa, malaria transmission is strongly seasonally prone to epidemics (1–3 months) owing to low rainfall and inter-annual variability [34]. The White Nile River, Blue Nile River, Lake Victoria, Lake Albert, Lake Tanganyika and Lake Malawi, coupled with the varying climate, are significant risk factors for endemic and epidemic malaria in the region.
Monthly temperature variations, which peak in the rainy season [37], coupled with rainfall that increases towards the Equator, may be responsible for the highly seasonal and varied malaria suitability in Southern Africa [36]. The climate in the malaria-free areas does not totally support malaria endemicity. However, environmental factors, such as the Orange River, which runs through Lesotho, Namibia and South Africa, and the Zambezi River in Botswana, can potentially support malaria epidemicity, while the parts of Southern Africa endemic to malaria are supported by suitable climate and water bodies (Limpopo and Zambezi Rivers) that favor seasonal malaria transmission [34].
The endemicity of malaria spans across West Africa substantially, excluding only the desert and semi-desert areas. The region is characterized by the Sahelian, Sudanian, tropical humid and equatorial climates. In this region, temperature increases northwards while rainfall increases southwards [36]. The region supports seasonal (4–6 months) and perennial (7–12 months) malaria transmission [34]. In addition, major water bodies like rivers (Benue, Niger, Volta and Senegal) and lakes (Volta and Chad) can sustain malaria transmission in the region.
Central Africa is significantly endemic to malaria. Suitable climatic conditions (relatively high and reliable rainfall over the coastal and central parts and a temperature range between 19 °C and 28 °C) [36] coupled with the Congo River, Lake Tanganyika and Lake Albert, contributes to the perennial transmission of malaria experienced in the region [34].

3. Results

Initially, 739 related publications were identified. After going through them thoroughly and carefully according to the search strategy and selection criteria, 35 articles were finally selected. From the selected articles, most of the study sites were located in East Africa (14 studies; Table 1), followed by Southern Africa (11 studies; Table 2) and then West Africa (nine studies; Table 3). The only study that covered the Central Africa region utilized datasets covering both Central and West Africa (Table 4). The study area(s), malaria case data, climatic variables and their sources, the statistical methods used and the main findings are provided for each study in Table 1, Table 2, Table 3 and Table 4, while Table 5 provides an overview of the RS variables commonly used in SSA, and Table 6 provides the characteristics of the satellites/sensors used in the selected articles.

3.1. East Africa

In East Africa, country-specific studies took place mainly in Kenya (four studies), Eritrea (two studies) and Somalia (two studies). Other study locations were Ethiopia, Burundi and Tanzania. Three cross-national studies were identified. One study used data that cuts across Kenya, Ethiopia and Uganda [38], while two other studies used national data from Kenya, Uganda and Tanzania [39,40] (Table 1). The East African countries identified in Table 1 are currently in the control phase of the World Health Organisation (WHO) malaria elimination continuum [41]. Studies conducted in the region mainly used National Oceanic and Atmospheric Administration (NOAA) Advanced Very High Resolution Radiometer (AVHRR) imagery as a source of proxy climatic/environmental variables for modelling malaria transmission both at the country and cross-national level. NDVI was observed to be the most assessed RS-derived variable and also the most statistically-significant malaria transmission predictor across East Africa. In the province of Karuzi in Burundi, Gomez-Elipe et al. [42] used NDVI extracted from NOAA-AVHRR at an 8 km × 8 km spatial resolution, while rainfall and maximum and minimum temperatures were obtained from the metrological stations. After employing the autoregressive integrated moving average (ARIMA) model, NDVI, rainfall and maximum temperature were observed to correlate with malaria cases, and hence, it constituted the best predicting model (R2adj = 82%, p < 0.0001 and 93% predicting accuracy). Ceccato et al. [43] used Spearman’s and Pearson’s rank correlations to assess the relationship between malaria incidence and climate/environmental variables anomalies (to eliminate the similar seasonal pattern possessed by both dependent and independent variables) in Eritrea. The climatic/environmental variables used by these authors included NDVI from NOAA-AVHRR at 8 km × 8 km spatial resolution, rainfall estimates (RFE) from Climate Prediction Centre Merged Analysis of Precipitation (CMAP) at a 2.5° × 2.5° grid and rainfall data from metrological stations.
NDVI anomalies were highly correlated with malaria incidence anomalies, particularly in the semi-arid north of the country and along the northern Red Sea coast, which is a highly epidemic-prone area. CMAP rainfall correlated with malaria incidence anomalies, with a lead time of 2–3 months, while weather station rainfall correlated with malaria anomalies with a delay of two months. Generally, the correlation coefficients were between 0.6 and 0.8. Similarly, Graves et al. [25] analyzed the effects of impregnated nets, larval control, malathion and DDT on malaria cases, while analyzing the effects of RS-derived climate variables, such as NOAA-AVHRR NDVI (8 km × 8 km spatial resolution) and CMAP RFE (2.5° × 2.5° grid) in Eritrea at the district level. The Poisson regression analysis employed showed that the relation between the climatic variables and malaria cases varied by zones. The increase in malaria cases was significantly associated with RFE with a lead time of 2–3 months (0.0007711, p < 0.001) in the Gash Barka zone and NDVI anomalies in the current and previous months (1.820668, p < 0.0001). NDVI also exhibited the same relationship in the Anseba zone, but with a greater coefficient (11.22517, p < 0.001). Gosoniu et al. [48] employed Bayesian geostatistical models to analyze the effects of parasitemia risk (malaria cases among children less than five years old) with age, socio-economic status (wealth index and residence), malaria intervention (bed nets) and climatic/environmental factors (Moderate Resolution Imaging Spectrometer (MODIS) land surface temperature (LST), MODIS NDVI, altitude from the United States Geological Service (USGS) digital elevation model (DEM), RFE data from the Meteosat-7 satellite obtained from the Africa Data Dissemination Service (ADDS) and distance to nearest water body obtained from Health Mapper) in Tanzania. The spatial resolution of the environmental/climatic factors used was 1 km × 1 km, except rainfall, which was 8 km × 8 km. Altitude was negatively associated with malaria risk at the 5% significance level, indicating that children living above 1500 m had a lower risk of malaria, while rainfall, NDVI and day and night LST were positively associated with parasitemia risk. In a study by Omumbo et al. [39], malariometric data and RS-derived variables (NDVI, mid-infrared (MIR) reflectance, cold cloud duration (CCD), land surface and air temperature indices and altitude) from Kenya, Uganda and Tanzania were used to update the spatial resolution of their malaria transmission risk map. These authors pre-processed the RS-derived data using the temporal Fourier analysis, and the discriminant analysis that was employed subsequently revealed that NOAA-AVHRR LST was the best predictor of malaria transmission intensity, while NOAA-AVHRR NDVI and CCD derived from the Meteosat satellite were identified as secondary predictors of transmission intensity. The forecast was significantly improved by altitude derived from USGS-DEM. Areas with moderated malaria were under-forecasted (false negative rate = 27.7%), while malaria-free areas were over-forecasted (false positive rate = 26.3%). In a similar study that used data covering Kenya, Uganda and Tanzania, Omumbo et al. [40] discovered that NDVI, CCD and water body area were associated with malaria in the “dry” Ecozone 1 (arid and highland, with a climate that favors few months of mosquito proliferation). In Ecozone 2 (diverse, with a climate that supports the propagation of mosquitoes for longer transmission seasons), temperature variables were identified as the most abundant variables in the prediction model. The addition of ecological zoning improved the overall model accuracy by 6.1%, and kappa values increased from 0.397–0.477.

3.2. Southern Africa

Studies in Southern Africa in which the relationship between RS-derived climatic variables and malaria incidence and/or prevalence were identified are summarized in Table 2. Study sites in Southern Africa mainly included Botswana (three studies), Zimbabwe (two studies) and Zambia (two studies). Other locations included Angola, Namibia, Swaziland and Malawi. Most Southern African countries, including Mozambique, Angola, Zimbabwe, Malawi and Zambia, are in the malaria control stage of the malaria elimination continuum [41]. South Africa, Botswana and Namibia are in the pre-elimination stage [41], while Swaziland is in the elimination stage [70]. RS-extracted climatic and environmental variables used in this region were obtained mainly from NOAA-AVHRR and MODIS satellite sensors. NDVI was observed to be the major RS-derived variable linked to malaria transmission in the region followed by RFE. Gosoniu et al. [28] fitted Bayesian geostatistical models to assess the effects of malaria intervention (insecticide-treated nets) among children less than five years old in Angola between 2006 and 2007 after adjusting for socio-economic status and climatic/environmental factors (MODIS LST, MODIS NDVI, altitude derived from USGS DEM, distance to nearest water body from Health Mapper and rainfall from ADDS). These authors examined the association between malaria incidence and climatic/environmental factors and found that NDVI (95% CI = 6.28, 17.94; OR = 10.62) and rainfall (95% CI = 6.00, 19.43; OR = 10.80) had a significantly positive relationship with malaria incidence. Similarly, Riedel et al. [55] investigated the relationship that existed between malaria interventions and malaria risk after adjusting for selected RS (MODIS LST, MODIS NDVI, MODIS land cover, ADDS RFE, altitude from USGS DEM, water bodies) and socio-economic variables in Zambia. A spatially independent and Bayesian geostatistical model was generated that used malaria cases from the Zambia Malaria Indicator Survey conducted in 2006. NDVI, night LST and rainfall (the last 2.7 months) were identified as positive significant predictors of malaria and were fitted in the model. Cohen et al. [57] conducted a study aimed at generating a case-based risk map for Swaziland using the 2011 malaria case data obtained from the Swaziland National Malaria Control Programme. Ecological variables, such as rainfall (from weather stations), temperature (from worldClim), NDVI, normalized difference water index (NDWI), elevation, topographic wetness index (TWI) and water bodies (from the Food and Agriculture Organisation of the United Nations) were assessed for their relevance in the formulation of a high spatial and temporal resolution malaria risk map. NDVI and NDWI data were calculated from a high spatial resolution imagery (30-m spatial resolution) from the Landsat 7 Enhanced Thematic Mapper plus (ETM+) sensor. The Landsat 7 ETM+ is an improvement of the previous Landsat satellite series that provides medium-resolution multispectral imagery of the Earth’s surface [33]. Elevation and TWI were obtained from the Shuttle Radar Topography Mission (SRTM) at 90-m spatial resolution. These authors suggested that during the high transmission season, malaria cases tend to cluster in areas of lower elevation, closer to water bodies, in less populated areas, with lower rainfall and lower temperatures (all p < 0.001). In relation to the model accuracy, NDWI was the most important RS-derived predictor followed by NDVI and TWI. Finally, models formulated from the random forest classification were used to produce predicted probability case-based maps. Nygren et al. [26] explored the relationship between RS-derived environmental malaria transmission and forecasted malaria cases in the Southern Province of Zambia. The RS-derived variables included MODIS NDVI, MODIS nocturnal dew point (DWP), MODIS LST, rainfall and elevation. The rainfall data were obtained from the Tropical Application of Meteorology using satellite data and ground-based observations (TAMSAT). TAMSAT rainfall data are rainfall estimates obtained from Meteosat (from the thermal infrared channels) and calibrated against rainfall data from rain gauges [71,72]. In addition, elevation data at 30-m spatial resolution was derived from the Advanced Spaceborne Thermal Emission and Reflection Radiometer (ASTER), which is a sensor on-board the Terra satellite for DEM creation [33]. NDVI, DWP and night LST were the highly significant predictors in the high and low malaria transmission areas, and the NDVI and DWP improved the ARIMAX models in all areas significantly. The mean average error of the forecast models was between 0.7% and 33.5%.

3.3. West Africa

In West Africa, country-specific studies took place mainly in Mali (four studies) and later Côte d’Ivoire (three studies). Others studies were conducted in Gambia and Senegal. One regional study used malariometric data obtained from Mapping Malaria Risk in Africa (MARA/ARMA), which covered West Africa, but excluded Cape Verde [6]. All of the West African countries are in the control stage of the WHO malaria elimination continuum, except Cape Verde, which is in the pre-elimination stage [41]. A summary of studies in West Africa that used RS climatic/environmental variables to identify climatic/environmental predictors of malaria is given in Table 3 above. In West Africa, the most frequently-utilized RS climatic/environmental variables were from NOAA-AVHRR and MODIS sensors. In the region, NDVI was identified as the major RS climatic predictor of malaria risk and transmission. Giardina et al. [63] used malaria prevalence data from Senegal’s Malaria Indicator Survey to determine spatially-explicit climatic/environmental variables associated with malaria in Senegal by incorporating Bayesian variable selection methods within a geostatistical framework. The formulated model included night LST (OR = 1.16; 95% CI (0.66, 1.86)), NDVI (OR = 1.48; 95% CI (0.88, 2.48)), urban area (OR = 0.19; 95% CI (0.07, 0.45)) and rural area (OR = 1), and they were noted to have a positive association with malaria parasitemia risk. Similarly, Gosoniu et al. [27] estimated the burden of malaria in Mali by using a Bayesian non-stationary model. Malaria prevalence data were extracted from the MARA/ARMA, 1998 database, NDVI from NASA-AVHRR, temperature and rainfall obtained from Hutchinson et al. [73], water bodies from World Resources Institute [74] and season length from Gemperli et al. [65]. The best sets of variables included in the non-stationary model were NDVI and minimum temperature, which had a positive significant relationship with malaria risk. Contrarily, rainfall had a negative significant relationship. The authors further suggest that stationarity assumptions are vital due to their influence on the significance of environmental parameters and parasitemia risk map. Gaudart et al. [23] incorporated RS-derived variables into a temporal model to predict malaria transmission in the locality of Bancoumana, Mali, characterized by Sudanese savannah. Confirmed P. falciparum data obtained from a field study of children aged 0–12 years and 15-day composites of NDVI data derived from NOAA-AVHRR between 1981 and 2006 were incorporated in the ARIMA time series. The analysis revealed that the seasonality of P. falciparum incidence was significantly explained by NDVI with a 15-day lag (p = 0.001), and the threshold was 0.361 (p = 0.007). The deterministic malaria transmission model, with stochastic environmental variables, forecasted an endemoepidemic pattern of malaria, and the value of the adjusted R2 was 89%. Similarly, in a study conducted by Kleinschmidt et al. [59], malaria risk was determined on a large scale by identifying important ecological parameters, and subsequently, a malaria risk map was produced for Mali. These authors used an automatic stepwise variable selection procedure to identify the most reliable predictors of malaria prevalence for the multiple logistic regression model. NDVI from June–November (wet season), mean maximum temperature from March–May, months with more than a 60-mm rainfall and distance to water bodies were the significant independent variables for predicting malaria prevalence and were incorporated into the final multiple logistic regression model; and finally, a map of malaria risk was formulated. On the other hand, Silue et al. [61] used the Bayesian model to produce spatially-explicit risk maps of malaria transmission in Man, Côte d’Ivoire. Initially, these authors analyzed the relationship of malaria prevalence data with possible malaria transmission risk factors, including age, use of bed nets, socio-economic status, distance to health facilities, NDVI, rainfall, LST and distance to rivers. NDVI and LST were extracted from MODIS at a 1 × 1 km spatial resolution, while RFE from the Meteosat-7 satellite was obtained from the ADDS at an 8 × 8 km spatial resolution. In bivariate non-spatial models, NDVI, RFE and distance to rivers were significantly associated with a P. falciparum infection. However, after employing the spatial correlation analysis, only age was noted to be a significant risk factor for malaria prevalence, while NDVI showed a “borderline” significance.

3.4. Central Africa

In the Central African region, the only study we identified that examined the association of malaria with RS climatic and environmental characteristics is given in Table 4. This is a cross-regional study that used Malaria prevalence data obtained from the MARA/ARMA database and numerous malaria transmission factors, including population density, NDVI, land use, temperature, rainfall, water bodies, soil water storage index, agro-ecological zone and transmission seasonality covering Central and West Africa [65]. The authors discovered that NDVI extracted from the NASA-AVHRR sensor at an 8 × 8-km spatial resolution had a high relationship with malaria across the region, except in areas far away from water bodies. Furthermore, a negative association was recorded between malaria transmission and distance to water, and this was observed in regions with NDVI values greater than 0.6. The spatial and non-spatial variations were 0.398 and 41.98, respectively. With reference to the WHO malaria elimination continuum, all of the Central African countries are still in the control phase [41], excluding São Tomé and Príncipe, which are currently in the pre-elimination stage.

3.5. Commonly-Used RS Variables and Features of Satellites/Sensors Used by the Authors in the Articles Reviewed

Table 5 provides an overview of the RS variables commonly used in SSA, while Table 6 presents the satellite sensors used in the various selected studies (these sensors have different spatial, spectral temporal, radiometric and swath width properties). NOAA-AVHRR and MODIS were the most frequently-utilized sources of RS-derived indices, such as NDVI, EVI, LST, ETa and DWP across SSA. In addition, Meteosat [26,39,40,61,62,75] and the Climate Prediction Centre Merged Analysis of Precipitation (CMAP) [25,43,51,53,58] were also used extensively to extract RFE and precipitation data.

4. Discussion

Our review highlights the contribution of RS technology in modelling malaria transmission and risk in SSA after taking account of potential climatic/environmental variables that can be used to predict malaria transmission. Malaria disease exhibits seasonal and spatial heterogeneity across localities, districts, provinces, countries and also in sub-continental regions. This can be attributed to the complex nature of malaria resulting from the diverse climatic, environmental, social and natural elements supporting the disease. The combination of these factors plays an important role in the endemicity and epidemicity of an area. RS serves as a means of obtaining potential climatic/environmental malaria variables and opens an avenue to better understand and model the environmental/climatic processes fundamentally responsible for the temporal and spatial heterogeneity of malaria disease.
RS has proven to be a vital tool in malaria modelling and prediction. It can contribute to malaria intervention planning and control programs at both local and broad scales and at different malaria risk stratifications. The scarcity of reliable meteorological data, national health policies and priorities, research/institutional capacity, availability and the cost of high resolution RS data for research and public health purposes determines the use of RS in malaria modelling [76]. This notwithstanding, RS-derived variables are gaining widespread acceptance and application in malaria risk modelling in SSA because of the nature and characteristics of a variable of interest can reflect the ecological relevance and contribution to malaria transmission. For instance, RFE provides indirect estimates of rainfall based on the detection of precipitation particles or the duration a cloud top is below a threshold temperature [69]. LST can be used as a proxy for temperature, and its values are obtained from land surface emissivity or surface reflectance in relation to their wavelengths and spectral characteristics [68], while NDVI can serve as a surrogate for rainfall, temperature, land use and land cover, near-surface humidity and surface water [20,77]. Thus, RS-derived variables have the potential to provide information that directly exhibits the state of the vector habitat and to inform us about the potential role that ecology can play in malaria transmission [29,68].
The robust utilization of RS-derived variables across SSA has shown that malaria predictors and models are peculiar and subject to the influence of the reference data, scale of observation and environmental condition of the study area. For example, in sub-continental East Africa, we observed that NDVI extracted from NOAA-AVHRR at 8 km × 8 km and MODIS at 1 km × 1 km spatial resolutions is an important predictor of malaria transmission at the country level in Kenya, Tanzania [48], Burundi [42] and Eritrea [25,43]. However, at the local level, in the rich herbaceous and cropland vegetation of the Amhara region, which constitutes the Ethiopian Highlands, NDVI obtained from MODIS at a 1 km × 1 km spatial resolution was not significantly related to malaria. Instead, ETa (which was only recently assessed for its relevance in malaria risk profiling), EVI and LST variables extracted from MODIS at a 1 km × 1 km spatial resolution were observed to be the suitable malaria predictors in Amhara, Ethiopia [20]. This can be explained by the fact that NDVI loses sensitivity in areas of higher vegetation density and at higher EVI values. The vegetation index EVI can be used as a substitute for NDVI, because it preserves more sensitivity over heavier vegetation; hence, good account of the variation and the change in a rich canopy can be recorded [78,79]. However, the application of EVI in malaria risk profiling and modelling was used sparingly in the East African sub-region and other SSA regions.
The pronounced climatic diversity in relation to malaria suitability at the country level in Southern Africa may have contributed to the diverse RS variables identified as significant malaria predictors in the sub-region. However, NDVI extracted from MODIS at 1 km × 1 km [26,28] and 0.25 km × 0.25 km [55] and Landsat 7 ETM+ at 30 m × 30 m spatial resolutions [57] can be used to explain the geographical spread of malaria in greater parts of the malaria endemic areas when compared to other RS-derived variables identified as significant predictors of transmission. On the other hand, in the malaria endemic region of Northern Namibia, Alegana et al. [56] found that MODIS EVI at a 1 km × 1 km spatial resolution and precipitation derived from TRMM at a 0.25° × 0.25° spatial resolution, which was re-sampled to a 1 km × 1 km spatial resolution, were the best malaria predictors, but it must be noted that NDVI was not considered in the study.
NDVI continued to exhibit its dominance in usage and significance pertaining to malaria risk determination across the SSA regions. NDVI extracted from either NOAA-AVHRR at an 8 km × 8 km spatial resolution or MODIS at a 1 km × 1 km spatial resolution, respectively, was identified as a suitable malaria predictor in Western Africa, especially in settings characterized by the Sahelian or Sudanian climate at the local level (Bancoumana, Mali) [23] and the country level (Mali and Senegal) [27,59,63]. However, in areas characterized by persistent moisture and heavy vegetation, different outcomes were observed. In the Man region of Côte d’Ivoire, Raso et al. [62] identified RFE data obtained from the Meteosat 7 satellite at an 8 km × 8 km spatial resolution as the predictor for malaria prevalence. Furthermore, a significant negative association between plasmodium prevalence and MODIS LST at a 1 km × 1 km spatial resolution was recorded in a study that used data covering Cote d’Ivoire [64].
In the Central African region (characterized by climatic suitability for malaria proliferation and heavy vegetation), the only study we identified and reviewed indicated that NDVI calculated from the NASA-AVHRR sensor at an 8 × 8 km spatial resolution returned a better result for modelling malaria transmission [65]. EVI, which has been suggested to be an alternative predictor over denser vegetation than NDVI, may have been identified as a better malaria predictor in the Central African region, but it was not included in the study. Furthermore, other climatic/environmental factors used in the study may have been identified as suitable malaria predictors, but the authors did not consider the differences that might exist in the climate-malaria relationship across the study area. In addition, they did not take into account the non-stationary characteristics of malaria data covering large areas. Disregarding this characteristic could result in the wrong specification of the spatial correlation and, therefore, erroneous values of the standard error of the predictors and prediction. In a somewhat similar study conducted by Gosoniu et al. [6], the authors used data covering West Africa and addressed the above-mentioned issues by partitioning the study area into four agro-ecological zones and then employed a different non-parametric model in each zone. There is a possibility that more studies in the Central African region may be available, but could not be identified, as the region is dominated by French-speaking countries. Hence, researchers from the region may have their articles published in French.
The tremendous improvements in the RS sensors, better turnaround time and availability of some RS low and medium resolution datasets at no cost [80,81] may have also contributed to the considerable utilization of various RS datasets across SSA. The freely available RS datasets obtainable via MODIS and AVHRR satellites can be used to explain the frequent usage of these satellites as compared to RS datasets from other RS sources [33,82]. Furthermore, MODIS has made it possible to evaluate new and previously unidentified environmental-related malaria predictors. For example, contemporary studies have shown that MODIS DWP at a 5 km × 5 km spatial resolution and MODIS ETa at a 1 km × 1 km spatial resolution can be used to explain and define malaria transmission risk and malaria incidence in the Southern Province of Zambia and the Amhara region of Ethiopia, respectively.
Countries in SSA are at different stages in their fight towards malaria elimination, and this has to be taken into account in line with the characteristics of the RS imagery intended to be used. Low and medium spatial resolution RS data can be useful in studies conducted at national and regional levels in the malaria endemic countries that are still at their malaria control stage; in addition, to derive generalized spatio-temporal models and a malaria risk map for the robust application of intervention resources. However, in Angola, Botswana, Cape Verde, Namibia, Swaziland and South Africa with significantly low malaria cases [41], high spatial resolution RS data at a local level would be essential to carry out the cluster analysis and detection of foci and hotspots of malaria transmission. This would support adequate monitoring of the disease and delivery of interventions to specific location(s) and/or seasons, ultimately leading to malaria reduction. New generation satellites, such as Landsat-8, Copernicus: Sentinel-2, the Global Precipitation Measurement (GPM) mission, the Soil Moisture Active/Passive (SMAP) mission, SPOT 6 and SPOT 7 [33], with improved spatial and radiometric resolutions, have potential for malaria transmission and risk modelling, especially in regions where malaria cases are low (Table 7). Furthermore, future satellite mission, like Copernicus: Sentinel-3, which would introduce data reliability for long-term monitoring, could also be vital in modelling spatial and temporal malaria transmission and research [33]. The cost of obtaining high spatial resolution datasets remains a challenge in SSA. Hence, lessons can be drawn from the collaborative venture that exists between China and Brazil, which allows their researchers to obtain high spatial resolution data (2.5 m) freely [83].
In a bid to identify relevant and potential risk factor(s) or malaria transmission predictors at local, national or regional levels that can be further incorporated into forecast models/early warning systems and malaria risk maps, the statistical methodology employed should accommodate procedures that suit a particular context and setting. According to Table 1, Table 2, Table 3 and Table 4, generalized linear models (linear regression, logistic regression and Poisson regression) were used frequently in Eastern, Southern and Western Africa as compared to other analytical approaches, but to a varying degree. This can be attributed to the simplistic, flexible and intuitive way this approach accommodates predictors [84]. On the other hand, in the only study we identified that was conducted in Central Africa, a multivariate analysis was carried out. This further illustrates the relevance of these approaches in evaluating the relationships between georeferenced environmental variables and prevalence data, identifying potential risk factor(s)/predictor variable(s), explaining the observed variable(s) and forecasting prevalence at unsampled locations. The reliability of predictive geostatistical models formulated from a multivariate regression analysis is important in malaria mapping, and it depends on the selected variables fitted in the model. Researchers intending to employ either of the above-mentioned approaches should bear in mind that they do not intrinsically consider correlation in the errors [85]. Erroneous serial autocorrelation is likely to result in underestimated standard errors, and in addition, the evaluation of the impact of predictors would be biased. To account for the impact of autocorrelation on estimates, de Jong and Davidson [86] exhibited the relevance of applying heteroscedasticity and autocorrelation consistent estimators. A variety of statistical approaches have been applied across SSA to varying degrees and settings. The exploration and comparison of different statistical approaches and models for a particular setting would be useful in identifying and evaluating prediction accuracy. It will also be useful in identifying approaches that would provide accurate and reliable predictors for either short, long or intermediate prediction [87].
Overall, the quantitative models employed across localities and countries in SSA consistently revealed variability in the relationship between malaria and climatic/environmental variables. However, NDVI was observed to be the most significant predictor of malaria transmission followed by LST and RFE, and thus, they constituted the RS variable(s) that provided the best-fit model. To improve the overall predictive power and model robustness, we recommended the following: (1) Large datasets should be used over longer periods. For example, Nygren et al. [26] generated predictive models employing 126 weeks of data. Therefore, it will be difficult to know if the identified RS predictors of malaria transmission and the relationships they found will be sustained over time. (2) The incremental validity approach, which involves incorporating variables as supplemental to an identified predictor, should be practiced, as it can improve the predictive power [88]. For example, the study conducted by Ceccato et al. [43] revealed that NDVI predicted about 1%–20% of the variance in the southern and southeastern areas of Eritrea. This means that other RS-derived variables can explain 80%–99% of the variance. However, the addition of other RS-derived variables would be dependent on whether they improve the predictive validity of what the identified predictor predicts. (3) Linear models have been widely used across SSA. However, these models can result in inappropriate static regression and impose unrealistic or general assumptions. Thus, Bayesian models, which provide extensions of generalized linear models and are formulated to overcome some of the setbacks of linear models, should be employed.
The reviewed studies have shown that RS technology can contribute to the understanding of the complex nature of malaria across SSA. It can provide the potential climatic and environmental variables needed to identify significant spatially-explicit variable(s) associated with malaria risk and transmission. In areas like the Horn of Africa and Kenya, where malaria is highly seasonal, unstable and epidemic, the process of deciding climatic monitoring targets should be handled with caution to avoid the generation of unreliable malaria transmission models. Therefore, we are in support of regular capacity building and multidisciplinary collaboration between relevant departments, e.g., ecology, geography, biological science, epidemiology, entomology, information technology, statisticians, mathematical modelers, public health decision makers and stakeholders, in generating reliable prediction models. Furthermore, although this study can serve as an informative tool for public and environmental health workers, as well as researchers aiming to model potential climatic factors related to malaria and to delineate climate monitoring targets in SSA, some limitations should be noted. Firstly, relevant reports published in languages other than English and/or unpublished reports were excluded from this review. Secondly, studies that used only entomological data were also excluded.

5. Conclusions

We conclude that RS technology is a vital tool in determining malaria risk predictors at regional, national and local scales in diverse regions of SSA. Our review suggests that the utilization of RS in determining reliable malaria transmission predictors and developing environmental monitoring would require a tailored approach that takes into account the geographical/climatic setting, the stage of the malaria elimination continuum, the characteristics of the RS variables and the analytical approach, which in turn, would support the channeling of intervention resources sustainably. The improvement of this technology has encouraged the acquisition and evaluation of a wide array of historical climatic/environmental variables at different spatial and temporal resolutions depending on the setting and intended usage. This therefore makes RS a relevant tool for identifying reliable climate-related malaria predictors that can be incorporated into an integrated malaria early-warning system or prediction model. Previously unidentified remotely-sensed variables, such as ETa and DWP, were found to be malaria transmission predictors, and EVI was also noted to be a suitable substitute for NDVI in denser vegetation, which needs to be further explored extensively across relevant localities and regions of SSA. Furthermore, the assessment of different statistical methods and models for a particular location would be useful in identifying and evaluating prediction accuracy depending on the length of prediction. The application of this technology can be further harnessed in generating reliable prediction models by devising means by which relevant skills and training and the easy acquisition of relevant RS-derived variables can be achieved. Therefore, relevant multidisciplinary collaborations, symposiums and capacity development are encouraged.

Acknowledgments

This study received financial support from the College of Agriculture, Engineering and Science of the University of KwaZulu-Natal through the doctoral research bursary awarded to Osadolor Ebhuoma. We also thank Emmanuella Ebowe for comments on the manuscript.

Author Contributions

Osadolor Ebhuoma and Michael Gebreslasie conceived and designed the study. Osadolor Ebhuoma performed the literature search. Osadolor Ebhuoma and Michael Gebreslasie planned and performed the study. Osadolor Ebhuoma wrote the paper. All authors read and approved the manuscript.

Conflicts of Interest

The authors declare no conflict of interest.

Abbreviations

The following abbreviations are used in this manuscript:
SSASub-Saharan Africa
RSremote sensing
ISIInstitute for Scientific Information
NDVInormalized difference vegetation index
NOAANational Oceanic and Atmospheric Administration
AVHRRAdvanced Very High Resolution Radiometer
MODISModerate-resolution Imaging Spectrometer
WHOWorld Health Organisation
ARIMAautoregressive integrated moving average
RFErainfall estimates
CMAPClimate Prediction Centre Merged Analysis of Precipitation
LSTland surface temperature
USGSUnited States Geological Service
DEMdigital elevation model
ADDSAfrica Data Dissemination Service
MIRmid-infrared
CCDcold cloud duration
ETaactual evapotranspiration
EVIenhanced vegetation index
MARA/ARMAMapping Malaria Risk in Africa
NDWInormalized difference water index
TWItopographic wetness index
ETM+Enhanced Thematic Mapper plus
SRTMShuttle radar Topography Mission
DWPnocturnal dew point
TAMSATTropical Application of Meteorology using satellite data and ground-based observations
GPMGlobal Precipitation Measurement mission
SMAPSoil Moisture Active/Passive mission

References

  1. World Health Organization. WHO Factsheet: Vector Borne Diseases; World Health Organization: Geneva, Switzerland, 2014. [Google Scholar]
  2. World Health Organization. Malaria; World Health Organization: Geneva, Switzerland, 2015. [Google Scholar]
  3. Snow, R.; Hay, S.; Marsh, K. Malaria in Africa: Sources, Risks, Drivers and Disease Burden 2005–2030; Foresight Project, Office of Science and Technology: London, UK, 2006. [Google Scholar]
  4. Palaniyandi, M. The role of Remote Sensing and GIS for spatial prediction of vector-borne diseases transmission: A systematic review. J. Vector Borne Dis. 2012, 49, 197. [Google Scholar] [PubMed]
  5. Bai, L.; Morton, L.C.; Liu, Q. Climate change and mosquito-borne diseases in China: A review. Glob. Health 2013, 9, 1. [Google Scholar] [CrossRef] [PubMed]
  6. Gosoniu, L.; Vounatsou, P.; Sogoba, N.; Maire, N.; Smith, T. Mapping malaria risk in West Africa using a Bayesian nonparametric non-stationary model. Comput. Stat. Data Anal. 2009, 53, 3358–3371. [Google Scholar] [CrossRef]
  7. Yoo, E.-H. Exploring space-time models for West Nile virus mosquito abundance data. Appl. Geogr. 2013, 45, 203–210. [Google Scholar] [CrossRef]
  8. Grover-Kopec, E.; Kawano, M.; Klaver, R.W.; Blumenthal, B.; Ceccato, P.; Connor, S.J. An online operational rainfall-monitoring resource for epidemic malaria early warning systems in Africa. Malar. J. 2005, 4. [Google Scholar] [CrossRef] [PubMed] [Green Version]
  9. Teklehaimanot, H.D.; Lipsitch, M.; Teklehaimanot, A.; Schwartz, J. Weather-based prediction of Plasmodium falciparum malaria in epidemic-prone regions of Ethiopia I. Patterns of lagged weather effects reflect biological mechanisms. Malar. J. 2004, 3, 41. [Google Scholar] [CrossRef] [PubMed] [Green Version]
  10. Teklehaimanot, H.D.; Schwartz, J.; Teklehaimanot, A.; Lipsitch, M. Weather-based prediction of Plasmodium falciparum malaria in epidemic-prone regions of Ethiopia II. Weather-based prediction systems perform comparably to early detection systems in identifying times for interventions. Malar. J. 2004, 3. [Google Scholar] [CrossRef] [Green Version]
  11. Arab, A.; Jackson, M.C.; Kongoli, C. Modelling the effects of weather and climate on malaria distributions in West Africa. Malar. J. 2014, 13, 126. [Google Scholar] [CrossRef] [PubMed]
  12. Palaniyandi, M. GIS mapping of vector breeding habitats. Geospat. World 2013, 9, 1–4. [Google Scholar]
  13. Githeko, A.K. Malaria and Climate Change. Commonwealth Health Minister’s Update 2009; 2009; pp. 40–43. Available online: http://www.r4d.dfid.gov.uk/PDF/Outputs/ClimateChange/CommonwealthHealth MinistersUpdate2009Githeko.pdf (accessed on 17 April 2015).
  14. Centres for Disease Control and Prevention. Ecology of Malaria; Centres for Disease Control and Prevention: Atlanta, GA, USA, 2015.
  15. Beck-Johnson, L.M.; Nelson, W.A.; Paaijmans, K.P.; Read, A.F.; Thomas, M.B.; Bjørnstad, O.N. The effect of temperature on Anopheles mosquito population dynamics and the potential for malaria transmission. PLoS ONE 2013, 8, e79276. [Google Scholar]
  16. Lindsay, S.W.; Martens, W.J.M. Malaria in the African highlands: Past, present and future. Bull. World Health Organ. 1998, 76, 33–45. [Google Scholar] [PubMed]
  17. Yamana, T.K.; Eltahir, E.A.B. Incorporating the effects of humidity in a mechanistic model of Anopheles gambiae mosquito population dynamics in the Sahel region of Africa. Parasites Vectors 2013, 6, 1–10. [Google Scholar] [CrossRef] [PubMed]
  18. Zacarias, O.P.; Andersson, M. Spatial and temporal patterns of malaria incidence in Mozambique. Malar. J. 2011, 10, 189. [Google Scholar] [CrossRef] [PubMed]
  19. Mills, A.; Lubell, Y.; Hanson, K. Malaria eradication: The economic, financial and institutional challenge. Malar. J. 2008, 7. [Google Scholar] [CrossRef] [PubMed]
  20. Midekisa, A.; Senay, G.; Henebry, G.M.; Semuniguse, P.; Wimberly, M.C. Remote sensing-based time series models for malaria early warning in the highlands of Ethiopia. Malar. J. 2012, 11. [Google Scholar] [CrossRef] [PubMed]
  21. Kuhn, K.; Campbell-Lendrum, D.; Haines, A.; Cox, J.; Corvalán, C.; Anker, M. Using Climate to Predict Infectious Disease Epidemics; WHO: Geneva, Switzerland, 2005. [Google Scholar]
  22. Dinku, T.; Ceccato, P.; Grover-Kopec, E.; Lemma, M.; Connor, S.J.; Ropelewski, C.F. Validation of satellite rainfall products over East Africa’s complex topography. Int. J. Remote Sens. 2007, 28, 1503–1526. [Google Scholar] [CrossRef]
  23. Gaudart, J.; Toure, O.; Dessay, N.; Dicko, A.L.; Ranque, S.; Forest, L.; Demongeot, J.; Doumbo, O.K. Modelling malaria incidence with environmental dependency in a locality of Sudanese savannah area, Mali. Malar. J. 2009, 8. [Google Scholar] [CrossRef] [PubMed]
  24. Hay, S.; Renshaw, M.; Ochola, S.A.; Noor, A.M.; Snow, R.W. Performance of forecasting, warning and detection of malaria epidemics in the highlands of western Kenya. Trends Parasitol. 2003, 19, 394–399. [Google Scholar] [CrossRef]
  25. Graves, P.M.; Osgood, D.E.; Thomson, M.C.; Sereke, K.; Araia, A.; Zerom, M.; Ceccato, P.; Bell, M.; del Corral, J.; Ghebreselassie, S.; et al. Effectiveness of malaria control during changing climate conditions in Eritrea, 1998–2003. Trop. Med. Int. Health 2008, 13, 218–228. [Google Scholar] [CrossRef] [PubMed]
  26. Nygren, D.; Stoyanov, C.; Lewold, C.; Mansson, F.; Miller, J.; Kamanga, A.; Shiff, C.J. Remotely-sensed, nocturnal, dew point correlates with malaria transmission in Southern Province, Zambia: A time-series study. Malar. J. 2014, 13, 231. [Google Scholar] [CrossRef] [PubMed]
  27. Gosoniu, L.; Vounatsou, P.; Sogoba, N.; Smith, T. Bayesian modelling of geostatistical malaria risk data. Geospat. Health 2006, 1, 127–139. [Google Scholar] [CrossRef] [PubMed]
  28. Gosoniu, L.; Veta, A.M.; Vounatsou, P. Bayesian geostatistical modeling of Malaria Indicator Survey data in Angola. PLoS ONE 2010, 5, e9322. [Google Scholar] [CrossRef] [PubMed]
  29. Palaniyandi, M.; Anand, P.; Maniyosai, R. Spatial cognition: A geospatial analysis of vector borne disease transmission and the environment, using remote sensing and GIS. Int. J. Mosq. Res. 2014, 1, 39–54. [Google Scholar]
  30. Onyiri, N. Estimating malaria burden in Nigeria: A geostatistical modelling approach. Geospat. Health 2015, 10. [Google Scholar] [CrossRef] [PubMed]
  31. Arksey, H.; O’Malley, L. Scoping studies: Towards a methodological framework. Int. J. Soc. Res. Methodol. 2005, 8, 19–32. [Google Scholar] [CrossRef] [Green Version]
  32. Levac, D.; Colquhoun, H.; O’Brien, K.K. Scoping studies: Advancing the methodology. Implement Sci. 2010, 5, 1–9. [Google Scholar] [CrossRef] [PubMed]
  33. European Space Agency. eoPortal Directory. European Space Agency, 2000–2005. Available online: https://directory.eoportal.org/web/eoportal/satellite-missions (accessed on 9 July 2015).
  34. MARA/ARMA. 2009. Available online: http://www.mara-database.org (accessed on 8 November 2014).
  35. Hellmuth, M.E.; Moorhead, A.; Thomson, M.C.; Williams, J. Cliamte Risk Managment in Africa: Learning from Practice; International Research Institute for Climate and Society (IRI), Columbia University: Palisades, NY, USA, 2007. [Google Scholar]
  36. United Nations Environmental Programme. Africa Environment Outlook 2: Our Evironment, Our Wealth. 2006. Available online: http://www.unep.org/dewa/Africa/publications/AEO-2/content/index.htm (accessed on 10 December 2015).
  37. Chenje, M.; Johnson, P. State of the Environment in Southern Africa; Southern African Research and Documentation Centre, IUCN (The World Conservation Union), and Southern African Development Community: Johannesburg, South Africa, 1996. [Google Scholar]
  38. Zhou, G.; Minakawa, N.; Githeko, A.K.; Yan, G. Association between climate variability and malaria epidemics in the East African highlands. Proc. Natl. Acad. Sci. USA 2004, 101, 2375–2380. [Google Scholar] [CrossRef] [PubMed]
  39. Omumbo, J.A.; Hay, S.I.; Goetz, S.J.; Snow, R.W.; Rogers, D.J. Updating historical maps of malaria transmission intensity in East Africa using remote sensing. Photogramm. Eng. Remote Sens. 2002, 68, 161–166. [Google Scholar]
  40. Omumbo, J.A.; Hay, S.I.; Snow, R.W.; Tatem, A.J.; Rogers, D.J. Modelling malaria risk in East Africa at high-spatial resolution. Trop. Med. Int. Health 2005, 10, 557–566. [Google Scholar] [CrossRef] [PubMed]
  41. World Health Organization. World Malaria Report 2014; World Health Organisation: Geneva, Switzerland, 2014. [Google Scholar]
  42. Gomez-Elipe, A.; Otero, A.; van Herp, M.; Aguirre-Jaime, A. Forecasting malaria incidence based on monthly case reports and environmental factors in Karuzi, Burundi, 1997–2003. Malar. J. 2007, 6. [Google Scholar] [CrossRef] [PubMed] [Green Version]
  43. Ceccato, P.; Ghebremeskel, T.; Jaiteh, M.; Graves, P.M.; Levy, M.; Ghebreselassie, S.; et al. Malaria stratification, climate, and epidemic early warning in Eritrea. Am. J. Trop.Med. Hyg. 2007, 77 (Suppl. 6), 61–68. [Google Scholar] [PubMed]
  44. Hay, S.I.; Myers, M.F.; Burke, D.S.; Vaughn, D.W.; Endy, T.; Ananda, N.; Shanks, G.D.; Snow, R.W.; Rogers, D.J. Etiology of interepidemic periods of mosquito-borne disease. Proc. Natl. Acad. Sci. USA 2000, 97, 9335–9339. [Google Scholar] [CrossRef] [PubMed]
  45. Hay, S.I.; Were, E.C.; Renshaw, M.; Noor, A.M.; Ochola, S.A.; Olusanmi, L.; Alipui, N.; Snow, R.W. Forecasting, warning, and detection of malaria epidemics: A case study. Lancet 2003, 361, 1705–1706. [Google Scholar] [CrossRef]
  46. Noor, A.M.; Clements, A.C.; Gething, P.W.; Moloney, G.; Borle, M.; Shewchuk, T.; Hay, S.I.; Snow, R.W. Spatial prediction of Plasmodium falciparum prevalence in Somalia. Malar. J. 2008, 7, 159. [Google Scholar] [CrossRef] [PubMed]
  47. Hashizume, M.; Terao, T.; Minakawa, N. The Indian Ocean Dipole and malaria risk in the highlands of western Kenya. Proc. Natl. Acad. Sci. USA 2009, 106, 1857–1862. [Google Scholar] [CrossRef] [PubMed]
  48. Gosoniu, L.; Msengwa, A.; Lengeler, C.; Vounatsou, P. Spatially explicit burden estimates of malaria in Tanzania: Bayesian geostatistical modeling of the malaria indicator survey data. PLoS ONE 2012, 7, e23966. [Google Scholar] [CrossRef] [PubMed] [Green Version]
  49. Noor, A.M.; Alegana, V.A.; Patil, A.P.; Moloney, G.; Borle, M.; Yusuf, F.; Amran, J.; Snow, R.W. Mapping the receptivity of malaria risk to plan the future of control in Somalia. BMJ Open 2012, 2. [Google Scholar] [CrossRef] [PubMed]
  50. Mabaso, M.L.; Craig, M.; Vounatsou, P.; Smith, T. Towards empirical description of malaria seasonality in Southern Africa: The example of Zimbabwe. Trop. Med. Int. Health 2005, 10, 909–918. [Google Scholar] [CrossRef] [PubMed]
  51. Thomson, M.C.; Mason, S.J.; Phindela, T.; Connor, S.J. Use of rainfall and sea surface temperature monitoring for malaria early warning in Botswana. Am. J. Trop. Med. Hyg. 2005, 73, 214–221. [Google Scholar] [PubMed]
  52. Mabaso, M.L.; Vounatsou, P.; Midzi, S.; Da Silva, J.; Smith, T. Spatio-temporal analysis of the role of climate in inter-annual variation of malaria incidence in Zimbabwe. Int. J. Health Geogr. 2006, 5, 20. [Google Scholar] [CrossRef] [PubMed]
  53. Thomson, M.C.; Doblas-Reyes, F.J.; Mason, S.J.; Hagedorn, R.; Connor, S.J.; Phindela, T.; Morse, A.P.; Palmer, T.N. Malaria early warnings based on seasonal climate forecasts from multi-model ensembles. Nature 2006, 439, 576–579. [Google Scholar] [CrossRef] [PubMed]
  54. Craig, M.H.; Sharp, B.L.; Mabaso, M.L.; Kleinschmidt, I. Developing a spatial-statistical model and map of historical malaria prevalence in Botswana using a staged variable selection procedure. Int. J. Health Geogr. 2007, 6, 44. [Google Scholar] [CrossRef] [PubMed]
  55. Riedel, N.; Vounatsou, P.; Miller, J.M.; Gosoniu, L.; Chizema-Kawesha, E.; Mukonka, V.; Steketee, R.W. Geographical patterns and predictors of malaria risk in Zambia: Bayesian geostatistical modelling of the 2006 Zambia national malaria indicator survey (ZMIS). Malar. J. 2010, 9, 37. [Google Scholar] [CrossRef] [PubMed]
  56. Alegana, V.A.; Atkinson, P.M.; Wright, J.A.; Kamwi, R.; Uusiku, P.; Katokele, S.; Snow, R.W.; Noor, A.M. Estimation of malaria incidence in northern Namibia in 2009 using Bayesian conditional-autoregressive spatial-temporal models. Spat. Spatiotemporal. Epidemiol. 2013, 7, 25–36. [Google Scholar] [CrossRef] [PubMed]
  57. Cohen, J.M.; Dlamini, S.; Novotny, J.M.; Kandula, D.; Kunene, S.; Tatem, A.J. Rapid case-based mapping of seasonal malaria transmission risk for strategic elimination planning in Swaziland. Malar. J. 2013, 12, 61. [Google Scholar] [CrossRef] [PubMed]
  58. Lowe, R.; Chirombo, J.; Tompkins, A.M. Relative importance of climatic, geographic and socio-economic determinants of malaria in Malawi. Malar. J. 2013, 12. [Google Scholar] [CrossRef] [PubMed]
  59. Kleinschmidt, I.; Bagayoko, M.; Clarke, G.P.; Craig, M.; Le Sueur, D. A spatial statistical approach to malaria mapping. Int. J. Epidemiol. 2000, 29, 355–361. [Google Scholar] [CrossRef] [PubMed]
  60. Gemperli, A.; Vounatsou, P.; Sogoba, N.; Smith, T. Malaria mapping using transmission models: Application to survey data from Mali. Am. J. Epidemiol. 2006, 163, 289–297. [Google Scholar] [CrossRef] [PubMed]
  61. Silue, K.D.; Raso, G.; Yapi, A.; Vounatsou, P.; Tanner, M.; N’Goran, E.K.; Utzinger, J. Spatially-explicit risk profiling of Plasmodium falciparum infections at a small scale: A geostatistical modelling approach. Malar. J. 2008, 7, 111. [Google Scholar] [CrossRef] [PubMed]
  62. Raso, G.; Silue, K.D.; Vounatsou, P.; Singer, B.H.; Yapi, A.; Tanner, M.; Utzinger, J.; N’Goran, E.K. Spatial risk profiling of Plasmodium falciparum parasitaemia in a high endemicity area in Cote d’Ivoire. Malar. J. 2009, 8, 252. [Google Scholar] [CrossRef] [PubMed]
  63. Giardina, F.; Gosoniu, L.; Konate, L.; Diouf, M.B.; Perry, R.; Gaye, O.; Faye, O.; Vounatsou, P. Estimating the burden of malaria in Senegal: Bayesian zero-inflated binomial geostatistical modeling of the MIS 2008 data. PLoS ONE 2012, 7, e32625. [Google Scholar]
  64. Raso, G.; Schur, N.; Utzinger, J.; Koudou, B.G.; Tchicaya, E.S.; Rohner, F.; N’Goran, E.K.; Silue, K.D.; Mattys, B.; Assi, S.; et al. Mapping malaria risk among children in Cote d’Ivoire using Bayesian geo-statistical models. Malar. J. 2012, 11, 160. [Google Scholar] [CrossRef] [PubMed]
  65. Gemperli, A.; Sogoba, N.; Fondjo, E.; Mabaso, M.; Bagayoko, M.; Briet, O.J.; Anderegg, D.; Liebe, J.; Smith, T.; Vounatsou, P. Mapping malaria transmission in West and Central Africa. Trop. Med. Int. Health 2006, 11, 1032–1046. [Google Scholar] [CrossRef] [PubMed]
  66. Wardlow, B.D.; Egbert, S.L.; Kastens, J.H. Analysis of time-series MODIS 250 m vegetation index data for crop classification in the U.S. Central Great Plains. Remote Sens. Environ. 2007, 108, 290–310. [Google Scholar] [CrossRef]
  67. Jiang, Z.; Huete, A.R.; Didan, K.; Miura, T. Development of a two-band enhanced vegetation index without a blue band. Remote Sens. Environ. 2008, 112, 3833–3845. [Google Scholar] [CrossRef]
  68. Walz, Y.; Wegmann, M.; Dech, S.; Raso, G.; Utzinger, J. Risk profiling of schistosomiasis using remote sensing: Approaches, challenges and outlook. Parasites Vectors 2015, 8. [Google Scholar] [CrossRef] [PubMed]
  69. Machault, V.; Vignolles, C.; Borchi, F.; Vounatsou, P.; Pages, F.; Briolant, S.; Lacaux, J.P.; Rogier, C. The use of remotely sensed environmental data in the study of malaria. Geospat. Health 2011, 5, 151–168. [Google Scholar] [CrossRef] [PubMed]
  70. Roll Back Malaria. Roll Back Malaria Progress and Impact Series: Focus on Swaziland; Roll Back Malaria: Geneva, Swaziland, 2014. [Google Scholar]
  71. Maidment, R.I.; Grimes, D.; Allan, R.P.; Tarnavsky, E.; Stringer, M.; Hewison, T.; Roebeling, R.; Black, E. The 30 year TAMSAT African rainfall climatology and time series (TARCAT) data set. J. Geophys. Res. Atmos. 2014, 119. [Google Scholar] [CrossRef]
  72. Tarnavsky, E.; Grimes, D.; Maidment, R.; Black, E.; Allan, R.P.; Stringer, M.; Chadwick, R.; Kayitakire, F. Extension of the TAMSAT satellite-based rainfall monitoring over Africa and from 1983 to present. J. Appl. Meteorol. Climatol. 2014, 53, 2805–2822. [Google Scholar] [CrossRef]
  73. Hutchinson, M.; Nix, H.; McMahon, J.; Ord, K. Africa—A Topographic and Climate Database (CD-ROM); The Australian National University: Canberra, Australia, 1996. [Google Scholar]
  74. World Resources Institute. African Data Sampler (CD-ROM), 1st ed.; World Resources Institute: Washington, DC, USA, 1995. [Google Scholar]
  75. Hay, S.I.; Snow, R.W.; Rogers, D.J. Predicting malaria seasons in Kenya using multitemporal meteorological satellite sensor data. Trans. R. Soc. Trop. Med. Hyg. 1998, 92, 12–20. [Google Scholar] [CrossRef]
  76. Stefani, A.; Dusfour, I.; Cruz, M.C.B.; Dessay, N.; Galardo, A.K.R.; Galardo, C.D.; Girod, R.; Gomes, M.S.M.; Gurgel, H.; Lime, A.C.F.; et al. Land cover, land use and malaria in the Amazon: A systematic literature review of studies using remotely sensed data. Malar. J. 2013, 12. [Google Scholar] [CrossRef] [PubMed]
  77. Britch, S.C.; Linthicum, K.J.; Anyamba, A.; Tucker, C.J.; Pak, E.W.; Maloney, F.A., Jr.; Cobb, K.; Stanwix, E.; Humphries, J.; Spring, A.; et al. Satellite vegetation index data as a tool to forecast population dynamics of medically important mosquitoes at military installations in the continental United States. Mil. Med. 2008, 173, 677–683. [Google Scholar] [CrossRef] [PubMed]
  78. Matsushita, B.; Yang, W.; Chen, J.; Onda, Y.; Qiu, G. Sensitivity of the Enhanced Vegetation Index (EVI) and Normalized Difference Vegetation Index (NDVI) to topographic effects: A case study in high-density cypress forest. Sensors 2007, 7, 2636–2651. [Google Scholar] [CrossRef]
  79. Huete, A.; Didan, K.; Miura, T.; Rodriguez, E.P.; Gao, X.; Ferreira, L.G. Overview of the radiometric and biophysical performance of the MODIS vegetation indices. Remote Sens. Environ. 2002, 83, 195–213. [Google Scholar] [CrossRef]
  80. Gebreslasie, M.; Naidoo, I. Earth Observation in Malaria Vector Control and Management: South African Medical Research Council (SAMRC) 2011; Report No. 262887; Medical Research Council: Durban South, Africa, 2011. [Google Scholar]
  81. Franke, J.; Gebreslasie, M.; Bauwens, I.; Deleu, J.; Siegert, F. Earth observation in support of malaria control and epidemiology: MALAREO monitoring approaches. Geospat. Health 2015, 10. [Google Scholar] [CrossRef] [PubMed]
  82. National Aeronautics and Space Administration. Reverb Echo. Available online: http://reverb.echo.nasa.gov/reverb/#utf8=%E2%9C%93&spatial_map=satellite&spatial_type=rectangle (accessed on 10 December 2014).
  83. Zhang, Z.; Ward, M.; Gao, J.; Wang, Z.; Yao, B.; Zhang, T.; Jiang, Q. Remote sensing and disease control in China: Past, present and future. Parasites Vectors 2013, 6. [Google Scholar] [CrossRef] [PubMed]
  84. McCulloch, C.E.; Searle, S.R.; Neuhaus, J.M. Generalized Linear Mixed Models, 2nd ed.; Wiley: New York, NY, USA, 2008. [Google Scholar]
  85. Chatfield, C. The Analysis of Time Series: An Introduction, 6th ed.; CRC Press: Boca Raton, FL, USA, 2003. [Google Scholar]
  86. De Jong, R.M.; Davidson, J. Consistency of kernel estimators of heteroscedastic and autocorrelated covariance matrices. Econometrica 2000, 68, 407–423. [Google Scholar] [CrossRef]
  87. Zinszer, K.; Verma, A.D.; Charland, K.; Brewer, T.F.; Brownstein, J.S.; Sun, Z.; Buckeridge, D.L. A scoping review of malaria forecasting: Past work and future directions. BMJ Open 2012, 2. [Google Scholar] [CrossRef] [PubMed]
  88. Sternberg, R.J.; Grigorenko, E.L. The General Factor of Intelligence: How General Is It? Erlbaum Associates Pulishers: Mahwah, NJ, USA, 2002. [Google Scholar]
Figure 1. Flow chart of publication screening and selection processes.
Ijerph 13 00584 g001
Figure 2. Map of SSA showing the study regions.
Ijerph 13 00584 g002
Figure 3. Malaria risk stratification of SSA (MARA/ARMA [34]).
Ijerph 13 00584 g003
Table 1. Overview of studies that used RS-derived climatic variables and malaria epidemiological data in East Africa.
Reference(s)Study Area(s)Malaria Epidemiological DataClimatic/Environmental Data Gotten via RS TechnologyEnvironmental/Climatic Data from Other SourcesStatistical Method(s)Main Findings
Climatic/Environmental Data Source(s) of RS Data
[44]Kenya: Western KenyaMonthly inpatient confirmed casesMultivariate El Nino Southern Oscillation Index (MENSOI)NOAAMonthly rainfall, mean monthly temperature Time-series technique of spectral density analysis (SDA)MENSOI did not influence teleconnection with monthly malaria incidence.
[39]KenyaHistoric malaria distribution mapsNDVI, MIR, LSTNOAA-AVH R, Meteosat, USGS-DEM-Temporal Fourier analysis (TFA), discriminant analysisLST was noted to be the best predictor of malaria transmission intensity. NDVI and CCD were identified as secondary predictors of transmission intensity. Altitude significantly improved the predictions.
UgandaCCD,
Tanzaniaaltitude
[45]Kenya: Kisii Central, Gucha, Nandi, and KerichoMalaria cases (outpatients)RFEUSGSSeasonal climate forecastWHO quartile, Cullen and cumulative sum (C-SUM) epidemic detection methodsRainfall was able to forecast an epidemic one month in advance, but the outcome of seasonal climate forecast was erroneous and unreliable.
[24]Kenya: Kisii Central, Gucha, Nandi, and KerichoMalaria cases (outpatients)RFEUSGSSeasonal climate forecastWHO quartile, Cullen and C-SUM epidemic detection methodsSeasonal climate forecasts did not predict the heavy rainfall. Rainfall estimates gave timely and reliable early warning, but monthly surveillance of malaria cases gave no effective warning.
[38]KenyaMalaria cases (outpatients)Maximum temperature, minimum temperature and monthly rainfallNational Climate data Centre, NOAA-t-test, WHO Cullen epidemic detection methods, forward stepwise regressionMalaria incidence was significantly associated with monthly rainfall and maximum and minimum temperature at a time lag of 1–2 and 2–5 months, respectively.
Ethiopia
Uganda
[40]Kenya
Uganda
Tanzania
Malariometric data from Mapping Malaria Risk in Africa (MARA/ARMA) (children between 0 and 15 years)NDVI, MIR, LST
CCD,
altitude,
land cover
NOAA-AVHRR, Meteosat,
USGS-DEM, Landsat TM
TFA, discriminant analysisNDVI, CCD and water body area were associated with malaria in the dry Ecozone 1. In Ecozone 2 where it was assumed that water was not generally limiting, LST and MIR were most abundant among the predictor variables selected.
[43]EritreaMonthly clinical malaria casesRFE, NDVICMAP, NOAA-AVHRRInterpolated rainfall gauge dataSpearman and Pearson rank correlations, principal component analysis (PCA), non-hierarchical clustering analysis.NDVI anomalies were highly correlated with malaria incidence anomalies, particularly in the semi-arid north of the country and along the northern Red Sea coast, which is a highly epidemic-prone area. CMAP rainfall correlated with malaria incidence anomalies, with a lead time of 2–3 months; while weather station rainfall correlated with malaria anomalies with a lag of 2 months.
[42]Burundi: KaruziMonthly inpatient confirmed and unconfirmed casesNDVIAVHRR-NOAARainfall, minimum and maximum temperatureARIMANDVI, rainfall, mean maximum temperature and number of cases constituted the formation of the best predicting model (R2adj = 82%, p < 0.0001 and 93% forecasting accuracy in the range ±4 cases per 100 inhabitants). NDVI, rainfall and maximum temperature were noted to correlate with malaria cases.
[25]EritreaMonthly clinical malaria casesRFE, NDVICMAP NOAA-AVHRR Regression analysisThe Poisson regression analysis showed that CMAP rainfall estimates were significantly associated with malaria with a lead time of 2–3 months in Gash Barka. NDVI showed a similar relationship in Anseba.
[46]SomaliaSurvey of P. falciparum parasite rate (PfPR)EVIMODISPrecipitation, temperature, distance to permanent water bodiesLogistic regression models, kriging, Bayesian binomial generalized linear geostatistical modelsThe non-spatial bivariate logistic regression analysis showed that EVI, precipitation, maximum and minimum temperature and distance to water were highly significantly associated with PfPR. After employing the above covariates in the multivariate Bayesian geostatistical model, only temperature and precipitation remained significant (odds 95% confidence interval (CI)) at the southern part of Somalia.
[47]Kenya: Nandi and KisiiConfirmed and unconfirmed, monthly inpatient and outpatient casesDipole mode index (DMI), El Nino-Southern Oscillation (ENSO) index Nino 3 region (NINO3)NOAARainfallTime series regression, Poisson generalized linear model (GLM), Pearson’s correlationNo strong association was found between NINO3 and the number of malaria cases after adjusting for the effect of DMI. Malaria cases increased by 3.4%–17.9% for each 0.1 increase above a DMI threshold value lagged at 3–4 months. Malaria cases increased by 1.4%–10.7% for each 10-mm increase in monthly rainfall lagged at 1–3 months.
[48]TanzaniaSurvey of confirmed malaria cases among children less than 5 years oldLST, NDVI, altitudeMODIS
DEM-USGS
Rainfall, permanent water bodiesMultivariate logistic regression, Bayesian krigingThe bivariate analyses showed that altitude was negatively associated with malaria risk at the 5% significance level, indicating that children at above 1500 m had a lower risk of malaria. Rainfall, NDVI, day and night LST were positively associated with parasitemia risk.
[20]Ethiopia: Amhara regionMonthly confirmed outpatients casesLST, NDVI, enhanced vegetation index (EVI), actual evapotranspiration (ETa), RFEMODIS
TRMM, NASA, and the Japan Aerospace
Exploration Agency (JAXA)
Seasonal autoregressive integrated moving average (SARIMA)RFE, EVI, LST and ETa served as suitable malaria predictor as they improved the model fit, and they revealed a lagged positive association with malaria cases. ETa, which was utilized in malaria epidemiological study for the first time, showed a significant positive correlation with malaria at lags from 1–3 months in 3 of the 12 sites studied. EVI had a 3-month lag at 3 sites, while rainfall lagged by 1–3 months at 5 sites. LST exhibited a positive association lagged by 1–6 month at 6 sites.
[49]SomaliaSurvey of PfPR data among children of 2 to less than 10 yearsEVIMODISAnnual mean precipitation, temperature suitability index (TSI), distance to larva breeding sites.Linear regression, Space-time model-based geostatistical (MBG) methodThe inclusion of 1 km2 MODIS EVI (odds ratio (OR) = 0.81, 95% CI = 0.19–1.44, p-value = 0.011) and other covariates (precipitation, floodplains, distance to main water bodies) in the analysis served as the best predictor for PfPR.
Table 2. Overview of studies that used RS-derived climatic variables and malaria epidemiological data in Southern Africa.
Reference(s)Study Area(s)Malaria Epidemiological DataClimatic/Environmental Data Obtained via RS TechnologyEnvironmental/Climatic Data from Other SourcesStatistical Method(s)Main Findings
Climatic/Environmental Data Source(s) of RS Data
[50]ZimbabweMonthly confirmed and unconfirmed cases (children less than 5 years old)NDVINOAA-AVHRRRainfall, maximum temperature, minimum temperature, vapor pressureBayesian Poisson modelVapor pressure, rainfall, mean monthly (28–32 °C) and maximum temperature (24–28 °C), showed a significant positive correlation with malaria incidence, while NDVI, high monthly maximum and minimum temperatures showed a negative association.
[51]BotswanaConfirmed malaria incidence dataRFE, sea surface temperature (SST)CMAP Stepwise regression, Spearman’s rank order, Pearson’s product moment correlation, quadratic test, logistic regression, Mann–Whitney U-testsNegative anomalies of December–January SSTs were significantly associated with December–January rainfall estimates (Pearson’s R = −0.55 (−0.76 to −0.22) and Spearman’s R = −0.59 (−0.81 to −0.18)), as well as with the standardized malaria incidence anomalies and accounted for nearly 25% of the inter-annual variance in malaria incidence.
[52]ZimbabweAnnual confirmed and unconfirmed malaria case (children less than 5 years old)NDVINOAA-AVHRR (NASA) Rainfall, vapor pressure, mean temperature, maximum temperature, minimum temperatureMarkham’s seasonality index, Negative binomial regression analysis, Bayesian negative binomial modelsIn the bivariate analysis NDVI, vapor pressure, rainfall, average monthly (28 °C–32 °C) and maximum (24 °C–29 °C) temperature range revealed a significant positive correlation (p < 0.001) with malaria incidence. After employing the spatiotemporal model, NDVI became insignificant.
[53]BotswanaConfirmed malaria incidence dataRFECMAPSSTProbabilistic prediction, Kolmogorov–Smirnov test, quadratic testHigher than expected malaria years were associated with above-average rainfall, while the lowest malaria years were associated with below average rainfall.
[54]BotswanaMalaria prevalence data (children between 1 and 14 years age)NDVI, RFENOAA-AVHRR, CMAPElevation, surface water land cover, temperature vapor pressure Univariate logistic regression analysis, stepwise bootstrap methodRFE (OR = 2.01, 95% CI = 1.47–2.70), annual mean temperature (OR = 5.75, 95% CI = 4.14–8.08) and elevation (OR = 1.82, 95% CI = 1.49–2.22) were significantly associated with malaria prevalence after allowing for spatial correlation.
[28]AngolaSurvey of confirmed malaria cases (children less than 5 years old)Day LST, night LST, NDVI, altitude MODIS, USGS-DEMRainfallBayesian logistic regression, Bayesian krigingNDVI (95% CI = 6.28, 17.94; OR = 10.62) and rainfall (95% CI = 6.00, 19.43; OR = 10.80) showed a significantly positive relationship with malaria incidence after carrying out a bivariate analysis.
[55]ZambiaSurvey of confirmed malaria cases among children less than 5 years oldDay LST, night LST, NDVI, land cover, altitudeMODIS, USGS-DEMRFE, water bodies (lakes, rivers and wetlands)Lag time analysis, bivariate and multiple geostatistical logistic regression analysis, Bayesian krigingNDVI, night LST at 1-km2 spatial resolution and rainfall within the last 2.7 months showed positive significant association, while day LST reflected a significant negative relationship.
[56]Namibia: Northern NamibiaMonthly confirmed malaria casesEVI, precipitationMODIS, TRMM-NASA and JAXATemperature suitability index (TSI) Non-spatial Poisson regression, Bayesian spatio-temporal zero-inflated conditional autoregressive (CAR) model, zero-Inflated Poisson (ZIP) modelInitially, the univariate non-spatial regression analysis indicated that the EVI (coefficient of regression, 95% CI: 6.55, 4.25–8.87, p < 0.001), the temperature suitability index acquired from the Malaria Atlas project (7.57, 5.34–9.96, p < 0.001) and precipitation (0.02, 0.01–0.03, p = 0.002) were significant predictors. However, after employing the best performing predictive model (the multivariate model), only EVI (coefficient of regression, 95% CI: 14.29, 9.24–19.42, p < 0.001) was positively correlated.
[57]SwazilandMonthly confirmed malaria cases (imported and locally-acquired)NDVI, NDWI, elevation, TWILandsat-7 ETM+, SRTMTemperature, rainfall, distance to nearest water bodySatterthwaite t-tests, logistic regression mixed model, random forestCase households during the high transmission season tended to be located in areas of lower elevation, closer to bodies of water, in more sparsely-populated areas, with lower rainfall and warmer temperatures and closer to imported cases than random background points (all p < 0.001). In relation to model accuracy, NDWI was the most important RS-derived variable followed by NDVI and, lastly, TWI.
[58]MalawiMonthly confirmed and unconfirmed casesPrecipitation, altitudeNOAA Climate Prediction Centre SRTMtemperatureNegative binomial generalized linear model (GLM), generalized linear mixed model (GLMM), Kernel densityThe negative binomial with only fixed effects was used to determine the best time lags between climatic variables and malaria. It showed that at the 0.05 significance level, precipitation and temperature were statistically significant at Lag 1–3. The maximum relative malaria risk is observed to be the maximum temperature of 28 °C and precipitation of 6.24 mm·day−1.
[26]Zambia: Southern ProvinceWeekly confirmed malaria casesRainfall, NDVI, DWP, LST, elevationTAMSAT, MODIS, ASTER-Kruskal-Wallis tests, Ljung–Box Q statistics, Kriging, ARIMAXNDVI, DWP and night LST were the highly significant predictors at the high and low malaria transmission malaria zones partitioned in the study area.
Table 3. Overview of studies that used RS-derived climatic variables and malaria epidemiological data in West Africa.
Reference(s)Study Area(s)Malaria Epidemiological DataClimatic/Environmental Data Gotten via RS TechnologyEnvironmental/Climatic Data from Other SourcesStatistical Method(s)Main Findings
Climatic/Environmental Data Source(s) of RS Data
[59]MaliMalaria prevalence data extracted from the MARA/ARMA databaseNDVINOAA-AVHRRRainfall, average maximum temperature, average minimum temperature, distance to the nearest water bodyLogistic regression analysis, krigingMean NDVI from June–November (wet season), mean maximum temperature from March–May, months with more than 60 mm of rainfall and distance to water bodies were the significant independent variables for predicting malaria prevalence.
[60]MaliMalaria prevalence data extracted from the MARA/ARMA databaseNDVINOAA/NASA-AVHRRTemperature, duration of rainy season, distance to waterGarki mode, Bayesian models and krigingDuring the raining season, NDVI and temperature had no statistical relationship with entomological inoculation rate (EIR). Distance to water was significantly related to transmission intensity, indicating high transmission in the areas within 4 km of the water source.
[27]MaliMalaria prevalence data from the MARA/ARMA database (children between 1 and 10 years old) NDVINASA-AVHRRTemperature, rainfall, water bodies, season lengthBayesian logistic regression, Bayesian non-stationary model, Bayesian krigingThe non-stationary model showed that NDVI and minimum temperature had a positive statistical relationship with malaria risk, awhile rainfall had a negative statistical relationship.
[61]Côte d’Ivoire: ManConfirmed P. falciparum survey in children between 6 and 16 yearsNDVI, LST, RFEMODIS-USGS Meteosat 7Distance to the nearest riverBivariate logistic regression modelsIn bivariate non-spatial models, NDVI, RFE and distance to rivers, were significantly associated with a P. falciparum infection. However, after employing the spatial correlation, NDVI showed only a ‘borderline’ significance with P. falciparum prevalence.
[23]Mali: BancoumanaConfirmed P. falciparum survey in children between 0 and 12 yearsNDVINOAA-AVHRR ARIMAThe seasonal analytical approach revealed that the seasonality of P. falciparum incidence was significantly explained by NDVI with s 15-day lag (p = 0.001). The NDVI threshold was 0.361 (p = 0.007).
[6]West AfricaMARA/ARMA Malaria prevalence date among children between 1 and 10 yearsNDVI, land useNOAA-AVHRR USGSTemperature, rainfall, soil water storage index (SWS), water bodies, agro-ecological zonesLogistic regression model, non-parametric regression models NDVI was not associated with malaria in any of the four defined agro-ecological zones (Equatorial forest, Guinea savannah, Sahel region, Sudanese savannah).
[62]Côte d’Ivoire: ManSurvey of confirmed malaria cases among school children of Grades 3–5NDVI, LST, RFE DEMMODIS-USGS Meteosat 7 SRTM Bayesian negative binomial regression models, Bayesian krigingThe bivariate non-spatial analysis identified NDVI, RFE, LST and close proximity to standing water (rivers, swamps and irrigated fields) as significant risk malaria factors. After employing the spatial analyses, only mean RFE remained significant over the malaria transmission season (June–August).
[63]SenegalSurvey of confirmed malaria cases among children less than 5 years oldDay LST, night LST, NDVI, altitudeMODIS USGS-DEMRainfall, permanent rivers and lakesBayesian geostatistical zero-inflated binomial (ZIB), Bayesian krigingNight LST (OR 1.16; 95% CI (0.66, 1.86)) and NDVI (OR 1.48; 95% CI (0.88, 2.48)) were noted to have a positive association with malaria parasitemia.
[64]Côte d’IvoireMalaria prevalence data for children aged less than 16 yearsLST, NDVI ElevationMODIS, USGS-DEMRainfall, distance to the nearest water bodyBinomial regression models, Bayesian non-spatial and geo-statistical logistic regression models, Bayesian krigingIn the non-stationary spatial model (the best model), the covariates rainfall (OR = 0.76; Bayesian credible interval (BCI) = 0.70, 0.83) and maximum LST (OR = 0.72; BCI = 0.64, 0.79) were significantly negatively associated with Plasmodium prevalence.
Table 4. Overview of a study that used RS-derived climatic variables and malaria epidemiological data covering Central and Western Africa.
Reference(s)Study Area(s)Malaria Epidemiological DataClimatic/Environmental Data Gotten via RS TechnologyEnvironmental/Climatic Data from Other SourcesStatistical Method(s)Main Findings
Climatic/Environmental Data Source(s) of RS Data
[65]West Africa and Central AfricaMalaria prevalence data extracted from the MARA/ARMA databaseNDVI, land useNASA-AVHRR USGS-NASATemperature, rainfall, soil water storage index, water bodies, agro-ecological zones, transmission seasonalityMultivariate analysis, Garki model, Bayesian linear geostatistical model, Bayesian krigingNDVI, distance from water, length of season, rainfall and maximum temperature correlated significantly with malaria transmission intensity and were included in the best fitting model. NDVI had a significant positive association with malaria transmission, except for areas distant from water bodies. This negative association between malaria transmission and distance to water was observed in regions with NDVI values greater than 0.6.
Table 5. Commonly-used RS variables in SSA.
RS VariablesDescriptionSources
NDVIThis is an indicator of the greenness of the biomass and varies between −1 and +1. It is calculated as [66,67]: ( NIR Red ) ( NIR +   Red ) MODIS, NOAA-AVHRR
LST (day and night)This can be estimated from thermal infrared sensors. It is sensitive to the thermal characteristics of the ground and atmospheric effects of spectral radiation [68]. MODIS, NOAA-AVHRR
RFE/CCDThis provides indirect estimates of rainfall based on the detection of precipitation particles or the duration a cloud top is below a threshold temperature [69].TRMM, CMAP, Meteosat
EVIEVI provides an alternative to NDVI because it improves sensitivity over areas of denser vegetation. It is calculated as [66]: G   ( NIR Red ) ( NIR + C 1   × Red C 2 × Blue + L ) , where G is a gain factor, C1 and C2 are aerosol resistance coefficients and L is the canopy background adjustment that addresses nonlinear, differential NIR and red radiant transfer through a canopy.MODIS
Elevation/altitudeThis correlates negatively with temperature and positively with precipitation and can be applied as a surrogate indicator [69].USGS-DEM, ASTER, SRTM
Land use and land coverThis is related to the natural and physical environment and the human activities on the landscape [66].MODIS, Landsat TM, USGS-NASA
Table 6. Overview of the RS satellites/sensors used in the malaria epidemiological studies in SSA.
Satellite/SensorsSpectral RangeSpatial ResolutionRevisit TimeSwath WidthRadiometric Resolution
NOAA/NASA-AVHRR0.58–12.50 µm1.1 km12 h2900 km10 bit
MODIS0.40–14.50 µm250 m, 500 m, 1 km 1–2 days2330 km12 bit
Landsat TM 10.45–12.5 µm30 m, 120 m16 days185 km8 bit
Landsat-7 ETM+ 20.45–12.5 µm15 m, 30 m, 60 m16 days185 km9 bit (8 bit transmitted)
Meteosat 1–70.50–12.5 µm2.5 km, 5 km30 min-8 bit
Meteosat 8–100.40–14.40 µm1 km, 3 km15 min 10 bit
TRMMVIRS 3: 0.63 µm, 1.60 µm,
3.75 µm, 10.7 µm, and 12 µm
VIRS: 2 km
TMI 4: 5–45 km
PR 5: 4.3 km
3 hourly, daily, monthly VIRS: 720 km
TMI: 780 km
PR: 215 km
-
SRTM-30 m16 times per dayC-radar: 225 km
X-radar: 50 km
C-radar: 8 bit
X-radar: 6 bit
ASTERVNIR 6: 0.52–0.86 µm
SWIR 7: 1.60–2.43 µm
TIR 8: 8.125–11.65 µm
VNIR: 15 m
SWIR: 30 m
TIR: 90 m
5 days
16 days
16 days
60 km
60 km
60 km
VNIR: 8 bit
SWIR: 8 bit
TIR: 12 bit
CMAP-0.25° × 0.25°5 days, monthly--
1 Thematic Mapper; 2 Enhanced Thematic Mapper plus; 3 Visible Infrared Scanner; 4 TRMM Microwave Imager; 5 Precipitation Radar; 6 Visible Near Infrared; 7 Shortwave Infrared; 8 Thermal Infrared.
Table 7. Overview of new generation RS satellites/sensors with improved characteristics for malaria modelling.
Satellite/SensorsSpectral RangeSpatial ResolutionRevisit TimeSwath WidthRadiometric Resolution
Landsat-80.43–12.5 µm15 m, 30 m, 100 m16 days185 km12 bit
Copernicus: Sentinel-20.43–2.28 µm10 m, 20 m, 60 m5 days290 km12 bit
GPM-250 m, 500 m3 h120 km, 245 km, 885 km-
SMAP-3 km, 10 km, 40 km2 days, 3 days1000 km -
SPOT 6 and SPOT 70.45–0.89 µm1.5 m, 2 m, 6 m, 8 m1–5 days60 km 12 bit

