Integrative Transcriptome Analyses of the Human Fallopian Tube: Fimbria and Ampulla—Site of Origin of Serous Carcinoma of the Ovary

 ,
,
Abstract
: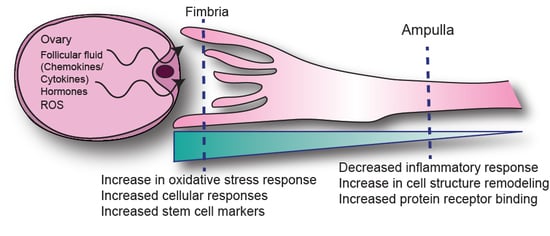
1. Introduction
2. Results
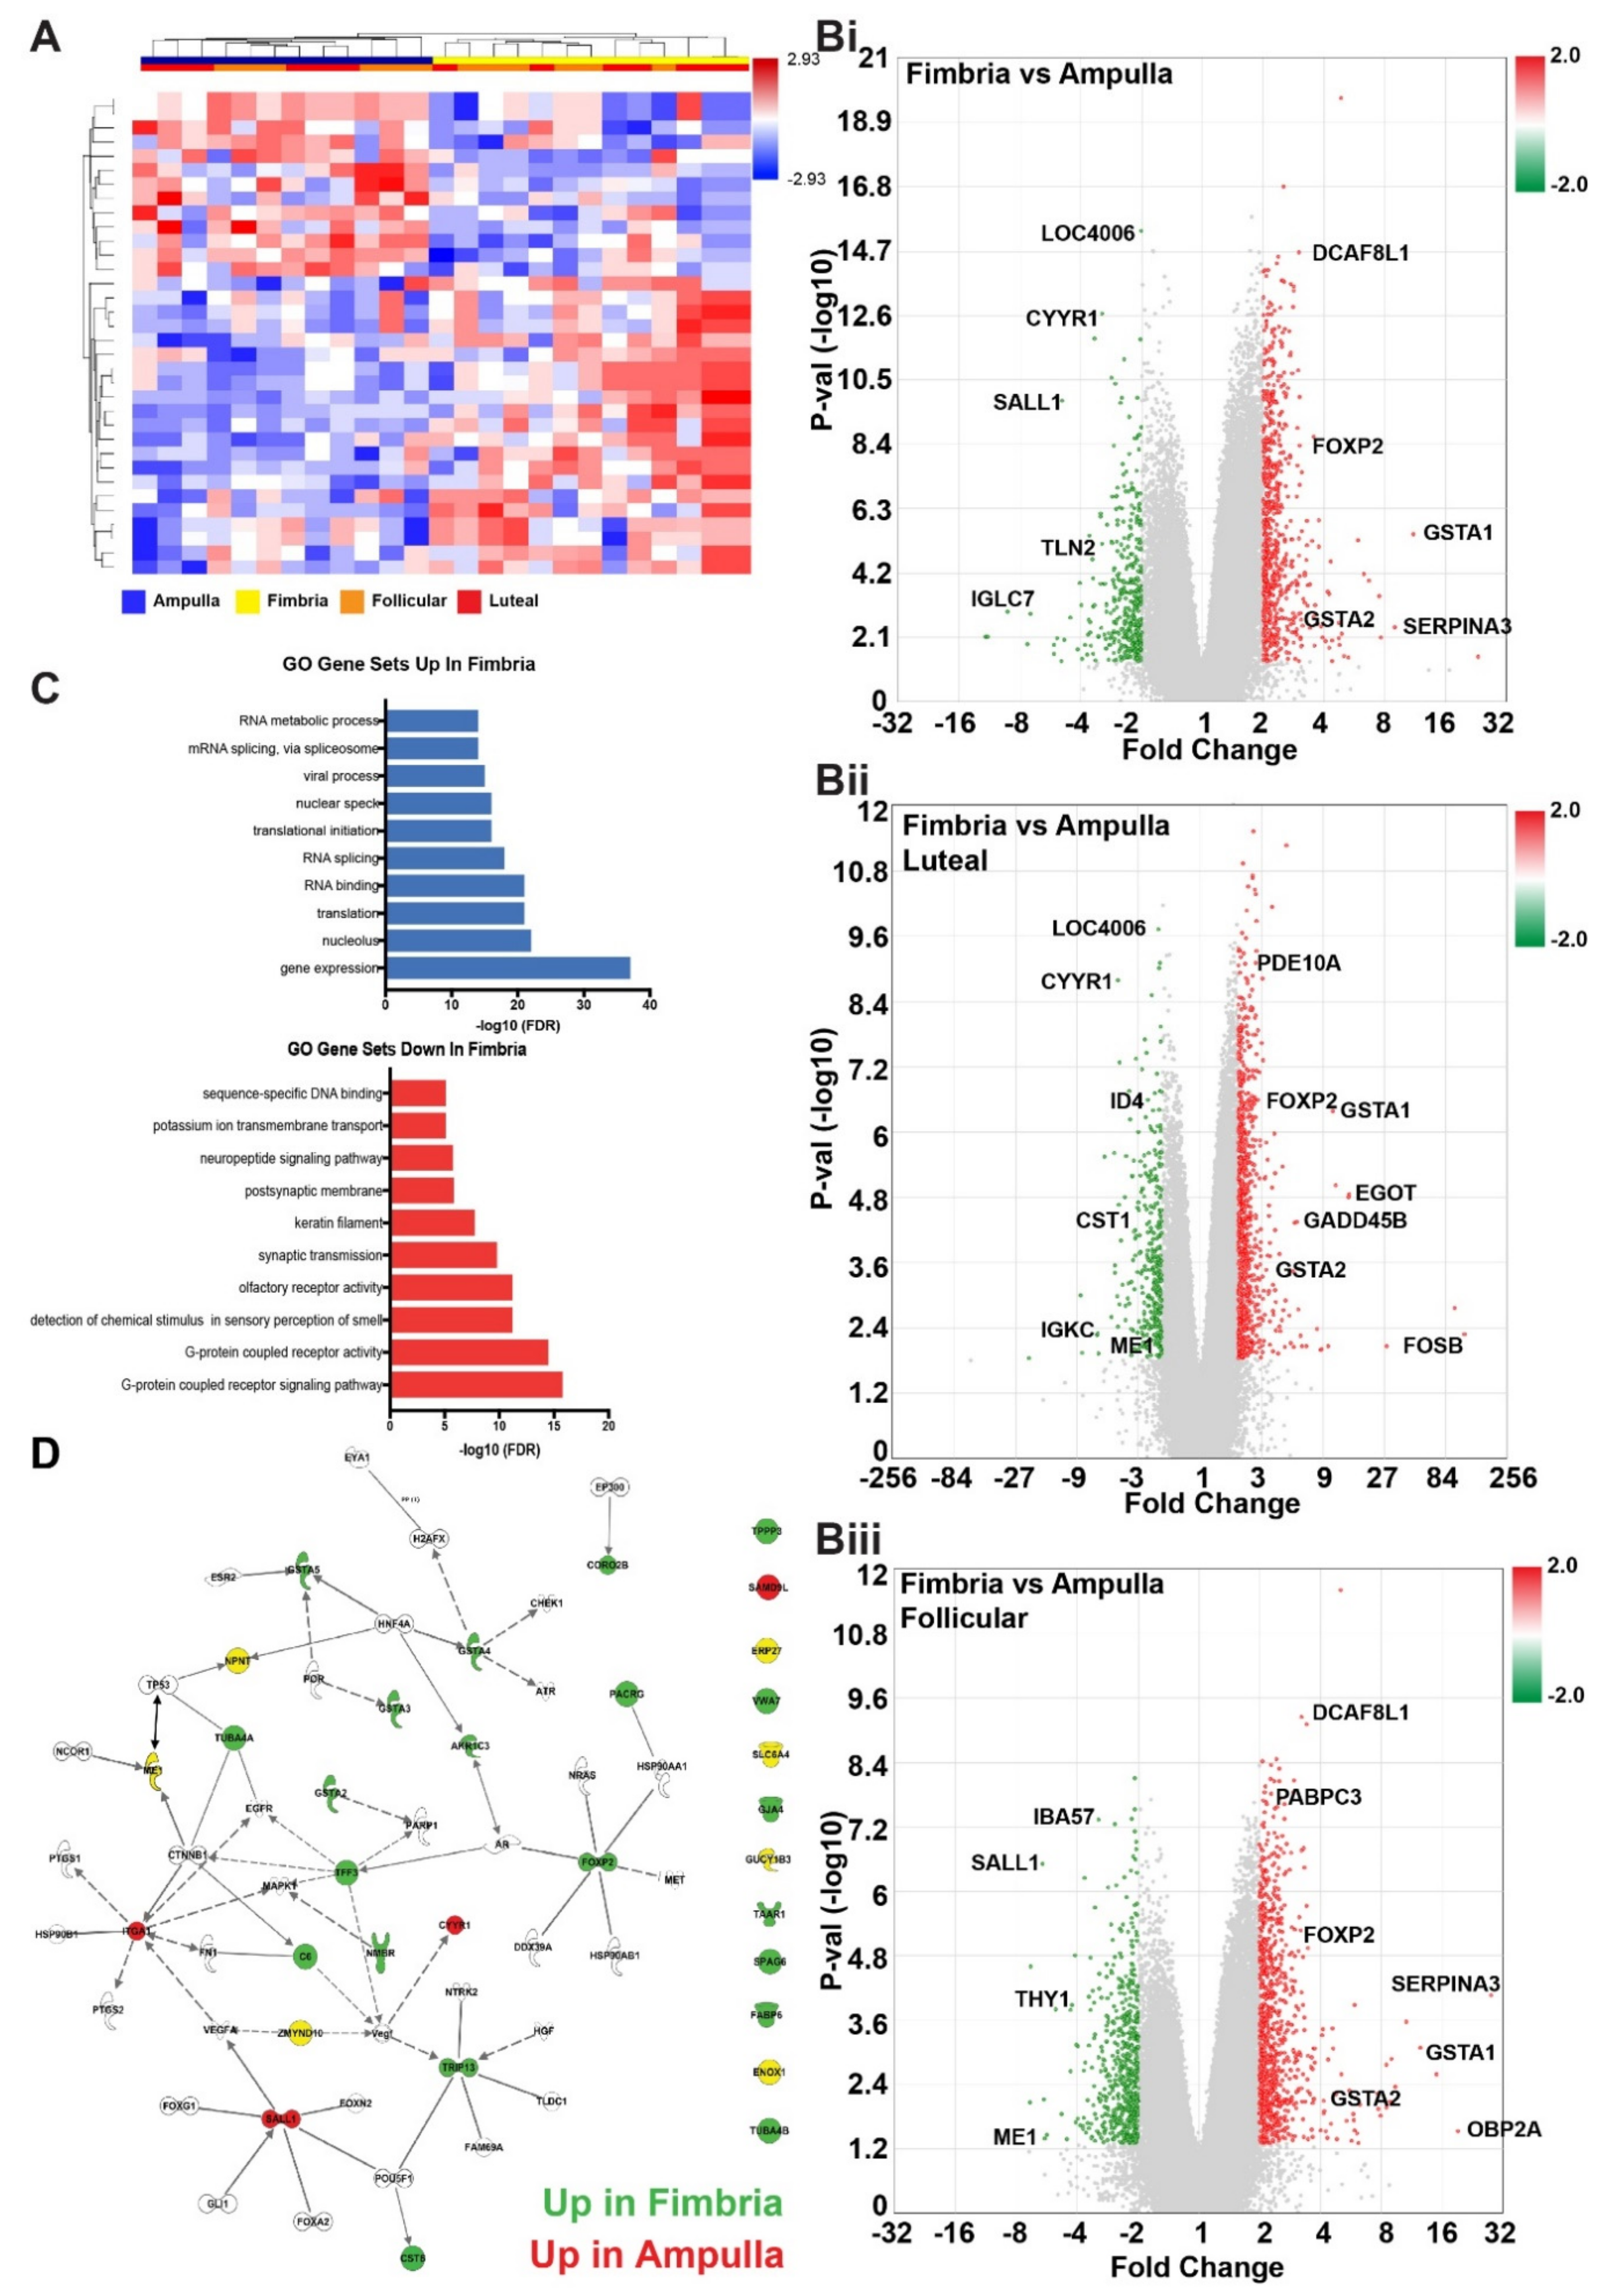
2.1. Transcriptional Profiles Discovery of Differentially Expressed Genes in Fimbria and Ampulla by Ovulatory Phase
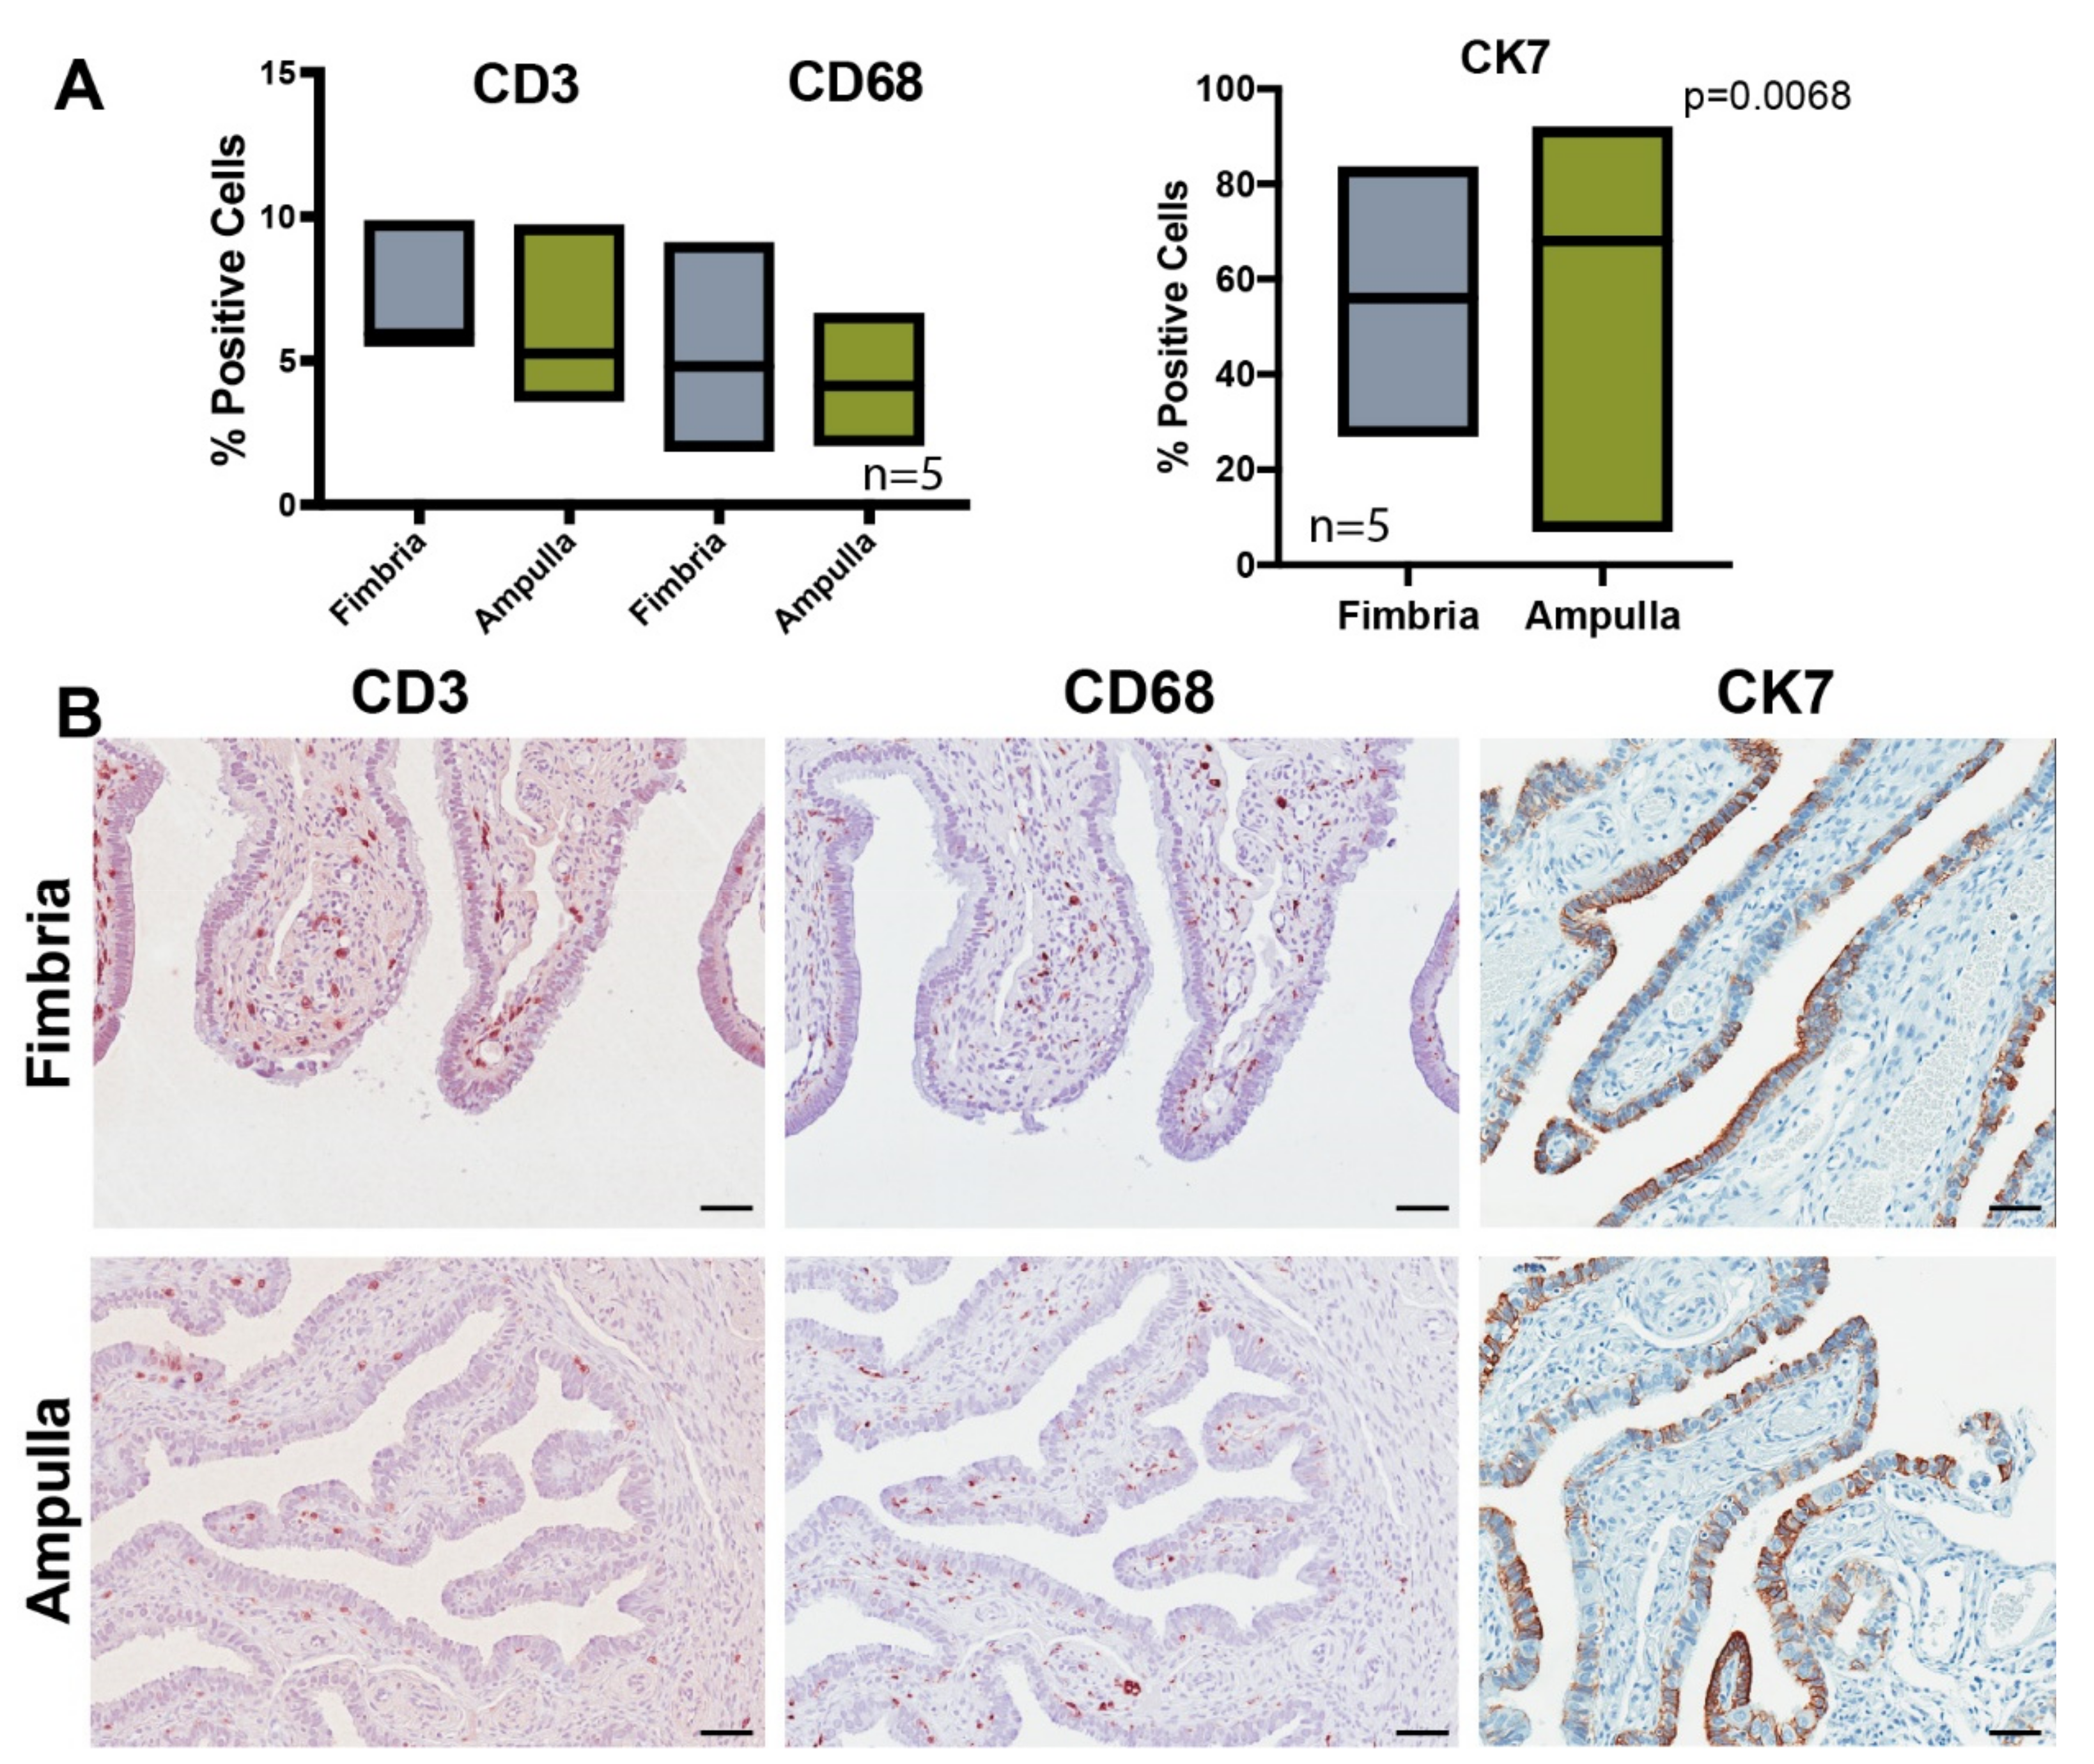
2.2. Anatomic Differences in Gene Expression in the FTE
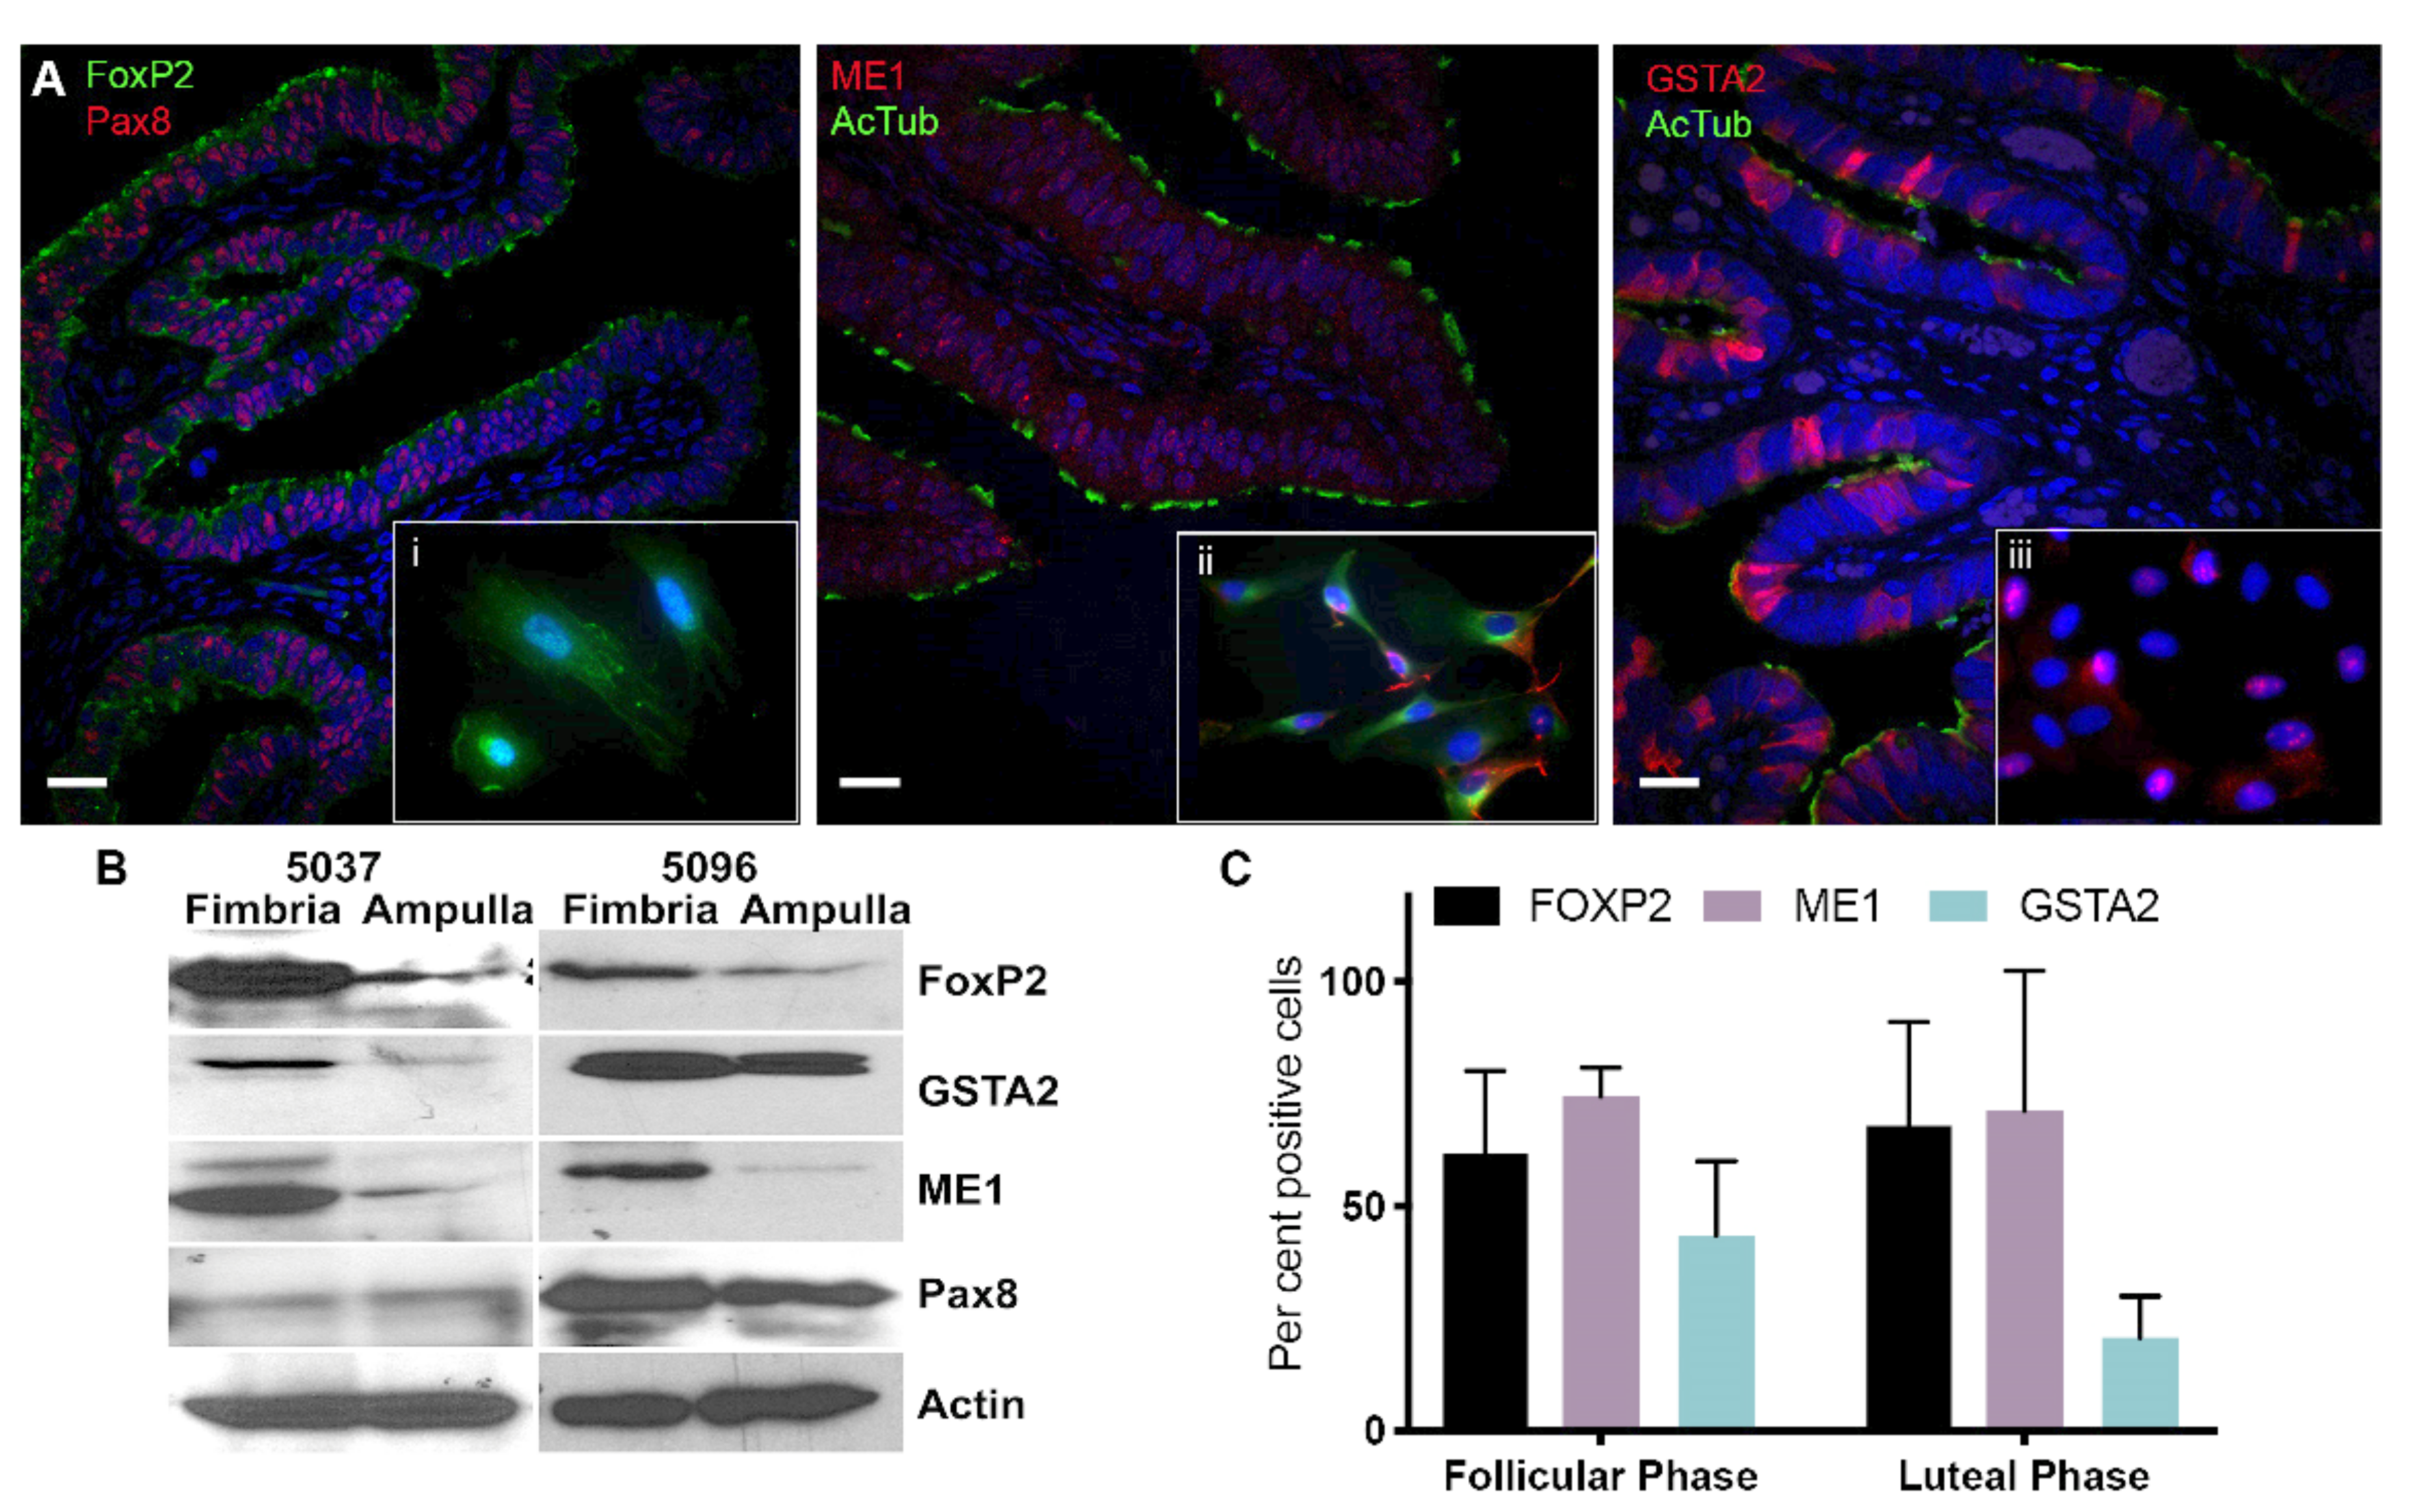
2.3. Validation of Differentially Expressed Genes in the Fimbria and Ampulla
3. Discussion
4. Materials and Methods
4.1. Case Collection
4.2. Laser Capture Microdissection and RNA Extraction
4.3. Immunohistochemistry
4.4. Immunofluorescence
4.5. Cell Culture and Western Blot Analysis
4.6. Gene Expression Analysis
4.7. Comparative Analyses
5. Conclusions
Supplementary Materials
Author Contributions
Funding
Acknowledgments
Conflicts of Interest
References
- Ducie, J.; Dao, F.; Considine, M.; Olvera, N.; Shaw, P.A.; Kurman, R.J.; Shih, I.M.; Soslow, R.A.; Cope, L.; Levine, D.A. Molecular analysis of high-grade serous ovarian carcinoma with and without associated serous tubal intra-epithelial carcinoma. Nat. Commun. 2017, 8, 990. [Google Scholar] [CrossRef] [PubMed]
- Labidi-Galy, S.I.; Papp, E.; Hallberg, D.; Niknafs, N.; Adleff, V.; Noe, M.; Bhattacharya, R.; Novak, M.; Jones, S.; Phallen, J.; et al. High grade serous ovarian carcinomas originate in the fallopian tube. Nat. Commun. 2017, 8, 1093. [Google Scholar] [CrossRef]
- Kurman, R.J.; Shih, I.-M. The Dualistic Model of Ovarian Carcinogenesis: Revisited, Revised, and Expanded. Am. J. Pathol. 2016, 186, 733–747. [Google Scholar] [CrossRef] [PubMed] [Green Version]
- Wu, R.-C.; Wang, P.; Lin, S.-F.; Zhang, M.; Song, Q.; Chu, T.; Wang, B.G.; Kurman, R.J.; Vang, R.; Kinzler, K.; et al. Genomic landscape and evolutionary trajectories of ovarian cancer precursor lesions. J. Pathol. 2019, 248, 41–50. [Google Scholar] [CrossRef] [PubMed] [Green Version]
- Paik, D.Y.; Janzen, D.M.; Schafenacker, A.M.; Velasco, V.S.; Shung, M.S.; Cheng, D.; Huang, J.; Witte, O.N.; Memarzadeh, S. Stem-like epithelial cells are concentrated in the distal end of the fallopian tube: A site for injury and serous cancer initiation. Stem Cells 2012, 30, 2487–2497. [Google Scholar] [CrossRef] [PubMed] [Green Version]
- Davidson, B.; Trope, C.G.; Reich, R. The Role of the Tumor Stroma in Ovarian Cancer. Front. Oncol. 2014, 4, 104. [Google Scholar]
- Levanon, K.; Crum, C.; Drapkin, R. New insights into the pathogenesis of serous ovarian cancer and its clinical impact. J. Clin. Oncol. 2008, 26, 5284–5293. [Google Scholar] [CrossRef] [Green Version]
- Vang, R.; Shih, I.-M.; Kurman, R.J. Fallopian tube precursors of ovarian low- and high-grade serous neoplasms. Histopathology 2013, 62, 44–58. [Google Scholar] [CrossRef]
- Folkins, A.K.; Jarboe, E.A.; Saleemuddin, A.; Lee, Y.; Callahan, M.J.; Drapkin, R.; Garber, J.E.; Muto, M.G.; Tworoger, S.; Crum, C.P. A candidate precursor to pelvic serous cancer (p53 signature) and its prevalence in ovaries and fallopian tubes from women with BRCA mutations. Gynecol. Oncol. 2008, 109, 168–173. [Google Scholar] [CrossRef] [Green Version]
- Karst, A.M.; Levanon, K.; Drapkin, R. Modeling high-grade serous ovarian carcinogenesis from the fallopian tube. Proc. Natl. Acad. Sci. USA 2011, 108, 7547–7552. [Google Scholar] [CrossRef] [Green Version]
- Kindelberger, D.W.; Lee, Y.; Miron, A.; Hirsch, M.S.; Feltmate, C.; Medeiros, F.; Callahan, M.J.; Garner, E.O.; Gordon, R.W.; Birch, C.; et al. Intraepithelial carcinoma of the fimbria and pelvic serous carcinoma: Evidence for a causal relationship. Am. J. Surg. Pathol. 2007, 31, 161–169. [Google Scholar] [CrossRef] [PubMed] [Green Version]
- Jazaeri, A.A.; Bryant, J.L.; Park, H.; Li, H.; Dahiya, N.; Stoler, M.H.; Ferriss, J.S.; Dutta, A. Molecular requirements for transformation of fallopian tube epithelial cells into serous carcinoma. Neoplasia (N.Y.) 2011, 13, 899–911. [Google Scholar] [CrossRef] [Green Version]
- Perets, R.; Wyant, G.A.; Muto, K.W.; Bijron, J.G.; Poole, B.B.; Chin, K.T.; Chen, J.Y.H.; Ohman, A.W.; Stepule, C.D.; Kwak, S.; et al. Transformation of the fallopian tube secretory epithelium leads to high-grade serous ovarian cancer in Brca;Tp53;Pten models. Cancer Cell 2013, 24, 751–765. [Google Scholar] [CrossRef] [PubMed] [Green Version]
- Soong, T.R.; Kolin, D.L.; Teschan, N.J.; Crum, C.P. Back to the Future? The Fallopian Tube, Precursor Escape and a Dualistic Model of High-Grade Serous Carcinogenesis. Cancers 2018, 10, 468. [Google Scholar] [CrossRef] [Green Version]
- Cochrane, D.R.; Tessier-Cloutier, B.; Lawrence, K.M.; Nazeran, T.; Karnezis, A.N.; Salamanca, C.; Cheng, A.S.; McAlpine, J.N.; Hoang, L.N.; Gilks, C.B.; et al. Clear cell and endometrioid carcinomas: Are their differences attributable to distinct cells of origin? J. Pathol. 2017, 243, 26–36. [Google Scholar] [CrossRef] [Green Version]
- Coan, M.; Rampioni Vinciguerra, G.L.; Cesaratto, L.; Gardenal, E.; Bianchet, R.; Dassi, E.; Vecchione, A.; Baldassarre, G.; Spizzo, R.; Nicoloso, M.S. Exploring the Role of Fallopian Ciliated Cells in the Pathogenesis of High-Grade Serous Ovarian Cancer. Int. J. Mol. Sci. 2018, 19, 2512. [Google Scholar] [CrossRef] [Green Version]
- George, S.H.; Garcia, R.; Slomovitz, B.M. Ovarian Cancer: The Fallopian Tube as the Site of Origin and Opportunities for Prevention. Front. Oncol. 2016, 6, 108. [Google Scholar] [CrossRef]
- George, S.H.; Shaw, P. BRCA and Early Events in the Development of Serous Ovarian Cancer. Front. Oncol. 2014, 4, 5. [Google Scholar] [CrossRef] [Green Version]
- Sopik, V.; Iqbal, J.; Rosen, B.; Narod, S.A. Why have ovarian cancer mortality rates declined? Part I. Incidence. Gynecol. Oncol. 2015, 138, 741–749. [Google Scholar] [CrossRef]
- Jarboe, E.A.; Pizer, E.S.; Miron, A.; Monte, N.; Mutter, G.L.; Crum, C.P. Evidence for a latent precursor (p53 signature) that may precede serous endometrial intraepithelial carcinoma. Mod. Pathol. 2009, 22, 345–350. [Google Scholar] [CrossRef]
- Roh, M.H.; Kindelberger, D.; Crum, C.P. Serous tubal intraepithelial carcinoma and the dominant ovarian mass: Clues to serous tumor origin? Am. J. Surg. Pathol. 2009, 33, 376–383. [Google Scholar] [CrossRef] [PubMed]
- Bowtell, D.D.; Böhm, S.; Ahmed, A.A.; Aspuria, P.-J.; Bast, R.C., Jr.; Beral, V.; Berek, J.S.; Birrer, M.J.; Blagden, S.; Bookman, M.A.; et al. Rethinking ovarian cancer II: Reducing mortality from high-grade serous ovarian cancer. Nat. Rev. Cancer 2015, 15, 668–679. [Google Scholar] [CrossRef] [PubMed]
- Lee, Y.; Miron, A.; Drapkin, R.; Nucci, M.R.; Medeiros, F.; Saleemuddin, A.; Garber, J.; Birch, C.; Mou, H.; Gordon, R.W.; et al. A candidate precursor to serous carcinoma that originates in the distal fallopian tube. J. Pathol. 2007, 211, 26–35. [Google Scholar] [CrossRef]
- Kim, J.; Park, E.Y.; Kim, O.; Schilder, J.M.; Coffey, D.M.; Cho, C.-H.; Bast, R.C., Jr. Cell Origins of High-Grade Serous Ovarian Cancer. Cancers 2018, 10, 433. [Google Scholar] [CrossRef] [Green Version]
- Goodman, M.T.; Shvetsov, Y.B. Incidence of Ovarian, Peritoneal, and Fallopian Tube Carcinomas in the United States, 1995-2004. Cancer Epidemiol. Biomark. Prev. 2009, 18, 132–139. [Google Scholar] [CrossRef] [Green Version]
- Tone, A.A.; Begley, H.; Sharma, M.; Murphy, J.; Rosen, B.; Brown, T.J.; Shaw, P.A. Gene Expression Profiles of Luteal Phase Fallopian Tube Epithelium from BRCA Mutation Carriers Resemble High-Grade Serous Carcinoma. Clin. Cancer Res. 2008, 14, 4067–4078. [Google Scholar] [CrossRef] [PubMed] [Green Version]
- George, S.H.; Greenaway, J.; Milea, A.; Clary, V.; Shaw, S.; Sharma, M.; Virtanen, C.; Shaw, P.A. Identification of abrogated pathways in fallopian tube epithelium from BRCA1 mutation carriers. J. Pathol. 2011, 225, 106–117. [Google Scholar] [CrossRef] [PubMed]
- Finch, A.; Shaw, P.; Rosen, B.; Murphy, J.; Narod, S.A.; Colgan, T.J. Clinical and pathologic findings of prophylactic salpingo-oophorectomies in 159 BRCA1 and BRCA2 carriers. Gynecol. Oncol. 2006, 100, 58–64. [Google Scholar] [CrossRef]
- Shaw, P.A.; Chun, A.; Milea, A.; Tone, A.; Begley, H.; Greenaway, J. Biomarkers of Rb Signaling Loss Are Characteristic of High Grade Adnexal Serous Carcinoma. Lab. Investig. 2009, 89, 376A. [Google Scholar]
- Shkolnik, K.; Tadmor, A.; Ben-Dor, S.; Nevo, N.; Galiani, D.; Dekel, N. Reactive oxygen species are indispensable in ovulation. Proc. Natl. Acad. Sci. USA 2011, 108, 1462–1467. [Google Scholar] [CrossRef] [Green Version]
- Fathalla, M.F. Incessant ovulation and ovarian cancer - a hypothesis re-visited. Facts Views Vis. Obgyn 2013, 5, 292–297. [Google Scholar] [PubMed]
- Emori, M.M.; Drapkin, R. The hormonal composition of follicular fluid and its implications for ovarian cancer pathogenesis. Reprod. Biol. Endocrinol. 2014, 12, 60. [Google Scholar] [CrossRef] [PubMed] [Green Version]
- Huang, H.-S.; Chu, S.-C.; Hsu, C.-F.; Chen, P.-C.; Ding, D.-C.; Chang, M.-Y.; Chu, T.-Y. Mutagenic, surviving and tumorigenic effects of follicular fluid in the context of p53 loss: Initiation of fimbria carcinogenesis. Carcinogenesis 2015, 36, 1419–1428. [Google Scholar] [CrossRef] [PubMed] [Green Version]
- Liao, H.; Zhou, Q.; Gu, Y.; Duan, T.; Feng, Y. Luteinizing hormone facilitates angiogenesis in ovarian epithelial tumor cells and metformin inhibits the effect through the mTOR signaling pathway. Oncol. Rep. 2012, 27, 1873–1878. [Google Scholar] [CrossRef] [PubMed] [Green Version]
- Tone, A.A.; Virtanen, C.; Shaw, P.; Brown, T.J. Prolonged postovulatory proinflammatory signaling in the fallopian tube epithelium may be mediated through a BRCA1/DAB2 axis. Clin. Cancer Res. 2012, 18, 4334–4344. [Google Scholar] [CrossRef] [Green Version]
- George, S.H.; Milea, A.; Shaw, P.A. Proliferation in the normal FTE is a hallmark of the follicular phase, not BRCA mutation status. Clin. Cancer Res. 2012, 18, 6199–6207. [Google Scholar] [CrossRef] [Green Version]
- Kessler, M.; Hoffmann, K.; Brinkmann, V.; Thieck, O.; Jackisch, S.; Toelle, B.; Berger, H.; Mollenkopf, H.J.; Mangler, M.; Sehouli, J.; et al. The Notch and Wnt pathways regulate stemness and differentiation in human fallopian tube organoids. Nat. Commun. 2015, 6, 8989. [Google Scholar] [CrossRef]
- Bartlett, T.E.; Chindera, K.; McDermott, J.; Breeze, C.E.; Cooke, W.R.; Jones, A.; Reisel, D.; Karegodar, S.T.; Arora, R.; Beck, S.; et al. Epigenetic reprogramming of fallopian tube fimbriae in BRCA mutation carriers defines early ovarian cancer evolution. Nat. Commun. 2016, 7, 11620. [Google Scholar] [CrossRef] [Green Version]
- Wyatt, T.A. Cyclic GMP and Cilia Motility. Cells 2015, 4, 315–330. [Google Scholar] [CrossRef] [Green Version]
- Forrester, K.; Ambs, S.; Lupold, S.E.; Kapust, R.B.; Spillare, E.A.; Weinberg, W.C.; Felley-Bosco, E.; Wang, X.W.; Geller, D.A.; Tzeng, E.; et al. Nitric oxide-induced p53 accumulation and regulation of inducible nitric oxide synthase expression by wild-type p53. Proc. Natl. Acad. Sci. USA 1996, 93, 2442–2447. [Google Scholar]
- Ratovitski, E.A. LKB1/PEA3/DeltaNp63 pathway regulates PTGS-2 (COX-2) transcription in lung cancer cells upon cigarette smoke exposure. Oxid. Med. Cell. Longev. 2010, 3, 317–324. [Google Scholar] [PubMed] [Green Version]
- Wink, D.A.; Hanbauer, I.; Grisham, M.B.; Laval, F.; Nims, R.W.; Laval, J.; Cook, J.; Pacelli, R.; Liebmann, J.; Krishna, M.; et al. Chemical biology of nitric oxide: Regulation and protective and toxic mechanisms. Curr. Top. Cell. Regul. 1996, 34, 159–187. [Google Scholar] [PubMed]
- Schwappacher, R.; Rangaswami, H.; Su-Yuo, J.; Hassad, A.; Spitler, R.; Casteel, D.E. cGMP-dependent protein kinase Ibeta regulates breast cancer cell migration and invasion via interaction with the actin/myosin-associated protein caldesmon. J. Cell Sci. 2013, 126, 1626–1636. [Google Scholar] [CrossRef] [PubMed] [Green Version]
- Hess, A.P.; Talbi, S.; Hamilton, A.E.; Baston-Buest, D.M.; Nyegaard, M.; Irwin, J.C.; Barragan, F.; Kruessel, J.S.; Germeyer, A.; Giudice, L.C. The human oviduct transcriptome reveals an anti-inflammatory, anti-angiogenic, secretory and matrix-stable environment during embryo transit. Reprod. Biomed. Online 2013, 27, 423–435. [Google Scholar] [CrossRef] [Green Version]
- Namani, A.; Li, Y.; Wang, X.J.; Tang, X. Modulation of NRF2 signaling pathway by nuclear receptors: Implications for cancer. Biochim. Biophys. Acta 2014, 1843, 1875–1885. [Google Scholar] [CrossRef] [Green Version]
- Gatto, F.; Schulze, A.; Nielsen, J. Systematic Analysis Reveals that Cancer Mutations Converge on Deregulated Metabolism of Arachidonate and Xenobiotics. Cell Rep. 2016, 16, 878–895. [Google Scholar] [CrossRef] [Green Version]
- Ji, Q.; Aoyama, C.; Chen, P.K.; Stolz, A.; Liu, P. Localization and altered expression of AKR1C family members in human ovarian tissues. Mol. Cell. Probes 2005, 19, 261–266. [Google Scholar]
- Bahar-Shany, K.; Brand, H.; Sapoznik, S.; Jacob-Hirsch, J.; Yung, Y.; Korach, J.; Perri, T.; Cohen, Y.; Hourvitz, A.; Levanon, K. Exposure of fallopian tube epithelium to follicular fluid mimics carcinogenic changes in precursor lesions of serous papillary carcinoma. Gynecol. Oncol. 2014, 132, 322–327. [Google Scholar] [CrossRef]
- Milea, A.; George, S.H.; Matevski, D.; Jiang, H.; Madunic, M.; Berman, H.K.; Gauthier, M.L.; Gallie, B.; Shaw, P.A. Retinoblastoma pathway deregulatory mechanisms determine clinical outcome in high-grade serous ovarian carcinoma. Mod. Pathol. 2013. [Google Scholar] [CrossRef] [Green Version]
- Karst, A.M.; Drapkin, R. Primary culture and immortalization of human fallopian tube secretory epithelial cells. Nat. Protoc. 2012, 7, 1755–1764. [Google Scholar] [CrossRef]
- McCall, M.N.; Bolstad, B.M.; Irizarry, R.A. Frozen robust multiarray analysis (fRMA). Biostatistics 2010, 11, 242–253. [Google Scholar] [CrossRef] [PubMed] [Green Version]
- Carvalho, B.S.; Irizarry, R.A. A framework for oligonucleotide microarray preprocessing. Bioinformatics 2010, 26, 2363–2367. [Google Scholar] [CrossRef] [PubMed]
- Leek, J.T.; Johnson, W.E.; Parker, H.S.; Jaffe, A.E.; Storey, J.D. The sva package for removing batch effects and other unwanted variation in high-throughput experiments. Bioinformatics 2012, 28, 882–883. [Google Scholar] [CrossRef] [PubMed]


| Top Canonical Pathways by Phase | p-Value | Overlap of Curated Genes in Pathway |
| Antigen Presentation Pathway | 4.81 × 10⁻²³ | 73.5% (25/34) |
| Allograft Rejection Signaling | 2.28 × 10⁻¹⁶ | 55.0% (22/40) |
| OX40 (T-cell survival) Signaling Pathway | 4.0 × 10⁻¹³ | 43.8% (21/48) |
| Autoimmune Thyroid Disease Signaling | 3.6 × 10⁻¹² | 47.4% (18/38) |
| T Helper Cell Differentiation | 6.43 × 10⁻¹² | 35.4% (23/65) |
| Top Canonical Pathways by Anatomy | p-Value | Overlap |
| Role of Oct4 in Mammalian Embryonic Stem Cell Pluripotency | 0.00555 | 51.1% (23/45) |
| Cellular Effects of Sildenafil | 0.00823 | 42.4% (53/125) |
| Planar Cell Polarity Pathway | 0.00983 | 46.8% (29/62) |
| Vitamin D Receptor /Retinoid X Receptor Activation | 0.0124 | 44.7% (34/76) |
| GDP Mannose Biosynthesis | 0.0144 | 83.3% (5/6) |
| NRF2-mediated Oxidative Stress Response | 0.0219 | 39% (73/187) |
| Top Toxicology Pathways by Anatomy | p-Value | Overlap |
| CAR/RXR Activation | 0.00262 | 58.6% (17/29) |
| VDR/RXR Activation | 0.0124 | 44.7% (34/76) |
| NRF2-mediated Oxidative Stress Response | 0.0436 | 37.6% (80/213) |
| Acute Renal Failure Panel (Rat) | 0.0439 | 43.6% (24/55) |
© 2020 by the authors. Licensee MDPI, Basel, Switzerland. This article is an open access article distributed under the terms and conditions of the Creative Commons Attribution (CC BY) license (http://creativecommons.org/licenses/by/4.0/).
Share and Cite
Sowamber, R.; Nelson, O.; Dodds, L.; DeCastro, V.; Paudel, I.; Milea, A.; Considine, M.; Cope, L.; Pinto, A.; Schlumbrecht, M.; et al. Integrative Transcriptome Analyses of the Human Fallopian Tube: Fimbria and Ampulla—Site of Origin of Serous Carcinoma of the Ovary. Cancers 2020, 12, 1090. https://doi.org/10.3390/cancers12051090
Sowamber R, Nelson O, Dodds L, DeCastro V, Paudel I, Milea A, Considine M, Cope L, Pinto A, Schlumbrecht M, et al. Integrative Transcriptome Analyses of the Human Fallopian Tube: Fimbria and Ampulla—Site of Origin of Serous Carcinoma of the Ovary. Cancers. 2020; 12(5):1090. https://doi.org/10.3390/cancers12051090
Chicago/Turabian StyleSowamber, Ramlogan, Omar Nelson, Leah Dodds, Victoria DeCastro, Iru Paudel, Anca Milea, Michael Considine, Leslie Cope, Andre Pinto, Matthew Schlumbrecht, and et al. 2020. "Integrative Transcriptome Analyses of the Human Fallopian Tube: Fimbria and Ampulla—Site of Origin of Serous Carcinoma of the Ovary" Cancers 12, no. 5: 1090. https://doi.org/10.3390/cancers12051090