1. Overview of the NuMI Beamline Monitoring System
The NOvA experiment [
1] utilizes Fermilab’s NuMI Neutrino beam [
2]. Generated by 120-GeV protons from the Main Injector interacting with a 1.2 m long graphite target, the beam is refined with two magnetic horns that focus the resultant pions and kaons. These mesons then decay within a 675 m long pipe, predominantly into muons and muon neutrinos. The beamline’s design is depicted in
Figure 1. Positioned downstream of the hadron absorber are three muon monitors (MM1, MM2, MM3), each consisting of 9 × 9 pixel ionization chamber arrays. Since the decommissioning of the MINOS detector in February 2019, these muon monitors have become vital for beam oversight and alignment, ensuring optimal performance. This continuous monitoring is pivotal for the NOvA experiment’s success. The setup also features a hadron monitor upstream of the absorber, several beam-position monitors, and toroids overseeing the primary proton beam.
2. Introduction to Muon Monitor Simulation
The muon monitor simulation utilizes g4NuMI [
4], a simulation tool grounded in Geant4 [
5]. Within G4NuMI, we model every component of the NuMI beamline, encompassing the target, magnetic horns, decay pipe, hadron monitor, and muon monitors.
Our simulation procedure for the muon monitor consists of the following steps:
Neutrinos are generated using G4NuMI.
These neutrinos are then traced back to their originating particles.
Muons are subsequently produced from these neutrinos and their parent entities.
These muons are introduced into a distinct G4NuMI environment to generate readings at the muon monitors.
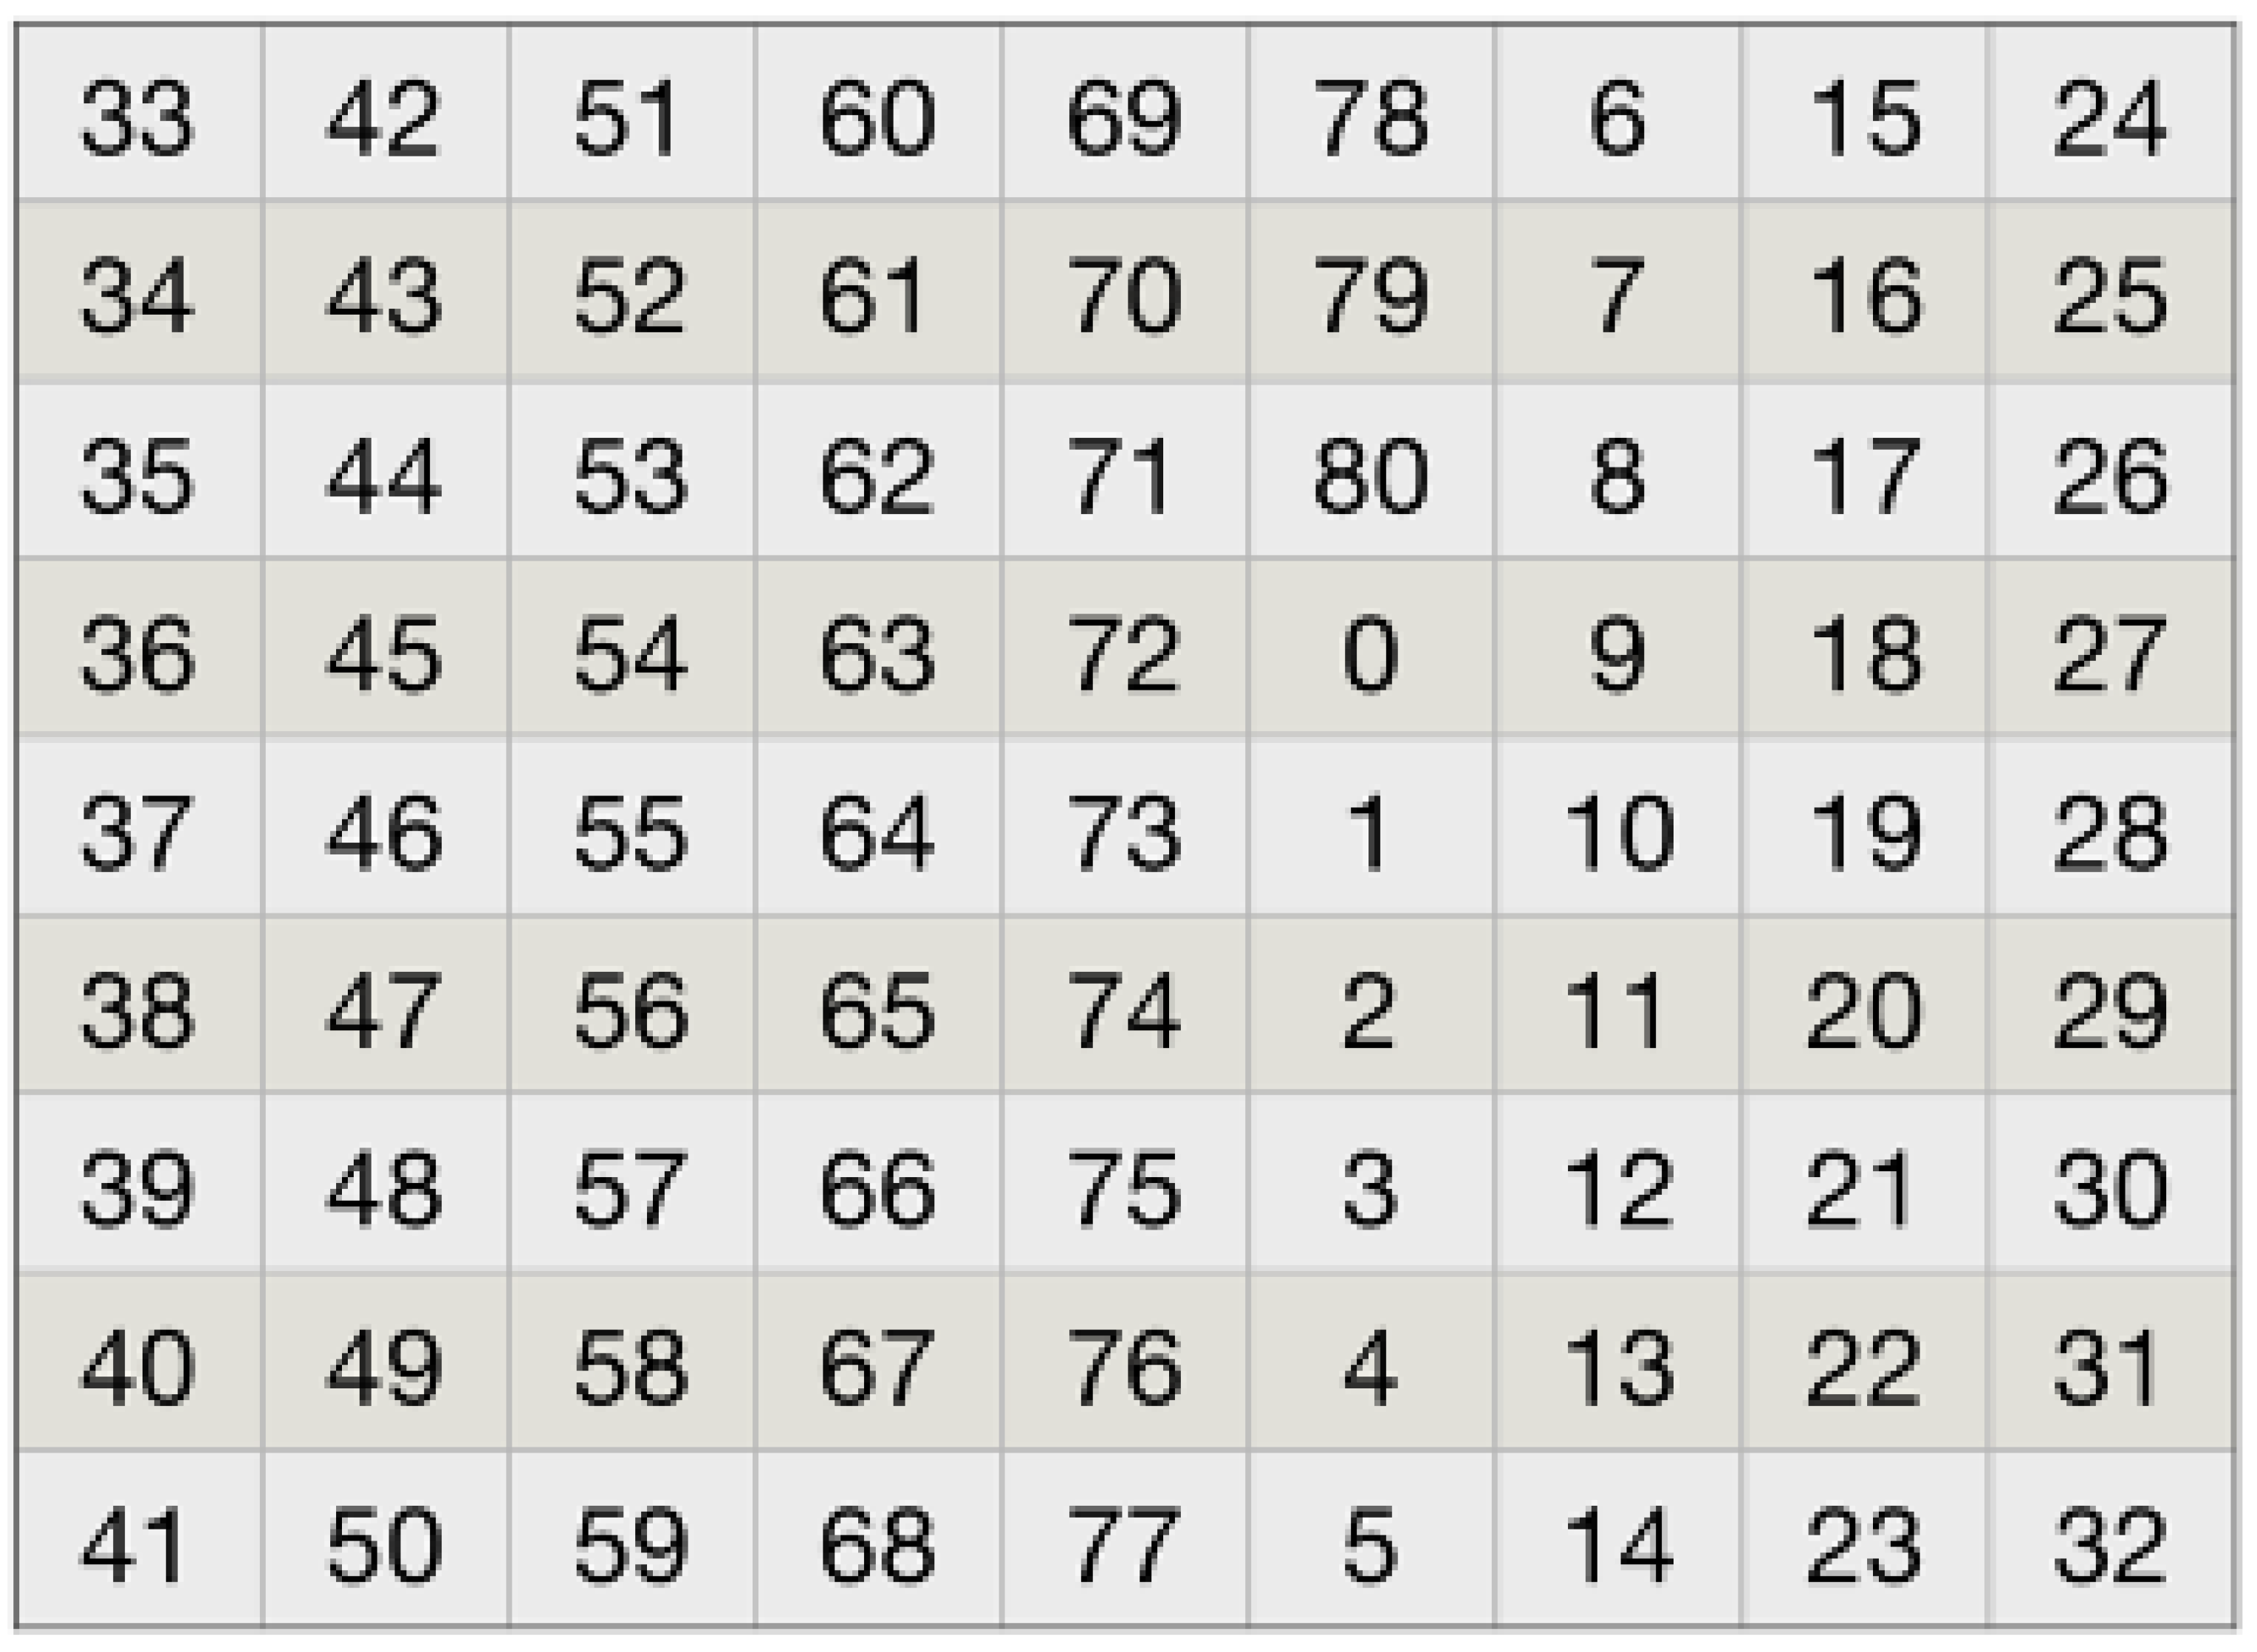
Figure 2 illustrates a 2D histogram of MM1. In the simulation, each of its 81 bins equates to a pixel indicating the count of muon events. Conversely, for actual data, the pixels capture the voltage readings from the muon monitors.
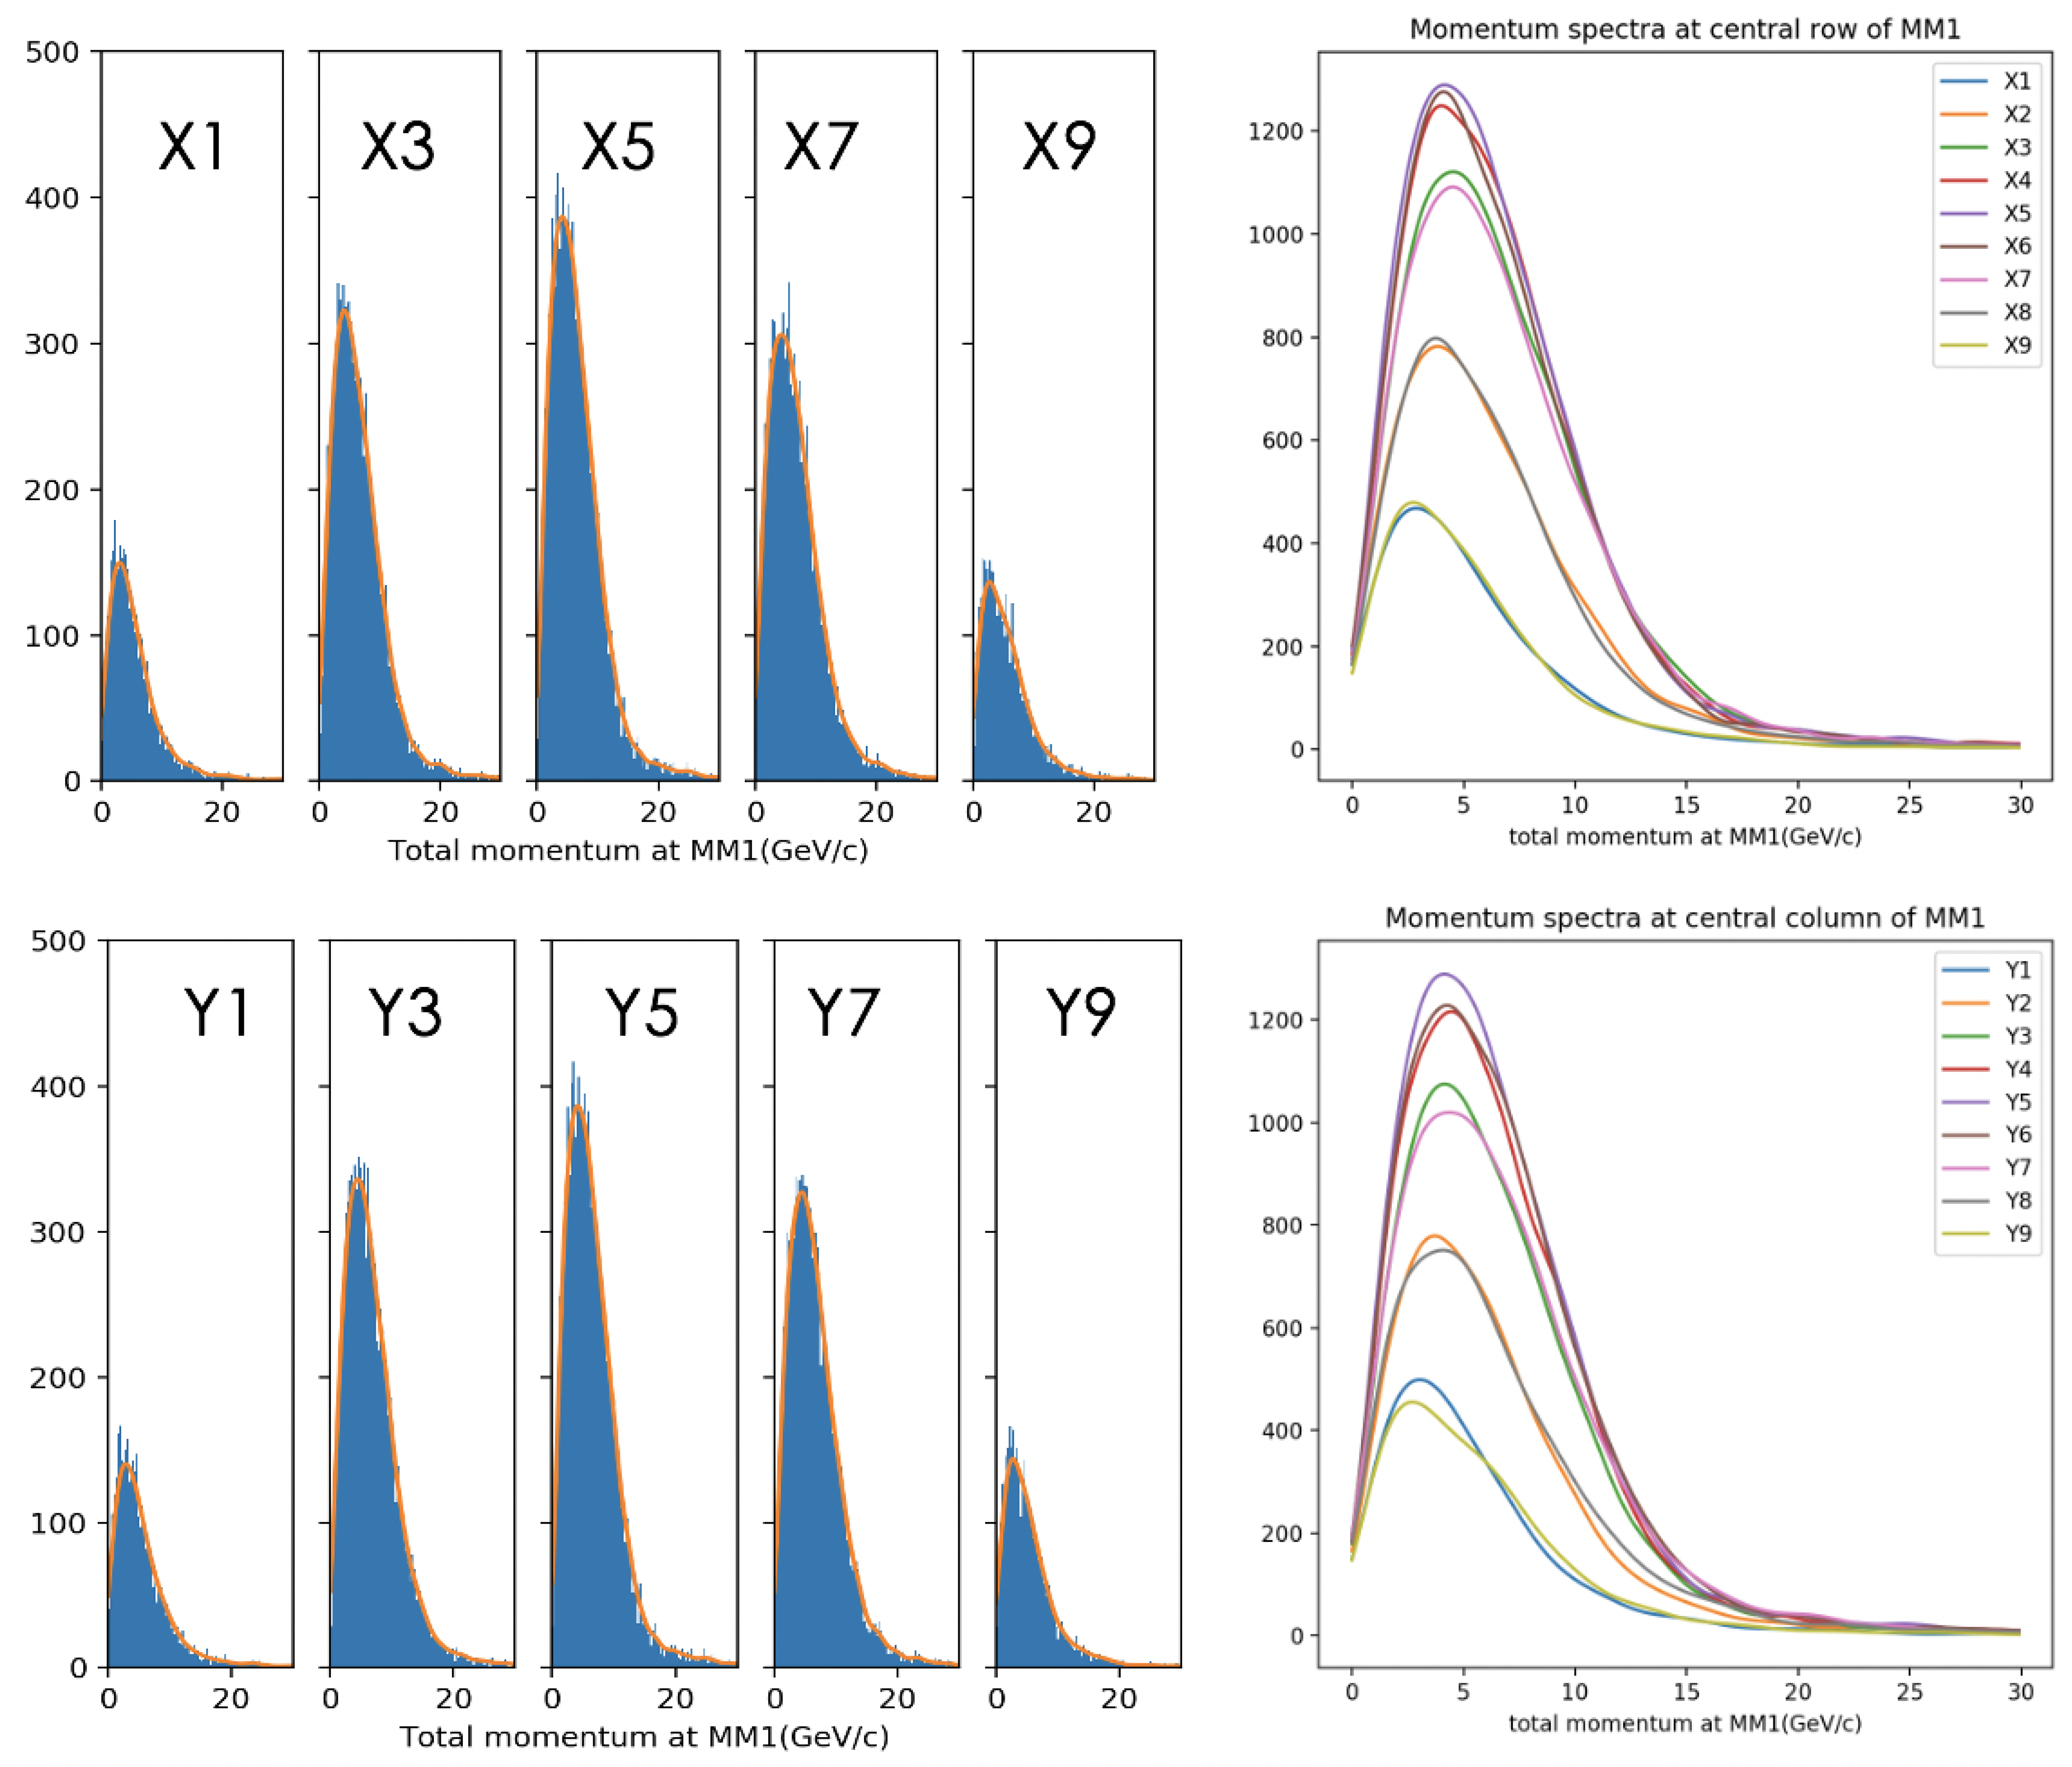
In our muon monitor simulation, the momentum distribution across the 81 pixels provides a detailed correlation between muon distribution and the primary proton-beam profile.
Figure 3 illustrates this: spectra differ between pixels, with momentum peaks declining as one transitions from MM1’s center to its edge. Each pixel’s spectra in the diagram are marked, with the central row as X1 to X9 and the central column as Y1 to Y9.
As highlighted in
Figure 1, MM1, MM2, and MM3 are strategically placed downstream of the NuMI hadron absorber, with intervals of 12 and 18 m of rock between them. This spacing offers sensitivity to various muon momenta. When validating the MM1 simulation against real-world measurements, we encountered computational hurdles. Our resolution was to integrate two innovative techniques: uniform beam and multiple decay.
The uniform beam method simulates a uniformly distributed proton beam striking the target. During analysis, we then apply Gaussian weights to the protons based on their positions to mimic varying beam locations.
On the other hand, the multiple decay technique compels each target-produced pion to decay into several muons. Validity checks confirmed this method’s accuracy, comparing the results of up to 75× decays per pion against a reference simulation, revealing a solid agreement.
Combined, these techniques empower us to generate samples with remarkably high statistical precision.
3. Comparison between Simulation and Measurement Data
To understand the NuMI beam’s behavior and be able to predict the effect of changes on the key beam parameters, multiple beam scans were carried out. The beam position on target, beam spot size, and focusing horn currents were changed in a controlled fashion. Beam scans indicated how each MM responded to beam-position and horn-current variations.
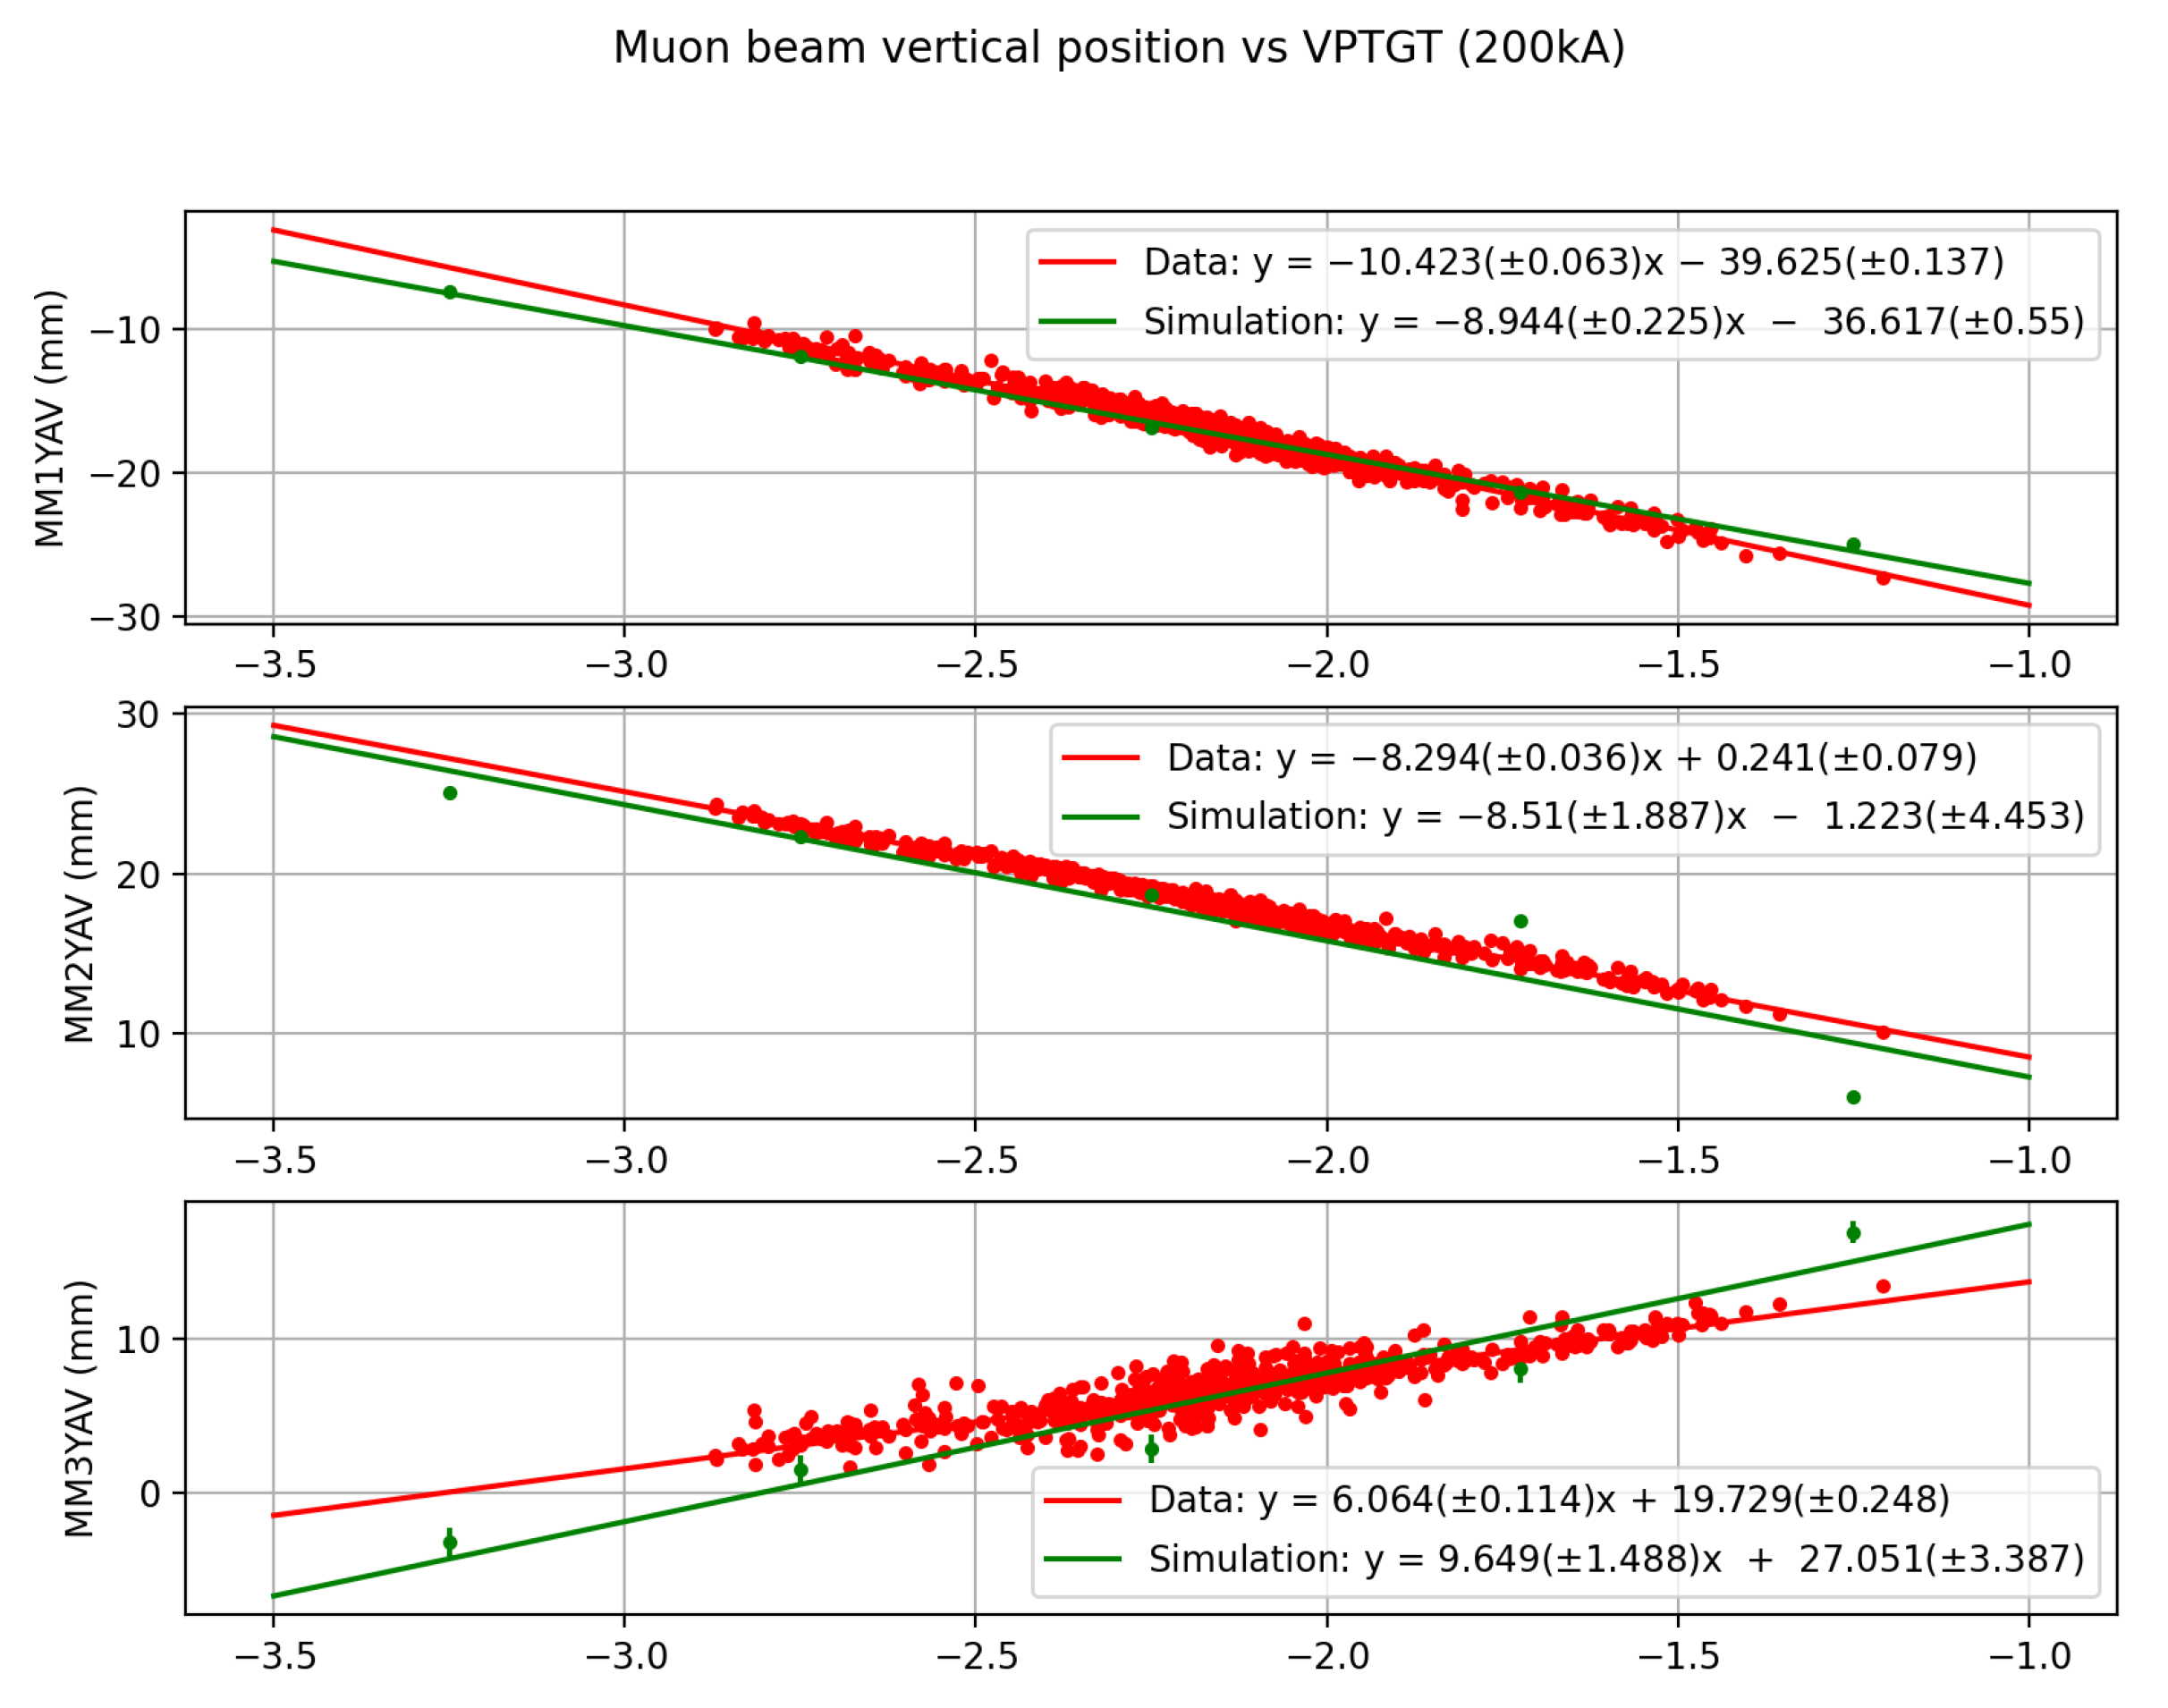
Our interest is the related change of muon events at muon monitors for different proton-beam positions. We compared the measurement data and the simulation results by looking at muon beam centroids and individual pixels (see
Figure 4 and
Figure 5). The simulation results exhibit a consistent behavior with the measurement data. Specifically, the centroids of the muon beam on MM1 and MM3 show opposite slopes as a function of the proton-beam position on the target. And for all operational pixels at MM1, the comparison shows that the simulation largely aligns with data trends, albeit with some quantitative disparities. Two pixels on the top and left of MM1 are broken and non-operational, leading to missing data in the comparison.
4. Beam Parameter Effect on Pixels at MMs
To study the effect of beam parameters, we compared the simulation results with changed parameters for each pixel at MM1–MM3. Each simulation had 50 million protons on target (PoT) and each pion and kaon had multiple decays to muons. The comparison is illustrated using a 2D histogram, where the number in each bin represents the ratio of muon events.
4.1. Horn1 Tilt Angle (x Axis)
In
Figure 6, we adjusted the Horn1 tilt angle (represented by the
x-axis) from −3 mrads to +3 mrads, indicating Horn1’s downward and upward tilting.
Figure 7, featuring 2D ratio histograms, illustrates the influence of varying Horn1 tilt angles across MM1–MM3. Each pixel’s value in these histograms represents the ratio of muon events from simulations with distinct Horn1 tilt settings to those from a reference simulation. The simulation outcomes highlight MM2 and MM3’s heightened sensitivity to Horn1 tilt changes, with the top pixels undergoing notably more significant variations than the bottom ones.
4.2. Target Offset in Vertical Direction
The target vertical offset was adjusted between −1 mm and +1 mm, revealing a linear correlation between muon events at pixels and the offset in
Figure 8. Two specific pixels, 73 (center) and 70 (near the edge), were selected to analyze event variations, see
Figure 9. While all three muon monitors exhibited similar patterns, MM1 was particularly sensitive to the target vertical offset.
4.3. Other Parameters’ Effects
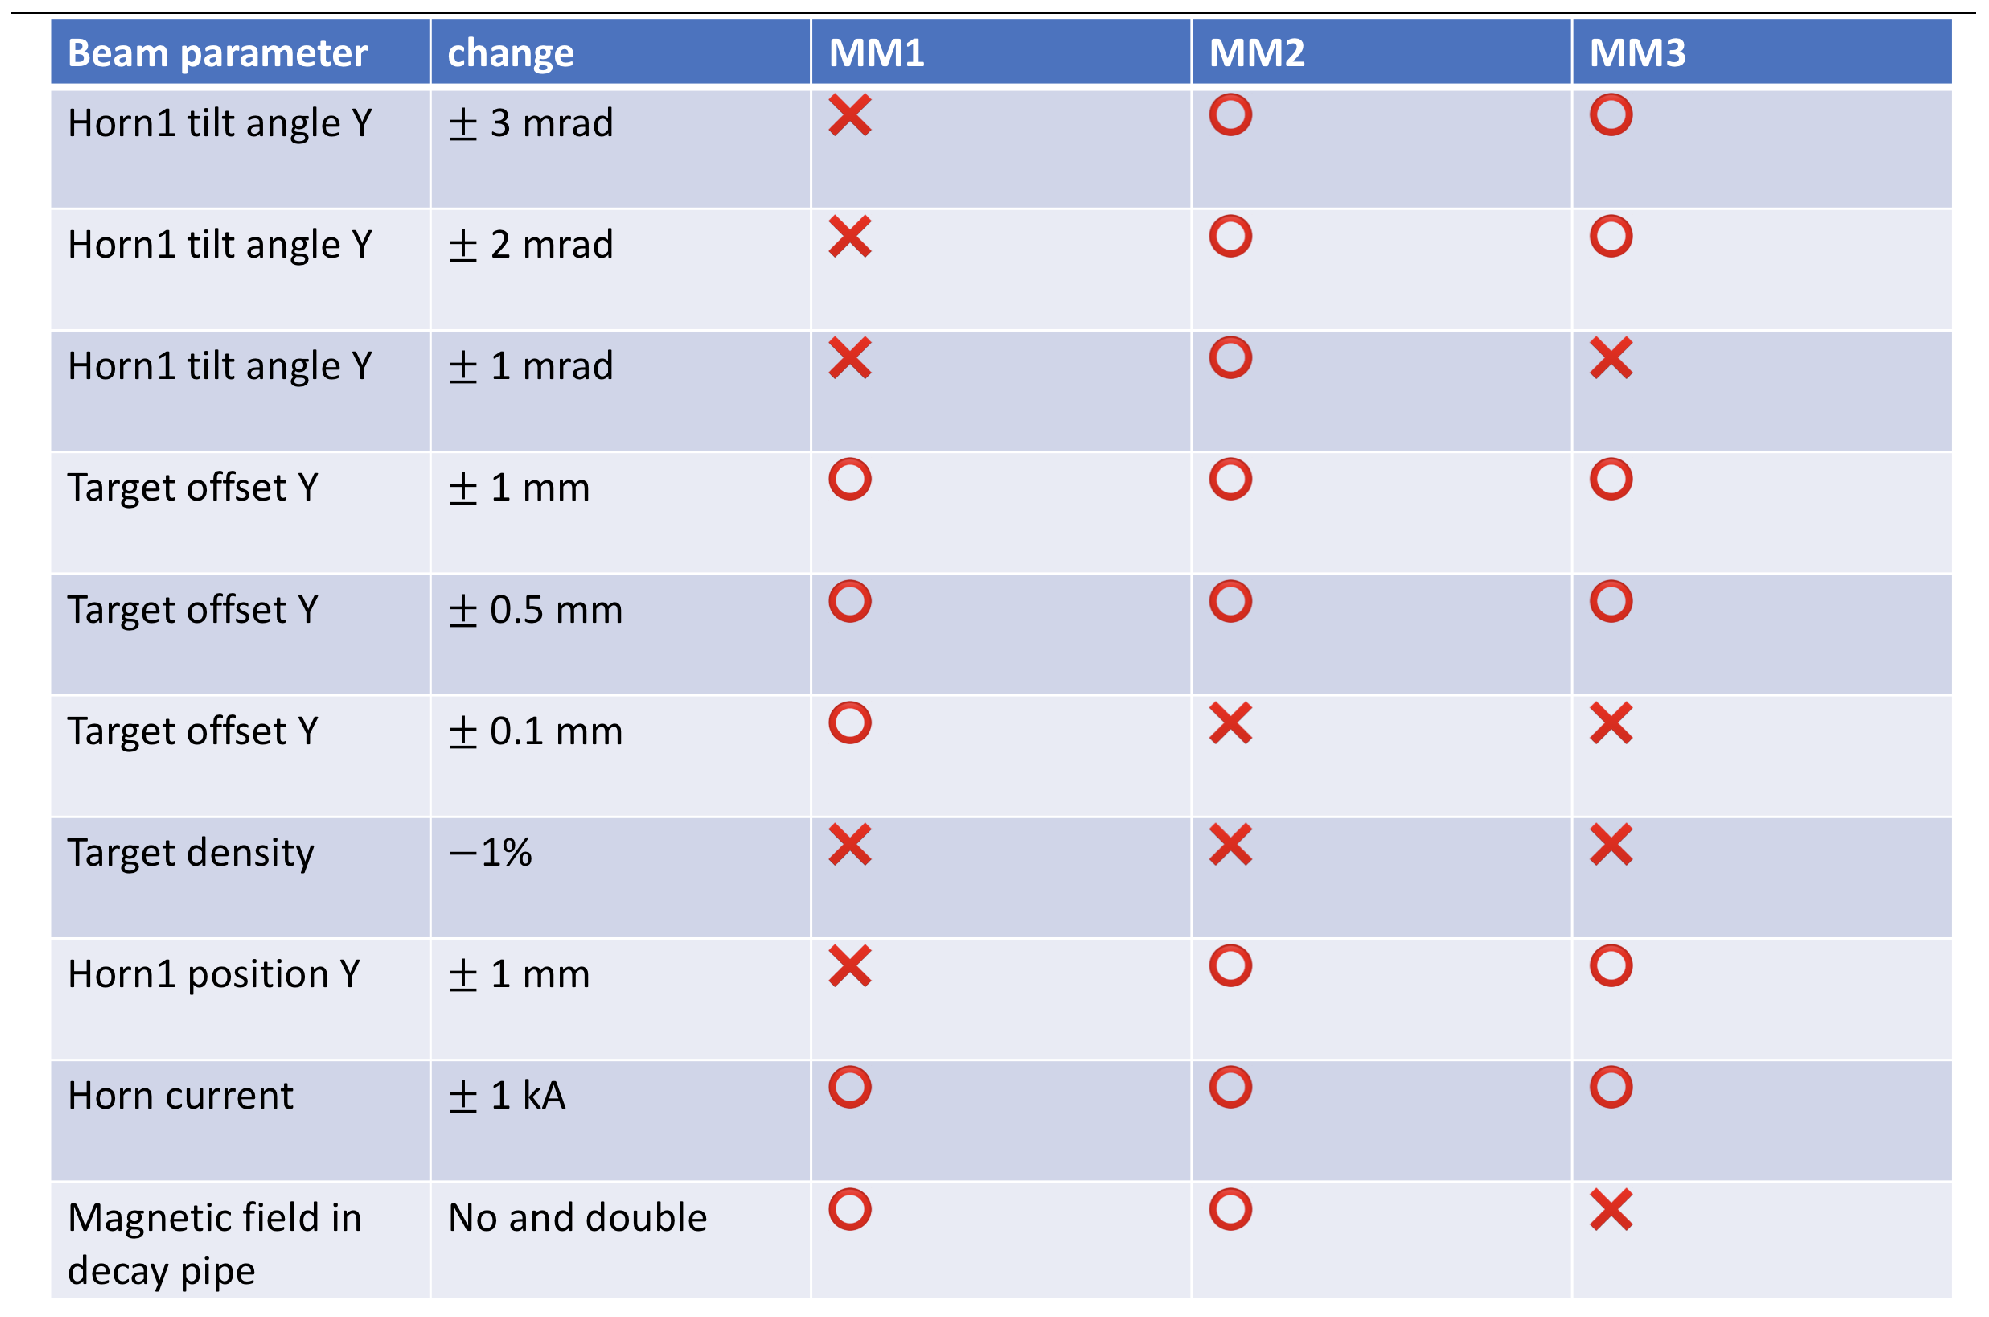
For the change of different parameters, we used the improved simulation to check whether the muon monitors can catch the effect of the parameters. It indicates the muon monitors are able to find the effect of those changes in
Figure 10.
5. Machine Learning Algorithms Based on Muon Monitor Data
In addition to analyzing MM data and simulation results, we built a machine learning (ML) model that predicts/reconstructs primary beam parameters and the magnetic horn current by using muon monitor data. The model is trained using randomly selected past data samples. ML predictions can be used to monitor beamline issues in the future. The plan is to implement the ML model predictions for daily NuMI beamline data monitoring and catching common failure modes.
Author Contributions
Conceptualization, Y.Y., T.J.C., K.L., P.S., J.T., D.A.W. and K.Y.; methodology, Y.Y., T.J.C., K.L., P.S., J.T., D.A.W. and K.Y.; software, Y.Y. and T.J.C.; validation, Y.Y. and E.O.; investigation, Y.Y.; resources, D.A.W. and K.Y.; data curation, E.O.; writing—original draft preparation, Y.Y.; writing—review and editing, Y.Y., T.J.C., S.G., J.T. and K.Y.; visualization, Y.Y.; supervision, K.L., P.S., J.T. and K.Y.; project administration, P.S. All authors have read and agreed to the published version of the manuscript.
Funding
This work is supported by the Fermi Research Alliance, LLC manages and operates the Fermi National Accelerator Laboratory pursuant to Contract number DE-AC02-07CH11359 with the United States Department of Energy.
Institutional Review Board Statement
FERMILAB-CONF-23-438-STUDENT-V.
Informed Consent Statement
Not applicable.
Data Availability Statement
Data is unavailable due to privacy.
Acknowledgments
This manuscript has been authored by Fermi Research Alliance, LLC under Contract No. DE-AC02-07CH11359 with the U.S. Department of Energy, Office of Science, Office of High Energy Physics.
Conflicts of Interest
The authors declare no conflict of interest.
References
- NOvA Experiment. Available online: https://novaexperiment.fnal.gov/ (accessed on 1 September 2023).
- Adamson, P.; Anderson, K.; Andrews, M.; Andrews, R.; Anghel, I.; Augustine, D.; Aurisano, A.; Avvakumov, S.; Ayres, D.S.; Baller, B.; et al. The NuMI neutrino beam. Nucl. Instrum. Meth. Phys. Res. A 2016, 806, 279–306. Available online: http://www.sciencedirect.com/science/article/pii/S016890021501027X (accessed on 1 September 2023). [CrossRef]
- Pavlovic, Z. Observation of Disappearance of Muon Neutrinos in the NuMI Beam; The University of Texas at Austin: Austin, TX, USA, 2008. [Google Scholar]
- G4NuMI Documentation. Available online: https://indico.fnal.gov/event/48024/ (accessed on 1 September 2023).
- Agostinelli, S.; Allison, J.; Amako, K.; Apostolakis, J.; Araujo, H.; Arce, P.; Asai, M.; Axen, D.; Banerjee, S.; Barrand, G.; et al. Geant4—A simulation toolkit. Nucl. Instrum. Methods Phys. Res. Sect. A Accel. Spectrometers Detect. Assoc. Equip. 2003, 506, 250–303. [Google Scholar] [CrossRef]
| Disclaimer/Publisher’s Note: The statements, opinions and data contained in all publications are solely those of the individual author(s) and contributor(s) and not of MDPI and/or the editor(s). MDPI and/or the editor(s) disclaim responsibility for any injury to people or property resulting from any ideas, methods, instructions or products referred to in the content. |
© 2024 by the Fermi Research, LLC. Licensee MDPI, Basel, Switzerland. This article is an open access article distributed under the terms and conditions of the Creative Commons Attribution (CC BY) license (https://creativecommons.org/licenses/by/4.0/).


 ,
, 


