Article

Admissibility Grid to Support the Decision for the Preferential Routing of Portuguese Endogenous Waste Biomass for the Production of Biogas, Advanced Biofuels, Electricity and Heat

LNEG—Laboratório Nacional de Energia e Geologia, I.P., Unidade de Bioenergia e Biorrefinarias, Estrada do Paço do Lumiar 22, 1649-038 Lisbon, Portugal
*
Author to whom correspondence should be addressed.
These authors contributed equally to this work.
Biomass 2023, 3(4), 336-366; https://doi.org/10.3390/biomass3040021
Submission received: 31 July 2023 / Revised: 4 September 2023 / Accepted: 21 September 2023 / Published: 16 October 2023

Abstract

:
A methodology was developed to assess the allocation of different types of endogenous waste biomass to eight technologies for producing electricity, heat, biogas and advanced biofuels. It was based on the identification of key physicochemical parameters for each conversion process and the definition of limit values for each parameter, applied to two different matrices of waste biomass. This enabled the creation of one Admissibility Grid with target values per type of waste biomass and conversion technology, applicable to a decision process in the routing to energy production. The construction of the grid was based on the evaluation of 24 types of waste biomass, corresponding to 48 sets of samples tested, for which a detailed physicochemical characterization and an admissibility assessment were made. The samples were collected from Municipal Solid Waste treatment facilities, sewage sludges, agro-industrial companies, poultry farms, and pulp and paper industries. The conversion technologies and energy products considered were (trans)esterification to fatty acid methyl esters, anaerobic digestion to methane, fermentation to bioethanol, dark fermentation to biohydrogen, combustion to electricity and heat, gasification to syngas, and pyrolysis and hydrothermal liquefaction to bio-oils. The validation of the Admissibility Grid was based on the determination of conversion rates and product yields over 23 case studies that were selected according to the best combinations of waste biomass type versus technological solution and energy product.

1. Introduction

Waste-to-energy is a broad wording that encompasses much more than waste incineration with energy recovery. It covers several waste treatment processes that generate energy directly in the form of electricity and/or heat or in the form of a fuel derived from waste, in each case with a particular environmental impact and a specific potential in a circular economy context [1]. Feedstocks such as residues and by-products from agriculture, food processing, industrial and municipal waste streams, and residues from forest harvesting and wood processing may account for up to 45 exajoules of the global bioenergy supply in the form of biogas, syngas, and advanced liquid biofuels in 2050 [2]. In fact, balanced combinations of materials and energy recovery in the waste hierarchy pyramid should not be disregarded in future solutions for unavoidable waste [3]. Waste biomass must be seen as a sustainable resource that can be used to drive decarbonisation, replacing fossil fuels, and avoiding the use of land for purposes other than food production, in order to meet the challenges of overpopulation.
The present study was developed under the framework of the project CONVERTE: Biomass Potential for Energy, which is available online through the link https://converte.lneg.pt/. This project aimed to develop an objective and harmonised methodology to assess the potential of waste biomass generated in mainland Portugal to be used in the production of electricity, heat, energy carriers and advanced biofuels through eight technological solutions (chemical, biochemical and thermochemical). To achieve this goal, important Portuguese endogenous waste biomass types, little used or even unexploited for bioenergy production were considered, namely several different organic fractions of municipal solid waste (MSW) as well as biowastes and by-products from agro-industries and agriculture with significance in the country (olive oil and wine productions, and chestnut and tomato processing). Furthermore, the selection of the technologies to produce energy was based on their current state of development in Portugal. On the one hand, technologies with a high degree of maturity in Portugal were selected, with energy products already at the commercial level. On the other hand, emerging technologies regarding the national readiness level were also selected, with the view to increase the efficiency in the use of biomass resources and to boost the retrofitting of existing facilities and/or the construction of new dedicated facilities. The production technologies and energy products considered were the following:
(Trans)esterification to fatty acid methyl esters (FAME): FAME are produced through a (trans)esterification reaction, over raw material glycerides and/or free fatty acids that are converted into esters in the presence of an alcohol and a catalyst. Among the several sources of biomass for FAME production are oil crops, such as soybean, sunflower, rapeseed or palm. However, currently the main sources are residual raw materials such as used cooking oil, animal fat and agro-industrial residues containing oil [4,5]. The valorisation of the oily residues in the form of an energy product constitutes an alternative pathway for its disposal and is therefore considered a sustainable upgrading. A high oil content of the feedstock (≥ 40% (w/w)) is determinant for a technical and economically viable FAME production [5]. Moreover, the fatty acid composition and the acid value are very relevant, respectively, for the quality of the final product, and to achieve high conversion efficiency with low complexity regarding the purification operations [6].
Fermentation to bioethanol and dark fermentation (DF) to biohydrogen: The production of advanced liquid and gaseous biofuels, such as ethanol and biohydrogen, follows the same trend of waste biomass upcycling, in particular for carbohydrate-rich waste biomass. Bioethanol and biohydrogen produced from non-sugar biomass, such as lignocellulosic materials from agricultural and forestry residues, wood processing residues and energy crops, industrial and agro-industrial by-products, and the organic fraction of MSW, are considered advanced biofuels due to their main advantage of not competing with food crops for agricultural land [7,8]. However, the complexity of these materials requires the biomass to undergo preliminary pre-treatment and/or hydrolysis stages to maximise carbohydrate saccharification and increase the bioconversion yield [9]. The main criterion to select the most suitable feedstocks for bioethanol production is the amount of carbohydrates and/or simple sugars that must enable the preparation of a fermentation broth with a monosaccharide content higher than 90 g/L, after feedstock pre-treatment and enzymatic hydrolysis [10]. This prerequisite derives from two factors: the maximum theoretical yield of ethanol production (0.5 g ethanol/g sugar) and the economically unfeasibility of distilling ethanol from fermentation broths at concentrations below 40 g/L.
Anaerobic digestion (AD) to biogas and biomethane: In 2020, the EU Taxonomy [11] recognised AD of biowaste and sewage sludge, and the integration of biomethane in the gas grid, as a sustainable activity contributing substantially to climate change mitigation or adaptation. Biogas plants provide the triple target of renewable energy production, organic waste treatment, and promotion of nutrient recycling and redistribution using the final digestate and stabilised sludges for soils fertilisation [12]. The waste biomass commonly used for biogas production is organic waste, such as animal manure, sewage sludge, agricultural waste, and energy crops (such as corn), as well as cruciferous vegetables, grasses, green waste, and waste from the food industry [13,14]. The AD process can be influenced by several factors related to the characteristics and conditions of the feedstock, and to the quality of the microbial inoculum. The ratio between carbon (C) and nitrogen (N) present in the waste material is a crucial factor in the production of biogas, with a C/N ratio of 25/1 being the optimal value for anaerobic bacterial growth in an AD system [15,16]. Substrates with inadequate C/N ratios increase the risk of high volatile fatty acid accumulation in digesters or of ammonia toxicity to methanogens, leading to insufficient utilisation of carbon sources, and reducing yields of biogas production [17]. Also, the presence or accumulation of greasy long-chain fatty acids with concentrations higher than 500 g/L, can form a blocking layer on the cell surface, limiting the access of microorganisms to nutrients in anaerobic digesters [18]. Total volatile solids (TVS) are an indicator of the biodegradable organic matter available in biowastes and sludges that can be converted into biogas and, therefore, it is crucial to ensure that the TVS content in raw substrates is higher than 1 g/L [19].
Combustion to electricity and heat: Combustion is a thermochemical process that converts biomass chemical energy into other energy sources. It is possible to produce thermal energy (in the form of heat) using suitable equipment like steam generators, boilers, furnaces, stoves, etc., and mechanical energy (in the form of electricity) using turbo generators like steam and gas turbines, reciprocating engines, etc. Combustion has been the most used thermochemical process for many generations worldwide. However, presently, the trend is to substitute combustion by other processes with lower environmental impact. Combined Heat and Power (CHP) or cogeneration consists of joint production, in the same system, of heat and electricity. Biomass CHP plants produce heat, part of which is used to produce electricity in turbogenerators, while the other part is used in the process itself, in urban heating systems, or sold in the form of steam to other companies or industries. A wide range of solid biomasses can be used for combustion if they meet certain requirements, namely a moisture content below 40% (w/w) and a calorific value higher than about 16 MJ/kg [20,21]. Ash limits below 20% (w/w) will also ensure a better performance of the combustion equipment and all the thermochemical conversions in general.
Gasification to synthesis gas: Biomass gasification is also a thermochemical conversion process carried out at temperatures generally between 750 °C and 900 °C. However, entrained flow gasification may reach values up to 1300 °C. Gasification products are mostly gases that can be used as gaseous biofuel or as raw material for biofuels or bioproducts production. Unconverted carbonaceous matter as well as some solids that contain the mineral matter existing in the gasified feedstock are also produced. The gasification gas can be burned directly to produce energy, can be used in turbines or, if enriched in hydrogen (H2), can be fed to fuel cells. It can also be applied in chemical synthesis to produce ethanol, methanol, dimethyl ether, or upgraded to H2 by steam reforming and water gas shift reactions. Biomass residues for gasification must meet certain requirements, such as a moisture content lower than 20% (w/w) and a calorific value higher than about 16 MJ/kg [21,22], whereas the biomass maximum particle diameter depends on the gasification technology selected.
Pyrolysis to bio-oils: Pyrolysis is a thermochemical process applied to organic matter, which occurs in the absence of air or in the presence of a reduced atmosphere. The process can produce charcoal, organic liquids (known as bio-oil), gases, acetic acid, acetone, methanol, and ethanol. The yield and quality of the products depend on the operational conditions used (temperature, time, and reaction pressure), the raw material and the type of pyrolysis used. Among the three main types of pyrolysis, Flash, Slow and Fast, the choice depends on the product to be maximized. Flash pyrolysis uses very high heating rates and very short residence times, and the aim is to maximise the liquid product (bio-oil). In this type of pyrolysis, bio-oil yields of around 75% (w/w) are obtained, while solids and gas yields are around 12% (w/w). Biochar and gases are the main products of slow pyrolysis, with yields around 45% (w/w) and 35% (w/w), respectively, and liquid yields of less than 20% (w/w). Fast pyrolysis uses intermediate heating rates and not so long residence times, so yields of around 50% (w/w) of bio-oil and around 25% (w/w) of gas and solids are obtained [23]. Pyrolysis has been commonly applied to solid biomass, but in recent years there has been an increased interest in studying the application of this process to greasy materials of vegetable origin [24]. During pyrolysis, the triglycerides present in the vegetable oils undergo saturation reactions, where carbon bonds decompose and compounds similar to fossil-based fuels are produced. The organic fat residues to be used in liquid pyrolysis must meet certain requirements, such as a moisture content lower than 20% (w/w) and more than 30% (w/w) of fat content [21,25]. The presence of chlorine and sulphur in concentrations higher than 1% (w/w) and 2% (w/w), respectively, leads to the formation of hydrochloric acid (HCl) and sulphuric acid (H2SO4) which can cause corrosion in the solid pyrolysis system and in thermochemical conversion reactors, in general, decreasing their lifetime.
Hydrothermal liquefaction (HTL) to bio-oils: HTL is a technology that converts biomass with high moisture content (such as lignocellulosic material and aquatic biomass) into bio-oil, under conditions of high pressure and temperature [25]. Four different products are formed: bio-oil, gas, solid residue and materials that are soluble in water (aqueous phase), usually consisting of sugars, organic acids and nutrients. The product yield and quality are determined by several factors, including biomass, catalyst and solvent types, residence time and biomass-to-solvent ratio. The type of biomass used has the strongest effect on the yields and composition of the bio-oil, due to the ratio of protein, lipid and carbohydrate fractions in the initial biomass feedstock. When compared with other thermochemical processes, the main advantage of HTL is the possibility of using wet biomass, avoiding the high cost of the initial drying process, thus assuring higher competitiveness regarding the energy balance [26]. The biomass wastes to be used in HTL must meet two main requirements, namely a high moisture content of more than 50% (w/w) and a low ash content of less than 20% (w/w) [25,27]. Other hydrothermal processes can be applied to wet biomass, like Hydrothermal Carbonisation (HTC) and Supercritical Water Gasification (SCWG). The main product of HTC is a solid, normally referred to as hydrochar, that contains high amounts of carbon, hydrogen, nitrogen, and low sulphur content. It can be used in a wide range of applications, although, currently, the great interest is the usage on soil amendment for carbon sequestration and soil quality improvement [28]. SCWG is a type of gasification that converts solids with high moisture content in a gas product mainly containing CO, CO2, H2, and CH4 [23]. This process uses supercritical water conditions that favour the degradation of biomass components. However, this process is at a readiness level lower than conventional gasification. Due to the importance of decarbonising the transport sector, the research on thermochemical processes using biomass has been focused mainly on the production of bio-oil, rather than on gas and char products.
Table 1 resumes the information on the technologies under study, indicating the respective energy products, degree of maturity, a brief description of the process, potential feedstocks and discriminating parameters.

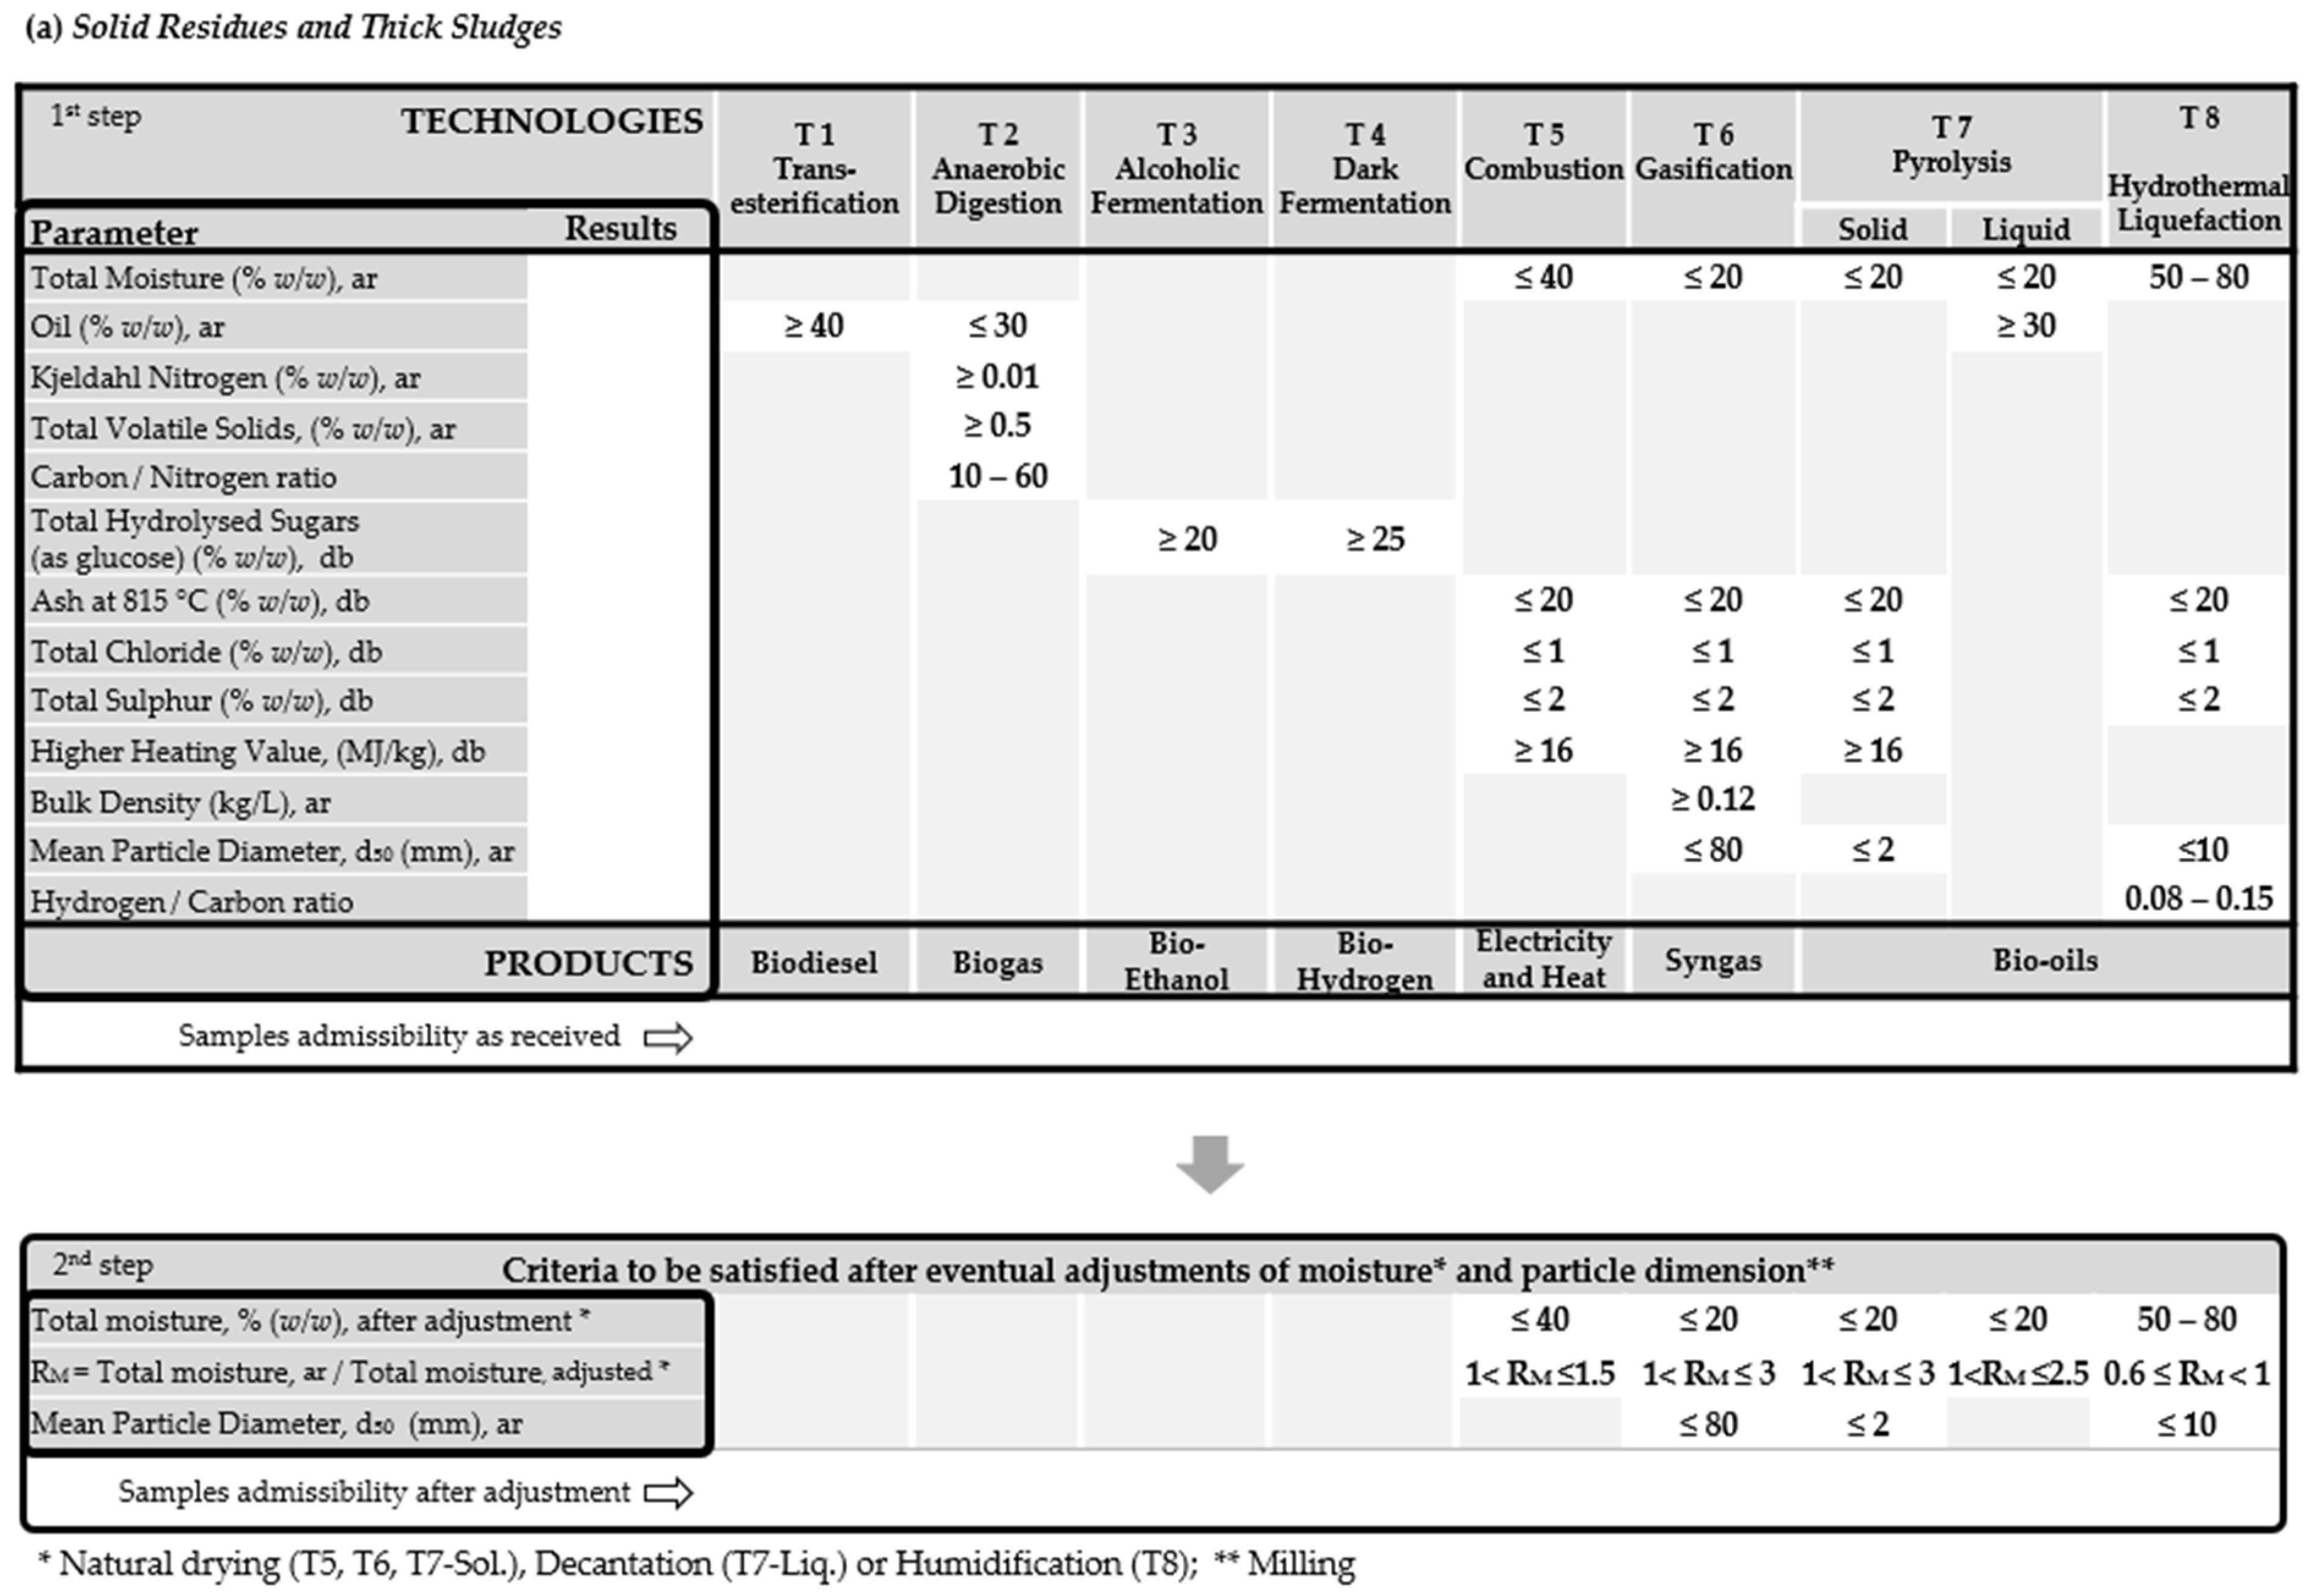
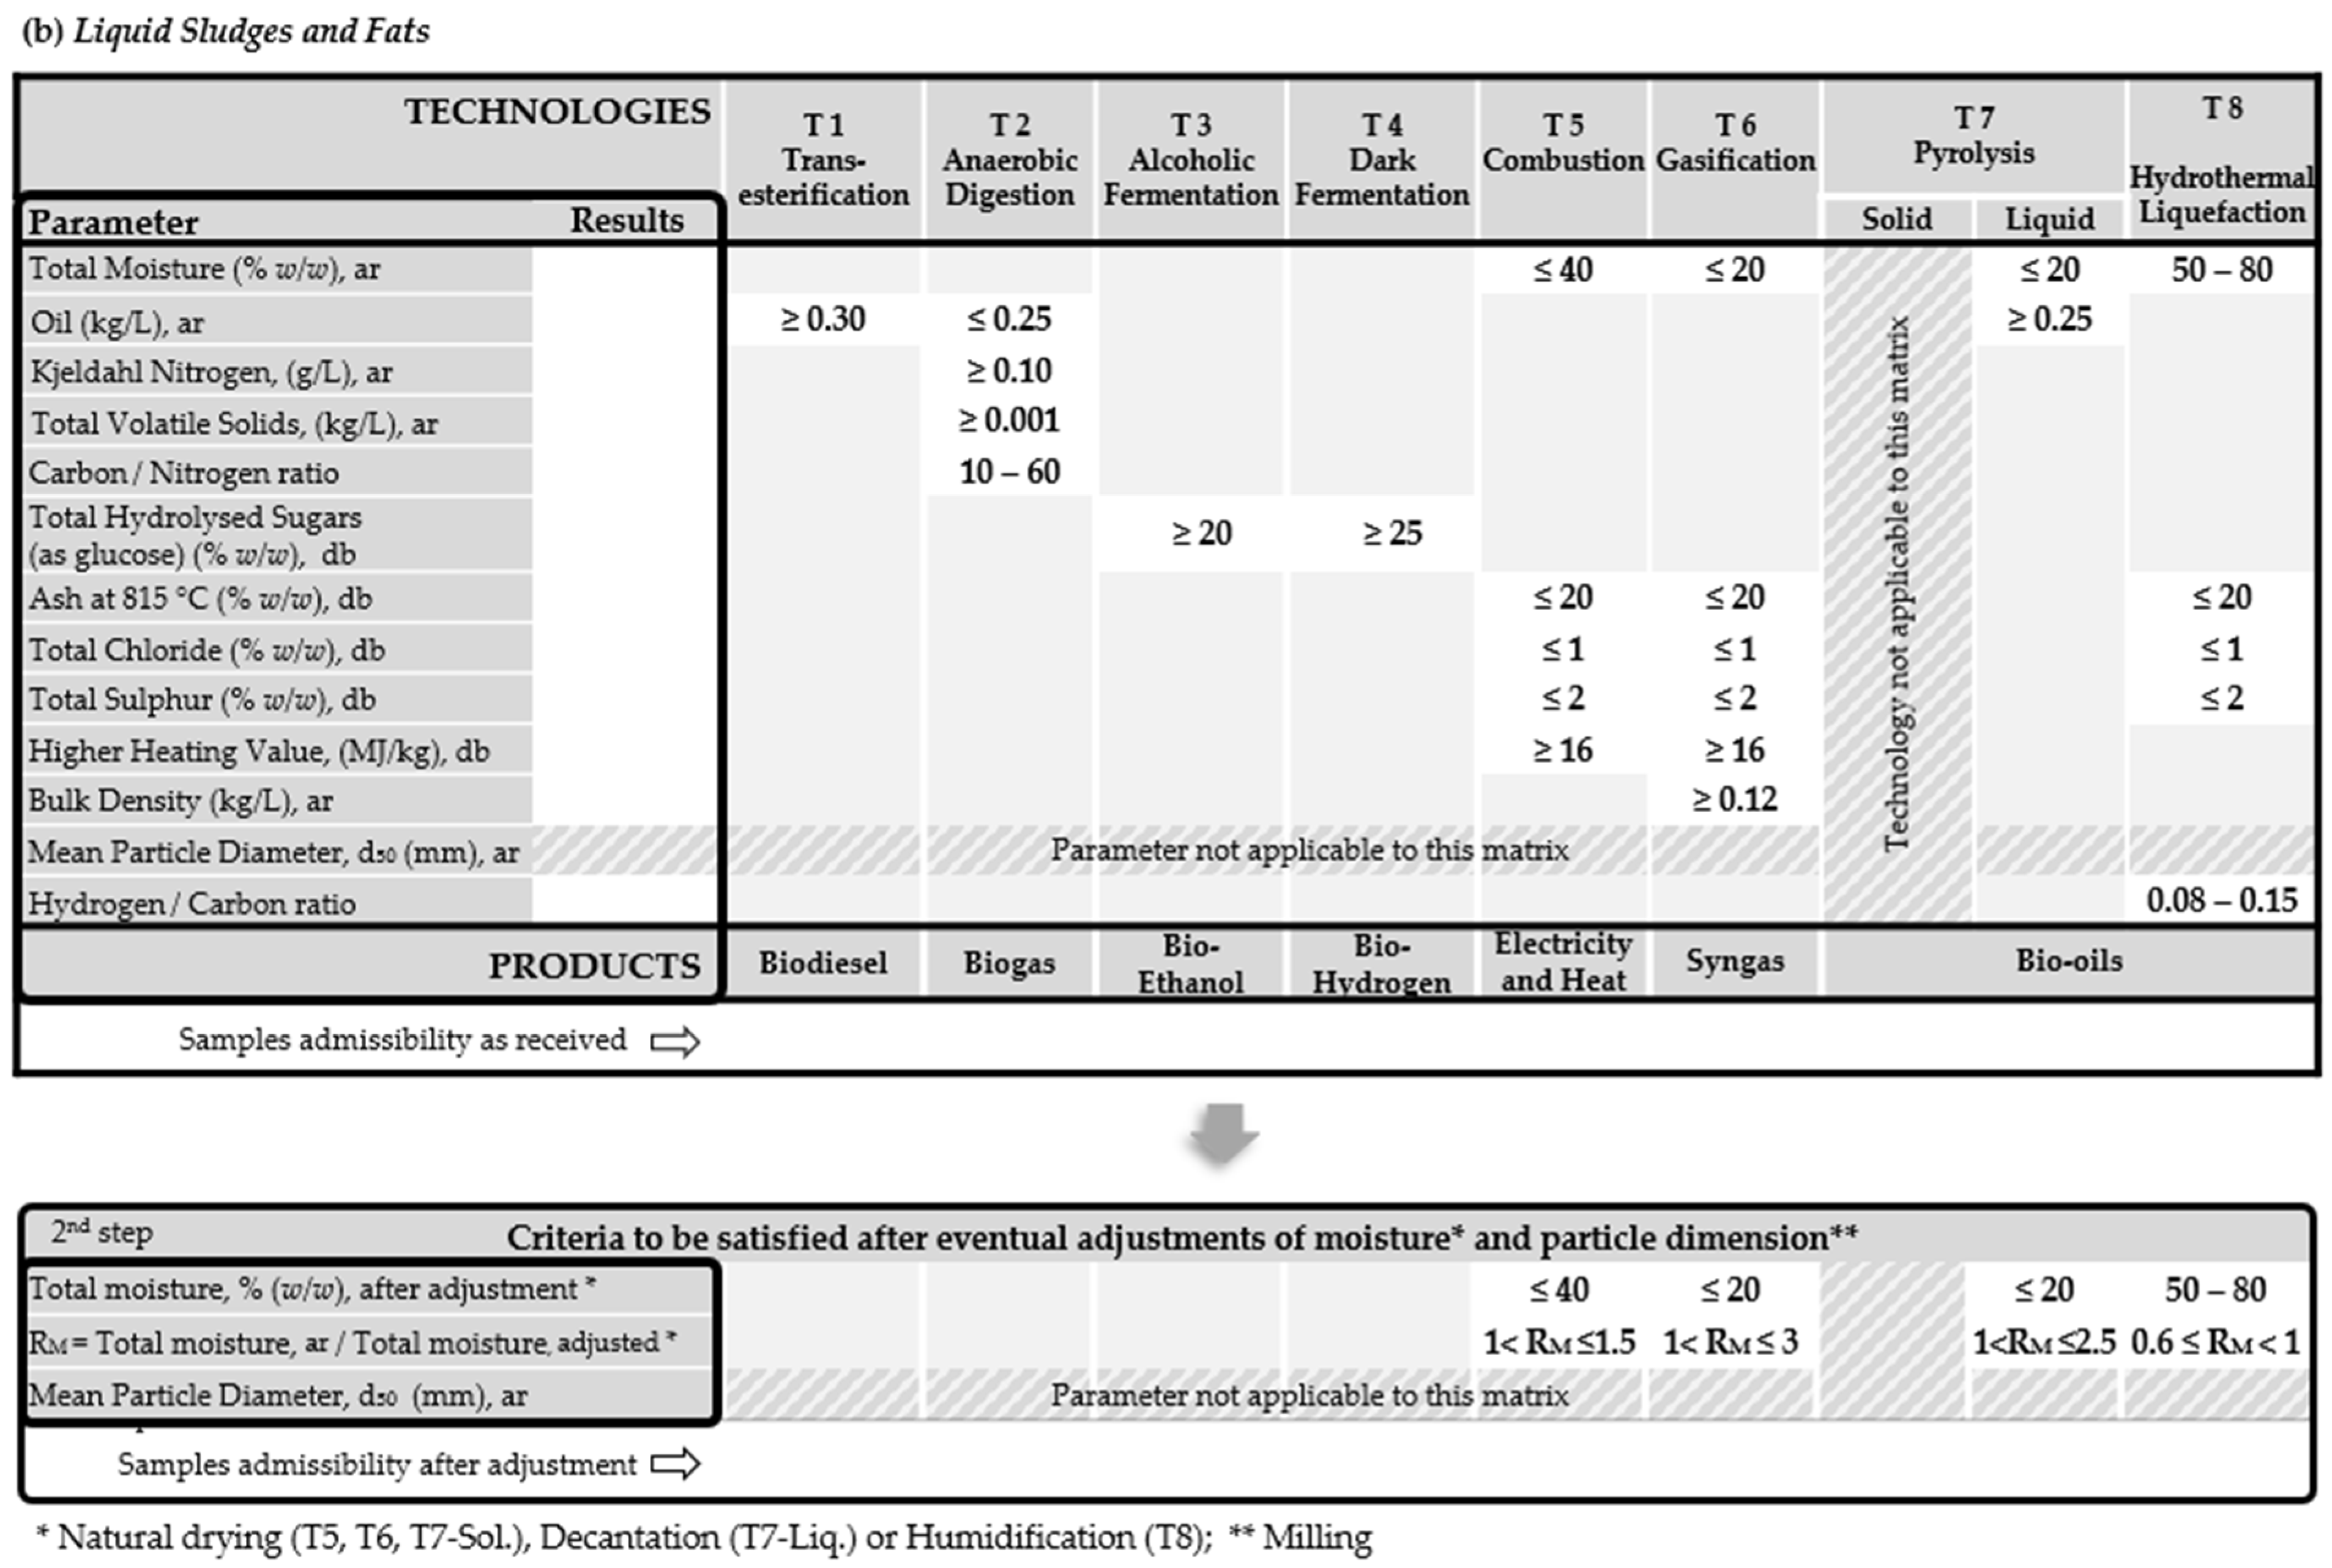
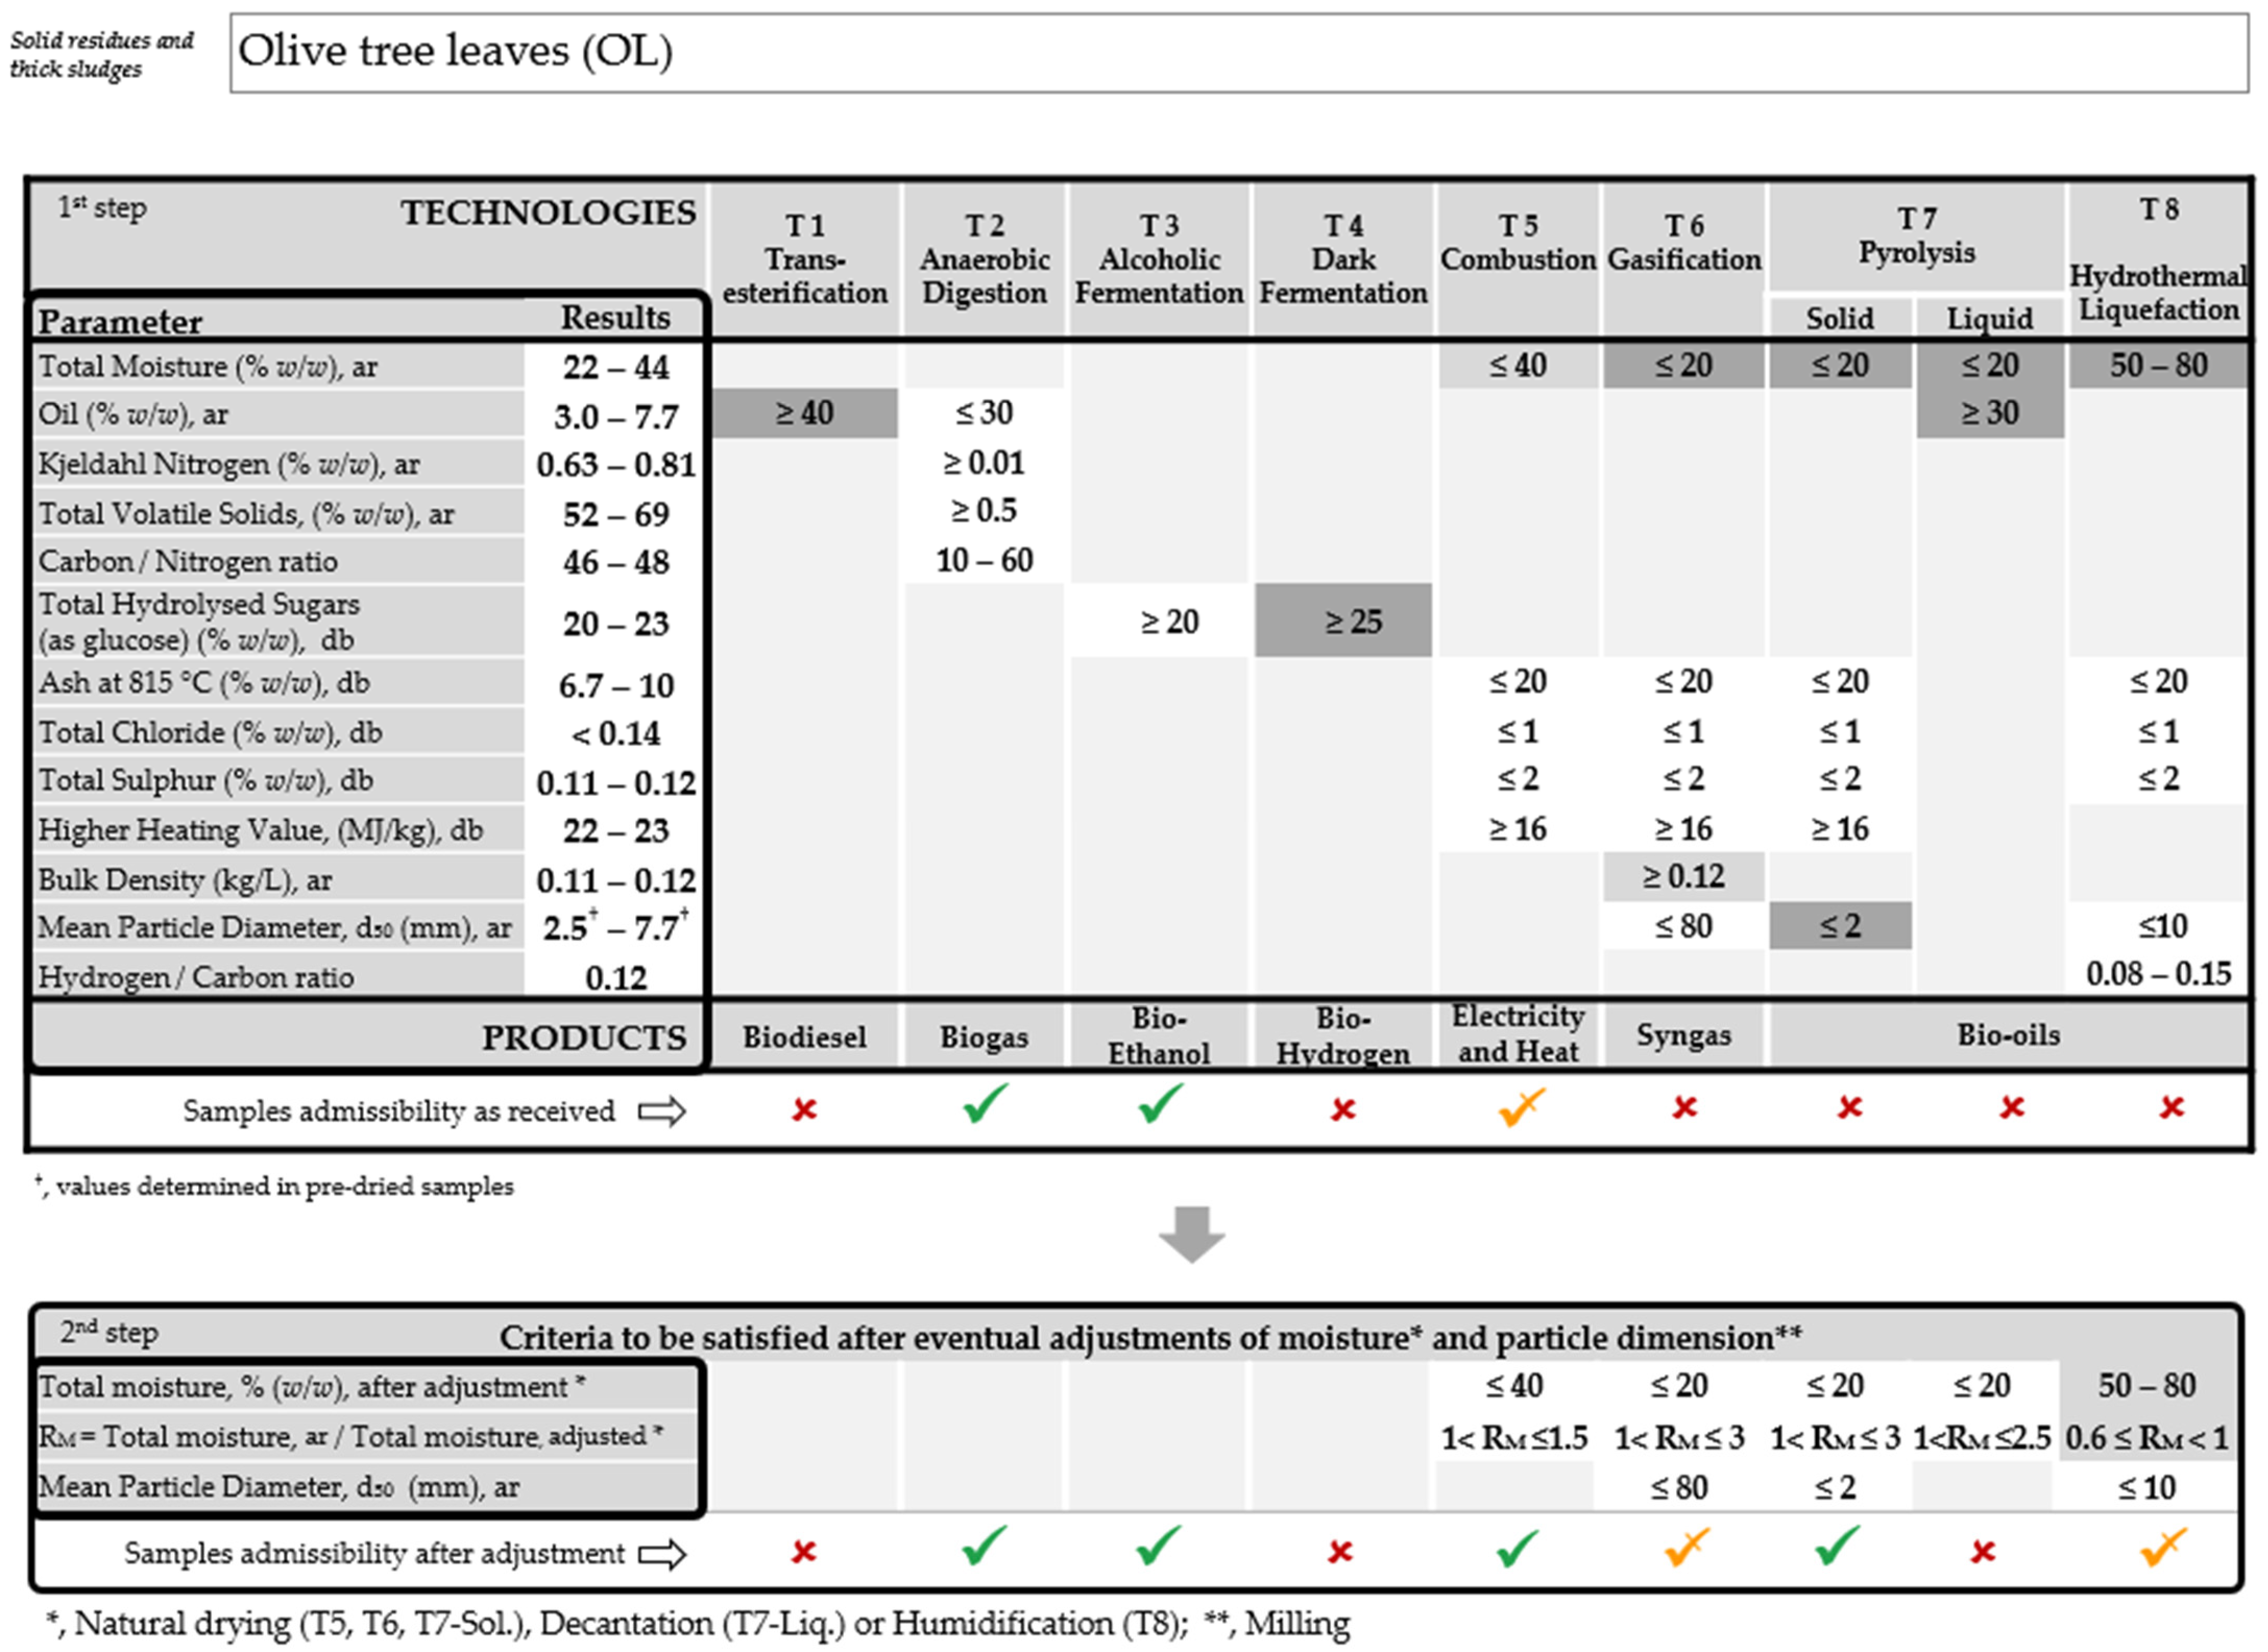
2. Model of the Admissibility Grid

An Admissibility Grid was designed as an expedite tool for the evaluation of the admissibility of waste biomass samples to the eight technologies under study. For the biomass assessment towards those technologies, 13 key parameters were identified: bulk density, total moisture, ash, mean particle diameter, total volatile solids, Kjeldahl nitrogen, oil, total hydrolysed sugars, higher heating value, total chlorine, total sulphur and the ratios carbon/nitrogen and hydrogen/carbon. The applicable limit ranges for admission to the respective technology were established in accordance with data in the literature (Section 1) and with the previous experience of the authors in the various chemical, biochemical and thermochemical conversion technologies.
The high diversity of the waste biomass types led to the design of two forms of the Admissibility Grid, one for Solid Residues and Thick Sludges and another for Liquid Sludges and Fats, given the different analytical methodologies used. Figure 1 resumes the information about the specific parameters of the technologies that were considered. The key parameters are the same for both Admissibility Grids, although, for the Liquid Sludges and Fats matrix, some parameters present different units, more usual for this type of waste biomass.
In the first step, the values or the range of values obtained in the physicochemical characterisation of each sample type were inserted in the column ‘Results’ regarding each key parameter of the Admissibility Grid. If a criterion was fulfilled by the results, i.e., if the result of the sample(s) was in accordance with the defined limits of each key parameter for the respective technology, the cell in the technology column was marked in white. If the criterion was not fulfilled, the cell turned dark grey. Whenever only part of the results of several samples of the same type met the admissibility criteria, due to the natural variability between them, the cell was marked in light grey.
At this stage, the model presents four possibilities for the admissibility of the samples to each technology:
Biomass 03 00021 i049
Admissible—all criteria fulfilled
Biomass 03 00021 i050
Not admissible—at least one criterion not fulfilled
Biomass 03 00021 i051
Conditional admission—only some samples admissible (due to results dispersion)
Biomass 03 00021 i052
Inconclusive admission—not possible to define (cases where the characteristics of the sample were outside the scope of the analytical procedure)
In several cases, samples were labelled as Not admissible to a technology either due to their inadequate total moisture content or unsuitable mean particle diameter. Nevertheless, as these parameters can be easily adjusted before admission to the conversion technology, it was therefore decided that the application of the Admissibility Grid should follow two sequential steps: in the first step the assessment was carried out on the samples as received; and in the second step, the samples classified as Not admissible were reassessed after minor adjustments for particle dimension (milling) or total moisture content (natural drying, decantation or humidification). Natural drying, i.e., exposing the residual biomass spread in thin layers on a drying floor to the air and the sun until the desired moisture content is achieved, was considered the only drying option to avoid additional energy consumption.
To evaluate the moisture content after adjustment, an auxiliary criterion was introduced: the moisture ratio (RM), defined as the ratio between the total moisture in the sample as received and after adjustment. It was set that Solid Residues and Thick Sludges samples with up to 60% (w/w) of total moisture (as received) should reach 40% (w/w) or 20% (w/w) of total moisture after natural drying to be admitted to the suitable technology. As for the HTL admission, when the total moisture (as received) was below the admissible range of 50% (w/w) – 80% (w/w), it was considered that the humidification of the samples could take place for samples with, at least, 30% (w/w) of total moisture (as received). For the samples of the matrix Liquid Sludges and Fats to be admitted to liquid pyrolysis, only decantation was allowed to reduce the total moisture from a maximum of 50% (w/w) to 20% (w/w), when possible. The reassessment output after the second step presents the same four admission possibilities (Biomass 03 00021 i049, Biomass 03 00021 i050, Biomass 03 00021 i051 and Biomass 03 00021 i052) as described in the first step.
The validation of the Admissibility Grid was performed based on 23 case studies that were selected from the best combinations of type of waste biomass, technological solution and energy product. For this purpose, the analytical results for the parameters of the selected waste biomasses were compared with the limit ranges of the Admissibility Grid, and then conversion experiments using the appropriate technology were performed to obtain product yields and rates. The results were compared with data from the literature and discussed regarding the flexibility of the feedstock and technology, as well as the applicability of the Admissibility Grid as a decision support tool for bioenergy production.

3. Materials and Methods

3.1. Analytical Procedures for the Physicochemical Characterisation

For the determination of the bulk density and total moisture content, wet test portions of the waste biomass samples were used, and the results were reported on an “as received” (ar) basis. Bulk density was determined following the guidelines of ISO 17828 [29], using a cylindrical container with 1.35 of height-diameter-ratio. The filling volume of the container was 3.7 L, determined from both the net weight and the density of the water at laboratory temperature conditions. The wet weight of the samples filled in the container, after being tapped down from the top to maintain the proper top surface, was determined from the difference of weights of the container with sample and empty. The bulk density was determined from the ratio of the sample net weight and the volume of the container. The relative standard deviation of 0.02 was calculated from duplicate analysis [30] fulfilling the target repeatability of the standard. All weightings were carried out with a Sartorius Miras IW2P1E-15-L balance.
The total moisture content of the samples included in the matrix of Solid Residues and Thick Sludges with a water content higher than 15% (w/w) was determined as the loss of mass after sample drying at 105 °C ± 2 °C using two steps and following ISO 18134-1 [31]. First, the wet samples were pre-dried in a Binder MB6 oven (Tuttlingen, Germany) with air-forced ventilation at 30 °C ± 5 °C to facilitate the milling process and minimise the biological activity, as described in ISO 14780 [32]. After spreading out and equilibrating the samples at the air temperature of the laboratory, the moisture loss during this pre-drying step (Mp) was determined as a percentage of the initial weight of the samples using the balance reported above for bulk density. Next, a part (around 100 g) of the pre-dried material was used to determine the residual moisture (Mr) at 105 °C ± 2 °C using a Venticell 55 ECO Oven (Universal Memmert Medcenter, München, Germany), thermostatically controlled with forced air ventilation (around 50%). The weighing procedure was performed with a Mettler Toledo XP 1203 S balance. Combining the Mp and Mr values, the total moisture content was determined following the ISO 18314-1 [28]. In the case of carob pulp (CP) and grape marc (GM) samples and all the samples included in the Liquid Sludges and Fats matrix, the total moisture content was determined directly after one step at 105 °C ± 2 °C following the conditions and standards reported before.
The median value of a particle size distribution, d50, was determined by screening operations, defined as the calculated particle size of a sample, where 50% of the particle mass is below and 50% is above the cumulative distribution, following an oscillating screening procedure based on ISO 17827-1 [33] and ISO 17827-2 [34]. For the screening operations, Retsch sieves, with apertures of 100 mm, 63 mm, 45 mm, 31.5 mm, 25 mm, 16 mm, 8 mm and 3.15 mm and a Retsch vibratory sieve shaker, Vibro type, were used. This parameter was not determined for the samples included in the Liquid Sludges and Fats matrix due to its pastiness. All pre-dried test samples were milled to pass through a 0.5 mm sieve in a Retsch Cutting Mill SM 2000, stored in plastic containers and refrigerated at 3 °C ± 1 °C. The milled samples were weighed in a Mettler Toledo AT 200 balance. The analytical results obtained with those milled pre-dried samples were converted to dry basis (db) using the value for moisture content of the pre-dried sample (Mp) determined by ISO 18134-3 [35], and from dry basis to as received basis using the total moisture content. Each calculation followed ISO 16993 [36].
The ash content at 550 °C ± 10 °C was obtained from the mass of the residue remaining after ignition of the sample (1 g) in the air under controlled conditions of time, sample weight and furnace temperature, until the change in mass was lower than 0.5 mg (ISO 18122 [37]). The temperature was set to increase from 20 °C to 250 °C at a rate of 5 °C/min; hold at 250 °C for 1 h; temperature increase at a rate of 10 °C/min until 550 °C and hold at 550 °C for at least 2 h. Then, the ashes were ignited at 815 °C ± 10 °C according to ISO 1171 [38] and the ash content was calculated in relation to the original weight of the sample. The difference between the ash content at 815 °C and that at 550 °C arises from the decomposition of carbonates forming CO2, by loss of volatile inorganic compounds and further oxidation of inorganic compounds (to higher oxidation states). All ignitions were performed in a furnace Heraeus M110 that allowed controlled heating according to the standards, and platinum dishes of 60 mm diameter and 20 mm height were used.
Total Volatile Solids (TVS) content is considered to represent the amount of organic matter present in the solid fraction of sludges, industrial wastes and wastewaters, and it corresponds to the weight loss after sample ignition to constant weight at 550 °C. The TVS was calculated based on the weight used to determine ashes at 550 °C and following the guidelines of APHA [39,40].
The amounts of elemental carbon, nitrogen and hydrogen were simultaneously measured in milled samples, with the Elementar Vario Macro Cube CARBO analyser following the guidelines of ISO 16948 [41] and the manufacturer instructions. Specifically, 0.05 g – 0.1 g of sample in a tin capsule was loaded into the analyser. The furnace was heated to 1050 °C under a constant flow of helium as carrier and oxygen (O2) as ignition gas, and the produced gases (CO2, H2O, N2) were carried through reduction columns at 850 °C before measurement at the thermal conductivity detector. Data were collected by the Elementar Vario Macro Cube software version 4.0.10.
For the analysis of total sulphur and total chlorine, the milled samples (around 1 g) were first pressed through a laboratory press (PARR 2811 Pellet Press), and then burned in an IKA C7000 calorimeter following a procedure based on ISO 16994 [42]. The resulting residues were transferred to 100 mL volumetric flasks with water and both sulphate and chloride ions in this solution were evaluated by ion chromatography using a Dionex IC 3000 system with a DIONEX IonPac AS9-HC 4 × 250 mm analytical column, a DIONEX IonPac AG9-HC—4 × 50 mm guard column, an ASRS—300 4-mm self-regenerating suppressor unit and conductivity detector. The eluent consisted of 9.0 mmol/L Na2CO3 with a conductivity of 23 µS ± 2 µS that was introduced into the system at a flow rate of 1 mL/min. The volume of the sample injection loop was 200 µL. Peak areas and calculations were provided by the software Chromeleon 6.70 version.
The performance of the procedures described above regarding the moisture content of pre-dried samples, ash at 550 °C, elemental carbon, hydrogen and nitrogen, total chlorine and total sulphur, was assessed by participating in the proficiency testing scheme of the International Biomass Exchange Program-BIMEP 2018.3 organised by WEPAL-Wageningen Evaluating Programs for Analytical Laboratories [43]. In all situations, the performance was classified as ‘satisfactory’ as the z-score values were between −2 and 2 [44].
Kjeldahl nitrogen reflects the nitrogen content from free ammonia and from both inorganic and organic nitrogen compounds that are converted to ammonium sulphate by a H2SO4 digestion catalysed by selenium with a high concentration of sodium sulphate. The methodology used for Kjeldahl nitrogen determination followed an in-house procedure based on the ISO 13342 [45] involving three steps: digestion, distillation, and titration. The digestion of the samples (0.5 g of pre-dried and milled or 2 g of wet samples) with 10 mL of H2SO4, 0.5 g of selenium and 9.5 g of sodium sulphate was performed using a DK 20 Kjeldahl Digestion Unit with block digester tubes. The mixtures were heated for 3.5 h at 190 °C, followed by 1 h at 290 °C. Afterwards, the digestion solutions, diluted to 100 mL and alkalised at pH 9.5 with sodium hydroxide, were distilled on a UDK140 distillation unit, to liberate the ammonia gas that was trapped in a boric acid solution. The borate anions formed were titrated with standardised HCl, from which was calculated the content of Kjeldahl nitrogen. Recoveries of 1.00 ± 0.10 were obtained from the analysis of a 20 mg/N glycine standard solution, thus ensuring unbiased analytical results.
The oil content was determined according to an in-house procedure adapted from ISO 659 [46], with hexane as the extraction solvent. The oil was extracted from 20 g of pre-dried and milled samples, being assured that the water content of the samples was less than 10% (w/w). For each test sample, an extraction cycle of 6 h in a Soxhlet apparatus was carried out and the oil percentage was determined gravimetrically after removing the solvent (using a rotary evaporator) and drying the extract at 103 °C until constant weight, using a Venticell 55 ECO Oven (Universal Memmert Medcenter, München, Germany) and a Mettler AT 200 balance. Recoveries of 0.98 ± 0.02 from analysis of oleic acid extra pure, Ph. Eur., in the analytical range of 1.4% (w/w) – 5.5% (w/w) assured the absence of systematic errors.
To determine the total amount of sugars in the samples, a quantitative acid hydrolysis method commonly used for lignocellulosic materials [47] and consisting of a two-stage acid hydrolysis was applied. First, the polysaccharide fibres were attacked with H2SO4 at 76% (w/w) at 30 °C for 1 h, making them soluble, and then with H2SO4 at 4% (w/w), at 120 °C for 1 h, to hydrolyse the sugar polymers yielding sugar mono- or disaccharides with minimum degradation. The total sugar content was then evaluated in the filtered solution (diameter 25 mm; pore size 0.45 μm) by the phenol-sulphuric colorimetric method [48], using a Hitachi U-2000 spectrophotometer and glucose as reference standard.
The Higher Heating Value at constant pressure in dry basis (HHVp,d) was calculated from de Gross Heating Value at constant volume and dry basis (GHVV,d) according to ISO 18125 [49] using Equation (1).
HHVp,d = GHVV,d − 212.2 × w(H)d − 0.8 × [w(O)d + w(N)d]
where w(H)d is the elemental hydrogen content, in percentage by mass, of the moisture-free (dry) material (including the hydrogen from the water of hydration of the mineral matter as well as the hydrogen in the biofuel substance), w(O)d and w(N)d are the nitrogen and oxygen content, respectively, in percentage by mass, in dry basis. The [w(O)d + w(N)d] content was obtained by subtracting from 100 the percentages of ash, carbon, hydrogen, and sulphur on a dry basis. A portion (0.6 g) of the milled and pre-dried sample was burned in a Parr high-pressure oxygen bomb with 1 mL of water inside the 6400 Automatic Isoperibol Calorimeter. Afterwards the bomb was washed with water and the solution was diluted to 100 mL. The GHVV,d value was calculated from the corrected temperature rise and the effective heat capacity of the calorimeter, with allowances made for contributions from ignition energy from the fuse and application of corrections due to the formation of nitric and hydrochloric acids and sulphur. The determination of chloride, nitrate and sulphate content followed the conditions described by Trancoso et al. [50] as reported above. The effective heat capacity of the calorimeter was controlled with PARR standard benzoic acid of 26.454 MJ/kg. For ten tests in repeatability conditions, a mean value of 26.463 MJ/kg with a standard deviation of 0.037 MJ/kg was obtained, proving excellent trueness and fulfilling the target repeatability, respectively.

3.2. Operating Conditions of the Chemical, Biochemical and Thermochemical Conversions

The selection of the best technological approach to promote the conversion of the chosen samples into biodiesel, depends on the acid value which was measured by titration [51]. The samples OOF1 and DR presented acid values of 48.8 mg KOH/g and 5.3 mg KOH/g respectively. Due to the high level of free fatty acids in the samples it was decided to perform a single acid esterification step using sulfuric acid, as catalyst, and methanol. The (trans)esterification was carried out in an orbital shaker (New Brunswick Scientific, Edison, NJ, USA) at 55 °C and 200 rpm for 8 h in tight Erlenmeyer flasks containing 250 g of residue, a catalyst amount of 22% (w/w) and an alcohol:oil molar ratio of 50:1. Afterwards, the organic phase was separated, washed with water (2% (w/w)) and analysed for the FAME content by gas chromatography. This analysis was performed according to the EN 14103 standard, on a CP-3800 gas chromatograph (Varian, Middelburg, Netherlands) equipped with a 30 m SUPELCOWAX 10 capillary column (0.32 mm of internal diameter and 0.25 μm of film thickness). The injector (split 1:50) and the detector (flame ionisation) temperatures were kept constant at 250 °C while the oven temperature was programmed to change from 60 °C, after 2 min, to 200 °C at 10 °C/min and then to 240 °C at 5 °C/min. Helium was used as carrier gas.
Fermentation to bioethanol was carried out using Ethanol Red® from Leaf (Lesaffre Advanced Fermentations, Marcq-en-Barœul, France), a C6-fermenting industrial Saccharomyces cerevisiae yeast. Strain cultivation was conducted in shake flasks under semi-anaerobiosis at 30 °C and 150 rpm, in duplicate. A preculture of the yeast was prepared in 50 g/L of glucose for 16 h, under similar supplementation and culture conditions. The cells were harvested by centrifugation, washed two times and resuspended to obtain the initial 1 g/L inoculum concentration. The sugar-rich syrups obtained from carob pulp or from the primary sludges from the pulp and paper industry that were used as carbon source, were prepared as follows. Deseeded carob pulp in the form of kibbles was crudely grounded using a mixer (Maeva NGS-Home) and then extracted by direct contact with water (liquid/solid (L/S) ratio of 3) for 3–5 h at room temperature. The liquid fraction (carob syrup) was recovered by filtration was sterilised by autoclaving and used as culture medium. Pressed sludge consisting of the final solids collected in the local WWTP of pulp and paper mills was also used as substrate for ethanol fermentation. In this case, the as received sludge exhibited a high mineral content that rendered the resulting suspensions alkaline and hampered enzymatic hydrolysis, and thus it had to be neutralised with hydrochloric acid (0.2 g HCl/g oven-dried sludge) before use. The hydrolysate obtained after 48 h-enzymatic hydrolysis, by incubation at 50 °C and 150 rpm, starting from 25% (w/v) solids loading, by applying 3% (w/w oven-dried solids) Cellic® CTec3 cocktail, was used as culture medium, supplemented with: yeast extract, 2 g/L; (NH4)2·SO4, 2.5 g/L; KH2PO4, 1 g/L; MgSO4·7H2O, 0.3 g/L. During the fermentations to bioethanol, samples for ethanol and sugars analysis were collected over 72 h. These were analysed by HPLC using an Aminex HPX-87H column (Bio-Rad, Hercules, CA, USA), at 50 °C, with H2SO4 5 mM as mobile phase at 0.6 mL/min flow rate.
AD was performed under anaerobic and batch conditions. Each reactor was inoculated at 30% (V/V) using sludge collected in a municipal anaerobic digester plant. The process was performed at 37 °C for 30 days. A pressure transducer, previously calibrated for the headspace volume of the reactors, was used to determine the produced biogas. The results were expressed under standard conditions of temperature and pressure (STP: 0 °C, 1 bar). The biogas composition in methane was characterised by gas chromatography as described in Eusébio et al. [52].
DF assays were performed with Enterobacter aerogenes ATCC 13048 Sputum (American Type Culture Collection, Manassas, VA, USA) under batch conditions as described in Batista et al. [53] and with Clostridium butyricum DSM10702 (German Collection of Microorganisms and Cell Cultures, Braunschweig, Germany). In this case, a 1.65 L bench-scale double jacketed glass bioreactor with a working volume of 0.5 L, equipped with a pH sensor (405-DPAS-SC-K8S/250, Mettler Toledo, Columbia, MD, USA) and controller (MOD 7F, SGI, USA) was used. The operational settings were according to Ortigueira et al. [54,55].
For combustion tests, biomass was continuously supplied to a bubbling fluidised-bed combustor using a screw feeder. An auxiliary gas flow was used to facilitate the feeding. The screw feeder was externally water-cooled to prevent pyrolysis during feeding. Above the wind box was located a distributor plate to introduce primary air, and secondary air was supplied at 0.3 m above the top of the bed. At the top of the combustor was a cyclone, to retain particles from the flue gases. These gases were sampled after the cyclone and went into online analysers to determine O2, CO2, CO, N2O, NOx, and SO2 contents. Detailed information may be found in Abelha et al. [56].
The gasification was performed in a bubbling-fluidised-bed (BFB) gasification reactor with a height of 1500 mm and an inside diameter of 80 mm. The gasifying/fluidizing agent was introduced at the bottom of the reactor through a gas distributor. To avoid pyrolysis of the feeding material, the feeding system was cooled with water. The feeding operation was helped by nitrogen (N2) flow, which also prevented inside gas back flow. Particulates entrained by the gasification gas were collected in a cyclone at the top of the gasifier. Afterwards, there was a quenching system to remove tar and condensable liquids from syngas. Next, the gas was filtered, and directed into CO and CO2 on-line analysers. Tar, H2S and NH3 contents in gasification gas were also analysed. Syngas samples were collected to determine the concentration of CO, CO2, H2, CH4, O2 and other higher gaseous hydrocarbons, referred to as CnHm, by gas chromatography (GC). At the end of each gasification test, the solid bed residue (with mineral matter and unconverted carbon from the feedstock) was also collected. More detailed information may be found in Pinto et al. [57]. Each pyrolysis test started with the introduction of 20 g of sample into the batch reactor, with a capacity of 0.16 L. Then, the reactor was sealed according to the equipment operation and safety procedure. To guarantee the inert atmosphere inside the reactor, a pre-settle pressure of N2 was added. After the pyrolysis test ended, the reactor was cooled in an ice bath to room temperature. The gaseous products were measured, collected, and analysed by GC with flame ionisation and thermal conductivity detectors. When the reactor was open, the liquid and solid products were separated and subsequently analysed. When the OOF1 sample was used, the liquid products were composed of an aqueous and an organic phase. In this case, the phases were separated by decantation and the organic one was distilled and analysed by Gas Chromatography–Mass Spectrometry (GC/MS).
A 0.16 L batch reactor built in Hastelloy C276 by Parr Instruments was used to perform the HTL tests. The reactor was coupled to a controller device connected to a pressure gauge and to a thermocouple to control the pressure and temperature inside the reactor. At the beginning of the HTL test, the reactor was loaded with the feedstock previously selected, closed, and purged with N2 to ensure an inert atmosphere inside the reactor. The operation conditions were selected based on a previous study performed by the authors [58]: 30 min reaction time, 325 °C and a biomass/water ratio of 1/10 (w/w). An initial N2 pressure of 3.9 MPa was chosen to guarantee that the operating pressure was within the desired range for the process to occur. A total of 77 g of material (7 g of biomass and 70 g of water) was always used to load the reactor. After the reaction time previously defined, the reactor was cooled in an ice bath until it reached room temperature. The gas products were measured, collected and analysed by GC with flame ionisation and thermal conductivity detectors. The liquid and solid products were separated using a procedure previously settled [58]. The bio-oil was characterised by GC/MS.

4. Results and Discussion

4.1. Waste Biomass Types

The waste biomass samples under study had different origins. The first group included several organic fractions of MSW, namely food waste (FW) from large producers like restaurants, canteens and the catering industry, green wastes and small branches from the separate collection of MSW, the organic fraction for composting that was obtained after mechanical and biological treatment of MSW, the fraction for organic recovery after mechanical treatment of MSW, and sewage sludges from WWTPs. The second group included biowastes and by-products from agro-industries, namely from dairy, olive oil, locust bean and wine productions, chestnut and tomato processing, and poultry farms, including sludges from the respective IWWTP, and primary sludges from the pulp and paper industry.
To establish a harmonised characterisation methodology, samples were aggregated under two main matrix types (Table 2): (a) Solid Residues and Thick Sludges, which included separated organic fractions from MSW, green and brown wastes, organic fractions obtained after MBT and MT of MSW, sewage sludges, olive tree leaves and branches, olive stones and pomace, chestnut shells, grape marc, sludge from yogurt production, tomato pomace and sludge from tomato processing, sludge from fruit processing, poultry litter, carob pulp, and primary sludge from pulp and paper industry; and (b) Fats, which included the fraction obtained after food waste pre-treatment for organic valorisation, the waste organic fraction with a high fat content from the olive oil industry, liquid sludges from chestnut processing, wine lees, fat residue from yogurt production, and residues from fruit processing.

4.2. Physicochemical Characterisation

The analytical results are summarised in Table 3 and Table 4 for the samples included in the Solid Waste and Thick Sludges matrix and in Table 5 for the Liquid Sludge and Fats matrix. The results and the respective measurement units were rounded to display two significant digits, except those below 0.1, which were rounded to one significant digit.
There was a large variability in the total moisture content in samples of the Solid Residues and Thick Sludges matrix even between samples from the same origin (Table 3). Moisture is expected to be high in samples such as FW and SS, but more dependent on the composition in the case of GBW. The samples of mixed MSW after TMB, i.e., after mechanical sorting and composting, showed high ash content and low HHV values. This was mainly due to the unsorted nature of this waste collection, resulting in considerable contamination of the organic fraction of the MSW with household metals and glass.
In the samples of industrial origin from the Solid Residues and Thick Sludges matrix (Table 4), the residue from yogurt production differed by its high fat content (40% (w/w)), which rendered the burning, and the elemental and mineral analysis, unfeasible. The same happened with IWWTP sludge from tomato processing but in this case, it was due to a high ash content (84% (w/w)). The CP and GM samples presented TVS values above 80% (w/w), while TP and one of the PPS samples contained 58% (w/w) and 74% (w/w) of hydrolysed sugars in their composition. The large variability of the latter parameter comes from the different typologies of pulp and paper mills where the sludges were collected. One of the sludges was collected in a mill producing pulp (used to obtain viscose rayon and other cellulose derivatives) by an acid sulphite cooking process, which is defined as having a high degree of purity relative to the amount of α-cellulose, with hemicelluloses and lignin needing to be removed almost entirely. Therefore, its primary sludge exhibited very low sugar content and, by contrast, high lignin and ash contents. In addition, two of the PPS samples were collected from mills with integrated pulp and paper production, while the others came from mills producing only pulp. The former generates sludges with higher mineral (ash) content, consisting of paper additives, and therefore lower sugars content.
The samples from the dairy industry and FPW analysed in the matrix Liquid Sludges and Fats presented interesting values of hydrolysed total sugars for a valorisation by biological conversion (Table 5). On the other hand, the oil content of the liquid residue from the olive oil industry may cause some difficulties in its disposal [59] and therefore alternatives for its valorisation would be highly advantageous.

4.3. Application of the Admissibility Grid

Figure 2 presents an example of the application of the Admissibility Grid to the group of olive tree leaves (OL) samples as received for physicochemical characterisation. The individual application of the Admissibility Grid to all residual biomass samples of this study is presented in Figures S1–S24, as Supplementary Material.
The samples of OL fulfilled the admissibility criteria for AD and alcoholic fermentation (Figure 2) and so the cells of oil content, Kjeldahl nitrogen, total volatile solids, carbon/nitrogen ratio and total hydrolysed sugars parameters were marked in white. The limit ranges for the parameters ash, total chlorine, total sulphur, higher heating value, mean particle diameter and hydrogen/carbon ratio were also fulfilled in the admission to combustion, gasification, solid pyrolysis and HTL, and the cells were also marked in white. The limit ranges of oil content for (trans)esterification, total hydrolysed sugars for DF, total moisture for gasification, pyrolysis and HTL, and oil content and mean particle diameter for pyrolysis were not fulfilled and the cells were shadowed in dark grey. In the cases where only part of the sample sets that were analysed fulfilled the admissibility ranges, the cells were painted in light grey (e.g., bulk density for gasification). The two analysed samples of olive tree leaves were admissible to AD and alcoholic fermentation, but only one was admissible to combustion, as received. However, after the application of moisture and/or particle dimension adjustments, both samples turned admissible to combustion as well as to solid pyrolysis, and one of them even became admissible to gasification and to HTL, thus enlarging the possibilities of conversion.
Table 6 summarizes the admissibility assessment of the samples from the Solid Residues and Thick Sludges and the Liquid Sludges and Fats matrices to the eight studied technologies, considering the outputs of the corresponding Admissibility Grid (presented as Supplementary Material, Figures S1–S24). In the cases where the admissibility resulted from a reassessment by application of the second evaluation step, it was always indicated whether a moisture adjustment, a dimension adjustment or both adjustments were made.
In 18 cases, the application of minor adjustments to the samples in the second assessment step led to a broader admissibility to the technologies, improving the scope for valorisation of the samples.

4.4. Validation of the Admissibility Grid

The validation of the Admissibility Grid was performed based on case studies that were selected from samples of the Solid Residues and Thick Sludges and the Liquid Sludges and Fats matrices, according to the waste biomass physicochemical characterisation and the different conversion pathways of each technology tested. Thermochemical pathways involve the use of heat and chemical reactions to convert biomass into biofuels. Chemical pathways involve using specific chemical reactions to transform biomass or its components into biofuels. Biochemical pathways rely on the metabolic activities of microorganisms to convert biomass components, typically sugars or carbohydrates, into biofuels. Each pathway has its own advantages, challenges, and applications. Thermochemical pathways offer feedstock flexibility, efficient conversion of a wide range of feedstocks, and production of multiple products, such as bio-oil, syngas, and biochar, yet can be energy-intensive and require more complex processing. Chemical pathways provide specific and controlled reactions for producing biodiesel and upgrading bio-oils, but they are limited to certain feedstock types (oily wastes) and may involve costly catalysts. Biochemical pathways are well-suited for carbohydrate-rich feedstocks, have lower greenhouse gas emissions, and can use well-known fermentation technologies, but they might require specific conditions for microbial growth and fermentation. The choice of the pathway depends on factors like feedstock composition and availability, desired biofuel output, energy efficiency, environmental considerations, and the maturity of the technology.
Fourteen samples among those validated by the Admissibility Grid were tested for the admissible technologies, either chemical, biochemical or thermochemical. The process rates and product yields obtained for each case study are shown in Table 7.
Only two biomass samples complied with the criteria set for admissibility to use in (trans)esterification: DR and OOF1. However, before testing the samples, the conversion process had to be established. A parameter, not discriminant for admission, but crucial for the choice of the suitable technological procedure, is the acid value, and the samples tested presented acid values of 5.3 mg KOH/g and 48.8 mg KOH/g respectively. In the latter case, acid catalysis should be used, while in the first case, the most efficient procedure is usually a 2-step process starting with a fast acid catalysis to convert the free fatty acids followed by a traditional basic catalysis step aiming at converting the triglycerides. Nevertheless, when a 2-step production process was tried over the DR sample, it was observed that, after the first step, almost no conversion had occurred, and the acid value remained unchanged. Therefore, the final decision on the technological conversion process was to perform a longer single-step acid catalysis on both samples.
The yield for the conversion of OOF1 was only 20% (w/w) or 40.5% (w/w) when concerning the total amount of material able to suffer esterification (oil in sample). Regarding the DR sample, the acid catalysis was again a complete failure (an organic phase containing 7.8% (w/w) of esters resulting from a 0.9% (w/w) conversion yield). Although the two samples tested had amounts of oils and fat higher than 40% (w/w), in neither case was possible to obtain biodiesel. The FAME fraction obtained from the conversion of the olive oil residue, after separation and washing, contained only 34.9% (w/w) of esters and a minimum amount of 96.5% (w/w) of esters is the main quality requirement for biodiesel. It is believed that the prime reason for these unexpected results was the high level of impurities and also a high amount of water in the DR sample (34% w/w). A way to overcome these interferences could be to perform a previous solvent extraction step, as the amount in the samples, namely in the DR, was very promising.
The admissibility criteria established for AD made it possible to find 17 admissible types of waste biomass among all the characterised samples. Five of them (OP1, CS2, DS, CPS, and FPW) were tested to validate the Admissibility Grid. Concerning the Solid Residues and Thick Sludges matrix, the highest yield of 11 L CH4/kg biomass, i.e., 46 L CH4/kg VS, was obtained with the CS sample. However, it is interesting to note that the biogas produced showed the lowest methane concentration (46% (V/V) CH4). A potential cause for the poor biogas quality produced from CS is the high content of lignocellulosic [60] and polyphenolic compounds, especially tannins [61], which are substances reported as inhibitors of the AD process. On the other hand, the digestion of DS showed a low product yield of 2 L CH4/kg biomass, yet corresponding to the highest methane yield when expressed by TVS (209 L CH4/kg VS) and to the highest methane concentration (73% (V/V) CH4) in the biogas produced, similar to that of other dairy sludges [62], showing that the result obtained for this substrate is in line with values reported in the literature. In fact, dairy sludges may contain relevant amounts of lipids, which have a higher energy potential than proteins and carbohydrates, promoting the formation of larger volumes of biogas with a higher fraction of methane. OP might contain relevant amounts of lignin and polyphenols from the olive peel and pulp that can be inhibitors of the AD process; however the digestibility of the OP1 sample was proved. The obtained product yield of 4 L CH4/kg biomass, corresponding to 147 L CH4/kg VS, was in the range of the values reported in the literature [63].
Regarding the Liquid Sludges and Fats matrix, FPW presented a methane yield of 2 L CH4/kg biomass, i.e., 190 L CH4 kg/VS, higher than the value of 152 L CH4 kg/VS obtained for the CPS sample. Fruit residues are one of the most suitable substrates for AD as they are easily biodegradable due to an inherent high moisture and high vs. content. The FPW substrate characterisation (Table 5) also revealed a relatively high concentration of total sugars (as glucose). The results obtained in the digestion of the liquid sludges agreed with those found in the literature [64,65]. Globally, a methane concentration range of 62–73% (V/V) CH4 in the biogas produced, recognised as the more common values for a profitable AD process in terms of CH4 production [66], confirmed the validation test for samples from both matrices. It is essential to emphasize that all tests were carried out without pre-treatment of samples and without the addition of any complementary substrates to promote the development and maintenance of the process.
Both CP and PPS1 samples tested for ethanol fermentation provided economically feasible ethanol concentrations (above 40 g/L), corresponding to high product yields of, respectively, 86% and 73% relative to the maximum theoretical conversion. The assessed yields and productivities (Table 7) positively compared with the conversions reported for several types of biomass [67]. Indeed, the high sugar content of these residual feedstocks made it possible to obtain high-concentrated sugar solutions by simple batch extraction or enzymatic hydrolysis, with titres (130–150 g/L) close to the ones achieved by applying a fed-batch strategy at high solids loading [68]. Regarding the production of ethanol from PPS, the conversion was more effective than a previously reported study using recycled paper sludge under high solid loadings [69].
Five types of waste biomass were tested for DF: FW1, CS1, CP, SCW and FPW. The highest product yields, 84 and 72 L H2/kg dry biomass, were obtained with CP and FW1, respectively. The high H2 yield obtained with CP was associated with the presence of glucose, fructose and sucrose, which are easily metabolised by the microorganisms responsible for DF [70]. The results obtained from FW conversion were slightly lower than those reported for food and cafeteria waste in a continuous stirred tank reactor (CSTR) and an anaerobic sequencing batch reactor [71,72]. This was not at all unexpected, since the composition of FW is strongly variable and the H2 yield per unit of biomass is highly dependent on the chemical composition of the substrate and particularly on its carbohydrate concentration.
Eight types of biomass have met the admissibility criteria for combustion, either with or without granulometry and/or moisture adjustment. The specific samples received under the framework of the CONVERTE project were not evaluated as case studies. The expected YP/S would range from 5–9 to 6–10 MJ/kgdb, [56], and these values are in agreement with results reported by other researchers [73]. Three types of biomass that met the admissibility criteria for gasification were tested: OP3, OL1 and OS. The gasification of these biomass samples did not give rise to operational problems, regarding both the feeding system and the gasification process. However, during long time gasification runs and especially with OS some bed agglomeration might have occurred, due to the chemical composition of this waste biomass. This problem may be solved by adding low-cost catalysts or minerals to the gasification medium. As presented in Table 7a, the gasification results agreed with those found in the literature, namely previous results obtained in the same installation [74] and others reported by different researchers [75]. Although the gasification gas composition varied with the type of biomass tested, the values obtained were within the range of expected results and suitable for a wide range of applications. Depending on the type of application, different cleaning and conditioning processes may be needed.
Two types of waste biomass that met the admissibility criteria for liquid pyrolysis were tested: DR and OOF1. The bio-oil yield obtained from each raw material was similar, about 70% (w/w), while the aqueous phase was 17% (w/w) for DR and 27% (w/w) for OOF1. The gaseous phase was 9% (w/w) for the DR and 3% (w/w) for the OOF1. These results agree with other studies found in the literature using waste vegetable oils [76,77]. Only the GBW1 sample was tested among the samples that met the admissibility criteria to HTL. The bio-oil yield obtained was 60% (w/w), while the aqueous phase was 25% (w/w), the gaseous phase was 10% (w/w) and the solid residue 5% (w/w). The results obtained agree with other studies that use wet biomass wastes. However, bio-oil yields from HTL of wood biomass may vary along a wide range of values (17 and 68% (w/w)) due to the strong dependence on the operation parameters, catalysts and solvents [25].

4.5. Technology and Feedstock Flexibility

The flexibility of the technologies to admit a broad diversity of waste biomass is important to cope with problems of scale and seasonality. Moreover, the possibility of co-converting residual substrates opens the door to more economical and sustainable processes. This study showed that AD was the most flexible technology for the conversion of the tested waste biomass samples into bioenergy products. AD is a technology with a high degree of maturity, being already a very flexible process both in terms of process design and in terms of substrate quality. Therefore, the high number of admissibilities to this technology (n = 17, Table 6) was not surprising. The fermentation to bioethanol achieved 15 possible admissions, encompassing notably the possibility of upgrading primary sludges generated in the pulp and paper industry, with high conversion yields (Table 7a). This resulted naturally not only from the predominance of the organic fraction in these waste biomass samples but also from the robustness of the AD processes and, in the case of alcoholic fermentation, from the possibility of obtaining suitable concentrations of fermentable sugars. Combustion, gasification, solid pyrolysis and HTL presented each a considerable number of admissions (n = 8, Table 6). Nevertheless, combustion may tend to present more problems of gas emissions with contaminants, particularly with the use of residual feedstocks. (Trans)esterification and liquid pyrolysis to produce bio-oils were the least suitable technologies for energy conversion of the samples under study due to the particular need for a high initial oil concentration.
Four out of five samples with origin in municipal waste management, either MSW from mixed or separated streams, and sewage sludges, would be admissible for AD (Table 6). In this group, the green and brown wastes from separated streams showed the versatility to be used not only in AD but also in the bioconversion to ethanol and, after adjustment of moisture content and/or particle size, in almost all thermochemical technologies under study, except liquid pyrolysis, DF and (trans)esterification. The bioenergy production opportunities for the organic fraction after MBT and sewage sludges were more limited. In the former this was essentially due to a strong contamination with inert materials coming from the mixed origin of the waste. Downstream of the MSW collection process, the low sorting efficiency of some waste treatment facilities also does not allow for a significant improvement in the further separation of the mixed streams. This has been a problem in Portugal, given that the so-called “remaining fraction”, which still includes organic matter, lacks the necessary quality to be used either as compost or to be incinerated, and has been to be landfilled [78]. In this case, it seems essential to extend the practice of separate collection of MSW to carry out adequate carbon recycling from the biowastes and to increase diversion from landfill to achieve the 2030 targets set by the EU [79].
Within the Solid Residues and Thick Sludges matrix, the samples of OP, TP and PL showed admittance to the same seven different technologies: AD, fermentation to ethanol, DF, combustion, gasification, solid pyrolysis and HTL. While OP and TP are seasonally produced in Portugal, PL is generated throughout the year, supported by more than 50 million effectives (chickens, laying hens, ducks, quails and turkeys) in Portugal in 2019 [80]. The possible co-channeling of these residual biomasses for thermochemical conversion would advantageously help to assure the necessary scale-up to the process. Also, OP poses a high disposal problem in Portugal due to the importance of the olive industry in the national industrial portfolio, which reached 1.37 million tonnes of olive oil production in 2022 [81]. The composition of OP, rich in polyphenols and with phytotoxic and microbial inhibition potential, also makes the utilisation of this residual biomass very challenging [82]. The admission to seven possible technologies opens the door to conducting a more extensive comparative study between biochemical and thermochemical solutions, to select the process that proves to be the most environmentally friendly. In the Liquid Sludges and Fats matrix the number of admissions was higher in the technologies based on fermentative processes, which are conducted in liquid or slurry media, and AD was again the technology with the highest number of admissible samples (n = 4, Table 6).

5. Conclusions

The Admissibility Grid developed in this study made it possible to predict, among 24 types of waste biomass samples, which chemical, biochemical or thermochemical conversion technologies would be the most suitable to valorise them as bioenergy product. AD technology for methane production proved to be the most versatile in admitting the studied samples, especially towards environmentally problematic samples such as OP. Conversely, the fermentation to bioethanol and DF for hydrogen production depended heavily on the carbohydrate content of the samples. The admission to the thermochemical technologies was considerably increased in several cases by a previous simple and natural drying stage, without the need for additional energy expenditure. The exception was HTL, which advantageously admitted wet and highly contaminated biomasses such as sewage sludge. The (trans)esterification and liquid pyrolysis technologies, respectively, to produce FAME and bio-oils, presented more limitations but displayed the great advantage of being able to use oily wastes, which are difficult to dispose of otherwise.
The use of waste biomass for energy production often lacks a systematic and comparative assessment of its suitability to be admitted to the various possible conversion technologies. The Admissibility Grid as a support tool should favour a more technically informed decision and eventually serve as a starting point to evaluate the possibility of combining different waste biomass types, accounting for the seasonality of certain agricultural and/or agro-industrial wastes. Overall, it is expected the application of this Admissibility Grid will be extended to other types of waste biomass as part of a common assessment for energy production, leading to more sustained routing decisions.

Supplementary Materials

The following supporting information can be downloaded at: https://www.mdpi.com/article/10.3390/biomass3040021/s1 (Figures S1–S24). The data include the application of the Admissibility Grid to the organic fractions of Municipal Solid Waste (MSW) and Sludges from Wastewater Treatment Plants (WWTP) samples within the Solid Residues and Thick Sludges matrix; the application of the Admissibility Grid to organic fractions from industrial wastes, sludges, and by-products samples within the Solid Residues and Thick Sludges matrix; and the application of the Admissibility Grid to organic fractions of Municipal Solid Waste (MSW), Sludges from Wastewater Treatment Plants (WWTP), organic fractions from industrial wastes, sludges, and by-products samples within the Liquid Sludges and Fats matrix.

Author Contributions

Conceptualisation, P.M. and F.G.; Methodology, A.T.C., M.A.T., A.E. and P.M.; Validation, A.T.C., M.A.T., A.E., A.C.O., P.C.P. and P.M; Formal analysis, A.T.C., M.A.T., A.E. and P.M.; Investigation, all authors; Resources, A.E., A.C.O., P.C.P., M.A., I.P.M., P.A.S.S.M., S.M. and H.A.; Data curation, A.T.C., M.A.T., A.E., A.C.O., P.C.P. and P.M.; Physicochemical and admissibility evaluation of waste biomass, A.T.C. and M.A.T.; (Trans)esterification to fatty acid methyl esters, A.C.O. and P.C.P.; Anaerobic digestion to methane, A.E. and I.P.M.; Fermentation to bioethanol, S.M. and H.A.; Dark fermentation to biohydrogen, P.M. and P.A.S.S.M.; Combustion to electricity and heat, F.P. and R.A.; Gasification to synthesis gas, F.P. and R.A.; Pyrolysis and hydrothermal liquefaction to bio-oils, P.C.; Writing—Original draft preparation, A.T.C., M.A.T., A.E., A.C.O., P.C.P. and P.M.; Writing—Review and editing, all authors; Supervision, P.M.; Project administration, F.G. and P.M.; Funding acquisition, F.G. and P.M. All authors have read and agreed to the published version of the manuscript.

Funding

This work was supported by the National CONVERTE project, under POSEUR and PORTUGAL 2020 Partnership Agreement No. POSEUR-01-1001-FC-000001.

Data Availability Statement

The data are not publicly available due to confidential agreement with the entities that provided the samples for the study.

Acknowledgments

The authors acknowledge Joana Ortigueira, Fernando Loureiro, A. Rita Sousa, Sandra Calisto, Jorgiana Branco, Ana Passarinho, Amélia Caldeira, Graça Gomes and Ricardo Mata for their assistance in some physicochemical analysis and conversion technologies.

Conflicts of Interest

The authors declare no conflict of interest.

Abbreviations

ADAnaerobic digestion
BFBBubbling-fluidised-bed
CHPCombined Heat and Power
CPCarob pulp
CPSChestnut processing sludges (IWWTP sludges from chestnut processing)
CSChestnut shells
CSTRContinuous stirred tank reactor
CWCheese whey
DFDark fermentation
DRResidue from yogurt production
DSDairy sludge (IWWTP sludge from yogurt production)
EU European Union
FAMEFatty acid methyl esters
FPWWastes from fruit processing
FPSFruit processing sludges (IWWTP sludge from fruit processing)
FWFood waste
GBWGreen and brown wastes
GC Gas chromatography
GC/MSGas chromatography/mass spectrometry
GHVGross Heating Value
GMGrape marc
HHVHigh Heating Value
HTLHydrothermal Liquefaction
IWWTPIndustrial wastewater treatment plant
L/SLiquid/solid
MBTMechanical and biological treatment
MSWMunicipal solid waste
MTMechanical treatment
OLOlive tree leaves
OOFOlive oil residual organic fraction with high fat content
OPOlive pomace
OSOlive stone
PLPoultry litter
PPSPulp and paper primary sludge
RMMoisture ratio
SCWSecond cheese whey
SSSewage sludges
STPStandard temperature and pressure
TMBMechanical sorting and composting
TPTomato pomace
TSTomate sludges (IWWTP sludge from tomato processing)
TVS Total volatile solids
WLWine lees
WWTPWastewater treatment plant

References

  1. Malinauskaite, J.; Jouhara, H.; Czajczyńska, D.; Stanchev, P.; Katsou, E.; Rostkowski, P.; Thorne, R.J.; Colón, J.; Ponsá, S.; Al-Mansour, F.; et al. Spencer Municipal solid waste management and waste-to-energy in the context of a circular economy and energy recycling in Europe. Energy 2017, 141, 2013–2044. [Google Scholar] [CrossRef]
  2. Net Zero by 2050—A Roadmap for the Global Energy Sector (2021) International Energy Agency Revised Version (4th Revision). Available online: https://www.iea.org/reports/net-zero-by-2050 (accessed on 9 February 2023).
  3. Levaggi, L.; Levaggi, R.; Marchiori, C.; Trecroci, C. Waste-to-Energy in the EU: The Effects of Plant Ownership, Waste Mobility, and Decentralization on Environmental Outcomes and Welfare. Sustainability 2020, 12, 5743. [Google Scholar] [CrossRef]
  4. Brahma, S.; Nath, B.; Basumatary, B.; Das, B.; Saikia, P.; Patir, K.; Basumatary, S. Biodiesel production from mixed oils: A sustainable approach towards industrial biofuel production. Chem. Eng. J. Adv. 2022, 10, 100284. [Google Scholar] [CrossRef]
  5. Zulqarnain, A.M.; Yusoff, M.H.M.; Nazir, M.H.; Zahid, I.; Ameen, M.; Sher, F.; Floresyona, D.; Budi Nursanto, E.A. Comprehensive Review on Oil Extraction and Biodiesel Production Technologies. Sustainability 2021, 13, 788. [Google Scholar] [CrossRef]
  6. Mahmudul, H.M.; Hagos, F.Y.; Mamat, R.; Abdul Adam, A.; Ishak, W.F.W.; Alenezi, R. Production, characterization and performance of biodiesel as an alternative fuel in diesel engines—A review. Renew. Sustain. Energy Rev. 2017, 72, 497–509. [Google Scholar] [CrossRef]
  7. Muktham, R.; Bhargava, S.B.; Bankupalli, S.; Ball, A.S. A Review on 1st and 2nd Generation Bioethanol Production-Recent Progress. J. Sustain. Bioenergy Syst. 2016, 6, 72–92. [Google Scholar] [CrossRef]
  8. Ghimire, A.; Frunzo, L.; Pirozzi, F.; Trably, E.; Escudie, R.; Lens, P.; Esposito, G. A review on dark fermentative biohydrogen production from organic biomass: Process parameters and use of by-products. Appl. Energy 2015, 144, 73–95. [Google Scholar] [CrossRef]
  9. Singh, A.; Sevda, S.; Reesh, I.M.; Vanbroekhoven, K.; Rathore, D.; Pant, D. Biohydrogen Production from Lignocellulosic Biomass: Technology and Sustainability. Energies 2015, 8, 13062–13080. [Google Scholar] [CrossRef]
  10. Azhar, S.H.; Abdulla, R.; Jambo, S.A.; Marbawi, H.; Gansau, J.A.; Faik, A.A.; Rodrigues, K.F. Yeasts in sustainable bioethanol production: A review. Biochem. Biophys. Rep. 2017, 10, 52–61. [Google Scholar] [CrossRef]
  11. EU Taxonomy: Accelerating Sustainable Investments (Regulation (EU) 2020/852). Available online: https://finance.ec.europa.eu/system/files/2022-02/sustainable-finance-taxonomy-complementary-climate-delegated-act-factsheet_en.pdf (accessed on 9 February 2023).
  12. Pan, S.; Du, M.A.; Te Huang, I.; Liu, I.; Chang, E.; Chiang, P. Strategies on implementation of waste-to-energy (WTE) supply chain for circular economy system: A review. J. Clean. Prod. 2015, 108, 409–421. [Google Scholar] [CrossRef]
  13. Biogas Barometer 2017. Available online: https://www.eurobserv-er.org/biogas-barometer-2017/#:~:text=Biogas%20barometer%202017%20-%20EurObserv%27ER%20Biogas%20barometer%202017,more%20than%2016%20million%20tonnes%20of%20oil%20equivalent (accessed on 6 April 2023).
  14. Technology Roadmap: Biofuels for Transport. Available online: https://iea.blob.core.windows.net/assets/0905b11e-53d4-417a-a061-453934009476/Biofuels_Roadmap_WEB.pdf (accessed on 6 April 2023).
  15. Mao, C.; Feng, Y.; Wang, X.; Ren, G. Review on research achievements of biogas from anaerobic digestion. Renew. Sustain. Energy Rev. 2015, 45, 540–555. [Google Scholar] [CrossRef]
  16. Jain, S.; Wolf, I.T.; Lee, J.; Tong, Y.W. A comprehensive review on operating parameters and different pretreatment methodologies for anaerobic digestion of municipal solid waste. Renew. Sustain. Energy Rev. 2015, 52, 142–154. [Google Scholar] [CrossRef]
  17. Li, Y.; Jin, Y.; Borrion, A.; Li, J. Influence of feed/inoculum ratios and waste cooking oil content on the mesophilic anaerobic digestion of food waste. Waste Manag. 2018, 73, 156–164. [Google Scholar] [CrossRef]
  18. Gerardi, M.H. PART III Operational Conditions: 17 Toxicity. In The Microbiology of Anaerobic Digesters, 1st ed.; Wastewater Microbiology Series; John Wiley & Sons, Inc.: Hoboken, NJ, USA, 2003; pp. 105–117. [Google Scholar] [CrossRef]
  19. Taricska, J.R.; Long, D.A.; Chen, J.P.; Hung, Y.-T.; Zou, S.-W. Chapter 5: Anaerobic Digestion. In Handbook of Environmental Engineering, 1st ed.; Wang, L.K., Shammas, N.K., Hung, Y.-T., Eds.; The Humana Press Inc.: Totowa, NJ, USA, 2007; Volume 6: Biosolids Treatment Processes, pp. 135–176. [Google Scholar]
  20. Yuntenwi, E.A.T.; MacCarty, N.; Still, D.; Ertel, J. Laboratory study of the effects of moisture content on heat transfer and combustion efficiency of three biomass cook stoves. Energy Sustain. Dev. 2008, 12, 66–77. [Google Scholar] [CrossRef]
  21. Moura, P.; Henriques, J.; Alexandre, J.; Oliveira, A.C.; Abreu, M.; Gírio, F.; Catarino, J. Sustainable value methodology to compare the performance of conversion technologies for the production of electricity and heat, energy vectors and biofuels from waste biomass. Clean. Waste Syst. 2022, 3, 100029. [Google Scholar] [CrossRef]
  22. Motta, I.L.; Miranda, N.T.; Filho, R.M.; Maciel, M.R.W. Biomass gasification in fluidized beds: A review of biomass moisture content and operating pressure effects. Renew. Sustain. Energy Rev. 2018, 94, 998–1023. [Google Scholar] [CrossRef]
  23. Pinto, F.; Costa, P.; Miranda, M. Thermochemical treatment (Part II: Chapter 5). In Algal Biofuels; Pereira, L., Ed.; CRC Press/Taylor & Francis Group: Boca Raton, FL, USA, 2017; ISBN 978-1-4987-5231-2. [Google Scholar]
  24. Eremeeva, A.M.; Kondrasheva, N.K.; Khasanov, A.F.; Oleynik, I.L. Environmentally Friendly Diesel Fuel Obtained from Vegetable Raw Materials and Hydrocarbon Crude. Energies 2023, 16, 2121. [Google Scholar] [CrossRef]
  25. Dimitriadis, A.; Bezergianni, S. Hydrothermal liquefaction of various biomass and waste feedstocks for biocrude production: A state of the art review. Renew. Sustain. Energy Rev. 2017, 68, 113–125. [Google Scholar] [CrossRef]
  26. Fan, Q.; Fu, P.; Song, C.; Fan, Y. Valorization of waste biomass through hydrothermal liquefaction: A review with focus on linking hydrothermal factors to products characteristics. Ind. Crops Prod. 2023, 191, 116017. [Google Scholar] [CrossRef]
  27. Mathimani, T.; Mallick, N. A review on the hydrothermal processing of microalgal biomass to bio-oil—Knowledge gaps and recent advances. J. Clean. Prod. 2019, 217, 69–84. [Google Scholar] [CrossRef]
  28. Zhang, Z.; Zhu, Z.; Shen, B.; Liu, L. Insights into biochar and hydrochar production and applications: A review. Energy 2019, 171, 581–598. [Google Scholar] [CrossRef]
  29. ISO 17828; Solid Biofuels—Determination of Bulk Density. International Organization for Standardization: Geneva, Switzerland, 2015.
  30. Trancoso, M.A.; Nogueira, C.A.; Calisto, S.C. Validation and setting up quality control for characterization of aluminum alloys in non-ferrous fraction of auto-shredders. SN Appl. Sci. 2020, 2, 1762–1773. [Google Scholar] [CrossRef]
  31. ISO 18134-1; Solid Biofuels—Determination of Moisture Content—Oven Dry Method—Part 1: Total Moisture—Reference Method. International Organization for Standardization: Geneva, Switzerland, 2015.
  32. ISO 14780; Solid Biofuels—Sample Preparation. International Organization for Standardization: Geneva, Switzerland, 2017.
  33. ISO 17827-1; Solid Biofuels—Determination of Particle Size Distribution for Uncompressed Fuels—Part 1: Oscillating Screen Method Using Sieves with Apertures of 3.15 mm and above. International Organization for Standardization: Geneva, Switzerland, 2016.
  34. ISO 17827-2; Solid Biofuels—Determination of Particle Size Distribution for Uncompressed Fuels—Part 2: Vibrating Screen Method Using Sieves with Aperture of 3.15 mm and below. International Organization for Standardization: Geneva, Switzerland, 2016.
  35. ISO 18134-3; Solid Biofuels—Determination of Moisture Content—Oven Dry Method—Part 3: Moisture in General Analysis Sample. International Organization for Standardization: Geneva, Switzerland, 2015.
  36. ISO 16993; Solid Biofuels—Conversion of Analytical Results from One Basis to Another. International Organization for Standardization: Geneva, Switzerland, 2016.
  37. ISO 18122; Solid Biofuels—Determination of Ash Content. International Organization for Standardization: Geneva, Switzerland, 2015.
  38. ISO 1171; Solid Mineral Fuels—Determination of Ash. International Organization for Standardization: Geneva, Switzerland, 2010.
  39. APHA. 2540 B; Total Solids Dried at 103–105 °C. In Standard Methods for the Examination of Water and Wastewater, 23rd ed.; American Public Health Association: Washington DC, USA, 2017; pp. 2–3. [Google Scholar]
  40. APHA—AWWA-WPCF. 2540 E; Fixed and Volatile Solids Ignited at 550 °C. In Standard Methods for the Examination of Water and Wastewater, 23rd ed.; American Public Health Association: Washington DC, USA, 2017; p. 6. [Google Scholar]
  41. ISO 16948; Solid Biofuels—Determination of Total Content of Carbon. Hydrogen and Nitrogen. International Organization for Standardization: Geneva, Switzerland, 2015.
  42. ISO 16994; Determination of Total Content of Sulphur and Chlorine. International Organization for Standardization: Geneva, Switzerland, 2016.
  43. WEPAL. International Biomass Exchange Program. BIMEP; Quarterly Report 2018.3; Wageningen University Environmental Sciences: Wageningen, The Netherlands, 2018. [Google Scholar]
  44. ISO 13528; Statistical Methods for Use in Proficiency Testing by Interlaboratory Comparisons. Organization for Standardization: Geneva, Switzerland, 2015.
  45. EN 13342; Characterization of Sludges—Determination of Kjeldahl Nitrogen. European Committee for Standardization: Brussels, Belgium, 2000.
  46. ISO 659; Oilseeds—Determination of Oil Content (Reference Method). International Organization for Standardization: Geneva, Switzerland, 2009.
  47. Hoebler, C.; Barry, J.L.; David, A.; Delort-Laval, J. Rapid acid hydrolysis of plant cell wall polysaccharides and simplified quantitative determination of their neutral monosaccharides by gas-liquid chromatography. J. Agric. Food Chem. 1989, 37, 360–367. [Google Scholar] [CrossRef]
  48. Dubois, M.; Gilles, K.A.; Hamilton, J.K.; Rebers, P.A.; Smith, F. Colorimetric method for determination of sugars and related substances. Anal. Chem. 1956, 28, 350–356. [Google Scholar] [CrossRef]
  49. ISO 18125; Solid Biofuels—Determination of Calorific Value. International Organization for Standardization: Geneva, Switzerland, 2017.
  50. Trancoso, M.A.; Sousa, A.R.; Mouro, F.; Freitas, M.C.; Almeida, S.; Canha, N. Indoor air quality: Validation and setting up quality control for determination of anions and cations in particulate matter. Accredit. Qual. Assur. 2012, 7, 199–206. [Google Scholar] [CrossRef]
  51. EN 14104; Fat and Oil Derivates—Fatty Acid Methyl Ester (FAME)—Determination of Acid Value. European Committee for Standardization (CEN): Brussels, Belgium, 2021.
  52. Eusébio, A.; Neves, A.; Marques, I.P. Complementary substrates—Brewery wastewater and piggery effluent—Assessment and microbial community profiling in a hybrid anaerobic reactor. Appl. Sci. 2021, 11, 4364. [Google Scholar] [CrossRef]
  53. Batista, A.P.; Moura, P.; Paula, A.S.; Marques, S.; Ortigueira, J.; Alves, L.; Gouveia, L. Scenedesmus obliquus as feedstock for biohydrogen production by Enterobacter aerogenes and Clostridium butyricum. Fuel 2014, 117, 537–543. [Google Scholar] [CrossRef]
  54. Ortigueira, J.; Silva, C.; Moura, P. Assessment of the adequacy of different Mediterranean waste biomass types for fermentative hydrogen production and the particular advantage of carob (Ceratonia silique L.) pulp. Int. J. Hydrog. Energy 2018, 43, 7773–7783. [Google Scholar] [CrossRef]
  55. Ortigueira, J.; Pacheco, M.; Trancoso, M.A.; Farrancha, P.; Correia, J.; Silva, C.; Moura, P. Food waste biorefinery: Stability of an acidogenic fermentation system with carbon dioxide sequestration and electricity generation. J. Clean. Prod. 2020, 270, 122040. [Google Scholar] [CrossRef]
  56. Abelha, P.; Franco, C.; Pinto, F.; Lopes, H.; Gulyurtlu, I.; Gominho, J.; Lourenco, A.; Pereira, H. Thermal Conversion of Cynara cardunculus L. and Mixtures with Eucalyptus Globulus by Fluidized Bed Combustion and Gasification. Energy Fuels 2013, 27, 6725–6737. [Google Scholar] [CrossRef]
  57. Pinto, F.; André, R.; Miranda, M.; Neves, D.; Varela, F.; Santos, J. Effect of gasification agent on co-gasification of rice production wastes mixtures. Fuel 2016, 180, 407–416. [Google Scholar] [CrossRef]
  58. Costa, P.; Mata, R.; Pinto, F.; Paradela, F.; Dutra, F. Hydrothermal Liquefaction of Microalgae for the Production of Biocrude and Value-added Chemicals. Chem. Eng. Trans. 2022, 94, 865–870. [Google Scholar] [CrossRef]
  59. Fleyfel, L.M.; Vel Leitner, N.K.; Deborde, M.; Matta, J.; El Najjar, N.H. Olive oil liquid wastes–Characteristics and treatments: A literature review. Process Saf. Environ. Prot. 2022, 168, 1031–1048. [Google Scholar] [CrossRef]
  60. Eryasar, K.; Karasu-Yalcin, S. Evaluation of some lignocellulosic byproducts of food industry for microbial xylitol production by Candida tropicalis. 3 Biotech 2016, 6, 202. [Google Scholar] [CrossRef]
  61. Wani, I.A.; Hamid, H.; Hamdani, A.M.; Gani, A.; Ashwar, B.A. Physico-chemical, rheological and antioxidant properties of sweet chestnut (Castanea sativa Mill.) as affected by pan and microwave roasting. J. Adv. Res. 2017, 8, 399–405. [Google Scholar] [CrossRef]
  62. Roati, C.; Fiore, S.; Ruffino, B.; Marchese, F.; Novarino, D.; Zanetti, M.C. Preliminary evaluation of the potential biogas production of food-processing industrial wastes. Am. J. Environ. Sci. 2012, 8, 291–296. [Google Scholar] [CrossRef]
  63. Elalami, D.; Carrère, H.; Abdelouahdi, K.; Oukarroum, A.; Dhiba, D.; Arji, M.; Barakat, A. Combination of dry milling and separation processes with anaerobic digestion of olive mill solid waste: Methane production and energy efficiency. Molecules 2018, 23, 3295. [Google Scholar] [CrossRef] [PubMed]
  64. Bouallagui, H.; Touhami, Y.; Ben Cheikh, R.; Hamdi, M. Bioreactor performance in anaerobic digestion of fruit and vegetable wastes. Process Biochem. 2005, 40, 989–995. [Google Scholar] [CrossRef]
  65. Ji, C.; Kong, C.X.; Mei, Z.L.; Li, J. A Review of the Anaerobic Digestion of Fruit and Vegetable Waste. Appl. Biochem. Biotechnol. 2017, 183, 906–922. [Google Scholar] [CrossRef] [PubMed]
  66. Goswami, R.; Chattopadhyay, P.; Shome, A.; Banerjee, S.N.; Chakraborty, A.K.; Mathew, A.K.; Chaudhury, S. An overview of physico-chemical mechanisms of biogas production by microbial communities: A step towards sustainable waste management. 3 Biotech 2016, 6, 72. [Google Scholar] [CrossRef]
  67. Yusuf, A.A.; Inambao, F.L. Bioethanol production techniques from lignocellulosic biomass as alternative fuel: A review. Int. J. Mech. Eng. Technol. 2019, 10, 34. Available online: https://ssrn.com/abstract=3451096 (accessed on 20 July 2023).
  68. Gonzalez-Rios, J.A.; Valle-Pérez, A.U.; Amaya-Delgado, L.; Sanchez, A. A quick fed-batch saccharification strategy of wheat straw at high solid loadings improving lignocellulosic ethanol productivity. Biomass Convers. Biorefinery 2023, 13, 4991–5003. [Google Scholar] [CrossRef]
  69. Gomes, D.; Gama, M.; Domingues, L. Determinants on an efficient cellulase recycling process for the production of bioethanol from recycled paper sludge under high solid loadings. Biotechnol. Biofuels 2018, 11, 111. [Google Scholar] [CrossRef] [PubMed]
  70. Bahry, H.; Abdallah, R.; Chezeaua, B.; Pons, A.; Taha, S.; Vial, C. Biohydrogen production from carob waste of the Lebanese industry by dark fermentation. Biofuels 2022, 13, 219–229. [Google Scholar] [CrossRef]
  71. Algapani, D.E.; Qiao, W.; Ricci, M.; Bianchi, D.; Wandera, S.M.; Adani, F.; Dong, R. Bio-hydrogen and bio-methane production from food waste in a two stage anaerobic digestion process with digestate recirculation. Renew. Energy 2019, 130, 1108–1115. [Google Scholar] [CrossRef]
  72. Moreno-Andrade, I.; Carrillo-Reyes, J.; Santiago, S.G.; Bujanos Adame, M.C. Biohydrogen from food waste in a discontinuous process: Effect of HRT and microbial community analysis. Int. J. Hydrog. Energy 2015, 40, 17246–17252. [Google Scholar] [CrossRef]
  73. Liu, Q.; Zhong, W.; Tang, R.; Yu, H.; Gu, J.; Zhou, G.; Yu, A. Experimental tests on co-firing coal and biomass waste fuels in a fluidised bed under oxy-fuel combustion. Fuel 2021, 286, 119312. [Google Scholar] [CrossRef]
  74. Liakakou, E.T.; Vreugdenhil, B.J.; Cerone, N.; Zimbardi, F.; Pinto, F.; André, R.; Marques, P.; Mata, R.; Gírio, F. Gasification of lignin-rich residues for the production of biofuels via syngas fermentation: Comparison of gasification technologies. Fuel 2019, 251, 580–592. [Google Scholar] [CrossRef]
  75. Baláš, M.; Milčák, P.; Elbl, P.; Lisý, M.; Lachman, J.; Kracík, P. Gasification of fermentation residue in a fluidised-bed gasifier. Energy 2022, 245, 123211. [Google Scholar] [CrossRef]
  76. Dermibas, A. Recovery of gasoline and diesel range hydrocarbons from waste vegetable oils petroleum. Sci. Technol. 2015, 33, 1703–1711. [Google Scholar] [CrossRef]
  77. Nascimento, L.; Ribeiro, A.; Ferreira, A.; Valério, N.; Pinheiro, V.; Araújo, J.; Vilarinho, C.; Carvalho, J. Turning Waste Cooking Oils into Biofuels—Valorization Technologies: A Review. Energies 2022, 15, 116. [Google Scholar] [CrossRef]
  78. European Environment Agency (EEA); The European Topic Centre on Waste and Materials in a Green Economy (ETC/WMGE). Early Warning Assessment Related to The 2025 Targets for Municipal Waste and Packaging Waste, Country Profile: Portugal. 2022. Available online: https://www.eea.europa.eu/data-and-maps/data-providers-and-partners/european-topic-centre-on-waste (accessed on 28 July 2023).
  79. EU Directive Waste: Directive (EU) 2018/851 of the European Parliament and of the Council of 30 May 2018 Amending Directive 2008/98/EC on Waste. Official Journal of the European Union, 14.6.2018, L 150/109. Available online: https://eur-lex.europa.eu/legal-content/EN/TXT/PDF/?uri=CELEX:32018L0851 (accessed on 28 July 2023).
  80. AgroNews11. Available online: https://www.millenniumbcp.pt/pt/apoio_as_empresas/solucoes-setorais/Documents/Millennium_AgroNews11.pdf (accessed on 28 July 2023).
  81. INE. Oil Production. Available online: https://www.ine.pt/xportal/xmain?xpid=INE&xpgid=ine_indicadores&indOcorrCod=0000709&contexto=bd&selTab=tab2 (accessed on 28 July 2023).
  82. Ribeiro, T.B.; Oliveira, A.L.; Costa, C.; Nunes, J.; Vicente, A.A.; Pintado, M. Total and Sustainable Valorisation of Olive Pomace Using a Fractionation Approach. Appl. Sci. 2020, 10, 6785. [Google Scholar] [CrossRef]
Figure 1. Admissibility Grid, including the specific analytical parameters and cut-off ranges for the acceptance to the eight technologies under study of the waste biomass samples of the matrices: (a) Solid Residues and Thick Sludges and (b) Liquid Sludges and Fats (ar, as received; db, dry basis).
Biomass 03 00021 g001aBiomass 03 00021 g001b
Figure 2. Admissibility evaluation of olive tree leaves waste samples as received to the eight technologies under study.
Biomass 03 00021 g002
Table 1. (Bio)chemical and thermochemical technologies, energy products, potential feedstocks, and their respective discriminating parameters for channelling towards the production of biogas, advanced biofuels, electricity and heat.
Conversion ProcessTechnologyMaturity Degree in PortugalProcessEnergy ProductPotential FeedstocksDiscriminating
Parameters
(Bio)chemical (Trans)esterification MatureConversion of glycerides and/or free fatty acids into esters, in the presence of an alcohol and a catalyst FAME
(biodiesel)
Used cooking oils, vegetable oils, animal fat, agro-industrial residues rich in oil Oil
Anaerobic digestion MatureHydrolysis, acidification and methanation of organic substrates under anaerobic conditions by several categories of microorganisms and enzymes, until the generation of biogas, consisting essentially of CH4 and CO2 Biogas, biomethane Effluents and organic residues, animal and sewage sludge, agricultural and agro-industrial residues, green wastes, municipal solid waste C/N ratio
N-K
TVS
Oil
Fermentation MatureBiological conversion of carbohydrate-rich biomass by the action of fermentative yeasts Bioethanol Lignocellulosic materials, agriculture and agro-industrial residues rich in fermentable sugars, food waste Hydrolysed sugars
Dark fermentation EmergingBiological conversion of carbohydrate-rich biomass by strict or facultative anaerobic microorganisms, with the production of H2, CO2 and organic acids Hydrogen Hydrolysed sugars
Thermochemical Combustion MatureThermochemical conversion of the chemical energy contained in biomass into other energy sources, such as thermal energy and mechanical energy Heat and power Dry wood shavings, residues from forestry crops, agriculture and agro-industrial residues, municipal solid waste Moisture
Ash, Cl, S
HHV
Gasification MatureThermochemical conversion of carbonaceous matter at high temperatures and with limited oxidizing agent, resulting in a combustible gas mainly formed by H2, CO2, CO, CH4 and other gaseous C2- and C4-hydrocarbons, which can be used as gaseous biofuel or as raw biomaterial Syngas Dry wood shavings, agricultural and agro-industrial residues, municipal solid waste Moisture
Ash, Cl, S
HHV
Bulk density
Particle size
Pyrolysis (solid) MatureThermochemical decomposition of biomass in an oxygen-free atmosphere, at medium or high temperaturesBio-oilsResidues from the wood industry and biomass processing, energy crops, residues from agricultural and agro-industrial activitiesMoisture
Ash, Cl, S
HHV
Particle size
Pyrolysis (liquid) EmergingResidues from agro-industrial activities
Moisture
Oil
Hydrothermal
liquefaction
EmergingThermochemical process used to convert raw materials with high moisture content into bio-oil and value-added chemicals, where the macromolecules making up the biomass are hydrolysed or degraded using water at average temperatures and high pressures Bio-oils Residues from the wood industry and biomass processing, residues from agricultural and agro-industrial activities, municipal solid waste, microalgae and macroalgae biomass without previous drying Moisture
Ash, Cl, S
Particle size
H/C ratio
FAME, fatty acid methyl esters; C, Carbon; Cl, chloride; H, Hydrogen; HHV, High heating value; N, Nitrogen; N-K, Kjeldahl Nitrogen; S, Sulphur; TVS, Total Volatile Solids; WWTPs, wastewater treatment plants.
Table 2. Set of samples used in this work, distributed by origin and matrix: (a) Solid Residues and Thick Sludges; (b) Liquid Sludges and Fats.
(a)SOLID RESIDUES AND THICK SLUDGES
Organic fractions of MSW and sludges from WWTPsMSW-Separated streamsFood wasteBiomass 03 00021 i001
FW1
Biomass 03 00021 i002
FW2
Green and brown wastesBiomass 03 00021 i003
GBW1
Biomass 03 00021 i004
GBW2
Biomass 03 00021 i005
GBW3
MSW-Mixed streamsOrganic fraction obtained after MBTBiomass 03 00021 i006
MBT1
Biomass 03 00021 i007
MBT2
Biomass 03 00021 i008
MBT3
Biomass 03 00021 i009
MBT4
Organic fraction obtained after MTBiomass 03 00021 i010
MT1
Biomass 03 00021 i011
MT2
Biomass 03 00021 i012
MT3
Biomass 03 00021 i013
MT4
Biomass 03 00021 i014
MT5
WWTP-SewageSewage sludges after stabilisation and dehydrationBiomass 03 00021 i015
SS1
Biomass 03 00021 i016
SS2
Organic fractions from industrial wastes, sludges, and by-productsOlive oil industryOlive pomaceBiomass 03 00021 i017
OP1
Biomass 03 00021 i018
OP2
Biomass 03 00021 i019
OP3
Olive tree leavesBiomass 03 00021 i021
OL2
Biomass 03 00021 i020
OL1
Olive stoneBiomass 03 00021 i022
OS
Chestnut industryChestnut shellsBiomass 03 00021 i023
CS1
Biomass 03 00021 i024
CS2
Locust bean gum industryCarob pulpBiomass 03 00021 i025
CP
Wine industryGrape marcBiomass 03 00021 i026GM
Tomato industryTomato pomaceBiomass 03 00021 i027
TP1
Biomass 03 00021 i028
TP2
IWWTP sludge from tomato processingBiomass 03 00021 i029
TS
Dairy industryResidue from yogurt productionBiomass 03 00021 i030
DR
IWWTP sludge from yogurt productionBiomass 03 00021 i031
DS
Fruit processingIWWTP sludge from fruit processing Biomass 03 00021 i032
FPS
PoultryPoultry litterBiomass 03 00021 i033
PL1
Biomass 03 00021 i034
PL2
Pulp and paper industryPrimary sludgeBiomass 03 00021 i035
PPS1
Biomass 03 00021 i036
PPS2
Biomass 03 00021 i037
PPS3
Biomass 03 00021 i038
PPS4
Biomass 03 00021 i039
PPS5
(b)LIQUID SLUDGES AND FATS
Organic fractions of MSW and sludges from WWTPsMSW-Separated streamsFood waste hydrolysate for organic valorisationBiomass 03 00021 i040
FW3
Organic fractions from industrial wastes, sludges, and by-productsOlive oil industryOlive oil residual organic fraction with high fat contentBiomass 03 00021 i041
OOF1
Biomass 03 00021 i042
OOF2
Chestnut industryIWWTP sludges from chestnut processingBiomass 03 00021 i043
CPS
Wine industryWine leesBiomass 03 00021 i044
WL1
Biomass 03 00021 i045
WL2
Dairy industryCheese whey and second cheese wheyBiomass 03 00021 i046
CW
Biomass 03 00021 i047
SCW
Fruit processingWastes from fruit processingBiomass 03 00021 i048
FPW
Table 3. Physicochemical composition (ranges) of the organic fractions of Municipal Solid Waste (MSW) and sewage sludges within the Solid Residues and Thick Sludges matrix.
ParameterMSW-Separated StreamsMSW–Mixed StreamsWWTP-Sewage
Food WasteGreen and Brown WastesOrganic Fraction Obtained after MBTOrganic Fraction Obtained after MTSewage Sludges after Stabilisation and Dehydration
Total Moisture
(% w/w), ar
70–8633–725.1–347.4–5680
Oil
(% w/w), ar
3.6–7.21.4–1.60.48–3.50.89–4.10.60–0.92
Kjeldahl Nitrogen
(% w/w), ar
0.18–1.10.73–0.810.59–1.70.52–1.40.43–1.7
Total Volatile Solids (% w/w), ar14–2623–4618–4421–4616
Carbon/Nitrogen ratio1620–3615–2417–325.5–5.7
Total Hydrolysed Sugars (as glucose)
(% w/w), db
31–4012–226.1–1813–3011–13
Ash at 815 °C
(% w/w), db
2.6–7.214–3037–7732–4817–19
Total Chloride
(% w/w), db
2.30.33–0.560.20–0.690.31–0.850.32–0.40
Total Sulphur
(% w/w), db
0.22–0.270.02–0.190.12–0.420.20–0.320.87–1.0
Higher Heating Value (MJ/kg), db22–2413–174.7–129.8–1519–20
Bulk Density
(kg/L), ar
0.89–1.00.09–0.200.40–0.870.30–0.510.62–0.66
Mean Particle Diameter, d50
(mm), ar
--5.2 –58 1.6 –6.9 10 –29 --
Hydrogen/Carbon ratio0.13–0.140.08–0.100.08–0.100.11–0.130.12–0.13
ar, as received basis; db, dry basis; --, not analysed because the characteristics of the sample were outside the scope of the analytical procedure; , values determined in pre-dried samples.
Table 4. Physicochemical composition (ranges) of the industrial wastes, industrial sludges and by-products within the Solid Residues and Thick Sludges matrix.
ParameterOlive Oil IndustryChestnut IndustryLocust Bean Gum IndustryWine IndustryTomato IndustryDairy IndustryFruit ProcessingPoultryPulp and Paper Industry
Olive PomaceOlive Tree LeavesOlive StoneChestnut ShellsCarob PulpGrape MarcTomato PomaceIWWTP Sludge from Tomato ProcessingResidue from Yogurt ProductionIWWTP Sludge from Yogurt ProductionIWWTP Sludge from Fruit ProcessingPoultry LitterPrimary Sludge
Total Moisture
(% w/w), ar
13–6222–442364–80158.460–945550849129–6452–69
Oil
(% w/w), ar
0.83–5.73.0–7.73.70.29–0.800.354.21.8–2.10.12407.00.290.52–1.50.10–0.15
Kjeldahl Nitrogen
(% w/w), ar
0.22–1.70.63–0.810.280.21–0.490.441.80.58–1.70.910.200.840.271.60.03–1.1
Total Volatile Solids,
(% w/w), ar
36–7752–697620–3583856.0–406.350168.129–6011–35
Carbon/Nitrogen ratio21–5446–489742–657926185.8-121012–176.9–1.3 × 10²
Total Hydrolysed Sugars (as glucose)
(% w/w), db
23–2820–231831–36292113–581.20.21 2.73642–453.0–74
Ash at 815 °C
(% w/w), db
4.0–9.36.7–101.21.5–2.52.45.60.20–2.5840.284.18.214–197.1–63
Total Chloride
(% w/w), db
<0.14–0.35<0.14<0.14<0.14<0.14<0.14<0.14 n.a.n.a.<40.10.180.37–0.50<0.14–0.16
Total Sulphur
(% w/w), db
0.10–0.110.11–0.120.040.07–0.09<0.03<0.030.13 n.a.n.a.0.320.140.29–0.39<0.03 –0.20
Higher Heating Value (MJ/kg), db20–2322–232220182125 n.a.n.a.322115–175.6–15
Bulk Density
(kg/L), ar
0.64–1.10.11–0.120.670.31–0.790.510.280.43–1.01.20.76 0.970.960.25–0.590.51–1.0
Mean Particle Diameter, d50
(mm), ar
--2.5 –7.7 1.52.4 –7.3 5.42.72.8 †,‡----------2.4 –4.7
Hydrogen/Carbon ratio0.10–0.130.120.110.09–0.100.090.110.13 0.18-0.150.120.120.08–0.12
ar, as received basis; db, dry basis; --, not analysed because the characteristics of the sample were outside the scope of the analytical procedure; n.a., not analysed because the samples were too greasy or too inorganic to fall within the scope of the procedures; , values determined in pre-dried samples; , analysed only in one sample; -ratios were not estimated because CHN analysis was not performed as the sample characteristics were outside the scope of the analytical procedure.
Table 5. Physicochemical composition (ranges) of the organic fractions of Municipal Solid Waste (MSW), and industrial wastes, sludges and by-products within the Liquid Sludges and Fats matrix.
ParameterMSW-Separated StreamOlive Oil IndustryChestnut IndustryWine IndustryDairy IndustryFruit Processing
Food Waste Hydrolysate for Organic ValorisationOlive oil Residual Organic Fraction with High Fat ContentIWWTP Sludges from Chestnut ProcessingWine LeesCheese Whey and Second Cheese WheyWaste from Fruit Processing
Total Moisture
(% w/w), ar
939.6–13999092–9382
Oil
(kg/L), ar
0.020.46–0.76<0.01<0.01<0.01<0.01
Kjeldahl Nitrogen (g/L), ar3.10.08 0.223.5–4.50.91–2.00.12
Total Volatile Solids
(kg/L), ar
0.050.81–0.860.010.07–0.080.06–0.070.19
Carbon/Nitrogen ratio11-1910–11-58
Total Hydrolysed Sugars (as glucose)
(% w/w), db
6.80.03–0.081817–1937–6450
Ash at 815 °C
(% w/w), db
240.11–0.297.016–287.1–151.5
Total Chloride
(% w/w), db
1.6n.a.0.35n.a. *n.a.n.a. *
Total Sulphur
(% w/w), db
0.81n.a.0.35n.a. *n.a.n.a. *
Higher Heating Value
(MJ/kg), db
22n.a.19n.a. *n.a.n.a. *
Bulk Density (kg/L), ar0.990.93–0.950.991.01.01.0
Hydrogen/Carbon ratio0.15-0.140.12–0.13-0.17
ar, as received basis; db, dry basis; n.a., not analysed because the samples were too greasy or too aqueous to fall within the scope of the procedures; -ratios were not estimated because CHN analysis was not performed as the sample characteristics were outside the scope of the analytical procedure; n.a. *, not analysed since these samples were not expected to be used in technologies T5, T6, or T7.
Table 6. Admissibility of the samples included in the Solid Residues and Thick Sludges, and Liquid Sludges and Fats matrices to the studied technologies.
Technologies T1T2T3T4T5T6T7T8
Sample Type(Trans)
Esterification
Anaerobic
Digestion
Alcoholic
Fermentation
Dark
Fermentation
CombustionGasificationPyrolysisHydrothermal
Liquefaction
SolidLiquid
Solid Residues and Thick SludgesMSW-Separated streamsFood waste
Green and brown wastesBiomass 03 00021 i051Biomass 03 00021 i051Biomass 03 00021 i051(a)Biomass 03 00021 i051(b)Biomass 03 00021 i051
MSW- Mixed streamsOrganic fraction obtained after MBT
Organic fraction obtained after MTBiomass 03 00021 i051Biomass 03 00021 i051
WWTP-SewageSewage sludges after stabilisation and dehydration
Olive oil industryOlive pomaceBiomass 03 00021 i051Biomass 03 00021 i051Biomass 03 00021 i051Biomass 03 00021 i051Biomass 03 00021 i051
Olive tree leaves(a)Biomass 03 00021 i051(a)(b)Biomass 03 00021 i051(a)
Olive stone(a)(a)
Chestnut industryChestnut shells Biomass 03 00021 i051
Locust bean gum industryCarob pulp(c)
Wine
industry
Grape marc(c)
Tomato industryTomato pomaceBiomass 03 00021 i051Biomass 03 00021 i051Biomass 03 00021 i051(a)Biomass 03 00021 i051(a)Biomass 03 00021 i051(b)Biomass 03 00021 i051
IWWTP sludge from tomato processing
Dairy
industry
Residue from yogurt productionBiomass 03 00021 i052(a)Biomass 03 00021 i052(a)(a)Biomass 03 00021 i052
IWWTP sludge from yogurt production
Fruit processingIWWTP sludge from fruit processing
PoultryPoultry litterBiomass 03 00021 i051Biomass 03 00021 i051(b)Biomass 03 00021 i051(b)
Pulp and paper industryPrimary sludgeBiomass 03 00021 i051Biomass 03 00021 i051Biomass 03 00021 i051Biomass 03 00021 i051
Liquid Sludges and FatsMSW-Separated streamsFood waste hydrolysate for organic valorisationTechnology not applicable to this sample group
Olive oil industryOlive oil residual organic fraction with high fat content Biomass 03 00021 i052
Chestnut industryIWWTP sludges from chestnut processing
Wine
industry
Wine lees
Dairy
industry
Cheese whey and second cheese wheyBiomass 03 00021 i052
Fruit processingWastes from fruit processing
Admissible; Biomass 03 00021 i051 Conditional admission: only some samples are admissible; Not Admissible; Biomass 03 00021 i052 Inconclusive admission. (a), Admissible after moisture adjustment; (b), Admissible after moisture adjustment and granulometry reduction; (c), Admissible after granulometry reduction.
Table 7. Product yields, process rates and product concentration obtained with the case-studies by technology and matrix: (aSolid Residues and Thick Sludges; (bLiquid Sludges and Fats matrix.
(a)SOLID RESIDUES AND THICK SLUDGES
TechnologyT1
(Trans)Esterification
T2
Anaerobic
Digestion
T3
Alcoholic Fermentation
T4
Dark Fermentation
T5
Combustion
T6
Gasification
T7
Liquid Pyrolysis
T8
Hydrothermal Liquefaction
ProductBiodieselBiogas and BiomethaneEthanolHydrogenElectricity and HeatSyngasBio-OilBio-Oil
Food wasteN.A.(+)(+)YP/S = 72 L H2/kgdb
QP = 0.26 L H2/L.h
CP = 93% (V/V) H2
N.A.N.A.N.A.N.A.
Green and brown wastesN.A.(+)(+/−)N.A.(+/−)(+/−)N.A.YP/S = 700 g bio-oil/kgdb
TProc = 30 min.
Crude bio-oil, requires refining
Olive pomaceN.A.YP/S = 4 L CH4/kg
QP = 0.01 L CH4/kg.h
CP = 69% (V/V) CH4
(+)(+/−)YP/S = 5–9 MJ/kgdb
TProc < 5 min.
YP/S = 1 m3 syngas/kgdb
TProc < 5 min.
CP (%, V/V) =
43.6 H2; 27.6 CO2;
15.5 CO;
13.3 CnHm
N.A.(+/−)
Olive tree leavesN.A.(+)(+)N.A.YP/S = 6–10 MJ/kgdb 
TProc < 5 min.
YP/S = 1 m3 syngas/kgdb
TProc < 5 min.
CP (%, V/V) =
30.6 H2; 20.7 CO2;
27.4 CO;
21.3 CnHm
N.A.(+/−)
Olive stoneN.A.N.A.N.A.N.A.YP/S = 6–10 MJ/kgdb 
TProc < 5 min.
YP/S = 1 m3 syngas/kgdb
TProc < 5 min.
CP (%, V/V) =
41.1 H2; 31.2 CO2;
14.2 CO;
13.5 CnHm
N.A.N.A.
Chestnut shellsN.A.YP/S = 11 L CH4/kg
QP = 0.06 L CH4/kg.h
CP = 46% (V/V) CH4
(+)YP/S = 12 L H2/kgdb
QP = 0.13 L H2/L.h
CP = 50% (V/V) H2
N.A.N.A.N.A.(+)
Carob pulpN.A.N.A.YP/S = 0.24 L EtOH/kgdb
QP = 1.8 g EtOH/L.h
CP = 63 g EtOH/L
YP/S = 84 L H2/kgdb
QP = 0.20 L H2/L.h
CP = 93% (V/V) H2
(+)(+)N.A.N.A.
Residue from yogurt production YP/S = YFAME/oil = 1.5% (w/w)
YP/S = YFAME/sample = 0.9% (w/w)
CP = 7.8% (w/w) esters
N.A.N.A.N.A.N.A.(−)YP/S = 810 g bio-oil/kgdb
TProc = 30 min.
CP = 71% (V/V) distilled fraction in crude bio-oil
(−)
IWWTP sludge from yogurt productionN.A.YP/S = 2 L CH4/kg
QP = 0.01 L CH4/kg.h
CP = 73% (V/V) CH4
N.A.N.A.N.A.N.A.N.A.N.A.
Primary sludge from pulp and paper industryN.A.(+/−)YP/S = 0.26 L EtOH/kgdb
QP = 1.4 g EtOH/L.h
CP = 50 g EtOH/L
(+/−)N.A.N.A.N.A.(+/−)
(b)LIQUID SLUDGES AND FATS
TechnologyT1
(Trans)Esterification
T2
Anaerobic
Digestion
T4
Dark Fermentation
T7
Liquid Pyrolysis
ProductBiodieselBiogas and BiomethaneHydrogenBio-Oil
Olive oil residual organic fraction with high fat content YP/S = YFAME/oil = 40.5% (w/w)
YP/S = YFAME/sample = 19.7% (w/w)
CP = 34.9% (w/w) esters
N.A.N.A.YP/S = 830 g bio-oil/kgdb
TProc = 30 min.
CP = 70% (V/V) distilled fraction in crude bio-oil
IWWTP sludge from chestnut processing N.A.YP/S = 2 L CH4/L
QP = 0.01 L CH4/L.h
CP = 70% (V/V) CH4
(+)N.A.
Second cheese wheyN.A.(−)YP/S = 0.33 L H2/L
QP = 0.06 mL H2/L.h
CP = 46% (V/V) H2
N.A.
Wastes from fruit processing N.A.YP/S = 2 L CH4/L
QP = 0.01 L CH4/L.h
CP = 62% (V/V) CH4
YP/S = 34 L H2/L
QP = 0.23 L H2/L.h
CP = 74% (V/V) H2
N.A.
db, dry basis; N.A., Not admissible; (+), Admissible but not tested; (+/−), Admissible after adjustment but not tested; (−), Inconclusive admission and not tested; YP/S, Product yield; QP, Production rate; TProc, Process time; CP, Product concentration; , Expected values; , The introduction of a previous solvent extraction step (such as hexane) followed by distillation of solvent and (trans)esterification of the oil enables the ester content of the final product to be increased.
Disclaimer/Publisher’s Note: The statements, opinions and data contained in all publications are solely those of the individual author(s) and contributor(s) and not of MDPI and/or the editor(s). MDPI and/or the editor(s) disclaim responsibility for any injury to people or property resulting from any ideas, methods, instructions or products referred to in the content.

