Article

Effect of Synthesis Process, Synthesis Temperature, and Reaction Time on Chemical, Morphological, and Quantum Properties of Carbon Dots Derived from Loblolly Pine

Department of Biomedical and Chemical Engineering and Sciences, Florida Institute of Technology, 150 West University Boulevard, Melbourne, FL 32901, USA
*
Author to whom correspondence should be addressed.
Biomass 2022, 2(4), 250-263; https://doi.org/10.3390/biomass2040017
Submission received: 16 August 2022 / Revised: 24 September 2022 / Accepted: 1 October 2022 / Published: 5 October 2022
(This article belongs to the Special Issue Hydrothermal Treatment in Biomass)

Abstract

:
In this study, carbon dots are synthesized hydrothermally from loblolly pine using top-down and bottom-up processes. The bottom-up process dialyzed carbon dots from hydrothermally treated process liquid. Meanwhile, hydrochar was oxidized into carbon dots in the top-down method. Carbon dots from top-down and bottom-up processes were compared for their yield, size, functionality, and quantum properties. Furthermore, hydrothermal treatment temperature and residence time were evaluated on the aforementioned properties of carbon dots. The results indicate that the top-down method yields higher carbon dots than bottom-up in any given hydrothermal treatment temperature and residence time. The size of the carbon dots decreases with the increase in reaction time; however, the size remains similar with the increase in hydrothermal treatment temperature. Regarding quantum yield, the carbon dots from the top-down method exhibit higher quantum yields than bottom-up carbon dots where the quantum yield reaches as high as 48%. The only exception of the bottom-up method is the carbon dots prepared at a high hydrothermal treatment temperature (i.e., 260 °C), where relatively higher quantum yield (up to 18.1%) was observed for the shorter reaction time. Overall, this study reveals that the properties of lignocellulosic biomass-derived carbon dots differ with the synthesis process as well as the processing parameters.

1. Introduction

In recent years, a quasi-zero dimensional carbon nanomaterial, often known as carbon dots (CD), has found its place in various applications ranging from bioimaging and sensors to catalysis for chemical synthesis, carbon capture, and bioenergy [1,2,3,4,5]. Depending on precursor and treatment method, CDs can show stable fluorescent properties; therefore, they are often referred to as carbon quantum dots [6]. Due to the nature of their morphology, CDs offer good solvent dispersion and stability, favorable biocompatibility, and green preparation methodologies [4,7,8]. Much of the earlier research synthesized CDs through top-down methods, but the literature then shifted towards bottom-up from model compounds including, but not limited to, sugar, sugar-derivatives, and organic acids [9]. These model compounds are dissolved into solvents and begin polymerization during various thermal treatments such as hydrothermal, microwave, and pyrolysis, to name a few [10]. On the other hand, the top-down method uses oxidation, acid etching, and the polymeric scission of larger molecules into CDs [11]. Usually, the CD sizes are relatively higher in the top-down method than bottom-up [12]. Arguably, the top-down method results in higher impurities and a wider range of particle sizes even within the range of CDs, and perhaps this drives the larger yield of CDs seen compared to the other method. Even for the bottom-up method, the literature has stressed the need for using pure polymers as feedstocks, which might be cheaper than the feedstocks for the top-down method yet leaves significant price tags on CD synthesis. A further understanding of top-down and bottom-up could reveal the significance of using cheaper feedstocks such as lignocellulosic biomass.
Looking into the common feedstocks for CD synthesis (both top-down and bottom-up) in the literature, a strong shift towards using sustainable biomass is evident [13]. Lignocellulosic biomass such as woody biomass, primary and secondary agricultural residues, tree pruning, and grass clippings are abundant resources for biofuels, biomaterials, and bioproducts [14]. The United States alone produces more than half a billion tons of biomass at prices lower than USD 100 per ton every year [15]. Therefore, the logical question arises as to whether CDs can be synthesized directly from lignocellulosic biomass. Indeed, the literature has reported several studies using sugarcane bagasse, rice straw, rice husk, and wastepaper using both the top-down and bottom-up method [5,13,16,17,18,19]. The loblolly pine market produces roughly 500 million green tons of logging residues in the south eastern United States, with wastage rates of up to 50% [20]. For these reasons, loblolly pine is a prime biomass target for waste utilization through value-added product formation. Hydrothermal treatment is the most common synthesis method along with microwave treatment when it comes to CD synthesis from lignocellulosic biomass [21]. The typical sizes of the CDs from lignocellulosic biomass were reported from 1.5 to 6.5 nm with lattice fringe spacing at 0.21 nm [22,23,24]. The photoluminescent properties of the lignocellulosic biomass-derived CDs are reported as quantum yield ranging from 1.64 to 47.4% [25,26,27]. Usually, heteroatoms such as nitrogen are doped during CD synthesis to increase the quantum yield of the CD [28,29,30]. Lignocellulosic biomass-derived CDs have been utilized as optical sensors for sensing heavy metals and transition metals, as in vivo imagining to detect tumor and cancer cells, as photocatalysis to degrade harmful chemicals from water, and as electrode modification materials for electrochemical cells [13,15,16]. Certainly, lignocellulosic biomass-derived CDs have been generating significant interest as more applications such as electrode materials have been identified and tested in recent years.
As mentioned above, hydrothermal treatment is a common pathway for CD synthesis from lignocellulosic biomass [31]. For the bottom-up approach, biomass is treated with subcritical water for a prolonged time [32]. When biopolymers such as hemicelluloses or cellulose first hydrolyze into monomers such as five carbon and six carbon sugars (e.g., glucose, xylose, and fructose; sugar derivatives such as furfural, 5-hydroxymethyl furfural, and anhydro glucose; and organic acids including acetic, formic, and lactic acids), these monomers then polymerize into CDs in the later steps with a longer reaction time [5,22]. Biopolymers have their own hydrothermal reaction kinetics and these reaction kinetics often affect each other [33], for instance, hemicelluloses and cellulose hydrolyze as low as 180 °C [34,35]. Lignin depolymerizes above 260 °C at hydrothermal conditions but the monomers do not cleave until 275–280 °C [36,37]. As a result, the properties of CDs from lignocellulosic biomass vary with treatment temperature. Additional solvent or oxidants might be needed to catalyze the depolymerization of biopolymers into monomers to facilitate CD synthesis at a lower temperature, and this is especially practiced with biomass feedstock [38]. Reaction time is also important, as adequate time is required for hydrolysis followed by repolymerization [39,40]. As the reaction kinetics are slower for a lower temperature (e.g., 180 °C), most of the literature often reports a longer reaction time, as high as 48 h. However, too long of a reaction time could increase the size of the dots beyond the size limit of CDs, as they have more time to condense.
Top-down CD synthesis from lignocellulosic biomass via hydrothermal treatment involves the oxidization or secession of hydrochar, the solid product resulting from hydrothermal treatment. Hydrochar is comprised of carbon dense micro-meter sized spheres with a hydrophobic core and oxygen functional groups on the surface [41,42]. The oxidation of hydrochar is more favorable than the oxidation of whole biomass, as the latter will likely create porous activated carbon instead of nano-sized CDs. Common oxidizing agents are peroxides, sodium hydroxide, sulfuric acid, and nitric acid [38]. Several articles have reported the top-down method by mechanical milling or sonication [42,43]. Oxidizing agents and oxidation processes can be optimized when the morphological and chemical properties of hydrochar are properly understood. Unfortunately, hydrochar properties vary significantly with the hydrothermal treatment temperature, time, and biomass type [44,45].
Summarizing the literature, it is evident that CD can be synthesized from lignocellulosic biomass. Even the same biomass and hydrothermal treatment can be used to synthesize CDs in both the bottom-up or top-down method. However, the literature is unclear on how these CDs are different in terms of size, morphology, and quantum yield in loblolly pine-based CD’s with respect to time, temperature, and method together in one study. To the best of the authors’ knowledge, no literature is reported on how hydrothermal conditions affect the bottom-up and top-down CD properties comparatively for loblolly pine-derived CDs. This study attempts to resolve the literature gap. Loblolly pine was used as a lignocellulosic feedstock, which was hydrothermally treated at various temperatures and times to synthesize CD from bottom-up. Corresponding hydrochars were further oxidized into CD using the top-down method. The physical, morphological, and optical properties of CDs were compared for both synthesized methods to understand the effect of hydrothermal treatment conditions on CDs.

2. Materials and Methods

2.1. Materials

Loblolly pine was used as the organic precursor for the CDs. This material was provided by Idaho National Laboratory. Two hundred proof (100%) ethanol (Cas 64-17-5) was purchased from Decon Labs, Inc. (King of Prussia, PA, USA). Sodium hydroxide (0.2 M) (Cas 1310-73-2) and the 30% hydrogen peroxide (Cas no. 7722-84-1) were purchased from Honeywell (Charlotte, NC, USA). Hydrogen chloride (2 N) (Cas 7647-01-0) was obtained from Fisher Chemicals (Hampton, NH, USA). Sulfuric acid (0.1 N) (Cas 7664-93-9) was purchased from Sigma Aldrich (St. Louis, MO, USA). Quinine sulfate dihydrate (99%) (Cas 6119-70-4) was purchased from Acros Organics (Morris Plains, NJ, USA).

2.2. CD Synthesis

2.2.1. Bottom-Up Method

For synthesis of the CDs using the bottom-up method, a Parr batch reactor was used to perform the hydrothermal treatment. A 300 mL Parr reactor (Moline, IL, USA) with Parr 4841 PID controller was used. The procedure was performed at three separate hydrothermal temperatures, namely 180, 220, and 260 °C for six different time intervals: 0.5 h to 3 h in an increment of 0.5 h. At each trial, the water-to-pine ratio remained at a constant of 10:1, but the amounts were varied to accommodate for thermal expansion at varying hydrothermal temperatures. The heating rate of the reactor was 10 °C min−1 until the set point was achieved. At this point, the timer began for the specified time interval. Afterwards, the reactor was cooled to room temperature using an ice-water bath and underwent vacuum filtration with Whatman 0.45-micron filter paper to collect the bulk solid hydrochar. The process liquid was dialyzed with 500 Da dialysis tubing in deionized water for 36 h. The process liquid was freeze-dried and the mass yield for the bottom-up method (MYBU) was calculated by Equation (1).
MY BU = [ ( Mass in Mass out ) / Mass in ] × 100 %
where MYBU is the mass yield from bottom-up, Massin is the dry feedstock in and Massout is the dry CD recovered from the bottom-up method.

2.2.2. Top-Down Methodology

The as-is hydrochar was measured for mass yields after drying in an oven for 24 h at 100 °C. To synthesize the CDs using the top-down method, hydrochar was oxidized. Around 0.5 g of dried hydrochar was placed in an Erlenmeyer flask with 37.5 mL of deionized water, 12.5 mL of NaOH solution, and 4 mL of H2O2 solution. The resulting mixture was stirred for 12 h at room temperature. After stirring, the solution was neutralized to a pH range of 7.0 using HCl. The solution underwent vacuum filtration with a Whatman 0.45-micron filter paper. The liquid was dialyzed using 500 Da dialysis tubing and deionized water for 36 h. The resulting liquid was freeze-dried with a Labconco FreeZone 2.5 L freeze dryer (Kansas City, MO, USA) for mass yield determination from the top-down method (MYTD) using Equation (2).
MY TD = [ ( Mass in Mass out ) / Mass in ] × 100 %
where MYTD is the mass yield from top-down, Massin is the dry feedstock in and Massout is the dry CD recovered from the top-down method.

2.3. Characterization of CDs

To determine the size distributions of the CDs, a Zeiss EM 900N Transmission Electron Microscope (TEM, Oberkochen, Germany) was used. First, the CDs were dispersed in pure ethanol. The solution was sonicated with a Qsonica Q125A Sonicator for 15 min at room temperature at 10 and 5 s intervals of on and off time, respectively, and 60% amplitude. Next, the solution was dropped onto Quantifoil R2/1 micromachined holey carbon 200 mesh copper grids. The solution was allowed to dry and repeated for a total of 3 times before being inserted into the TEM. The ruler software built in with TEM was used to perform the size distribution calculations. Images were taken at 250,000x resolution.
The functional groups in the CD samples were identified using Thermo Scientific Attenuated Total Reflector (ATR) (Model: Nicolet iS5, Madison, WI, USA) for the top-down samples and a Fourier transform infrared spectrophotometer (FTIR, Model: Nicolet 6700, Madison, WI, USA) for the bottom-up CDs, which were dispersed in ethanol. For the FTIR analysis, the ethanol was considered as background. The operating conditions for both ATR and FTIR were set as follows: resolution (4), data accumulation: 64, and wavenumber range (500–4000 cm−1).
The prepared CDs samples were run in the HACH DR6000 UV-VIS. The absorption peaks were found to be at 265 nm. The CDs were diluted at this wavelength in five increments per sample of absorbance ranging from 0.02 to 0.1. These five sub-samples of each trial condition were analyzed for their emission intensity in a Horiba FluoroMax-3 fluorometer. A plot of intensity vs. absorbance was created for each sub-sample and quinine sulfate (same dilution procedure). The accuracy of the procedure was verified by an R2 value greater than 0.99 for each trendline. The ratio of the slopes was used to calculate the quantum yield.
To determine the quantum yield (QY) of the CDs, a 1.25 × 10⁻² M solution of the quinine sulfate was treated with 0.1 N of sulfuric acid.. As shown in Equation (3), QY is the ratio of light energy absorbed versus fluoresced for a given molecule. The inverse of this ratio represents the amount of absorbed energy that is transformed to kinetic energy. The determination of QY is important for application-based research when studying CD, as this indicates whether a CD is better suited for fluorescent or photocatalytic purposes.
Q Y = Q Y R ( I I R ) ( A R A )
where Q Y R is the reference quantum yield of quinine sulfate, I is the intensity measurement for CD, I R is the intensity for quinine sulfate, A is the absorbance of the CD, and A R is the absorbance for the reference.

3. Results and Discussion

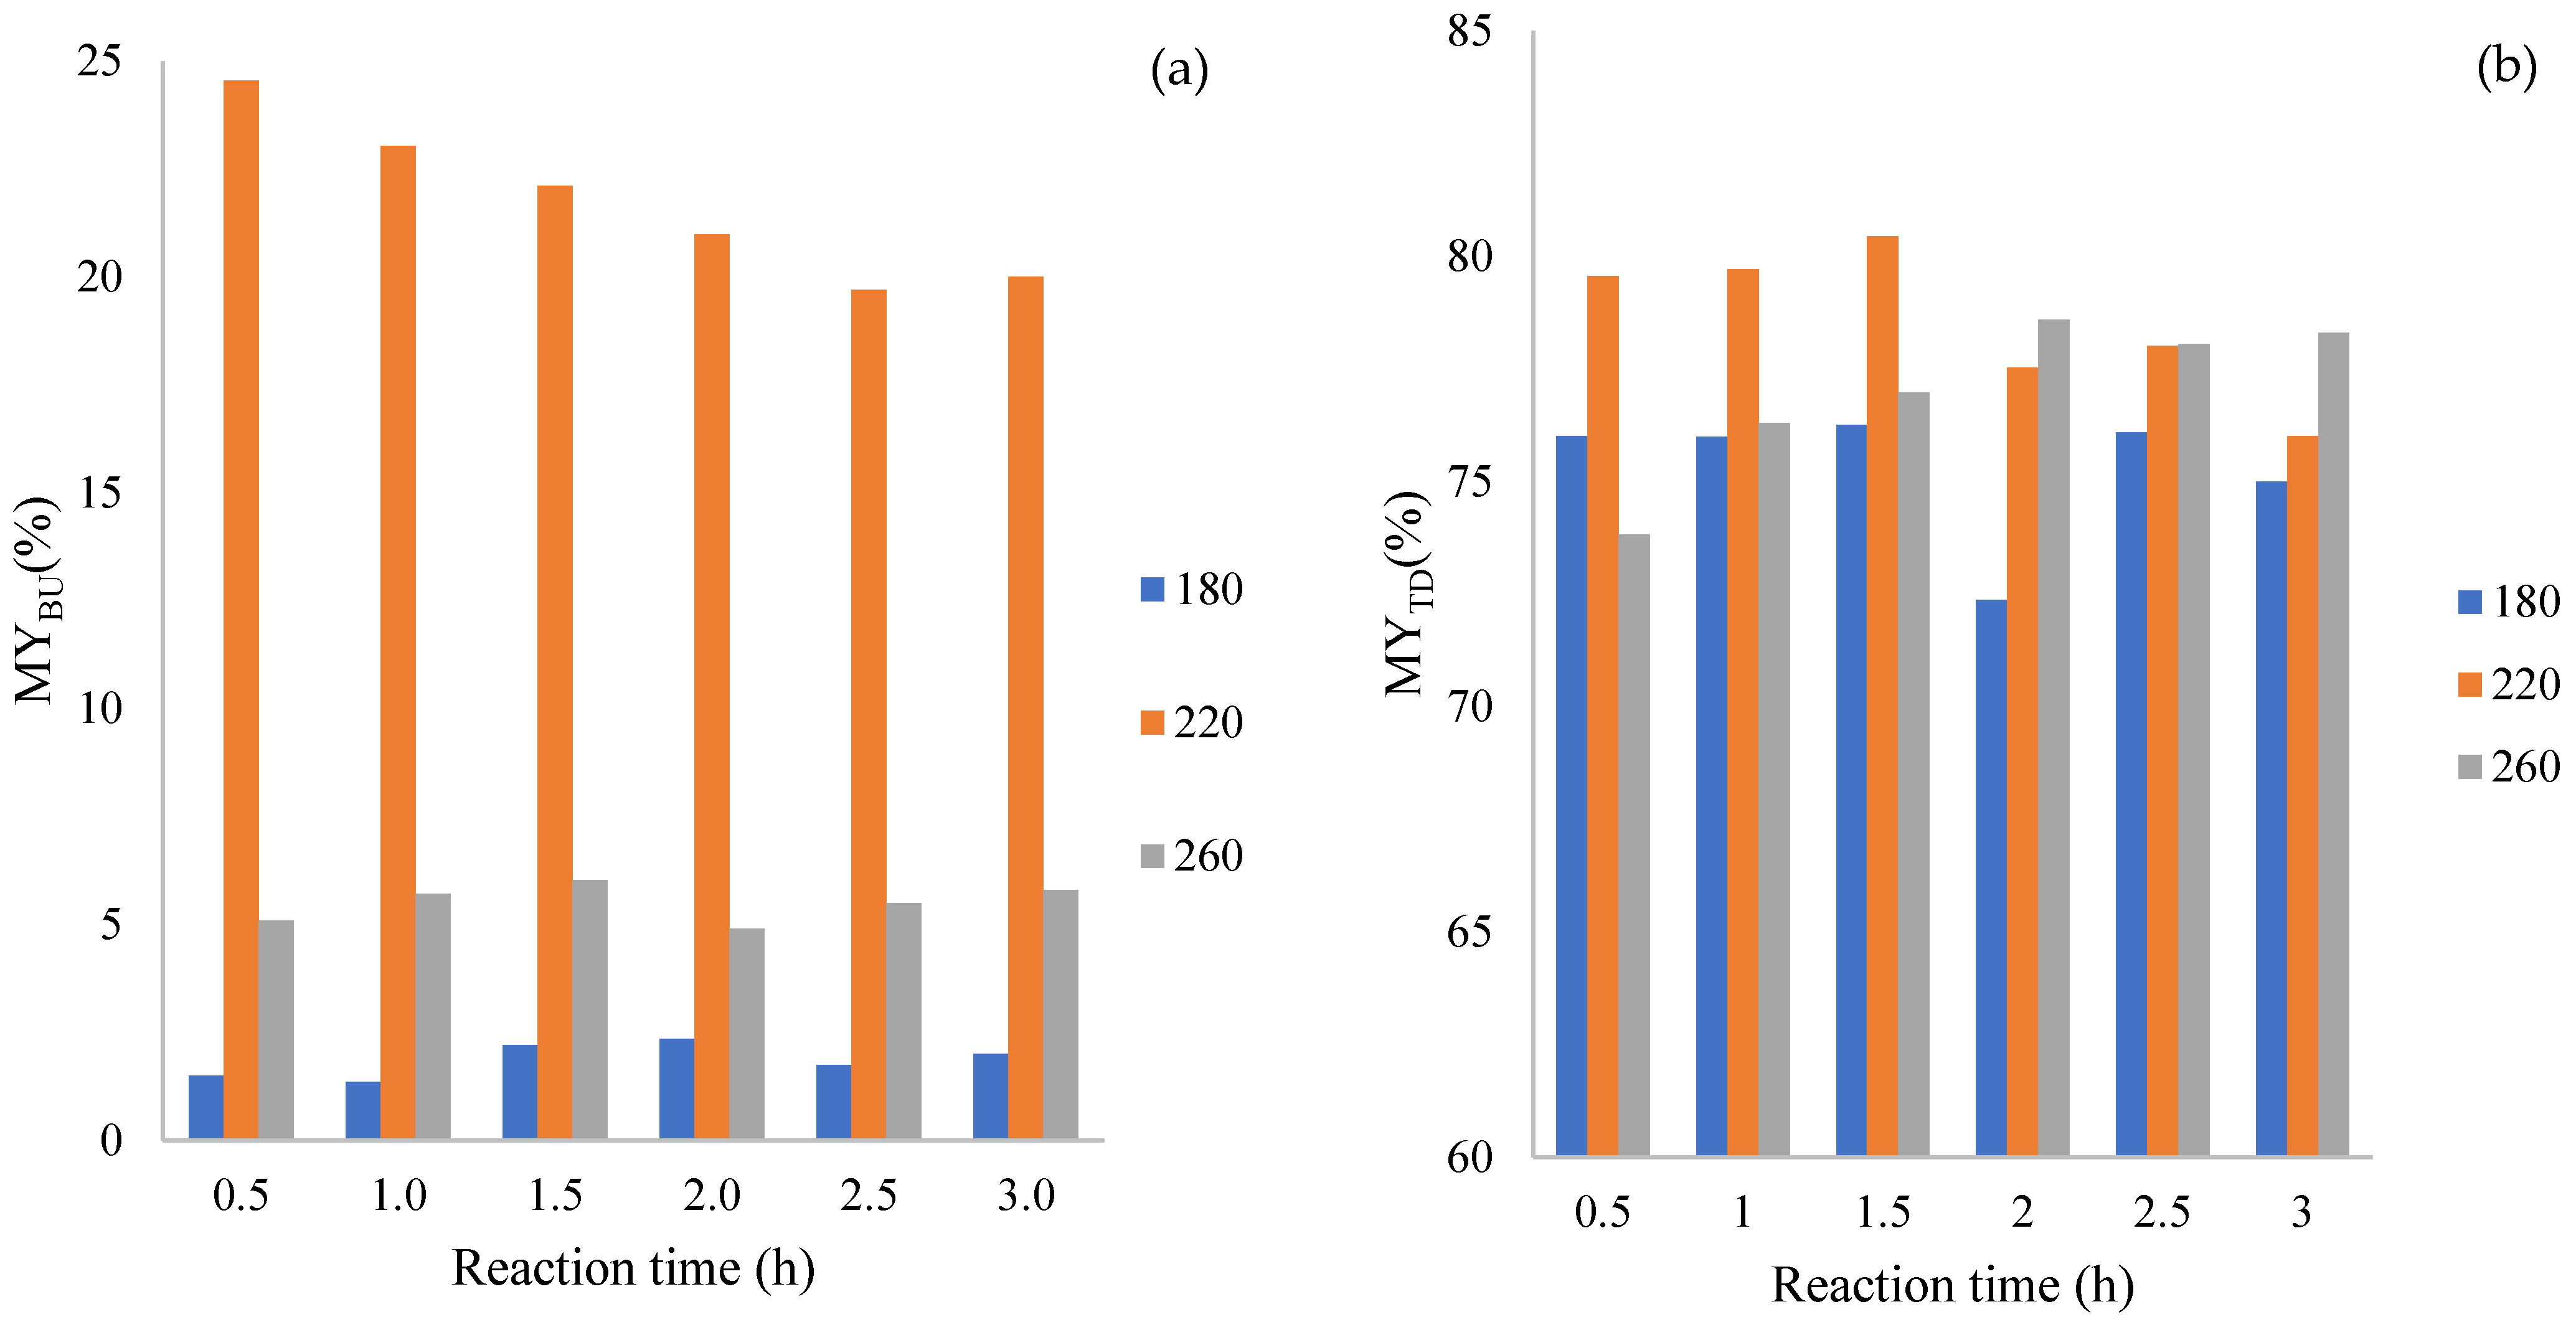
3.1. Mass Yields of CDs by Bottom-Up and Top-Down Methods

The mass yield of CDs from both the bottom-up and top-down methods at various hydrothermal temperatures (180, 220, and 260 °C) and reaction times (0.5–3 h) are presented in Figure 1. The mass yield of CDs varies with hydrothermal conditions. For instance, MYBU is very low (<5%) for bottom-up at 180 °C (Figure 1a); however, MYBU increases to as high as 25% for 220 °C (Figure 1b). A further increase in hydrothermal treatment temperature resulted in a lower MYBU for CD. Different hydrothermal reaction kinetics for hemicellulose, cellulose, and lignin are likely to be responsible for these observations [46]. At a lower hydrothermal treatment, only hemicelluloses and other aqueous extractives (e.g., starch) undergo hydrolysis, and as the percentage of hemicelluloses and aqueous extractives are lower than 20 wt% in loblolly pine [46], the MYBU derived from these biopolymers is low. On the other hand, cellulose is the most abundant biopolymer in woody biomass, and it could be as high as 60 wt% in loblolly pine [47]. Cellulose hydrolyzes from 220 °C [48,49], which reflects the high MYBU at 220 °C for the bottom-up approach. Now, a higher hydrothermal temperature (e.g., 260 °C) results in the rapid depolymerization of the hydrolyzed products of hemicelluloses and cellulose, and lignin starts to depolymerize [49,50,51]. Therefore, the MYBU for 260 °C is lower than 220 °C. Faster reaction kinetics can also be observed in MYBU at various reaction times. For instance, opposite trends of MYBU are observed for 180 and 220 °C, where the longer hydrothermal time resulted in a lower MYBU. This is likely due to the slower kinetics at 180 than 220 °C [52]. At 260 °C, the MYBU increases initially then becomes steady. This is likely due to the competition between hydrolysis and polymerization reactions [52].
Regarding the top-down method, the MYTD is significantly higher than the MYBU. It is evident that hydrochars can be oxidized into CDs by the top-down method using a NaOH and H2O2 combination, regardless of the hydrothermal condition. It should be noted that the MYTD is reported with respect to hydrochar feedstock, whereas MYBU is reported with respect to the loblolly pine feedstock. With the increase in hydrothermal treatment temperature from 180 °C to 220 °C, MYTD increased significantly with a shorter residence time; however, the MYTD decreased for hydrochar prepared at 220 °C for a longer residence time (>2 h). This is likely due to the difference in hydrochar morphology between 180 °C and 220 °C [49]. Hydrochar prepared at 180 °C is likely to have unreacted cellulose and unreacted lignin from loblolly pine, whereas hydrochar prepared at 220 °C could show cellulose reacted to form spherical amorphous micrometer-sized hydrochars with a hydrophobic core [52]. MYTD from hydrochars prepared at 260 °C shows an increasing trend with the increase in hydrothermal treatment time. Figure 1 shows that MYTD from 260 °C is the highest for the longer residence times (>2 h) compared to CD prepared from 180 °C and 220 °C. Hydrochars prepared at 260 °C with a prolonged reaction time could have a uniform particle size with significant concentrations of acidic oxygen functional groups [49,50,53,54]. These hydrochars might be more susceptible to CD formation during oxidation under the top-down method.

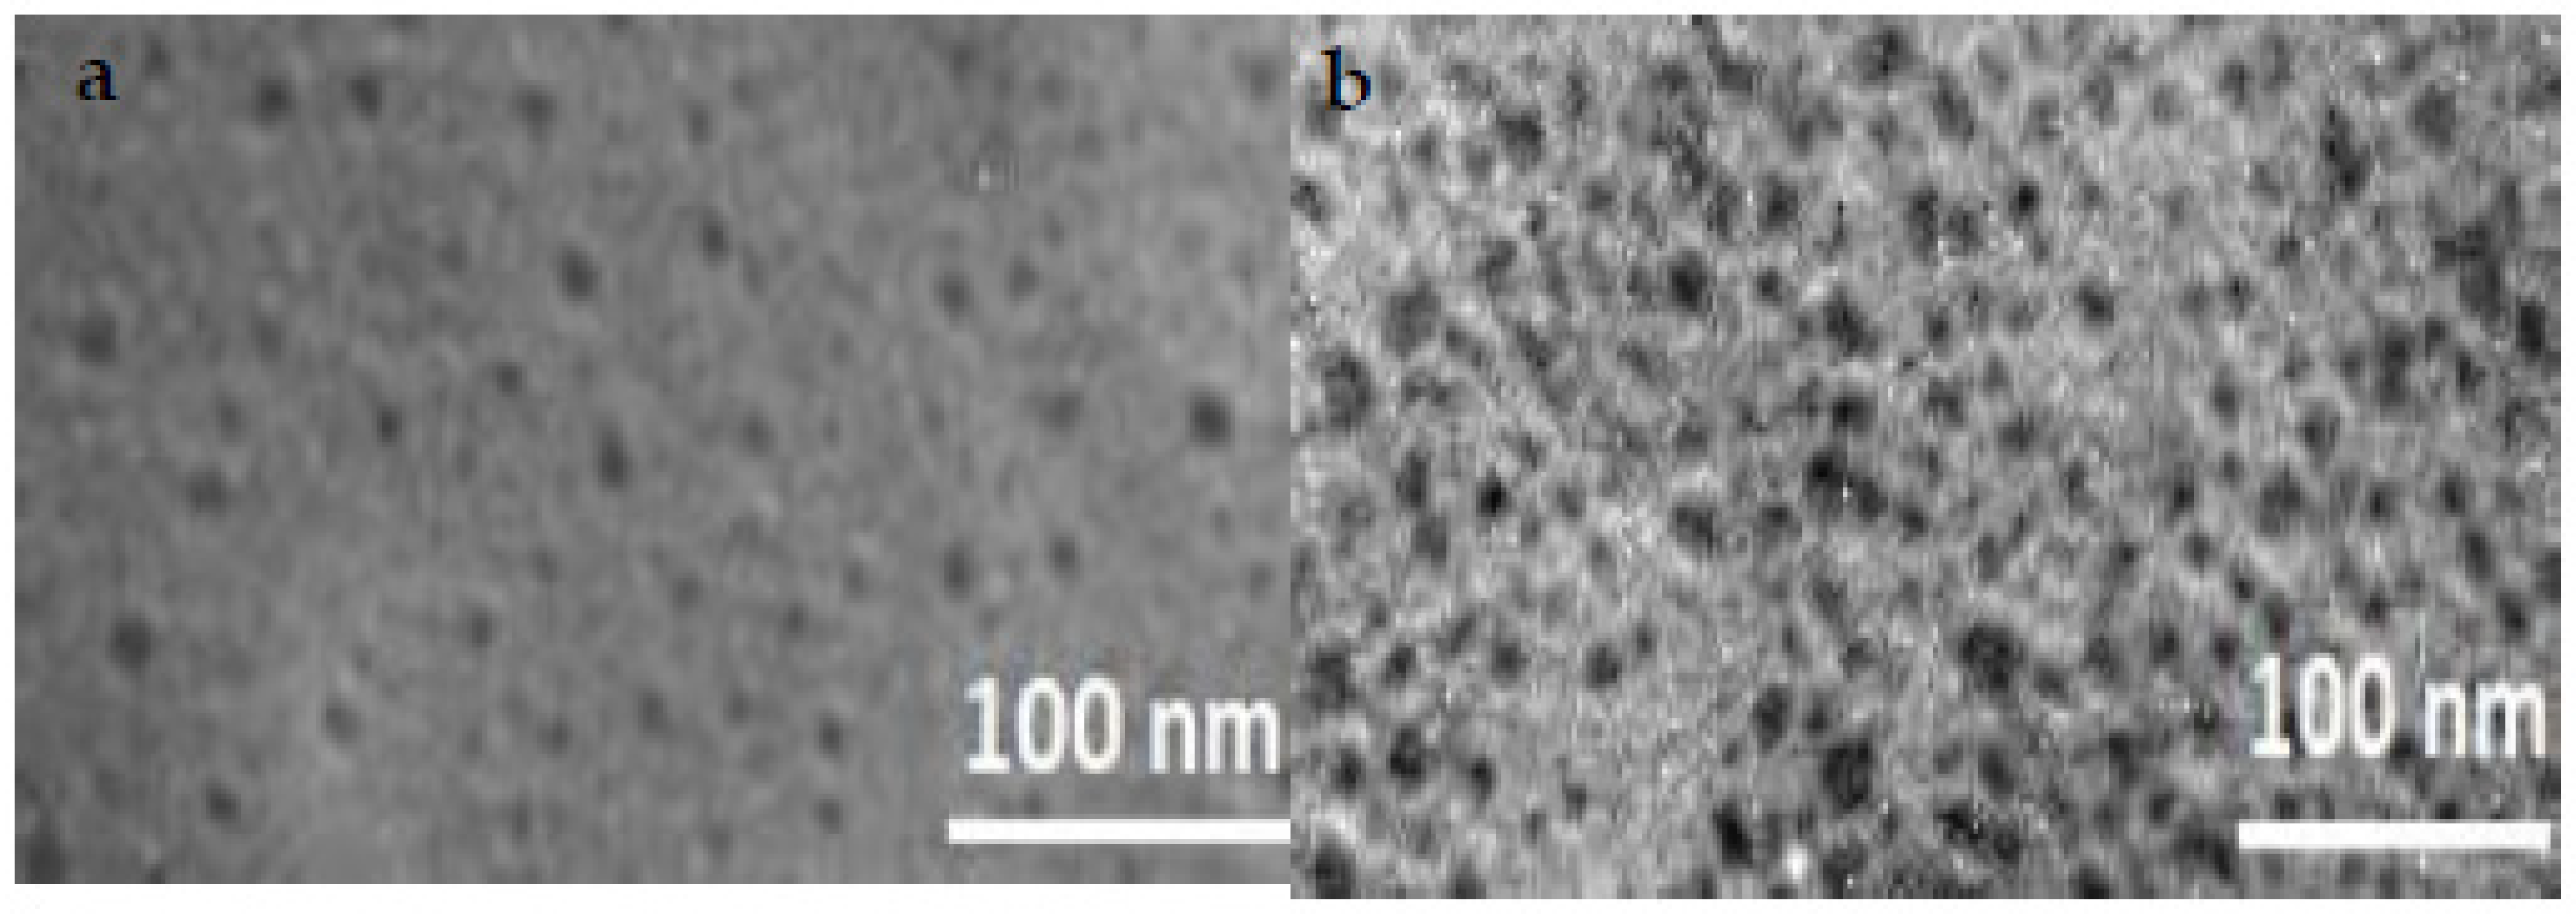
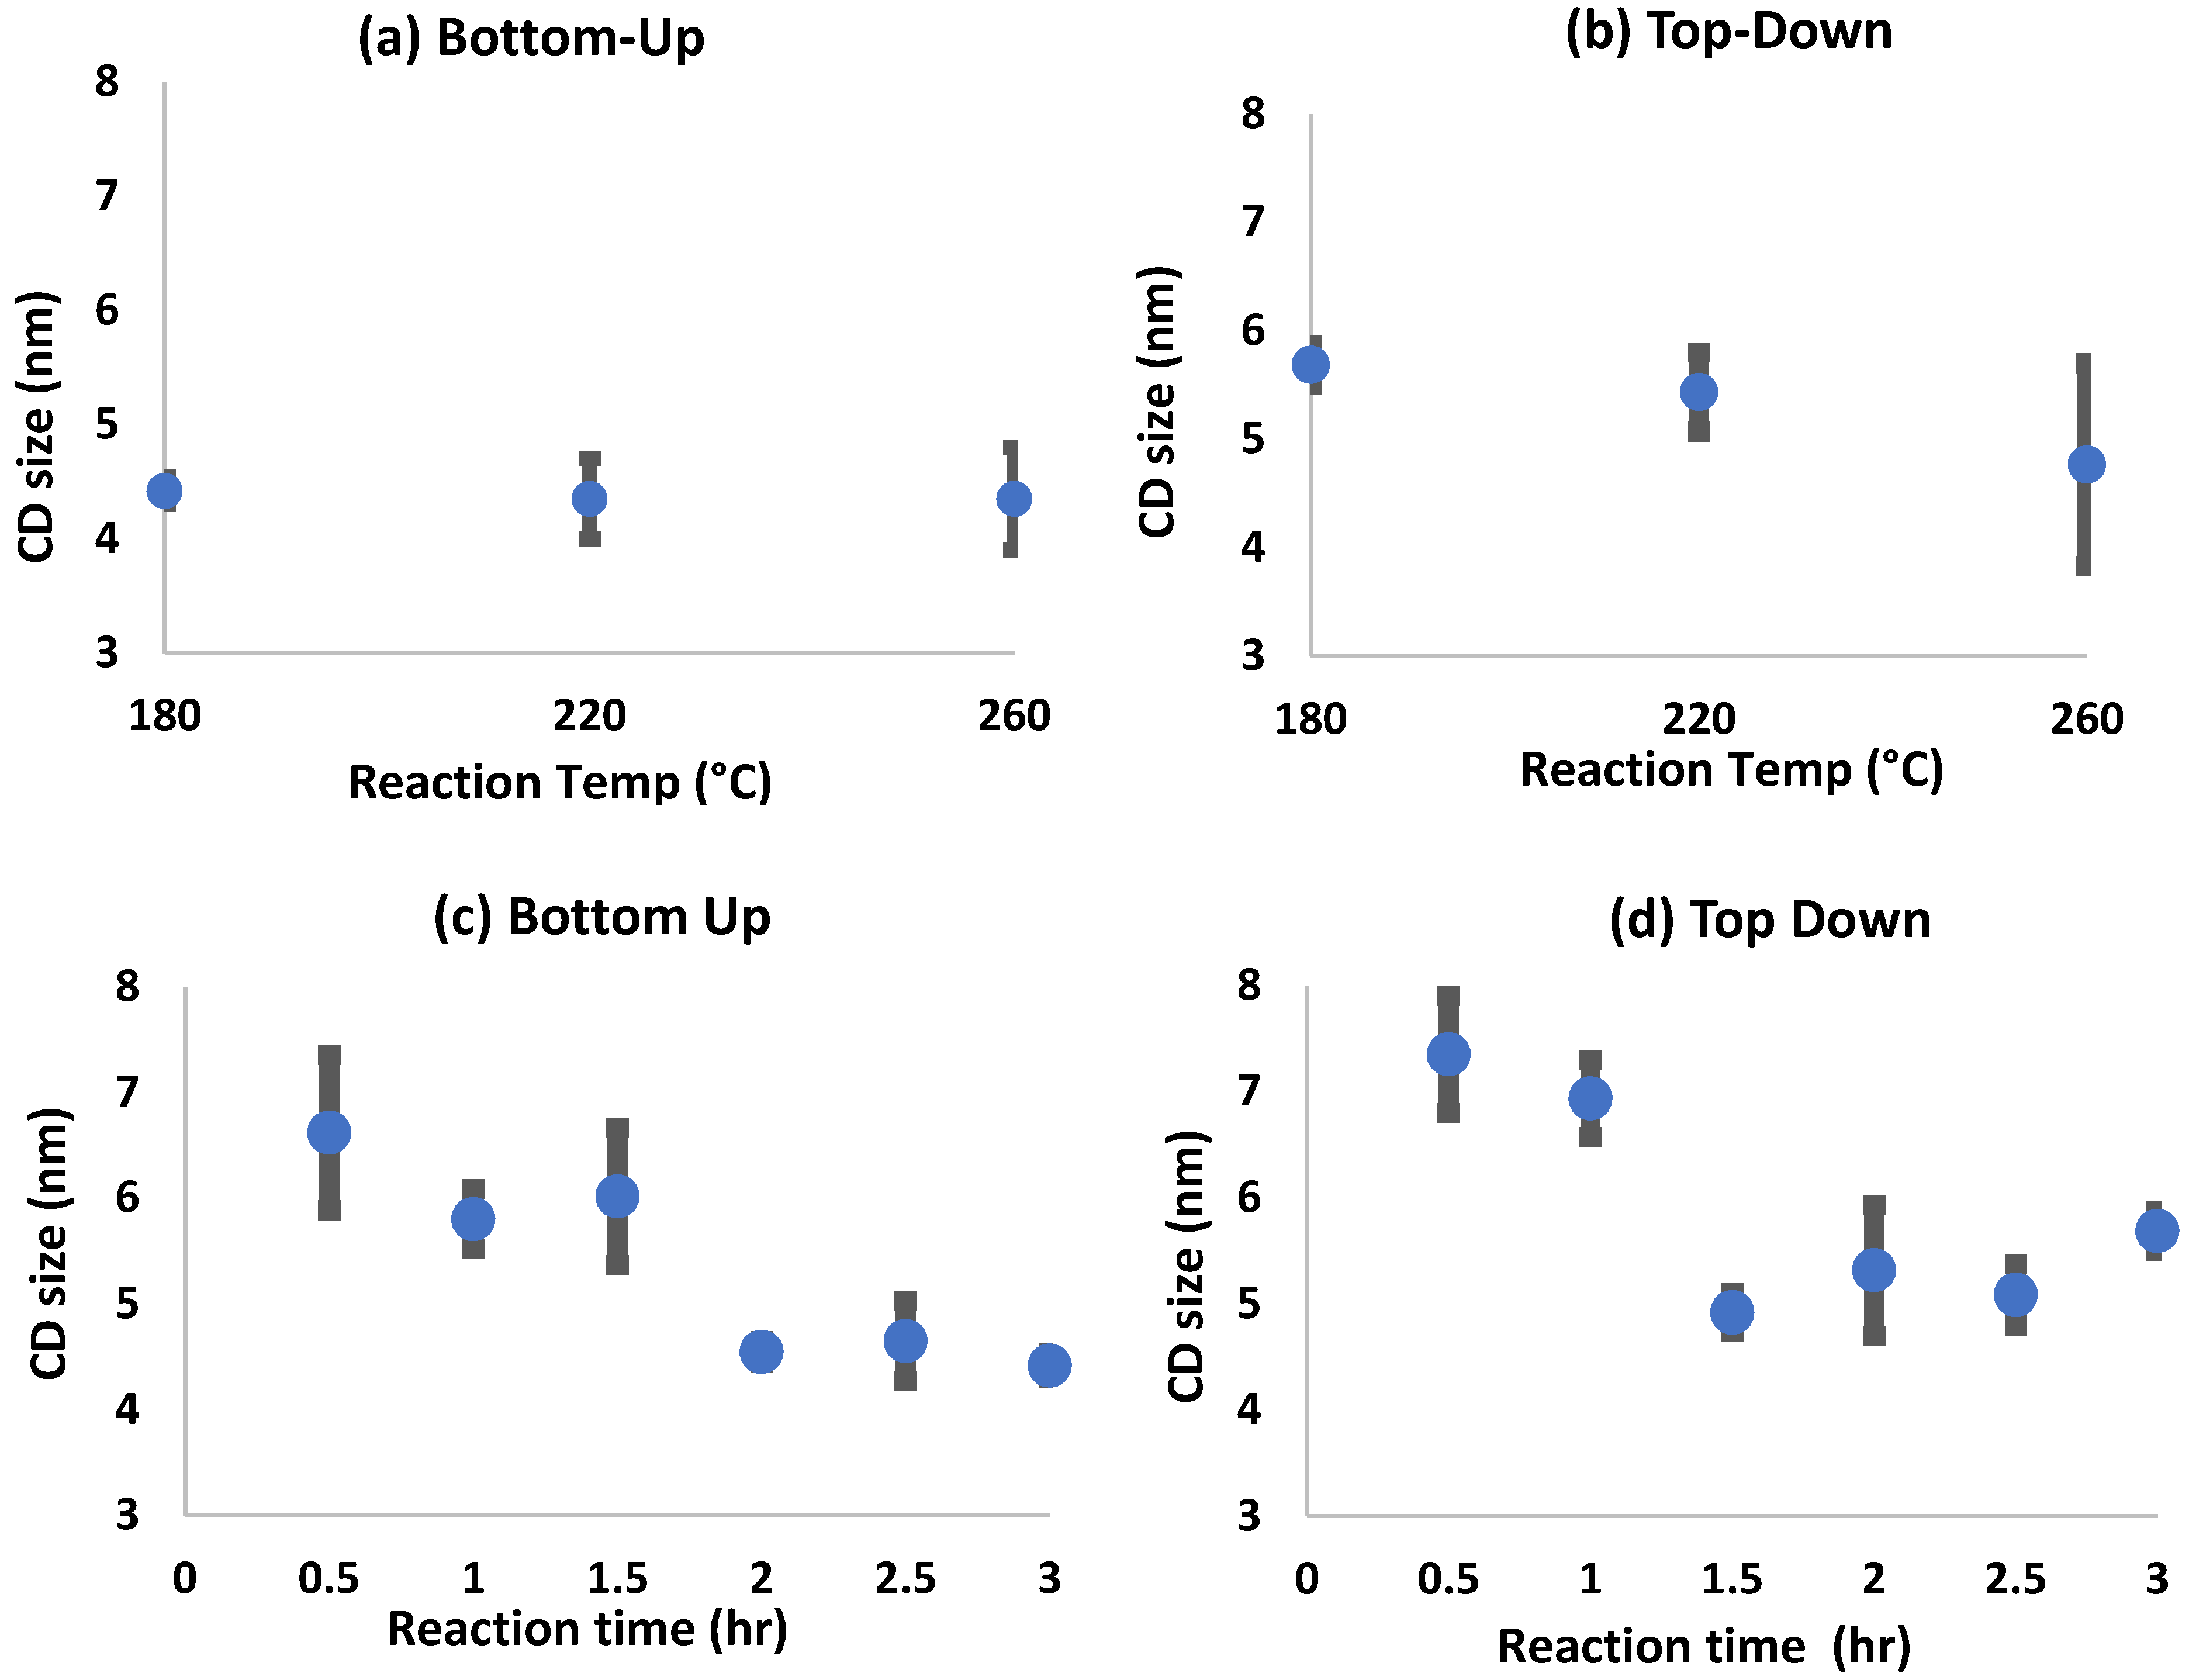
3.2. Size Analysis of CDs Prepared by Bottom-Up and Top-Down Methods

The MY results show that CD synthesis from hydrochar using the top-down method generated significantly higher yields compared to the bottom-up method, which started from loblolly pine. However, the CD size could vary when prepared from different methods. Moreover, the morphological properties might change in the same preparation method by changing the hydrothermal temperature time. In order to evaluate the change in morphology, CDs prepared in the bottom-up and top-down methods at various hydrothermal temperatures and reaction times are characterized by TEM, and the size of the CDs are determined.
Figure 2 shows the TEM image of CDBU and CDTD at 180 °C and 3 h. The nearly spherical form of the produced CDs, as seen by TEM observation, could be explained by the presence of CD structures [55]. They are uniformly scattered and typically have diameters between 2 and 10 nm. The TEM images show that neither the bottom-up (Figure 2a) nor the top-down (Figure 2b) method produced aggregated CDs. Although CDBU and CDTD have different average sizes and size distributions, it is difficult to predict if these factors contributed to the large discrepancy in their QYs [56].
The average sizes of the CDs prepared from the bottom-up and top-down methods at various hydrothermal conditions are shown in Figure 3, as well as the size distributions of the CDs. With the increase in hydrothermal treatment temperature, the size distribution expands, yet the bottom-up process shows a consistent average sizing of the CDs of around 4.5 nm. This suggests the role that biopolymers (hemicellulose, cellulose, or lignin) play in size determination, since they breakdown at varying temperatures, which has little impact on accuracy but more so on precision.
Unlike the similarly average-sized CDs from bottom-up, the top-down method resulted in a decreasing trend in CD size with the increase in hydrothermal treatment temperature. In fact, the CD size was 5.7 nm when synthesized from hydrochar treated at 180 °C, which reduces to 4.7 nm for hydrochar treated at 260 °C. Therefore, the top-down methods average higher sized CDs than the same temperature of bottom-up. This finding is consistent with the literature through the work of Bruno et al. [12], who found an overall higher size produced through the top-down method. Moreover, the size distribution for the top-down method, especially for the hydrochar prepared at a higher hydrothermal treatment temperature, is wider than the CD size of the bottom-up method. The particle size distribution plots of all samples are presented in the Supplementary File.

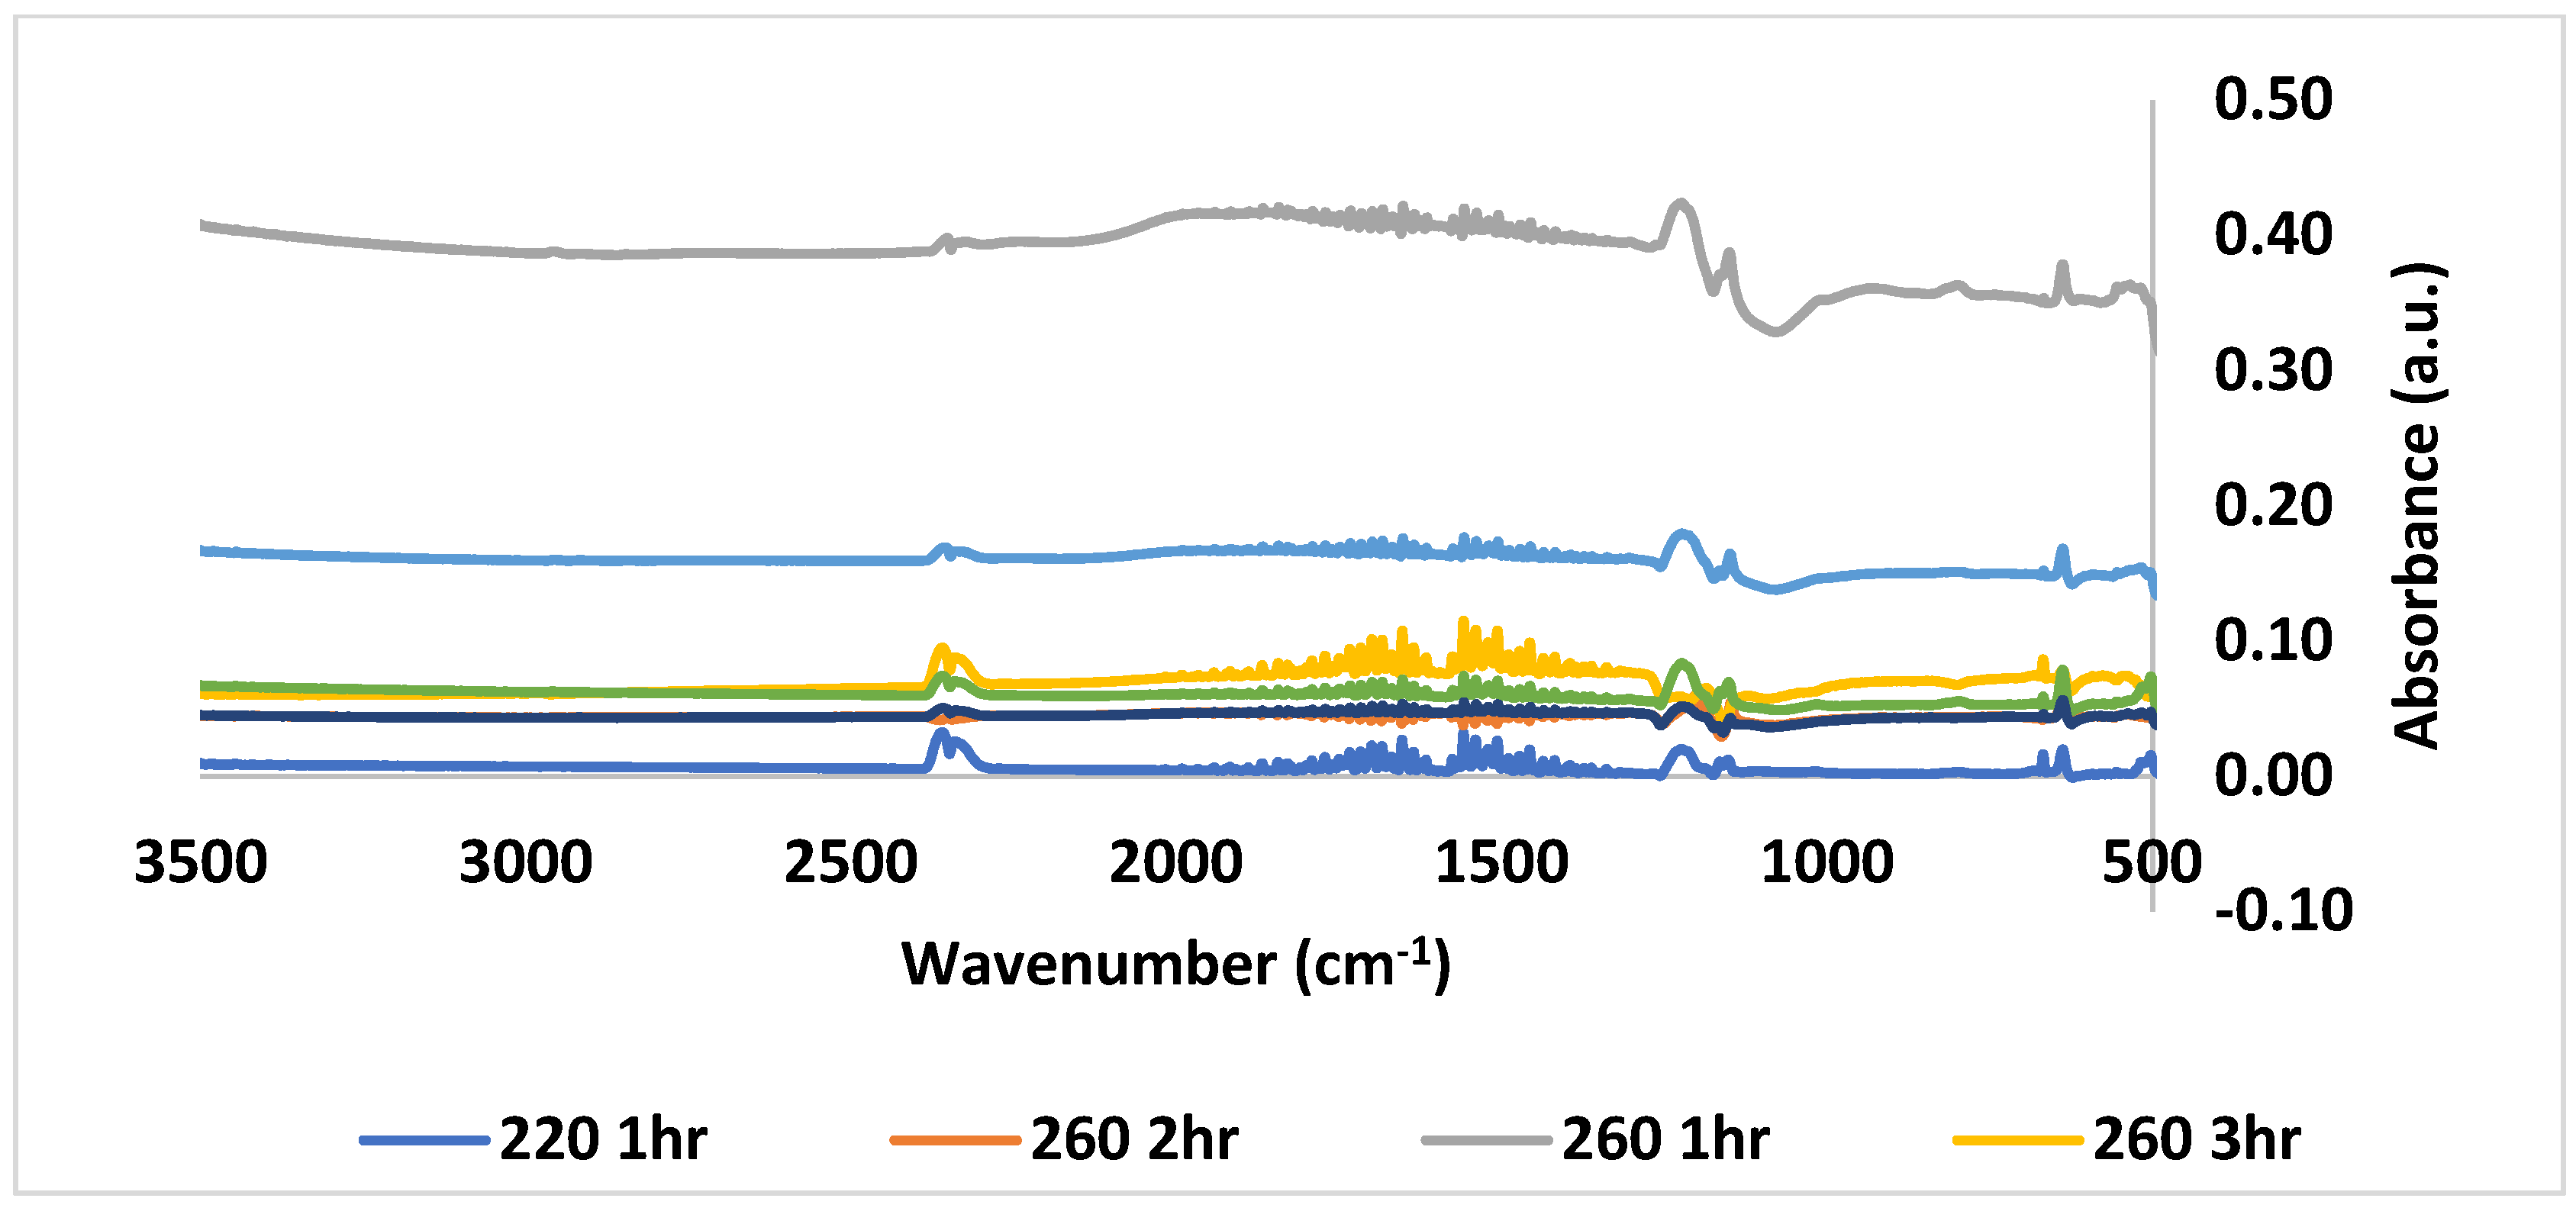
3.3. Chemical Alteration of CDs by FTIR Analysis

Figure 4 contains the results for the ATR analysis of the top-down, 180 °C samples of all residence times. Loblolly pine is a significant source of lignin, cellulose, and hemicellulose [57]. As such, carbon, oxygen, and hydrogen are expected in abundance. Based on the strong broad peak between 3200 and 3500 cm−1, -OH stretching (alcohol) is present in much higher amounts after 2 h of residence time [58]. This might happen as a result of lignin’s p-coumaryl, coniferyl, and sinapyl alcohols cracking [59,60]. The strong peaks can be observed at around 1260 cm−1 owing to methoxyl bonds, as well as approximately 1630 cm−1 because of a C=C bond in the pyranose ring of lignin [61]. The C=C bond increases significantly by increasing the residence time. The peak at 1050 cm−1 corresponds to alcohol groups of glucose (C-OH) [51]. The peaks in the range of 700 to 900 cm−1 correspond to cellulose and hemicellulose (C-H bond) [46].
Figure 5 contains the results for the FTIR analysis of the bottom-up samples. The stretching vibration of C-C, which may be connected to the structure of lignin, is responsible for the absorption peak at around 1200 cm−1 [61]. The C-C bond increases when the temperature increases from 220 to 260 °C. The bending vibration peak of -OCH3 was the absorption peak that occurred between 1420 and 1480 cm−1. The peaks in the range of 700 to 900 cm−1 correspond to the C-H bond, which increases by increasing the temperature [51]. The peak at around 1170 cm−1 corresponds to C-O-C stretching vibration (cellulose), which reaches a maximum at 260 °C [61].

3.4. Effect of CD Preparation and Hydrothermal Conditions on Quantum Yield of CD

Photoluminescence is one of the major properties of CDs reported in the literature. When ultraviolet to visible light is absorbed, CDs re-emit the light at different wavelengths. The emitted wavelength depends on the CD size, lattice structure, functionality, and precursor [62,63]. In this study, QYs are determined for CDs prepared at various hydrothermal treatment conditions for both bottom-up and top-down methods and presented in Table 1. Quantum yield can be defined as the ratio of excitation to the absorbed photons on CDs after a photochemical reaction. Please note that relative quantum yields were calculated using quinine sulfate as reference. The quantum yield was measured for each sample produced at various times and temperatures. Table 1 contains the results of these measurements. These measurements were run in triplicates with exceptionally low deviation (<1%). Very few studies have been performed for hydrothermally synthesized CDs from woody biomass; however, one such study was completed by Zhao et al. [22] at 3 h and 180 °C which reported a QY of 4.7%. This value is relatively similar to the corresponding conditions of this experiment with a QY of 2.7%. The difference likely rests with the feedstock in the experiments.
Table 1 suggests that the quantum yield of CDs produced from the top-down method are the highest when CDs are synthesized at 260 °C. The variation of QY averages between the three temperatures of 180, 220, and 260 are 13.8, 20.4, and 33.0%, respectively. The increase in QY with temperature is likely due to the difference in the degradation temperatures of the three main components of woody biomass (lignin, cellulose, and hemicellulose) during hydrothermal treatment (>250 °C, 180 °C, and 180 °C, respectively) [32,33,37]. One of the main components of woody biomass is lignin, thus, if it does not begin to break down significantly before the final temperature trials, then it will have little effect on the two previous conditions, as less CD building blocks are generated. Another factor that follows a similar trend is CD size and variation in size. As the temperature increases, the results of Figure 3b show a drop in average size and an increase in size variance. Size variance due to differing types and amounts of building blocks available are responsible for the uniformity of the CD structure regarding hybridization, which has been proven by Tepliakov et al. [64] to have a major impact on the photoluminescent properties. These results coincide with the works of Jing et al. [38], who reports the hydrothermal synthesis of biomass treated at 200 for 6 h possessing quantum yields below 10%, and the top-down synthesis of hydrochar from biomass with quantum yields between 20 and 40%. However, the experimental conditions and feedstocks are different in this study, so direct comparisons may not be made.
The quantum yield for the bottom-up process is significantly lower than that of the top-down method, as seen in Table 1. However, similar to the top-down method, the quantum yield of CDs produced from top-down and bottom-up are the highest when CDs are synthesized at 260 °C. This result is in agreement with the findings of Liu et al. [65], who varied the temperature of the hydrothermal treatment of biomass and found an increase in quantum yield with the increase in temperature. It is evident from the spectral graphs that sugar is present in the samples, as compared with spectral graphs from the literature [66]. The physical characteristics of the samples have strong aromas of maple syrup and an inability to lyophilize into a solid state, further confirming this finding. The polymeric sugar chains that contain hydroxyl functional groups are, thus, not transferred to the CQD but rather remain in the solution. Zhang et al. [67] have shown that hydroxyl groups can enhance the quantum yield of CDs, which is likely attributable to the top-down methods, as the sugars are broken down but not the bottom-up CD’s.
Particle size has also been linked to QY [63,68]. However, the bottom-up procedure witnessed little change in average particle sizing with respect to temperature but a definite change in quantum yield. A more causational determinant for QY performance is the quantum confinement effect. This refers to the amount of sp2 hybridization within the dots, which increases delocalization and decreases the energy band gap [69]. It is logical to associate the increase in quantum yield across temperature change with the degree of hybridization formed in the CDs, especially in the conditions where lignin begins to break down and a diverse mixture of moieties are present in the process liquid, which deters sp3 lattice formations. The effect of residence time on quantum yield is evidently inverse for the bottom-up method, where an increase in time results in a decrease in quantum yield. This observation is likely due to the gradual increase in the CD building blocks generated, the increased uniformity among them, and the time taken to polymerize. These conditions provide an environment for increased carbonization beyond sp2 within the CDs, which has been shown to quench photoluminescent properties for CDs [62,70,71].

4. Conclusions

This study explores the bottom-up vs. top-down approach with a basis of hydrothermal carbonization at varying reaction conditions for CD synthesis. The results of the study indicate that the top-down method consistently produces a higher mass yield than bottom-up. The top-down method results in mass yields upwards of an 80% conversion, while the bottom-up mass yield was below 25%. The sizes of the CDs were generally smaller for the bottom-up method, but size distribution was much higher for top-down. The physical characteristics of the CDs suggested that the bottom-up process contained higher hydroxyl groups, which was confirmed by FTIR, whereas the top-down method was able to break down these hydroxyl groups, resulting in higher CD conversion from loblolly pine. This led to a higher quantum yield for the top-down method reaching up to 48.5%, while bottom-up was limited to as high as 18.1%. Future study could focus on the novel applications of the CDs produced from this study.

Supplementary Materials

The following supporting information can be downloaded at: https://www.mdpi.com/article/10.3390/biomass2040017/s1, Figure S1. Particle size distribution of CDTD sample at 180 °C and 0.5 h. Figure S2. Particle size distribution of CDTD sample at 180 °C and 1 h. Figure S3. Particle size distribution of CDTD sample at 180 °C and 1.5 h. Figure S4. Particle size distribution of CDTD sample at 180 °C and 2 h. Figure S5. Particle size distribution of CDTD sample at 180 °C and 2.5 h. Figure S6. Particle size distribution of CDTD sample at 180 °C and 3 h. Figure S7. Particle size distribution of CDTD sample at 220 °C and 3 h. Figure S8. Particle size distribution of CDTD sample at 260 °C and 3 h. Figure S9. Particle size distribution of CDBU sample at 180 °C and 0.5 h. Figure S10. Particle size distribution of CDBU sample at 180 °C and 1 h. Figure S11. Particle size distribution of CDBU sample at 180 °C and 1.5 h. Figure S12. Particle size distribution of CDBU sample at 180 °C and 2 h. Figure S13. Particle size distribution of CDBU sample at 180 °C and 2.5 h. Figure S14. Particle size distribution of CDBU sample at 180 °C and 3 h. Figure S15. Particle size distribution of CDBU sample at 220 °C and 3 h. Figure S16. Particle size distribution of CDBU sample at 260 °C and 3 h. Figure S17. Images of CD’s obtained from tunneling electron microscopy from this study. Images show variance in particle and size distributions. (CDBU at 220 °C and 3 h). Figure S18. Images of CD’s obtained from tunneling electron microscopy from this study. Images show variance in particle and size distributions. (CDBU at 260 °C and 3 h). Figure S19. Images of CD’s obtained from tunneling electron microscopy from this study. Images show variance in particle and size distributions. (CDTD at 220 °C and 3 h). Figure S20. Images of CD’s obtained from tunneling electron microscopy from this study. Images show variance in particle and size distributions. (CDTD at 260 °C and 3 h). Table S21: Absorbance vs. Intensity plot. Each sample was diluted to five different absorbances between 0.02 and 0.1. These samples were measured in the fluorometer for intensity with the values plotted. The trendlines were generated and the slopes were used to calculate the quantum yield with respect to the slope of quinine sulfate. The data in this plot represents three temperatures operated with 3 h retention time at each temperature.

Author Contributions

Conceptualization, T.R.; methodology, T.R. and T.Q.; software, T.Q. and V.G.; validation, T.Q., V.G. and T.R.; formal analysis, T.Q. and V.G.; investigation, T.Q., V.G. and T.R.; resources, T.Q., V.G. and T.R; data curation, T.Q.; writing—original draft preparation, T.Q., V.G. and T.R.; writing—review and editing, T.R.; visualization, T.Q.; supervision, T.R.; project administration, T.R.; funding acquisition, T.R. All authors have read and agreed to the published version of the manuscript.

Funding

The material is based upon work partially supported by the National Science Foundation under Grant No. 2123495 and U.S. Department of Agriculture Grant no. 2019-67019-31594.

Data Availability Statement

Not applicable.

Acknowledgments

The authors acknowledge Tatiana Karpova for her support with the TEM analysis. Vipuil Kishore and Boris Akhremitchev are also acknowledged for their help with the lyophilization and fluorometry. The authors also acknowledge Aaron Portel for assisting with the hydrothermal treatments.

Conflicts of Interest

The authors declare no conflict of interest. The funders had no role in the design of the study; in the collection, analyses, or interpretation of data; in the writing of the manuscript, or in the decision to publish the results.

References

  1. Cao, L.; Wang, X.; Meziani, M.J.; Lu, F.; Wang, H.; Luo, P.G.; Lin, Y.; Harruff, B.A.; Veca, L.M.; Murray, D.; et al. Carbon Dots for Multiphoton Bioimaging. J. Am. Chem. Soc. 2007, 129, 11318–11319. Available online: https://pubs.acs.org/doi/10.1021/ja073527l (accessed on 20 July 2022). [CrossRef] [PubMed] [Green Version]
  2. Zhang, J.; Yu, S.-H. Carbon dots: Large-scale synthesis, sensing and bioimaging. Mater. Today 2016, 19, 382–393. [Google Scholar] [CrossRef]
  3. Liu, H.; He, Z.; Jiang, L.-P.; Zhu, J.-J. Microwave-Assisted Synthesis of Wavelength-Tunable Photoluminescent Carbon Nanodots and Their Potential Applications. ACS Appl. Mater. Interfaces 2015, 7, 4913–4920. [Google Scholar] [CrossRef]
  4. Rai, S.; Singh, B.K.; Bhartiya, P.; Singh, A.; Kumar, H.; Dutta, P.K.; Mehrotra, G.K. Lignin derived reduced fluorescence carbon dots with theranostic approaches: Nano-drug-carrier and bioimaging. J. Lumin. 2017, 190, 492–503. [Google Scholar] [CrossRef]
  5. Song, X.; Zhao, S.; Xu, Y.; Chen, X.; Wang, S.; Zhao, P.; Pu, Y.; Ragauskas, A.J. Preparation, Properties, and Application of Lignocellulosic-Based Fluorescent Carbon Dots. ChemSusChem 2022, 15, e202102486. [Google Scholar] [CrossRef] [PubMed]
  6. de Yro, P.A.N.; Quaichon, G.M.O.; Cruz, R.A.T.; Emolaga, C.S.; Que, M.C.O.; Magdaluyo, E.R., Jr.; Basilia, B.A. Hydrothermal synthesis of carbon quantum dots from biowaste for bio-imaging. AIP Conf. Proc. 2019, 2083, 020007. [Google Scholar] [CrossRef]
  7. Wang, L.; Zhang, H.; Zhou, X.; Liu, Y.; Lei, B. Preparation and characterization of a luminescent carbon dots grafted CaSiO3:Eu3+ phosphor for ratiometric fluorescent oxygen sensing. RSC Adv. 2016, 6, 98554–98562. [Google Scholar] [CrossRef]
  8. Qin, X.; Lu, W.; Asiri, A.M.; Al-Youbi, A.O.; Sun, X. Microwave-assisted rapid green synthesis of photoluminescent carbon nanodots from flour and their applications for sensitive and selective detection of mercury(II) ions. Sens. Actuators B Chem. 2013, 184, 156–162. [Google Scholar] [CrossRef]
  9. Carbonaro, C.M.; Corpino, R.; Salis, M.; Mocci, F.; Thakkar, S.V.; Olla, C.; Ricci, P.C. On the Emission Properties of Carbon Dots: Reviewing Data and Discussing Models. J. Carbon Res. 2019, 5, 60. [Google Scholar] [CrossRef] [Green Version]
  10. Wang, Y.; Hu, A. Carbon quantum dots: Synthesis, properties and applications. J. Mater. Chem. C 2014, 2, 6921–6939. [Google Scholar] [CrossRef]
  11. Desmond, L.J.; Phan, A.N.; Gentile, P. Critical overview on the green synthesis of carbon quantum dots and their application for cancer therapy. Environ. Sci. Nano 2021, 8, 848–862. [Google Scholar] [CrossRef]
  12. Bruno, F.; Sciortino, A.; Buscarino, G.; Soriano, M.L.; Ríos, Á.; Cannas, M.; Gelardi, F.; Messina, F.; Agnello, S. A Comparative Study of Top-Down and Bottom-Up Carbon Nanodots and Their Interaction with Mercury Ions. Nanomaterials 2021, 11, 1265. [Google Scholar] [CrossRef] [PubMed]
  13. Kurian, M.; Paul, A. Recent trends in the use of green sources for carbon dot synthesis—A short review. Carbon Trends 2021, 3, 100032. [Google Scholar] [CrossRef]
  14. Wang, F.; Ouyang, D.; Zhou, Z.; Page, S.J.; Liu, D.; Zhao, X. Lignocellulosic biomass as sustainable feedstock and materials for power generation and energy storage. J. Energy Chem. 2021, 57, 247–280. [Google Scholar] [CrossRef]
  15. Bioenergy Frequently Asked Questions. Energy.Gov. Available online: https://www.energy.gov/eere/bioenergy/bioenergy-frequently-asked-questions (accessed on 21 July 2022).
  16. Wang, Z.; Yu, J.; Zhang, X.; Li, N.; Liu, B.; Li, Y.; Wang, Y.; Wang, W.; Li, Y.; Zhang, L.; et al. Large-Scale and Controllable Synthesis of Graphene Quantum Dots from Rice Husk Biomass: A Comprehensive Utilization Strategy. ACS Appl. Mater. Interfaces 2016, 8, 1434–1439. [Google Scholar] [CrossRef]
  17. Mehdi, R.; Khoja, A.H.; Naqvi, S.R.; Gao, N.; Amin, N.A.S. A Review on Production and Surface Modifications of Biochar Materials via Biomass Pyrolysis Process for Supercapacitor Applications. Catalysts 2022, 12, 798. [Google Scholar] [CrossRef]
  18. Si, M.; Zhang, J.; He, Y.; Yang, Z.; Yan, X.; Liu, M.; Zhuo, S.; Wang, S.; Min, X.; Gao, C.; et al. Synchronous and rapid preparation of lignin nanoparticles and carbon quantum dots from natural lignocellulose. Green Chem. 2018, 20, 3414–3419. [Google Scholar] [CrossRef]
  19. Wei, J.; Zhang, X.; Sheng, Y.; Shen, J.; Huang, P.; Guo, S.; Pan, J.; Liuc, B.; Feng, B. Simple one-step synthesis of water-soluble fluorescent carbon dots from waste paper. New J. Chem. 2014, 38, 906–909. [Google Scholar] [CrossRef]
  20. Nguyen, H.T.G.; Lyttek, E.; Lal, P.; Wieczerak, T.; Luong, T. Evaluating loblolly pine bioenergy development potential using AHP integrated weighted overlay and network optimization in Virginia, USA. Trees For. People 2022, 8, 100271. [Google Scholar] [CrossRef]
  21. Gan, Y.X.; Jayatissa, A.H.; Yu, Z.; Chen, X.; Li, M. Hydrothermal Synthesis of Nanomaterials. J. Nanomater. 2020, 2020, e8917013. [Google Scholar] [CrossRef] [Green Version]
  22. Zhao, S.; Song, X.; Chai, X.; Zhao, P.; He, H.; Liu, Z. Green production of fluorescent carbon quantum dots based on pine wood and its application in the detection of Fe3+. J. Clean. Prod. 2020, 263, 121561. [Google Scholar] [CrossRef]
  23. Gao, X.; Zhou, X.; Ma, Y.; Qian, T.; Wang, C.; Chu, F. Facile and cost-effective preparation of carbon quantum dots for Fe3+ ion and ascorbic acid detection in living cells based on the ‘on-off-on’ fluorescence principle. Appl. Surf. Sci. 2019, 469, 911–916. [Google Scholar] [CrossRef]
  24. Wu, P.; Li, W.; Wu, Q.; Liu, Y.; Liu, S. Hydrothermal synthesis of nitrogen-doped carbon quantum dots from microcrystalline cellulose for the detection of Fe3+ ions in an acidic environment. RSC Adv. 2017, 7, 44144–44153. [Google Scholar] [CrossRef] [Green Version]
  25. Su, H.; Bi, Z.; Ni, Y.; Yan, L. One-pot degradation of cellulose into carbon dots and organic acids in its homogeneous aqueous solution. Green Energy Environ. 2019, 4, 391–399. [Google Scholar] [CrossRef]
  26. Huang, C.; Dong, H.; Su, Y.; Wu, Y.; Narron, R.; Yong, Q. Synthesis of Carbon Quantum Dot Nanoparticles Derived from Byproducts in Bio-Refinery Process for Cell Imaging and In Vivo Bioimaging. Nanomaterials 2019, 9, 387. [Google Scholar] [CrossRef] [Green Version]
  27. Woo, J.; Song, Y.; Ahn, J.; Kim, H. Green one-pot preparation of carbon dots (CD)-embedded cellulose transparent film for Fe3+ indicator using ionic liquid. Cellulose 2020, 27, 4609–4621. [Google Scholar] [CrossRef]
  28. Ye, R.; Xiang, C.; Lin, J.; Peng, Z.; Huang, K.; Yan, Z.; Cook, N.P.; Samuel, E.L.G.; Hwang, C.C.; Ruan, G.; et al. Coal as an abundant source of graphene quantum dots. Nat. Commun. 2013, 4, 2943. [Google Scholar] [CrossRef] [PubMed] [Green Version]
  29. Li, M.; Zhang, L.; Xu, Q.; Niu, J.; Xia, Z. N-doped graphene as catalysts for oxygen reduction and oxygen evolution reactions: Theoretical considerations. J. Catal. 2014, 314, 66–72. [Google Scholar] [CrossRef]
  30. Xu, Q.; Pu, P.; Zhao, J.; Dong, C.; Gao, C.; Chen, Y.; Chen, J.; Liua, Y.; Zhoua, H. Preparation of highly photoluminescent sulfur-doped carbon dots for Fe(III) detection. J. Mater. Chem. A 2014, 3, 542–546. [Google Scholar] [CrossRef]
  31. Hasan, R.; Saha, N.; Quaid, T.; Reza, M.T. Formation of Carbon Quantum Dots via Hydrothermal Carbonization: Investigate the Effect of Precursors. Energies 2021, 14, 986. [Google Scholar] [CrossRef]
  32. Kang, C.; Huang, Y.; Yang, H.; Yan, X.F.; Chen, Z.P. A Review of Carbon Dots Produced from Biomass Wastes. Nanomaterials 2020, 10, 2316. [Google Scholar] [CrossRef] [PubMed]
  33. Yuan, Q.; Liu, S.; Ma, M.-G.; Ji, X.-X.; Choi, S.-E.; Si, C. The Kinetics Studies on Hydrolysis of Hemicellulose. Front. Chem. 2021, 9, 781291. [Google Scholar] [CrossRef] [PubMed]
  34. Paksung, N.; Pfersich, J.; Arauzo, P.J.; Jung, D.; Kruse, A. Structural Effects of Cellulose on Hydrolysis and Carbonization Behavior during Hydrothermal Treatment. ACS Omega 2020, 5, 12210–12223. [Google Scholar] [CrossRef] [PubMed]
  35. Brunner, G. Chapter 8—Processing of Biomass with Hydrothermal and Supercritical Water. In Supercritical Fluid Science and Technology; Brunner, G., Ed.; Elsevier: Amsterdam, The Netherlands, 2014; Volume 5, pp. 395–509. [Google Scholar] [CrossRef]
  36. Huang, X.; Atay, C.; Zhu, J.; Palstra, S.W.L.; Korányi, T.I.; Boot, M.D.; Hensen, E.J.M. Catalytic Depolymerization of Lignin and Woody Biomass in Supercritical Ethanol: Influence of Reaction Temperature and Feedstock. ACS Sustain. Chem. Eng. 2017, 5, 10864–10874. [Google Scholar] [CrossRef]
  37. Brebu, M.; Vasile, C. Thermal degradation of lignin—A Review. Cellul. Chem. Technol. 2010, 44, 353–363. [Google Scholar]
  38. Jing, S.; Zhao, Y.; Sun, R.-C.; Zhong, L.; Peng, X. Facile and High-Yield Synthesis of Carbon Quantum Dots from Biomass-Derived Carbons at Mild Condition. ACS Sustain. Chem. Eng. 2019, 7, 7833–7843. [Google Scholar] [CrossRef]
  39. Papaioannou, N.; Titirici, M.-M.; Sapelkin, A. Investigating the Effect of Reaction Time on Carbon Dot Formation, Structure, and Optical Properties. ACS Omega 2019, 4, 21658–21665. [Google Scholar] [CrossRef] [Green Version]
  40. Zhang, Q.; Zhang, X.; Bao, L.; Wu, Y.; Jiang, L.; Zheng, Y.; Wang, Y.; Chen, Y. The Application of Green-Synthesis-Derived Carbon Quantum Dots to Bioimaging and the Analysis of Mercury(II). J. Anal. Method. Chem. 2019, 2019, e8183134. [Google Scholar] [CrossRef] [Green Version]
  41. Lotz, K.; Wütscher, A.; Düdder, H.; Berger, C.M.; Russo, C.; Mukherjee, K.; Schwaab, G.; Havenith, M.; Muhler, M. Tuning the Properties of Iron-Doped Porous Graphitic Carbon Synthesized by Hydrothermal Carbonization of Cellulose and Subsequent Pyrolysis. ACS Omega 2019, 4, 4448–4460. [Google Scholar] [CrossRef]
  42. Zhuang, X.; Liu, J.; Ma, L. Facile synthesis of hydrochar-supported catalysts from glucose and its catalytic activity towards the production of functional amines. Green Energy Environ. 2022, in press. [Google Scholar] [CrossRef]
  43. Yadav, T.P.; Yadav, R.M.; Singh, D.P. Mechanical Milling: A Top Down Approach for the Synthesis of Nanomaterials and Nanocomposites. Nanosci. Nanotechnol. 2012, 2, 22–48. [Google Scholar] [CrossRef] [Green Version]
  44. Chen, C.; Liang, W.; Fan, F.; Wang, C. The Effect of Temperature on the Properties of Hydrochars Obtained by Hydrothermal Carbonization of Waste Camellia oleifera Shells. ACS Omega 2021, 6, 16546–16552. [Google Scholar] [CrossRef] [PubMed]
  45. Hydrothermal Carbonization: Upgrading Waste Biomass to Char. Available online: https://ohioline.osu.edu/factsheet/fabe-6622 (accessed on 20 July 2022).
  46. Reza, M.T.; Uddin, M.H.; Lynam, J.G.; Hoekman, S.K.; Coronella, C.J. Hydrothermal Carbonization of Loblolly Pine: Reaction Chemistry and Water Balance. Biomass Convers. Biorefin. 2014, 4, 311–321. Available online: https://link.springer.com/article/10.1007/s13399-014-0115-9 (accessed on 15 August 2022). [CrossRef]
  47. Lynam, J.G.; Reza, M.T.; Yan, W.; Vásquez, V.R.; Coronella, C.J. Hydrothermal carbonization of various lignocellulosic biomass. Biomass Convers. Biorefin. 2015, 5, 173–181. [Google Scholar] [CrossRef]
  48. Reza, M.T.; Mumme, J.; Ebert, A. Characterization of Hydrochar Obtained from Hydrothermal Carbonization of Wheat Straw Digestate. Biomass Convers. Biorefin. 2015, 5, 425–435. Available online: https://link.springer.com/article/10.1007/s13399-015-0163-9 (accessed on 15 August 2022). [CrossRef]
  49. Saha, N.; McGaughy, K.; Reza, M.T. Elucidating hydrochar morphology and oxygen functionality change with hydrothermal treatment temperature ranging from subcritical to supercritical conditions. J. Anal. Appl. Pyrolysis 2020, 152, 104965. [Google Scholar] [CrossRef]
  50. Saha, N.; Saba, A.; Reza, M.T. Effect of hydrothermal carbonization temperature on pH, dissociation constants, and acidic functional groups on hydrochar from cellulose and wood. J. Anal. Appl. Pyrolysis 2019, 137, 138–145. [Google Scholar] [CrossRef]
  51. Saba, A.; Lopez, B.; Lynam, J.G.; Reza, M.T. Hydrothermal Liquefaction of Loblolly Pine: Effects of Various Wastes on Produced Biocrude. ACS Omega 2018, 3, 3051–3059. Available online: https://pubs.acs.org/doi/full/10.1021/acsomega.8b00045 (accessed on 15 August 2022). [CrossRef] [Green Version]
  52. Reza, M.T.; Yan, W.; Uddin, M.H.; Lynam, J.G.; Hoekman, S.K.; Coronella, C.J.; Vásquez, V.R. Reaction kinetics of hydrothermal carbonization of loblolly pine. Bioresour. Technol. 2013, 139, 161–169. [Google Scholar] [CrossRef]
  53. Saha, N.; Xin, D.; Chiu, P.C.; Reza, M.T. Effect of Pyrolysis Temperature on Acidic Oxygen-Containing Functional Groups and Electron Storage Capacities of Pyrolyzed Hydrochars. ACS Sustain. Chem. Eng. 2019, 7, 8387–8396. Available online: https://pubs.acs.org/doi/full/10.1021/acssuschemeng.9b00024?casa_token=0MhhO7FPfe4AAAAA%3AqjaV2lmqVndJlImrPU2xQ-8l-XUELrHaE8eHeyixUamFu_ylXiAE_a5baKhObAamYExcbkkbxMRQ5Aa4 (accessed on 15 August 2022). [CrossRef]
  54. Saha, N.; Reza, M.T. Effect of Pyrolysis on Basic Functional Groups of Hydrochars. Biomass Convers. Biorefin. 2021, 11, 1117–1124. Available online: https://link.springer.com/article/10.1007/s13399-019-00504-3 (accessed on 15 August 2022). [CrossRef]
  55. Abdolrezaei, F.; Sabet, M. In Situ Green Synthesis of Highly Fluorescent Fe2O3@CQD/Graphene Oxide Using Hard Pistachio Shells via the Hydrothermal-assisted Ball Milling Method. Luminescence 2020, 35, 684–693. Available online: https://analyticalsciencejournals.onlinelibrary.wiley.com/doi/10.1002/bio.3773 (accessed on 21 July 2022). [CrossRef] [PubMed]
  56. Chahal, S.; Yousefi, N.; Tufenkji, N. Green Synthesis of High Quantum Yield Carbon Dots from Phenylalanine and Citric Acid: Role of Stoichiometry and Nitrogen Doping. ACS Sustain. Chem. Eng. 2020, 8, 5566–5575. [Google Scholar] [CrossRef]
  57. Sultana, A.I.; Reza, M.T. Investigation of hydrothermal carbonization and chemical activation process conditions on hydrogen storage in loblolly pine-derived superactivated hydrochars. Int. J. Hydrogen Energy 2022, 47, 26422–26434. [Google Scholar] [CrossRef]
  58. Yang, H.; Yan, R.; Chen, H.; Lee, D.H.; Zheng, C. Characteristics of hemicellulose, cellulose and lignin pyrolysis. Fuel 2007, 86, 1781–1788. [Google Scholar] [CrossRef]
  59. Brand, S.; Susanti, R.F.; Kim, S.K.; Lee, H.; Kim, J.; Sang, B.-I. Supercritical ethanol as an enhanced medium for lignocellulosic biomass liquefaction: Influence of physical process parameters. Energy 2013, 59, 173–182. [Google Scholar] [CrossRef]
  60. Firouzabadi, H.; Amani, N.I.K. Tungstophosphoric acid catalyzed oxidation of aromatic amines to nitro compounds with sodium perborate in micellar media. Green Chem. 2001, 3, 131–132. [Google Scholar] [CrossRef]
  61. Reza, M.T.; Uddin, M.H.; Lynam, J.G.; Coronella, C.J. Engineered pellets from dry torrefied and HTC biochar blends. Biomass Bioenergy 2014, 63, 229–238. [Google Scholar] [CrossRef]
  62. Ai, L.; Yang, Y.; Wang, B.; Chang, J.; Tang, Z.; Yang, B.; Lu, S. Insights into photoluminescence mechanisms of carbon dots: Advances and perspectives. Sci. Bull. 2021, 66, 839–856. [Google Scholar] [CrossRef]
  63. Kim, S.; Hwang, S.W.; Kim, M.; Shin, D.Y.; Shin, D.H.; Kim, C.O.; Yang, S.B.; Park, J.H.; Hwang, E.; Choi, S.-H.; et al. Anomalous Behaviors of Visible Luminescence from Graphene Quantum Dots: Interplay between Size and Shape. ACS Nano 2012, 6, 8203–8208. [Google Scholar] [CrossRef]
  64. Tepliakov, N.V.; Kundelev, E.V.; Khavlyuk, P.D.; Xiong, Y.; Leonov, M.Y.; Zhu, W.; Baranov, A.V.; Fedorov, A.V.; Rogach, A.L.; Rukhlenko, I.D. sp2–sp3-Hybridized Atomic Domains Determine Optical Features of Carbon Dots. ACS Nano 2019, 13, 10737–10744. [Google Scholar] [CrossRef] [PubMed]
  65. Liu, S.; Tian, J.; Wang, L.; Zhang, Y.; Qin, X.; Luo, Y.; Asiri, A.M.; Al-Youbi, A.O.; Sun, X. Hydrothermal Treatment of Grass: A Low-Cost, Green Route to Nitrogen-Doped, Carbon-Rich, Photoluminescent Polymer Nanodots as an Effective Fluorescent Sensing Platform for Label-Free Detection of Cu(II) Ions. Adv. Mater. 2012, 24, 2037–2041. [Google Scholar] [CrossRef] [PubMed]
  66. Sugar—FTIR—Spectrum—SpectraBase. Available online: https://spectrabase.com/spectrum/K0bGhEfFB0z (accessed on 14 August 2022).
  67. Zhang, Y.; Liu, X.; Fan, Y.; Guo, X.; Zhou, L.; Lva, Y.; Lin, J. One-step microwave synthesis of N-doped hydroxyl-functionalized carbon dots with ultra-high fluorescence quantum yields. Nanoscale 2016, 8, 15281–15287. [Google Scholar] [CrossRef] [PubMed]
  68. Li, H.; He, X.; Kang, Z.; Huang, H.; Liu, Y.; Liu, J.; Lian, S.; Tsang, C.H.A.; Yang, X.; Lee, S.-T. Water-Soluble Fluorescent Carbon Quantum Dots and Photocatalyst Design. Angew. Chem. Int. Ed. 2010, 49, 4430–4434. [Google Scholar] [CrossRef] [PubMed]
  69. Ding, H.; Wei, J.-S.; Zhang, P.; Zhou, Z.-Y.; Gao, Q.-Y.; Xiong, H.-M. Solvent-Controlled Synthesis of Highly Luminescent Carbon Dots with a Wide Color Gamut and Narrowed Emission Peak Widths. Small 2018, 14, 1800612. [Google Scholar] [CrossRef] [PubMed]
  70. Krysmann, M.J.; Kelarakis, A.; Dallas, P.; Giannelis, E.P. Formation Mechanism of Carbogenic Nanoparticles with Dual Photoluminescence Emission. J. Am. Chem. Soc. 2012, 134, 747–750. Available online: https://scholar.google.com/scholar_lookup?title=Formation%20mechanism%20of%20carbogenic%20nanoparticles%20with%20dual%20photoluminescence%20emission&publication_year=2012&author=M.J.%20Krysmann&author=A.%20Kelarakis&author=P.%20Dallas (accessed on 21 July 2022). [CrossRef] [PubMed]
  71. Tao, S.; Feng, T.; Zheng, C.; Zhu, S.; Yang, B. Carbonized Polymer Dots: A Brand New Perspective to Recognize Luminescent Carbon-Based Nanomaterials. J. Phys. Chem. Lett. 2019, 10, 5182–5188. [Google Scholar] [CrossRef]
Figure 1. Mass yields calculated for bottom-up and top-down CD synthesis methods at different temperature. Mass yield is considered the mass percent of CD produced and is calculated based on dry mass in vs. dry mass out, assuming that all mass loss is CD material. (a) Mass yield for bottom-up process per temperature and time conditions of given trial. (b) Mass yield for top-down process per temperature and time conditions of given trial. Please note that the temperature is reported as °C.
Biomass 02 00017 g001
Figure 2. Images of CDs obtained from tunneling electron microscopy from this study. Images show variance in particle and size distributions (at 180 °C and 3 h). (a) bottom-up; (b) top-down.
Biomass 02 00017 g002
Figure 3. Size distributions per HTC condition for bottom-up and top-down CD synthesis. Grey bars indicate distribution, blue markers indicate average sizing. All sizes s reported in nm. (a) Size distribution at 3.0 h and varying temperatures for bottom-up synthesis. (b) Size distribution at 3.0 h and varying temperatures for top-down synthesis. (c) Size distribution at 180 °C and residence times for bottom-up synthesis. (d) Size distribution at 180 °C and residence times for top-down synthesis.
Biomass 02 00017 g003
Figure 4. FTIR results for CDs generated at 180 °C and all residence times in top-down synthesis. Samples were freeze-dried and tested as solids.
Biomass 02 00017 g004
Figure 5. FTIR results for CDs generated at different temperature and residence times in bottom-up synthesis. Samples were freeze-dried, dispersed in toluene, then tested as liquids.
Biomass 02 00017 g005
Table 1. Calculated quantum yields for both synthesis methods and varying HTC conditions. QY was calculated with quinine sulfate as a standard diluted to 260 nm UV-VIS measured wavelength to match CD wavelength.
Temperature °CTime (h)QYBU (%)QYTD (%)
1800.57.919.3
1.01.217.1
1.52.716.9
2.016.922.6
2.51.14.4
3.02.72.4
2200.52.420.5
0.14.018.1
1.54.219.2
2.02.625.8
2.50.427.4
3.01.611.2
2600.518.125.8
1.016.134.1
1.516.527.2
2.07.848.5
2.55.926.6
3.08.535.9
Publisher’s Note: MDPI stays neutral with regard to jurisdictional claims in published maps and institutional affiliations.

