Article

The Utilization of Body Composition to Predict Cardiorespiratory Fitness and Determine Association with CKD Stage in Individuals with Mid-Spectrum CKD: A Pilot Study

by
Jeffrey S. Forsse
1,*,
Kathleen A. Richardson
1,
Tomas J. Chapman-Lopez
1,
Ricardo Torres
1,
Jeffery L. Heileson
2,
Ahmed Ismaeel
3,4,
LesLee Funderburk
5,
Andrew R. Gallucci
1,
Dale C. Allison
6 and
Panagiotis Koutakis
3
1
Integrated Laboratory of Exercise, Nutrition, and Renal Vascular Research, Department of Health Human Performance and Recreation, Baylor University, Waco, TX 76706, USA
2
Walter Reed Army Medical Center, Bethesda, MD 20814, USA
3
Clinical Muscle Biology Lab, Biology Department, Baylor University, Waco, TX 76798, USA
4
Department of Physiology, University of Kentucky, Lexington, KY 40536, USA
5
Human Sciences and Design, Baylor University, Waco, TX 76798, USA
6
Baylor Scott & White Health, Waco, TX 76712, USA
*
Author to whom correspondence should be addressed.
Kidney Dial. 2023, 3(3), 265-273; https://doi.org/10.3390/kidneydial3030024
Submission received: 4 May 2023 / Revised: 6 June 2023 / Accepted: 28 June 2023 / Published: 3 August 2023

Abstract

:
Body composition (BC), a measure of body fat mass (FM), lean body mass (LBM), and bone mineral content (BMC), can be used as a predictor of cardiorespiratory fitness (CRF). Prior studies have established a relationship between BC and VO2max in healthy individuals over 35 years of age. However, this relationship is poorly understood in chronic disease populations. The focus of the study was to assess the relationship between BC, cardiorespiratory fitness, and chronic kidney disease (CKD). A cross-sectional analysis was conducted among 24 (9 males and 15 females) individuals diagnosed with mid-spectrum CKD (stages G2–G3b) who completed a health screening, dual-energy X-ray absorptiometry (DEXA) scan, and underwent a VO2max exercise test. Normality tests, descriptive statistics, Pearson’s correlations, t-tests, and ANOVAs were conducted in SAS v.9.4. The average percent body fat (%BF) was 36.28 ± 8.47%, LBM was 109.4 ± 29.1 lb, BMC was 2308.7 ± 735.1 g, and VO2max was 20.13 ± 5.04 mL/kg/min−1. BC was able to predict CRF via VO2max (R2 = 0.721, p < 0.001) and CKD stage (R2 = 0.390, p < 0.017). Positive correlations were observed in LBM (r = 0.750, p < 0.0018) and BMC (r = 0.647, p < 0.001), and negative correlations were observed with FM (r = −0.384, p < 0.032) and %BF (r = −0.802, p < 0.0001). BC was able to predict both CRF and CKD stages, with significant associations observed between BC, VO2max, and CKD stage. The progression of the CKD stage was associated with lower LBM, BMC, and VO2max values, indicating a graded effect of BC on CRF and CKD stage.

1. Introduction

Chronic kidney disease (CKD) is the gradual loss of renal function over time and impacts a significant number (10–16%) of individuals globally [1]. The primary causes of CKD are not fully understood by clinicians and researchers [2]. However, progressive inflammation and damage to the vasculature of the renal capillaries are highly attributed to the development and severity of the disease [3,4]. Hypertension and diabetes have been identified as primary and secondary risk factors for the development of CKD, with body composition (BC) being implicated as a highly probable developmental cause [5,6]. Individuals diagnosed with mid-spectrum (G2-G3b) CKD are recognized as being at a pivotal state in the disease progression, and it is considered a major focus of the intervention phase for potential health improvements [7].
A healthy BC is essential for normal physiological function and overall health [8]. The specific assessment of BC is beneficial in determining cardiometabolic risk factors and preventing chronic disease development [9]. Imbalances in BC regarding percent body fat (%BF), lean body mass (LBM), and bone mineral content (BMC) are directly linked with the prevalence of hypertension and diabetes development, which increases the relation to CKD development in at-risk populations [10,11,12,13]. The diagnosis of obesity accounts for a threefold increase in the risk of cardiovascular disease (CVD) mortality in obese individuals compared to healthy-weight individuals [5,6]. A critical imbalance between LBM, BMC, and FM negatively affects physical function and capabilities [14,15,16]. BC has also been examined (e.g., BMI, DEXA, bioelectrical impedance) across multiple stages of CKD to assist in determining all-cause mortality, cardiovascular events, and dialysis likelihood [17,18,19].
Cardiorespiratory fitness (CRF) is a standard metric that is consistently and accurately used to identify and treat at-risk individuals for cardiometabolic diseases [20]. CRF is diminished in diseased populations compared to healthy, age-gender-matched populations and is directly influenced by BC [20,21,22]. Individuals clinically diagnosed with CKD have significantly reduced CRF capabilities and are at an increased risk of all-cause mortality [21,22,23]. The assessment of total BC (e.g., %BF, LBM, BMC, and visceral adipose tissue (VAT)) has recently been reported as a potentially superior method for determining CRF [9]. However, the emphasis of prior research studies is specific to healthier populations (e.g., young athletic males and females, middle-aged males and females, older females) and does not account for clinical populations (e.g., CKD, CVD, cardiometabolic disease) [24,25]. Therefore, the primary aim of this study was to ascertain if BC can be used to predict CRF and CKD stages in mid-spectrum CKD (e.g., stages G2–G3b). The secondary aim was to determine associations between BC, CFR, and CKD stages.

2. Materials and Methods

2.1. Study Overview

The University Institutional Review Board (IRB) authorized the conducting of human subject research. To safeguard all participants, ethical adherence to the 1975 Declaration of Helsinki was employed by all research personnel in accordance with the institution’s IRB. All individuals eligible to participate in the study were provided with both verbal and written informed consent documents by research personnel regarding the specifications of the study, and the participants were instructed to ask questions if they had any. All participants signed and returned the informed consent document to research personnel and underwent an extensive health history and exercise questionnaire prior to being admitted into the study.

2.2. Research Subjects

Twenty-four individuals were enrolled in the study (n = 9 men; n = 15 women). Individuals were included in the study if they met the following inclusion criteria: (1) 40 to 75 years old, (2) previously diagnosed with CKD stages G2, G3a, and G3b (estimated glomerular filtration rate (GFR), 30–89 mL/min/1.73 m2) using the Modification of Diet in Renal Disease (MDRD) [7,26,27], (3) involved in weekly exercise or physical activity set forth by the American Heart Association and the American College of Sports Medicine, (4) non-smoker for > 6 months, and (5) able to maintain stable medication use throughout participation. Exclusion criteria for the study included: (1) CKD stage G1, 4 or 5, (2) BMI > 35, (3) uncontrolled hypertension, cardiovascular disease, or pulmonary disease, and (4) previously diagnosed with Immunoglobin A (IgA) nephropathy, post-infectious glomerulonephritis, HIV nephropathy, focal stenosis, renal artery stenosis, and lupus nephritis. Our patient-population recruitment goal was to enroll individuals whose CKD diagnosis evolved primarily due to hypertension and diabetes as the primary and secondary diagnoses. Participants were recruited from the local medical center and health clinics. The research subjects’ physiological demographics are provided in Table 1.

2.3. Body Composition Assessment

Baseline parametric measurements (e.g., height, weight) were recorded via electronic scale and stadiometer (Seca 703); participants removed their shoes and non-clothing items prior to stepping on the scale. Preceding the body composition assessment, participants were told to void their bladder and remove all forms of metal which would influence BMC via material density. The total body composition was measured (e.g., lean, fat, bone tissue) via dual-energy X-ray absorptiometry (DXA, Discovery DXA™, Hologic®, Bedford, MA, USA). Participants were placed on the DEXA according to the National Health and Nutrition Examination Survey (NHANES) recommendations: body supine, head straight, a small amount of space between the arms and torso, hands fixed on the table, and feet together [28,29]. To establish body regions, the regions of interests’ analysis lines were placed as portrayed in the NHANES Body Composition Procedures Manual. Specifically, horizontal lines were placed lower than the skull and at the height of the iliac crest; vertical lines were established and aligned adjacent to the vertebral column and between the legs; diagonal lines were used for both glenohumeral joints and femoral necks [29]. To encourage and maintain the reliability of raw data analyses, one researcher analyzed all DEXA scans for the entire study by utilizing the Hologic APEX software (version 4.6, Discovery DXA™, Hologic®, Bedford, MA, USA).

2.4. Health Screening and Exercise Testing

Participants reported to the lab after an 8 to 10 h fast limited to water ingestion only. Participants were asked to wear standard workout attire. A research study physician reviewed the health history, physician release form, medication guidance, and prior blood records with each participant. After the physician screening, a small venous blood sample was obtained and sent to a Center for Disease Control-certified clinical laboratory to confirm prior lab work and verify the medical classification of CKD.
Each participant performed a standardized maximal graded exercise test (Modified Bruce) on a treadmill (TrackMaster, Newton, KS, USA) to determine cardiovascular fitness and normal hemodynamic responses to increasing exercise intensities. Heart rate, blood pressure, ECG, and rating of perceived exertion (RPE) were monitored throughout the test. In addition, respiratory gases (e.g., VO2, VCO2) were measured continuously using an integrated respiratory gas analysis system (ParvoMedics, Sandy, UT, USA). The exercise test began with 5 min of warm-up at a walking pace that was comfortable for the participant. Then, the speed and incline of the treadmill were increased every 3 min until the participant reached volitional fatigue. The test was terminated at the participant’s request, observed signs or symptoms that warrant test termination, 85% of age-predicted maximal HR, or attainment of a respiratory exchange ratio (RER) of 1.15 or greater.

2.5. Statistical Analysis

Normality was assessed via measures of skewness and kurtosis, visual inspection of the histograms and P-P plots, and the independence of residuals was determined by the Durbin–Watson statistic. Means and standard deviations were determined for all normally distributed clinical and body-composition measurements. Non-parametric data are represented as a median and interquartile range (IQR). ANOVAs were conducted to determine differences between BC based on CKD stages. Associations between BC variables (e.g., LBM, FM, BMC, VAT) and VO2max were reported as Pearson correlation coefficients (r) or a Spearman’s rank correlation coefficient (ρ). Multiple linear regression analysis was used to test the relationship between VO2max and BC (e.g., LBM, FM, and BMC). VO2max outcomes were grouped to determine the stage of CKD. Data were analyzed with SAS version 9.4 (SAS Institute Inc., Cary, NC, USA). The significance level was placed at a priori of p < 0.05 with a power of 0.80 for a total of 26 participants with an effect size of 0.50.

3. Results

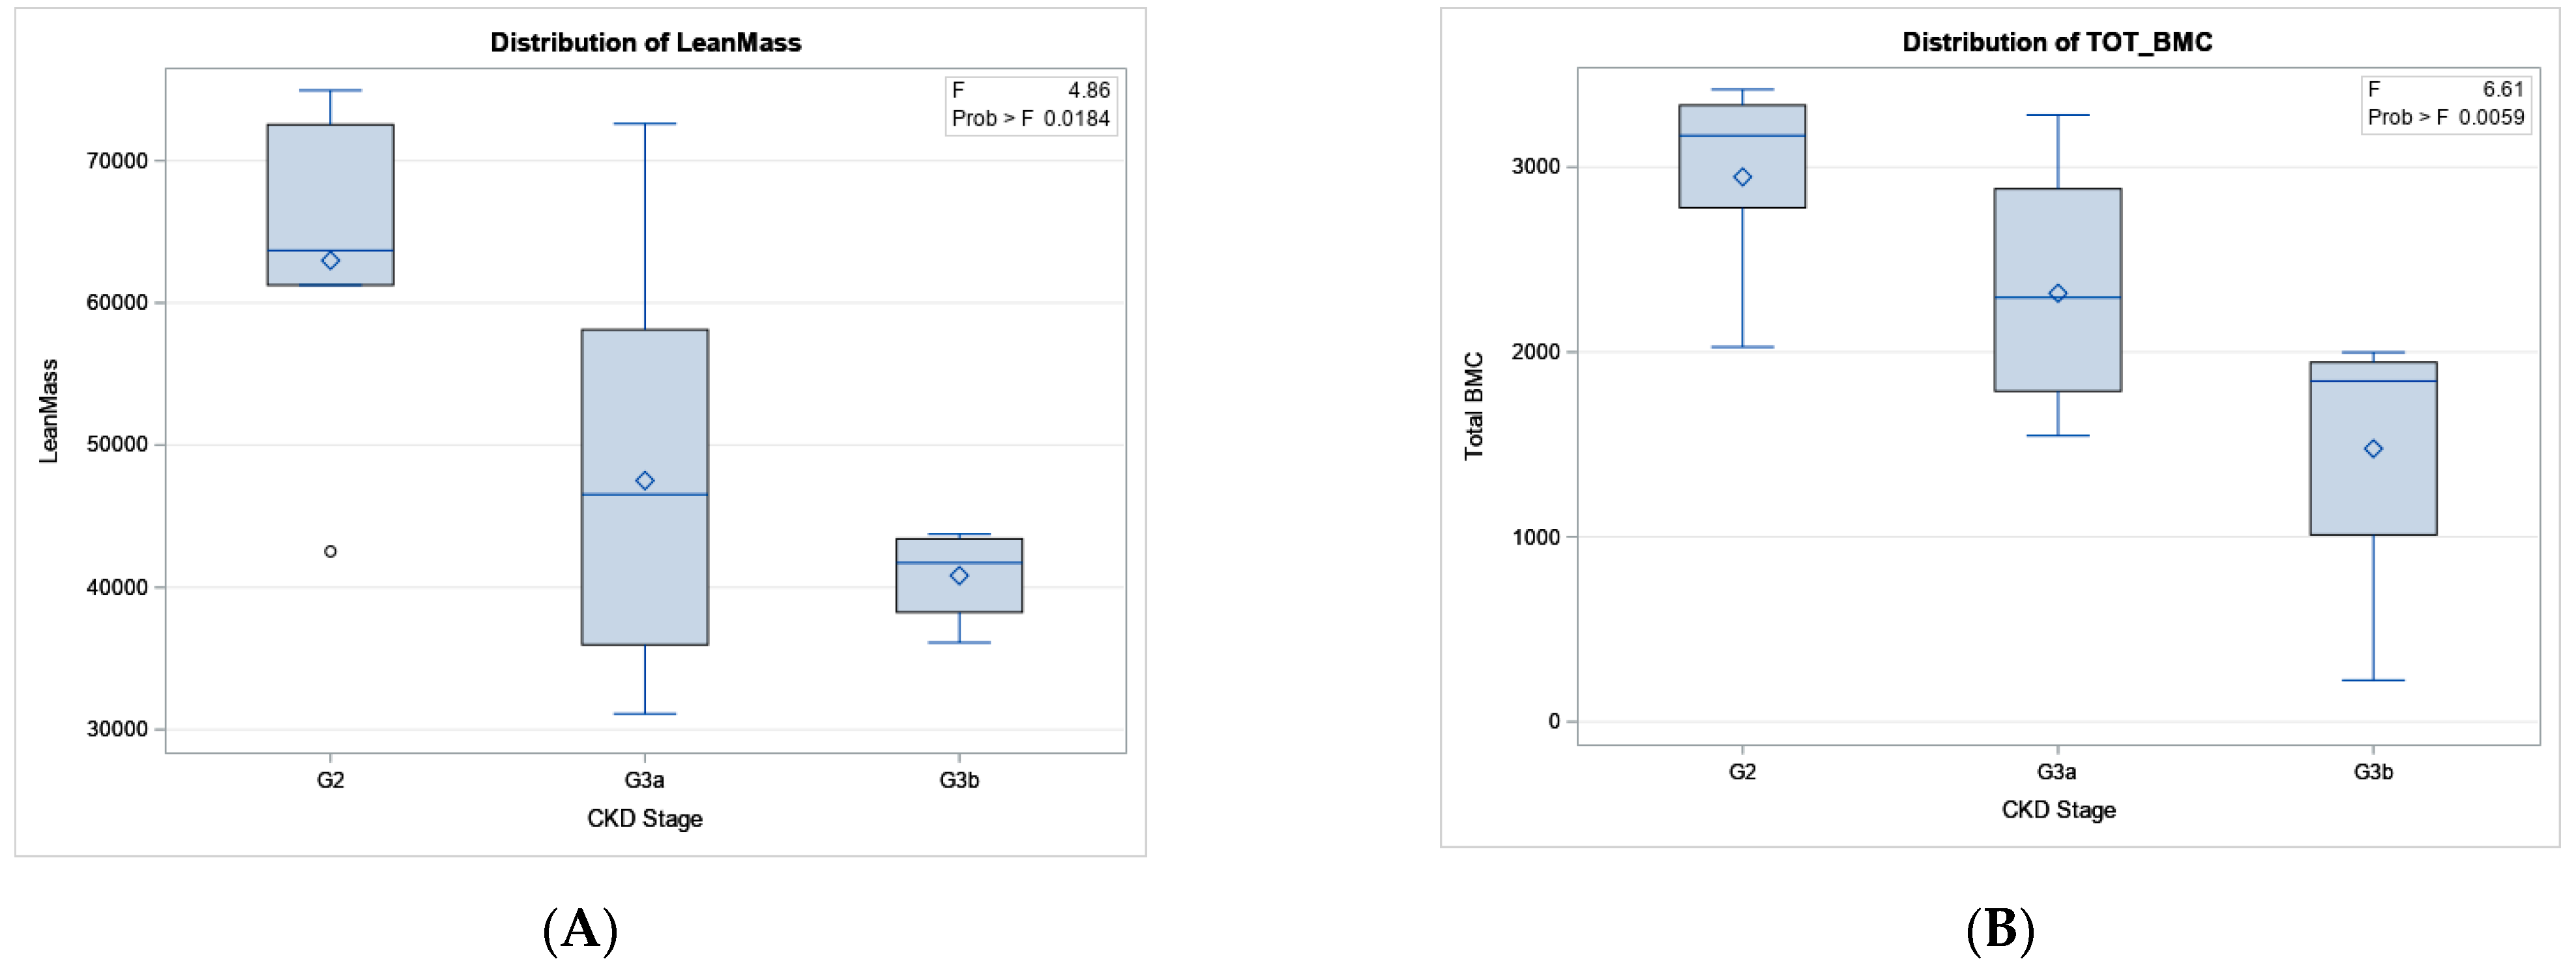
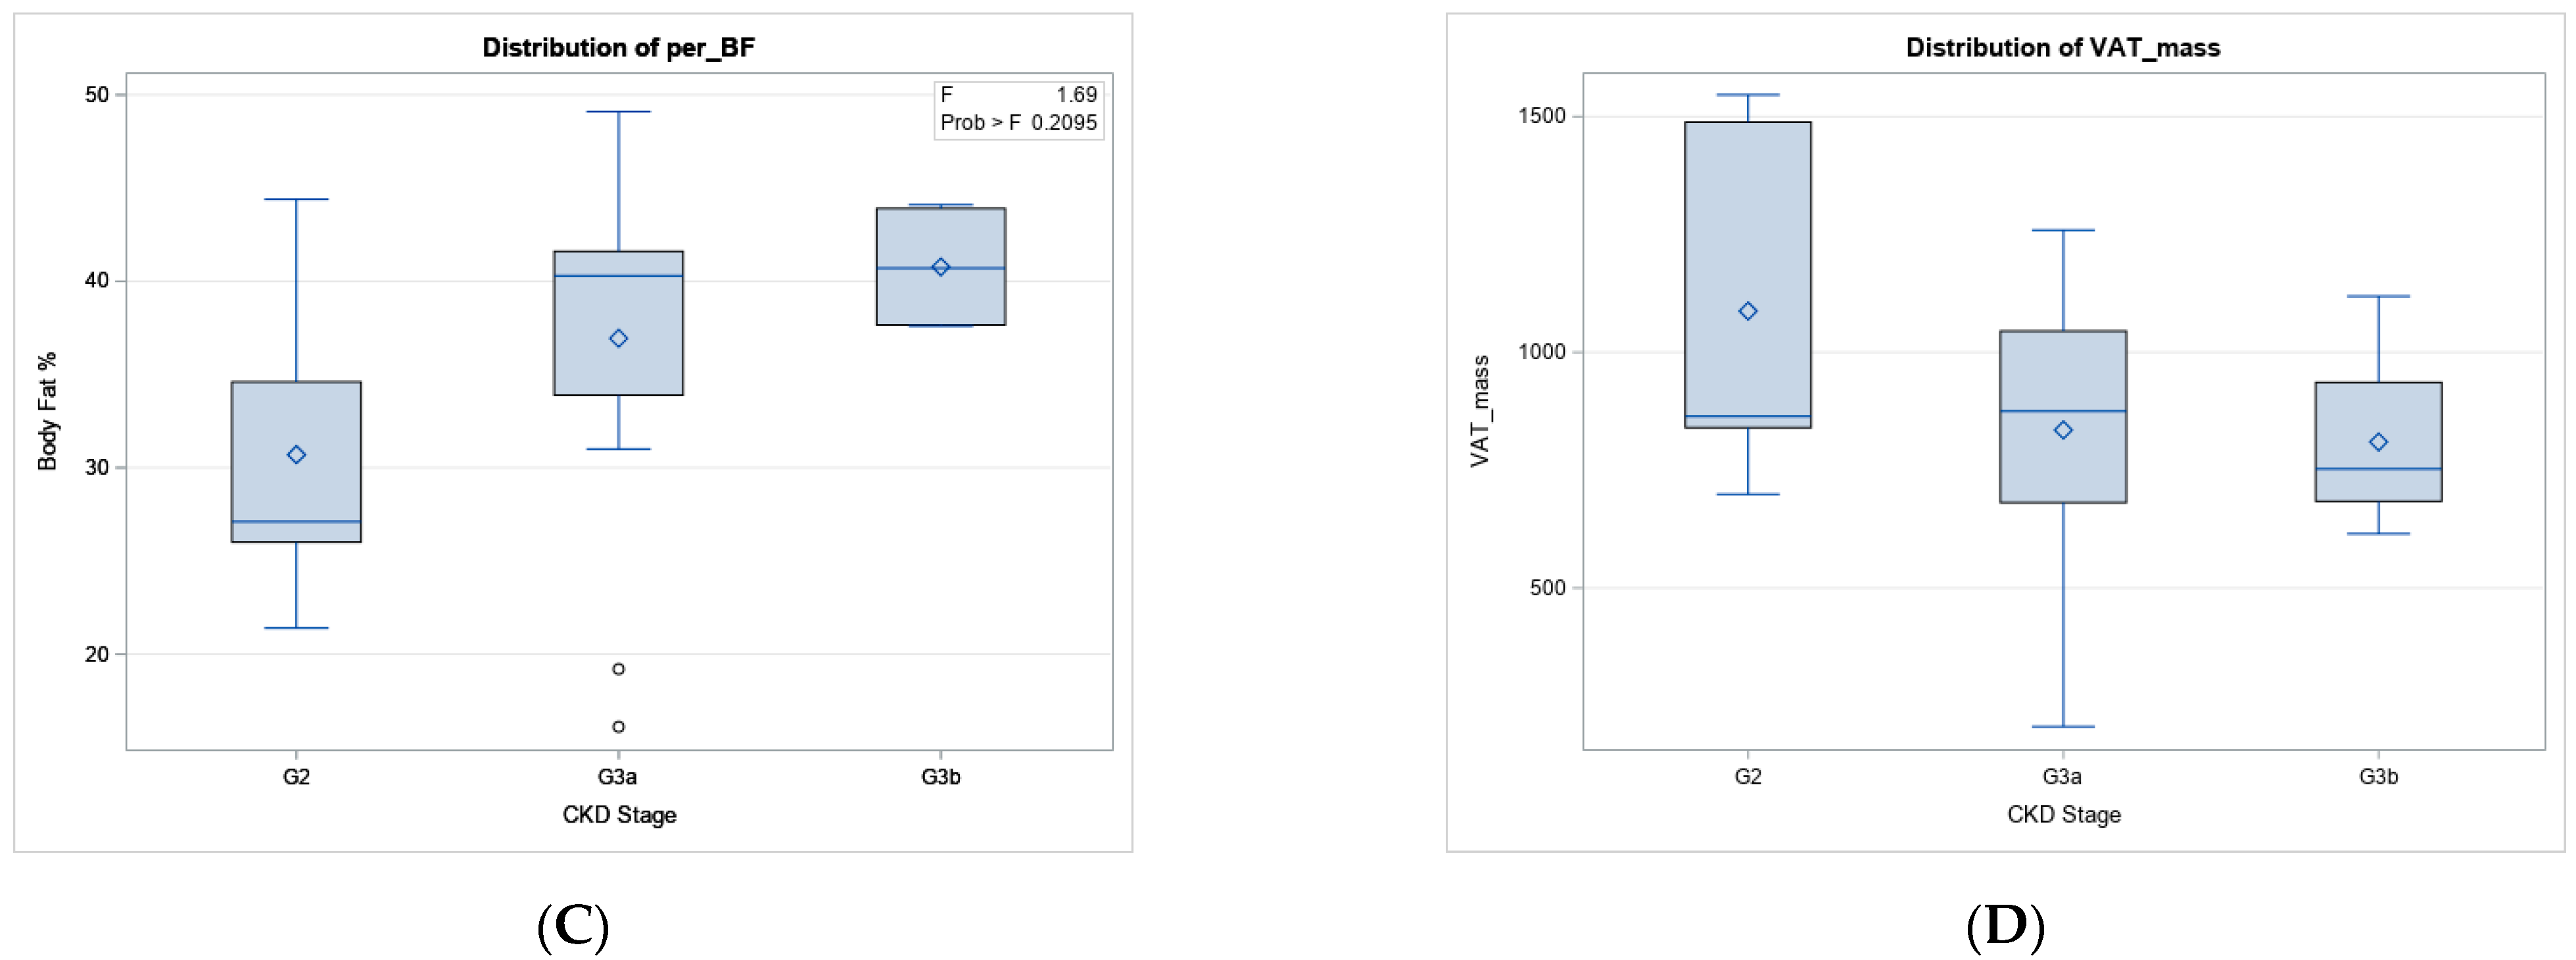
3.1. Differences in Body Composition and CKD Stage

Table 1 shows the physical characteristics of the research participants. The total body BMD varied by stage, with later stages of CKD having lower BMD (p < 0.05) (See Figure 1). BMC decreased (p < 0.006) with the progression of CKD. LBM decreased (p < 0.0184) as the CKD stage progressed. %BF was not significantly altered based on the CKD stage (p < 0.21). Individuals in later stages of CKD were more likely to be older, but this value was not statistically significant (p < 0.11).

3.2. Exploratory Linear Regression Model

For the entire group (n = 24), BC (LBM, BMC, and FM) accounted for a significant amount of variance in VO2max (R2 = 0.721, p < 0.001). LBM and FM had statistically significant relationships with VO2max (p = 0.0018 and p = 0.004, respectively), while BMC (p = 0.565) was not significantly associated with VO2max (See Table 2). BC (LBM, BMC, and FM) also accounted for a significant amount of the variance in CKD stage (R2 = 0.390, p < 0.017).

3.3. Correlations between Body Composition Variables, VO2max, and CKD Stage

Based on univariate analysis, three of the four predictor variables, LBM (r = 0.750, p = 0.0018), BMC (r = 0.647, p < 0.001), FM (r = −0.384, p = 0.0639), and %BF (r = −0.802, p = 0.0001) were significantly correlated with VO2max. However, VAT was not significantly correlated with VO2max (r = −0.013, p < 0.476). Based on initial correlations, additional correlations were performed on total bone mineral density (BMD) variables (e.g., right arm, left arm, left ribcage, right ribcage, left leg, right leg), and all were significantly correlated with VO2max (See Table 3).
Correlations between BC and CKD stage resulted in significant outcomes with LBM (r = −0.538, p < 0.003), BMC (r = −0.617, p < 0.001), and %BF (r = 0.366, p < 0.039) being correlated with the CKD stage. FM (r = −0.028, p < 0.448) and VAT (r = −0.302, p < 0.076) were not correlated to the CKD stage. Additionally, the CKD stage was significantly (r = −0.608, p < 0.002) correlated with VO2max.

4. Discussion

In the current study, BC significantly predicted CRF via VO2max and CKD stage, while LBM and FM independently predicted VO2max in individuals with mid-spectrum CKD. Significant associations were observed between VO2max and LBM, BMC, and %BF. The CKD stage was correlated with LBM, BMC, and %BF, along with VO2max. Additionally, significant differences were observed between BMD and LBM in CKD stages, with lower stages of CKD resulting in lower BMD and LBM when compared to higher stages.
The assessment of CRF provides an overall direction in calculating health outcomes, such as CKD and cardiometabolic disease, in clinical populations. Frequently there are situations that preclude actual determinates of CRF via VO2max in CKD for various reasons (e.g., physical disability, cost, availability). Hence, our study demonstrates that VO2max outcomes can be predicted (R2 = 0.721, p < 0.001) based solely on BC measurements (e.g., LBM, FM, BMC), both collectively and independently (e.g., LBM, FM), indicating the practicality of BC metrics in tracking the decline of CRF and thus potentially allowing for a better proficiency in the methods used to determine the risk of all-cause-mortality, progression to dialysis, and prevalence of cardiovascular events in CKD individuals. Consequently, our study observed significant differences in LBM and BMD based on the CKD stage. Higher BMD and LBM were observed in stage G2 when compared to stages G3a and G3b, with declining values observed in each lower stage. One can infer from this that as LBM and BMC decrease, CRF decreases. These outcomes in BC and CRF are similar to previously reported studies that demonstrate a direct correlation or effect when examining the association that a lower LBM, BMC, and higher FM have to CRF levels [9]. The results of our study are further supported based on significant correlations between LBM, BMC, FM, and %BF and CRF. Both LBM and BMC were positively correlated with CRF, indicating that as LBM and BMC increased, CRF increased, whereas FM and %BF were negatively correlated with CRF. This result implies that decreases in FM and %BF result in higher CRF levels (See Figure 1A–D).
The decline of renal health and filtration adversely decreases the overall quality and longevity of healthy physiological outcomes in individuals diagnosed with CKD [17]. Our study provides an additive metric for assessing the rate of renal decline in individuals diagnosed with mid-spectrum CKD via BC assessment. Collectively, BC was able to accurately predict the CKD stage (R2 = 0.390, p < 0.017). However, when BC variables were used separately, there were no individual predictors of the CKD stage. A prior study conducted by Kittiskulnam et al. [30] found that LBM was lower and %BF was higher with each stage of CKD progression. The study also found that a 10 mL/min/1.73 m2 decline in eGFR was associated with a 0.59 kg reduction of LBM. Though the results of our study were similar to those of Kittiskulnam et al. [30], there was a difference in the BC assessment methodology. We utilized DEXA, whereas the previous study used multi-frequency bioelectrical impedance analysis. Additionally, other studies utilized bioelectrical impedance and observed similar findings with BC and CKD stages, consistent with the literature [17,31,32]. Thus, our study results reinforce the benefit of incorporating multiple physiological factors to track and attenuate renal outcomes in various clinical populations. In addition, VO2max was able to predict the CKD stage independently (R2 = 0.369, p < 0.002). This finding further strengthens the importance and value of obtaining the CRF status in CKD populations. Given the physiological influence that normal vs. abnormal BC has in healthy and clinical populations, it is in the best interest of researchers and clinicians to consider BC as a means of tracking CKD stage progression.
Bone health is a topic of vital concern in clinical and elderly populations [15,33,34]. The current literature has verified the significance of improving and maintaining BMC and BMD throughout the aging process via aerobic exercise and resistance training [35]. In our study, correlations in total BMD (e.g., right leg, left leg, left ribcage, right ribcage, left leg, right leg) and VO2max were assessed, in addition to LBM, FM, and BMC. All variables included in total BMD were positively correlated to VO2max (See Table 3). These significant associations further corroborate the importance of maintaining healthy BMC in individuals diagnosed with CKD, specifically in earlier stages [36,37]. Lower BMD is indicative of the severity of CKD due to a lower CRF that arises from a more sedentary lifestyle [38]. The results of previous studies support our findings showing that BMD is negatively impacted by CKD severity due to poor physical activity, exercise habits, and inconsistent nutritional intake [15,39]. Although nutritional intake is a factor observed in lower BMD, decreased exercise and physical activity levels significantly impact physiological health outcomes in clinical populations [40].
Limitations of the current study include (1) potential sex differences due to an unequal number of males and females, (2) participants presenting accurate health records and information to be admitted into the study, (3) trusting participants to be honest and to refrain from exercise and nutrition during the critical fasting period, and (4) the small sample size due to the nature of the study being an ongoing exploratory study.

5. Conclusions

In conclusion, BC was able to significantly predict VO2max and CKD stages in a cohort of mid-spectrum CKD individuals, both collectively and individually. These results are further supported by significant associations between BC, VO2max, and CKD stage. Therefore, this study emphasizes the importance of utilizing BC in the treatment (maintaining CRF) and prevention (reducing CKD stage progression) of renal decline in individuals with mid-spectrum CKD. However, further research is needed into therapeutic interventions targeting BC and CRF in the early stages of CKD.

Author Contributions

Conceptualization, J.S.F. and J.L.H.; methodology, J.S.F., J.L.H. and P.K.; software, J.S.F. and J.L.H.; validation, J.S.F., J.L.H., P.K., K.A.R. and A.I.; formal analysis, J.S.F. and J.L.H.; investigation, J.S.F., D.C.A.; J.L.H., P.K., K.A.R., R.T., L.F., A.R.G. and A.I.; resources, J.S.F., J.L.H., A.R.G., P.K. and L.F.; data curation, J.S.F., D.C.A.; K.A.R., R.T.; writing—original draft preparation, J.S.F. and J.L.H.; writing—review and editing, J.S.F., T.J.C.-L., J.L.H., P.K., K.A.R., R.T., L.F., A.R.G. and A.I.; supervision, J.S.F., T.J.C.-L., J.L.H., P.K., K.A.R., R.T., L.F., A.R.G. and A.I.; project administration, J.S.F. All authors have read and agreed to the published version of the manuscript.

Funding

This research received no external funding.

Institutional Review Board Statement

The University Institutional Review Board approved the research study with human subjects. To ensure the safety of all participants, the ethical guidelines of the 1975 Declaration of Helsinki were employed by all research personnel in accordance with the institution’s human research committee.

Informed Consent Statement

Informed consent was obtained from all subjects involved in the study.

Data Availability Statement

Not applicable.

Acknowledgments

Thank you to all the participants for their willingness to be involved in the research project.

Conflicts of Interest

The authors declare no conflict of interest.

References

  1. Murphy, D.; McCulloch, C.E.; Lin, F.; Banerjee, T.; Bragg-Gresham, J.L.; Eberhardt, M.S.; Morgenstern, H.; Pavkov, M.E.; Saran, R.; Powe, N.R.; et al. Trends in Prevalence of Chronic Kidney Disease in the United States. Ann. Intern. Med. 2016, 165, 473–481. [Google Scholar] [CrossRef] [Green Version]
  2. Baba, M.; Shimbo, T.; Horio, M.; Ando, M.; Yasuda, Y.; Komatsu, Y.; Masuda, K.; Matsuo, S.; Maruyama, S. Longitudinal Study of the Decline in Renal Function in Healthy Subjects. PLoS ONE 2015, 10, e0129036. [Google Scholar] [CrossRef] [PubMed] [Green Version]
  3. Saran, A.M.; DuBose, T.D. Cardiovascular disease in chronic kidney disease. Ther. Adv. Cardiovasc. Dis. 2008, 2, 425–434. [Google Scholar] [CrossRef]
  4. Anderson, T.J. Nitric Oxide, Atherosclerosis and the Clinical Relevance of Endothelial Dysfunction. Heart Fail. Rev. 2003, 8, 71–86. [Google Scholar] [CrossRef]
  5. Kim, S.; Leng, X.I.; Kritchevsky, S.B. Body Composition and Physical Function in Older Adults with Various Comorbidities. Innov. Aging 2017, 1, igx008. [Google Scholar] [CrossRef] [Green Version]
  6. Katzmarzyk, P.T.; Church, T.S.; Phd, I.J.; Phd, R.R.; Blair, S.N. Metabolic syndrome, obesity, and mortality: Impact of cardiorespiratory fitness. Diabetes Care 2005, 28, 391–397. [Google Scholar] [CrossRef] [Green Version]
  7. Dhillon, A.S.; Buckley, D.J.; Ismaeel, A.; Adair, K.; Lowry, C.; Torres, R.; Merrell, H.; Papoutsi, E.; Koutakis, P.; Forsse, J.S. In The Absence of Cardiometabolic Diseases Is Age an Independent Factor in Assessing Renal Health and Function? A Pilot Study: 305. Med. Sci. Sport. Exerc. 2021, 53, 95. [Google Scholar] [CrossRef]
  8. Cava, E.; Yeat, N.C.; Mittendorfer, B. Preserving Healthy Muscle during Weight Loss. Adv. Nutr. Int. Rev. J. 2017, 8, 511–519. [Google Scholar] [CrossRef] [Green Version]
  9. Heileson, J.L.; Papadakis, Z.; Ismaeel, A.; Richardson, K.A.; Torres, R.; Funderburk, L.; Gallucci, A.; Koutakis, P.; Forsse, J.S. The Benefits of Utilizing Total Body Composition as a Predictor of Cardiorespiratory Fitness Based on Age: A Pilot Study. Int. J. Environ. Res. Public Health 2022, 19, 5758. [Google Scholar] [CrossRef]
  10. Johansen, K.L.; Lee, C. Body composition in chronic kidney disease. Curr. Opin. Nephrol. Hypertens. 2015, 24, 268–275. [Google Scholar] [CrossRef] [PubMed] [Green Version]
  11. George, C.; Matsha, T.E.; Davidson, F.E.; Goedecke, J.H.; Erasmus, R.T.; Kengne, A.P. Chronic Kidney Disease Modifies the Relationship Between Body Fat Distribution and Blood Pressure: A Cross-Sectional Analysis. Int. J. Nephrol. Renov. Dis. 2020, 13, 107–118. [Google Scholar] [CrossRef]
  12. Formiga, F.; Moreno-González, R.; Corsonello, A.; Carlsson, A.; Ärnlöv, J.; Mattace-Raso, F.; Kostka, T.; Weingart, C.; Roller-Wirnsberger, R.; Tap, L.; et al. Diabetes, sarcopenia and chronic kidney disease; the Screening for CKD among Older People across Europe (SCOPE) study. BMC Geriatr. 2022, 22, 254. [Google Scholar] [CrossRef]
  13. Rigalleau, V.; Lasseur, C.; Chauveau, P.; Barthes, N.; Raffaitin, C.; Combe, C.; Perlemoine, C.; Baillet-Blanco, L.; Gin, H. Body Composition in Diabetic Subjects with Chronic Kidney Disease: Interest of Bio-Impedance Analysis, and Anthropometry. Ann. Nutr. Metab. 2004, 48, 409–413. [Google Scholar] [CrossRef]
  14. Shen, F.-C.; Chiu, Y.-W.; Kuo, M.-C.; Lin, M.-Y.; Lee, J.-J.; Hwang, S.-J.; Chang, J.-M.; Hung, C.-C.; Chen, H.-C. U-Shaped Association between Waist-to-Hip Ratio and All-Cause Mortality in Stage 3–5 Chronic Kidney Disease Patients with Body Mass Index Paradox. J. Pers. Med. 2021, 11, 1355. [Google Scholar] [CrossRef] [PubMed]
  15. Cohen-Solal, M.; Funck-Brentano, T.; Torres, P.U. Bone fragility in patients with chronic kidney disease. Endocr. Connect. 2020, 9, R93–R101. [Google Scholar] [CrossRef] [PubMed] [Green Version]
  16. Bakshi, A.; Singh, K.; Siddhu, A. Body Composition of Chronic Kidney Disease Patients: A Multi-Stage Analysis. J. Ren. Hepatic Disord. 2021, 5, 54–58. [Google Scholar] [CrossRef]
  17. Lin, T.-Y.; Peng, C.-H.; Hung, S.-C.; Tarng, D.-C. Body composition is associated with clinical outcomes in patients with non–dialysis-dependent chronic kidney disease. Kidney Int. 2018, 93, 733–740. [Google Scholar] [CrossRef] [PubMed]
  18. Mafra, D.; Guebre-Egziabher, F.; Fouque, D. Body mass index, muscle and fat in chronic kidney disease: Questions about survival. Nephrol. Dial. Transplant. 2008, 23, 2461–2466. [Google Scholar] [CrossRef] [Green Version]
  19. Jayanama, K.; Putadechakun, S.; Srisuwarn, P.; Vallibhakara, S.A.-O.; Chattranukulchai Shantavasinkul, P.; Sritara, C.; Kantachuvesiri, S.; Komindr, S. Evaluation of Body Composition in Hemodialysis Thai Patients: Comparison between Two Models of Bioelectrical Impedance Analyzer and Dual-Energy X-Ray Absorptiometry. J. Nutr. Metab. 2018, 2018, 4537623. [Google Scholar] [CrossRef] [Green Version]
  20. Maciejczyk, M.; Więcek, M.; Szymura, J.; Szyguła, Z.; Wiecha, S.; Cempla, J. The Influence of Increased Body Fat or Lean Body Mass on Aerobic Performance. PLoS ONE 2014, 9, e95797. [Google Scholar] [CrossRef]
  21. Forsse, J.S.; Papadakis, Z.; Peterson, M.N.; Taylor, J.K.; Hess, B.W.; Schwedock, N.; Allison, D.C.; Griggs, J.O.; Wilson, R.L.; Grandjean, P.W. The Influence of an Acute Bout of Aerobic Exercise on Vascular Endothelial Function in Moderate Stages of Chronic Kidney Disease. Life 2022, 12, 91. [Google Scholar] [CrossRef]
  22. Beddhu, S.; Baird, B.C.; Zitterkoph, J.; Neilson, J.; Greene, T. Physical Activity and Mortality in Chronic Kidney Disease (NHANES III). Clin. J. Am. Soc. Nephrol. 2009, 4, 1901–1906. [Google Scholar] [CrossRef] [Green Version]
  23. Forsse, J.S.; Peterson, M.N.; Papadakis, Z.; Taylor, J.K.; Hess, B.W.; Schwedock, N.; Allison, D.C.; Griggs, J.O.; Wilson, R.L.; Grandjean, P.W. The Effect of Acute Aerobic Exercise on Biomarkers of Renal Health and Filtration in Moderate-CKD. Res. Q. Exerc. Sport 2023, 1–9. [Google Scholar] [CrossRef] [PubMed]
  24. El Khoury, C.; Pinti, A.; Lespessailles, E.; Maalouf, G.; Watelain, E.; El Khoury, G.; Berro, A.-J.; Ayoub, M.-L.; Toumi, H.; El Hage, R. Physical Performance Variables and Bone Mineral Density in a Group of Young Overweight and Obese Men. J. Clin. Densitom. 2018, 21, 41–47. [Google Scholar] [CrossRef] [PubMed]
  25. Bates, D.W.; Black, D.M.; Cummings, S.R. Clinical Use of Bone Densitometry: Clinical Applications. JAMA 2002, 288, 1898. [Google Scholar] [CrossRef] [Green Version]
  26. Stevens, L.A.; Levey, A.S. Measured GFR as a Confirmatory Test for Estimated GFR. J. Am. Soc. Nephrol. 2009, 20, 2305–2313. [Google Scholar] [CrossRef] [PubMed] [Green Version]
  27. Forsse, J.S.; Buckley, D.; Ismaeel, A.; Richardson, K.A.; Oliver, A.; Koutakis, P. Effect of Age and Acute-Moderate Intensity Exercise on Biomarkers of Renal Health and Filtration. Biology 2022, 11, 527. [Google Scholar] [CrossRef] [PubMed]
  28. Tinsley, G.M.; Forsse, J.S.; Morales, E.; Grandjean, P.W. Dual-energy X-ray absorptiometry visceral adipose tissue estimates: Reproducibility and impact of pre-assessment diet. Eur. J. Clin. Nutr. 2017, 72, 609–612. [Google Scholar] [CrossRef] [PubMed]
  29. Kelly, T.L.; Wilson, K.E.; Heymsfield, S.B. Dual Energy X-ray Absorptiometry Body Composition Reference Values from NHANES. PLoS ONE 2009, 4, e7038. [Google Scholar] [CrossRef] [Green Version]
  30. Kittiskulnam, P.; Nitesnoppakul, M.; Metta, K.; Suteparuk, S.; Praditpornsilpa, K.; Eiam-Ong, S. Alterations of body composition patterns in pre-dialysis chronic kidney disease patients. Int. Urol. Nephrol. 2020, 53, 137–145. [Google Scholar] [CrossRef]
  31. Chen, Y.-Y.; Fang, W.-H.; Wang, C.-C.; Kao, T.-W.; Chang, Y.-W.; Yang, H.-F.; Wu, C.-J.; Sun, Y.-S.; Chen, W.-L. Changes of Percent Body Fat as a Useful Surrogate for Risk of Declined Renal Function. Sci. Rep. 2018, 8, 17289. [Google Scholar] [CrossRef] [PubMed] [Green Version]
  32. Wang, K.; Zelnick, L.R.; Chertow, G.M.; Himmelfarb, J.; Bansal, N. Body Composition Changes Following Dialysis Initiation and Cardiovascular and Mortality Outcomes in CRIC (Chronic Renal Insufficiency Cohort): A Bioimpedance Analysis Substudy. Kidney Med. 2021, 3, 327–334.e1. [Google Scholar] [CrossRef]
  33. Watson, S.; Weeks, B.K.; Weis, L.J.; Harding, A.; Horan, S.A.; Beck, B.R. High-Intensity Resistance and Impact Training Improves Bone Mineral Density and Physical Function in Postmenopausal Women with Osteopenia and Osteoporosis: The LIFTMOR Randomized Controlled Trial. J. Bone Miner. Res. 2017, 33, 211–220. [Google Scholar] [CrossRef] [PubMed]
  34. Lohman, T.; Going, S.; Hall, M.; Ritenbaugh, C.; Bare, L.; Hill, A.; Houtkooper, L.; Aickin, M.; Boyden, T.; Pamenter, R. Effects of resistance training on regional and total bone mineral density in premenopausal women: A randomized prospective study. J. Bone Miner. Res. 2009, 10, 1015–1024. [Google Scholar] [CrossRef]
  35. JafariNasabian, P.; Inglis, J.E.; Reilly, W.; Kelly, O.; Ilich, J.Z. Aging human body: Changes in bone, muscle and body fat with consequent changes in nutrient intake. J. Endocrinol. 2017, 234, R37–R51. [Google Scholar] [CrossRef] [Green Version]
  36. McNerny, E.; Nickolas, T.L. Bone Quality in Chronic Kidney Disease: Definitions and Diagnostics. Curr. Osteoporos. Rep. 2017, 15, 207–213. [Google Scholar] [CrossRef]
  37. Alem, A.M.; Sherrard, D.J.; Gillen, D.L.; Weiss, N.S.; Beresford, S.A.; Heckbert, S.R.; Wong, C.; Stehman-Breen, C. Increased risk of hip fracture among patients with end-stage renal disease. Kidney Int. 2000, 58, 396–399. [Google Scholar] [CrossRef] [PubMed] [Green Version]
  38. Asadipooya, K.; Abdalbary, M.; Ahmad, Y.; Kakani, E.; Monier-Faugere, M.-C.; El-Husseini, A. Bone Quality in CKD Patients: Current Concepts and Future Directions—Part I. Kidney Dis. 2021, 7, 268–277. [Google Scholar] [CrossRef] [PubMed]
  39. Rysz, J.; Franczyk, B.; Rokicki, R.; Gluba-Brzózka, A. The Influence of Dietary Interventions on Chronic Kidney Disease–Mineral and Bone Disorder (CKD-MBD). Nutrients 2021, 13, 2065. [Google Scholar] [CrossRef] [PubMed]
  40. Gader, A.G.A. The effect of exercise and nutrition on bone health. J. Musculoskelet. Surg. Res. 2018, 2, 142. [Google Scholar] [CrossRef]
Figure 1. (AD) Differences in Body Composition Based on CKD Stage. (A) Individuals with greater progression of CKD stage demonstrate lower lean body mass (g), (B) lower bone mineral (g) content, (C) greater body fat percentage (%), though this was not statistically significant, and (D) lower VAT mass (g), which was not statistically significant. Abbreviations: Total BMC—total body bone mineral content; CKD—chronic kidney disease; VAT mass—visceral adipose tissue mass.
Kidneydial 03 00024 g001aKidneydial 03 00024 g001b
Table 1. Participant demographics.
VariablesMean/MedianSD/IQR
Sample Size (M/F)24 (9:15)
eGFR (mL/min/1.73 m2)54.389.04
Age (years)62.259.2
Height (m)1.680.9
Weight (kg)83.0416.44
BMI28.964.12
BF (%)36.288.74
SBP (mmHg)125.3310.23
DBP (mmHg) *82.078.0, 85.0
HR (bpm)70.2511.19
All normally distributed values are presented as mean ± standard deviation. * Non-normal data are presented as median, interquartile range (IQR). Abbreviations: eGFR—estimated glomerular filtration rates; BMI—body mass index; BF—body fat; SBP—systolic blood pressure; DBP—diastolic blood pressure; HR—heart rate; m—meters, kg—kilograms; mmHg—millimeters of mercury; bpm—beats per minute.
Table 2. Multiple linear regression model for VO2max and body composition.
VO2max (mL/kg/min−1)
VariablesβSEt-Valuep-Value
Lean Mass0.000260.0000713.590.0018
Fat Mass−0.000240.000074−3.250.004
BMC0.000750.001280.590.5646
Statistical significance set at p < 0.05 (bold). Abbreviations: BMC—total bone mineral content.
Table 3. Body composition correlations to VO2max.
VariablesR-Valuep-Value
Lean mass (g)0.74959<0.0001
%BF−0.802<0.0001
Fat mass (g)−0.384030.0639
VAT mass (g)−0.013050.9517
BMC (g)0.6470.0006
BMD (g/cm2)0.5650.0041
LA-BMD0.744<0.0001
RA-BMD0.570.0037
L-rib BMD0.75<0.0001
R-rib BMD *0.5880.0025
L-leg BMD *0.6130.0014
R-leg BMD *0.5610.0044
Statistical significance set at p < 0.05 (bold). * Spearman’s rank correlation calculated for non-parametric data. Abbreviations: LBM—lean body mass; %BF—body fat percentage; FM—fat mass; VAT—visceral adipose tissue; BMC—bone mineral content; BMD—bone mineral density; LA—left arm; RA—right arm; L-rib—left ribcage; R-rib—right ribcage; L-leg—left leg; R-leg—right leg.
Disclaimer/Publisher’s Note: The statements, opinions and data contained in all publications are solely those of the individual author(s) and contributor(s) and not of MDPI and/or the editor(s). MDPI and/or the editor(s) disclaim responsibility for any injury to people or property resulting from any ideas, methods, instructions or products referred to in the content.

