1. Introduction
In recent decades, the importance of proper transboundary water resources management has increased due to intense population growth from agricultural activities, rising water demands, inadequate water resource allocation, prolonged droughts, and climate change [
1]. Basin management involves managing land, water, and other natural resources within a specific basin to minimize negative impacts on water and soil resources [
2]. This management is reliant on surface water and all interacting factors within the basin system, including socio-economic conditions, human and biophysical factors, soil structure, and water resources [
2,
3].
More than 45% of the Earth’s surface is comprised of transboundary basins, and the livelihoods of over 40% of the global population rely on shared rivers. The scarcity and unequal distribution of water resources, coupled with rising rates of wasteful consumption, insufficient alternative water sources, and overexploitation of shared water bodies, have led to water crises and geopolitical tensions in various parts of the world [
4]. Transboundary areas lack proper tools for assessing and managing water resources due to their typically inaccessible nature [
5].
Inadequate management of transboundary rivers results in destructive effects, leading to negative outcomes. For instance, inadequate management of floodwaters in transboundary basins can cause significant damage. Additionally, poor management of floodwater can lead to the wastage of water resources that could otherwise be beneficially utilized. Failing to implement effective management strategies in transboundary rivers not only increases the vulnerability of communities to flood-related disasters but also contributes to the inefficient use of water resources. Addressing these challenges requires improved governance mechanisms and collaborative efforts to ensure the sustainable management of water in transboundary basins [
6,
7,
8].
Iran is currently experiencing a significant water crisis, primarily due to rapid population growth and its improper spatial distribution, unregulated agricultural water consumption, and inappropriate cultivation patterns along with mismanagement [
9]. According to the Food and Agricultural Organization of the United Nations (FAO) Global Information System on Water and Agriculture (AQUASTAT), Iran’s total renewable surface water is estimated to be about 137 billion cubic meters per annum (BSMA), with more than 18 BSMA leaving the country, accounting for approximately 13% of these valuable resources [
10]. The terrestrial transboundary regions of Iran, across 5894 km and bordering 13 countries, particularly in the eastern and western parts, face challenges related to seasonal floods caused by periodic rainfall. These areas often lack adequate monitoring infrastructure, making effective flood management difficult, one of which is the Qaretikan basin. The Qaretikan river is located in the northeast of Iran and flows a distance of 38 km before crossing the border into Turkmenistan. An estimated 9 million cubic meters (MCM) of water are discharged annually from Iran through this river. The majority of the local population is engaged in agricultural and livestock activities, leading to a significant need for water in the region. Therefore, it is crucial to identify, assess, and effectively manage water resources in order to meet this demand [
11]. To mitigate flood impacts and ensure community safety in these areas, it is crucial to enhance monitoring infrastructure and implement effective management strategies. Inadequate flood management can worsen migration patterns and population movement, affecting the stability and security of transboundary regions. Therefore, realizing effective flood management strategies is essential to address these challenges.
Water managers are facing a growing challenge in managing transboundary water bodies, especially across international borders [
12]. In certain regions, there is a lack of adequate measurement stations for monitoring water resources, resulting in limited data on water availability and usage, putting significant strain on water resources [
13]. However, the use of measurement stations may not always be necessary, as remote sensing technologies can be employed to estimate individual water balance components with acceptable accuracy. Global water-related data products obtained through remote sensing, which are acquiescently accessible, have become increasingly common in hydrology research to assess water resource availability [
14,
15]. The remote sensing method surpasses the constraints of traditional measurement techniques and presents an opportunity for the advancement of these regions through improved water resource management practices. Research conducted by Yalew et al. [
16] demonstrates the effectiveness of remote sensing products in estimating water balance components and highlights their potential to enhance water resources management in transboundary basins.
Satellite-derived data products on precipitation, evapotranspiration, soil moisture, etc., have been extensively tested and are generally accurate [
17]. Time-series satellite data can detect changes in the quantity and quality of surface water in a basin over time [
18]. Satellite data provide valuable information for water resources management studies, making them more efficient than traditional methods, particularly in data collection. Therefore, these data are considered highly suitable for identifying development potentials in remote areas [
19]. In recent decades, remote sensing and geographic information systems (GISs) have become essential tools in basin studies with few or no ground stations, helping to identify basin issues and manage water resources effectively [
19,
20,
21,
22,
23,
24].
The Global Land Evaporation Amsterdam Model (GLEAM), ERA5-Land dataset, and Integrated Multi-satellite Retrievals for Global Precipitation Measurement (IMERG) have demonstrated excellent performance in hydrological monitoring in transboundary regions. GLEAM provides accurate estimates of evapotranspiration, ERA5-Land offers high-quality land surface data, and IMERG delivers precise information on precipitation. These remote sensing products have been crucial in improving the monitoring and management of water resources in transboundary basins by providing valuable insights into hydrological processes. Recent studies by Martens et al. [
25] and Huffman et al. [
26] have emphasized the effectiveness of GLEAM and IMERG in enhancing hydrological monitoring practices in transboundary regions. Furthermore, Zou et al. [
27] conducted a study on ERA5-Land temperature data and determined that this dataset effectively captures daily temperature fluctuations and seasonal variations. In a separate study, Tan et al. [
28] assessed NASA POWER and ERA5-Land in terms of temperature and precipitation extremes. Their findings indicated that both datasets were able to accurately represent the climatological patterns of precipitation and maximum and minimum temperatures, with ERA5-Land exhibiting slightly superior performance. Baseri et al. [
9] utilized IMERG and ERA5 data for water balance modeling, demonstrating the high performance of these products in their study. Evaluation of GLEAM in multiple regions has shown a strong correlation with observational data and low root-mean-square error (
RMSE) [
29,
30,
31].
In addition to these studies, multi-criteria decision-making methods (MCDMs) have been utilized by researchers to prioritize the allocation of available water resources. Thungngern et al. [
32] conducted a review of 46 studies that employed the Analytic Hierarchy Process (AHP) in water resources management between 2009 and 2013. This method, which takes into account social, economic, and environmental factors, can be implemented in various forms of water resources management. Its efficacy is heightened when integrated with remote sensing techniques [
33,
34,
35].
Water resource planning and management in transboundary basins are essential for sustainable water governance but have not been adequately addressed in academic research and policy discussions. Despite the importance of addressing shared water challenges, the complexities of managing transboundary water resources have been overlooked. Some studies have examined the use of remote sensing data and AHP combined with Expert Choice analysis to improve decision making in transboundary water management. Further research is urgently needed to enhance our understanding of the complexities and dynamics of transboundary water management and to create effective strategies for promoting sustainable water use and cooperation among riparian states.
This research pursues exploring the most effective utilization and efficient extraction of water resources in the Qaretikan basin, with a focus on preserving the existing ecosystem. By reducing basin outflow, significant social, economic, and environmental advancements can be achieved in this region. Due to the lack of ground-based data measurements in the area, this research utilizes remote sensing technologies to acquire meteorological and hydrological data for an ungauged basin, using satellite products, i.e., ERA5-Land, IMERG, and IMERG data. The Justin method is utilized for runoff calculation in the region by utilizing satellite products as input. This method, known for its simple and effective approach to calculating runoff through the use of water balance components, is emphasized in studies related to water resource management. It stands out from other calculation methods due to its simplicity and practicality. Unlike the complex modeling or extensive data processing required by certain traditional methods, the Justin method provides a simpler and quicker approach to estimating runoff. This simplicity and accessibility of the Justin method for water resource management have been highlighted in studies like the one conducted by Moriasi et al. [
36]. Additionally, GIS techniques are employed to analyze, integrate, and preprocess data to estimate a usable water balance and assess available water resources in the basin. To optimize water usage and prevent wastage of resources in planning, the AHP method is applied to prioritize water allocation indicators by expert opinions. Ultimately, a water allocation plan is proposed to enhance water consumption and promote fairness in decision-making processes within the Qaretikan village sub-basin boundary, based on the current status of water resources.
2. Materials and Methods
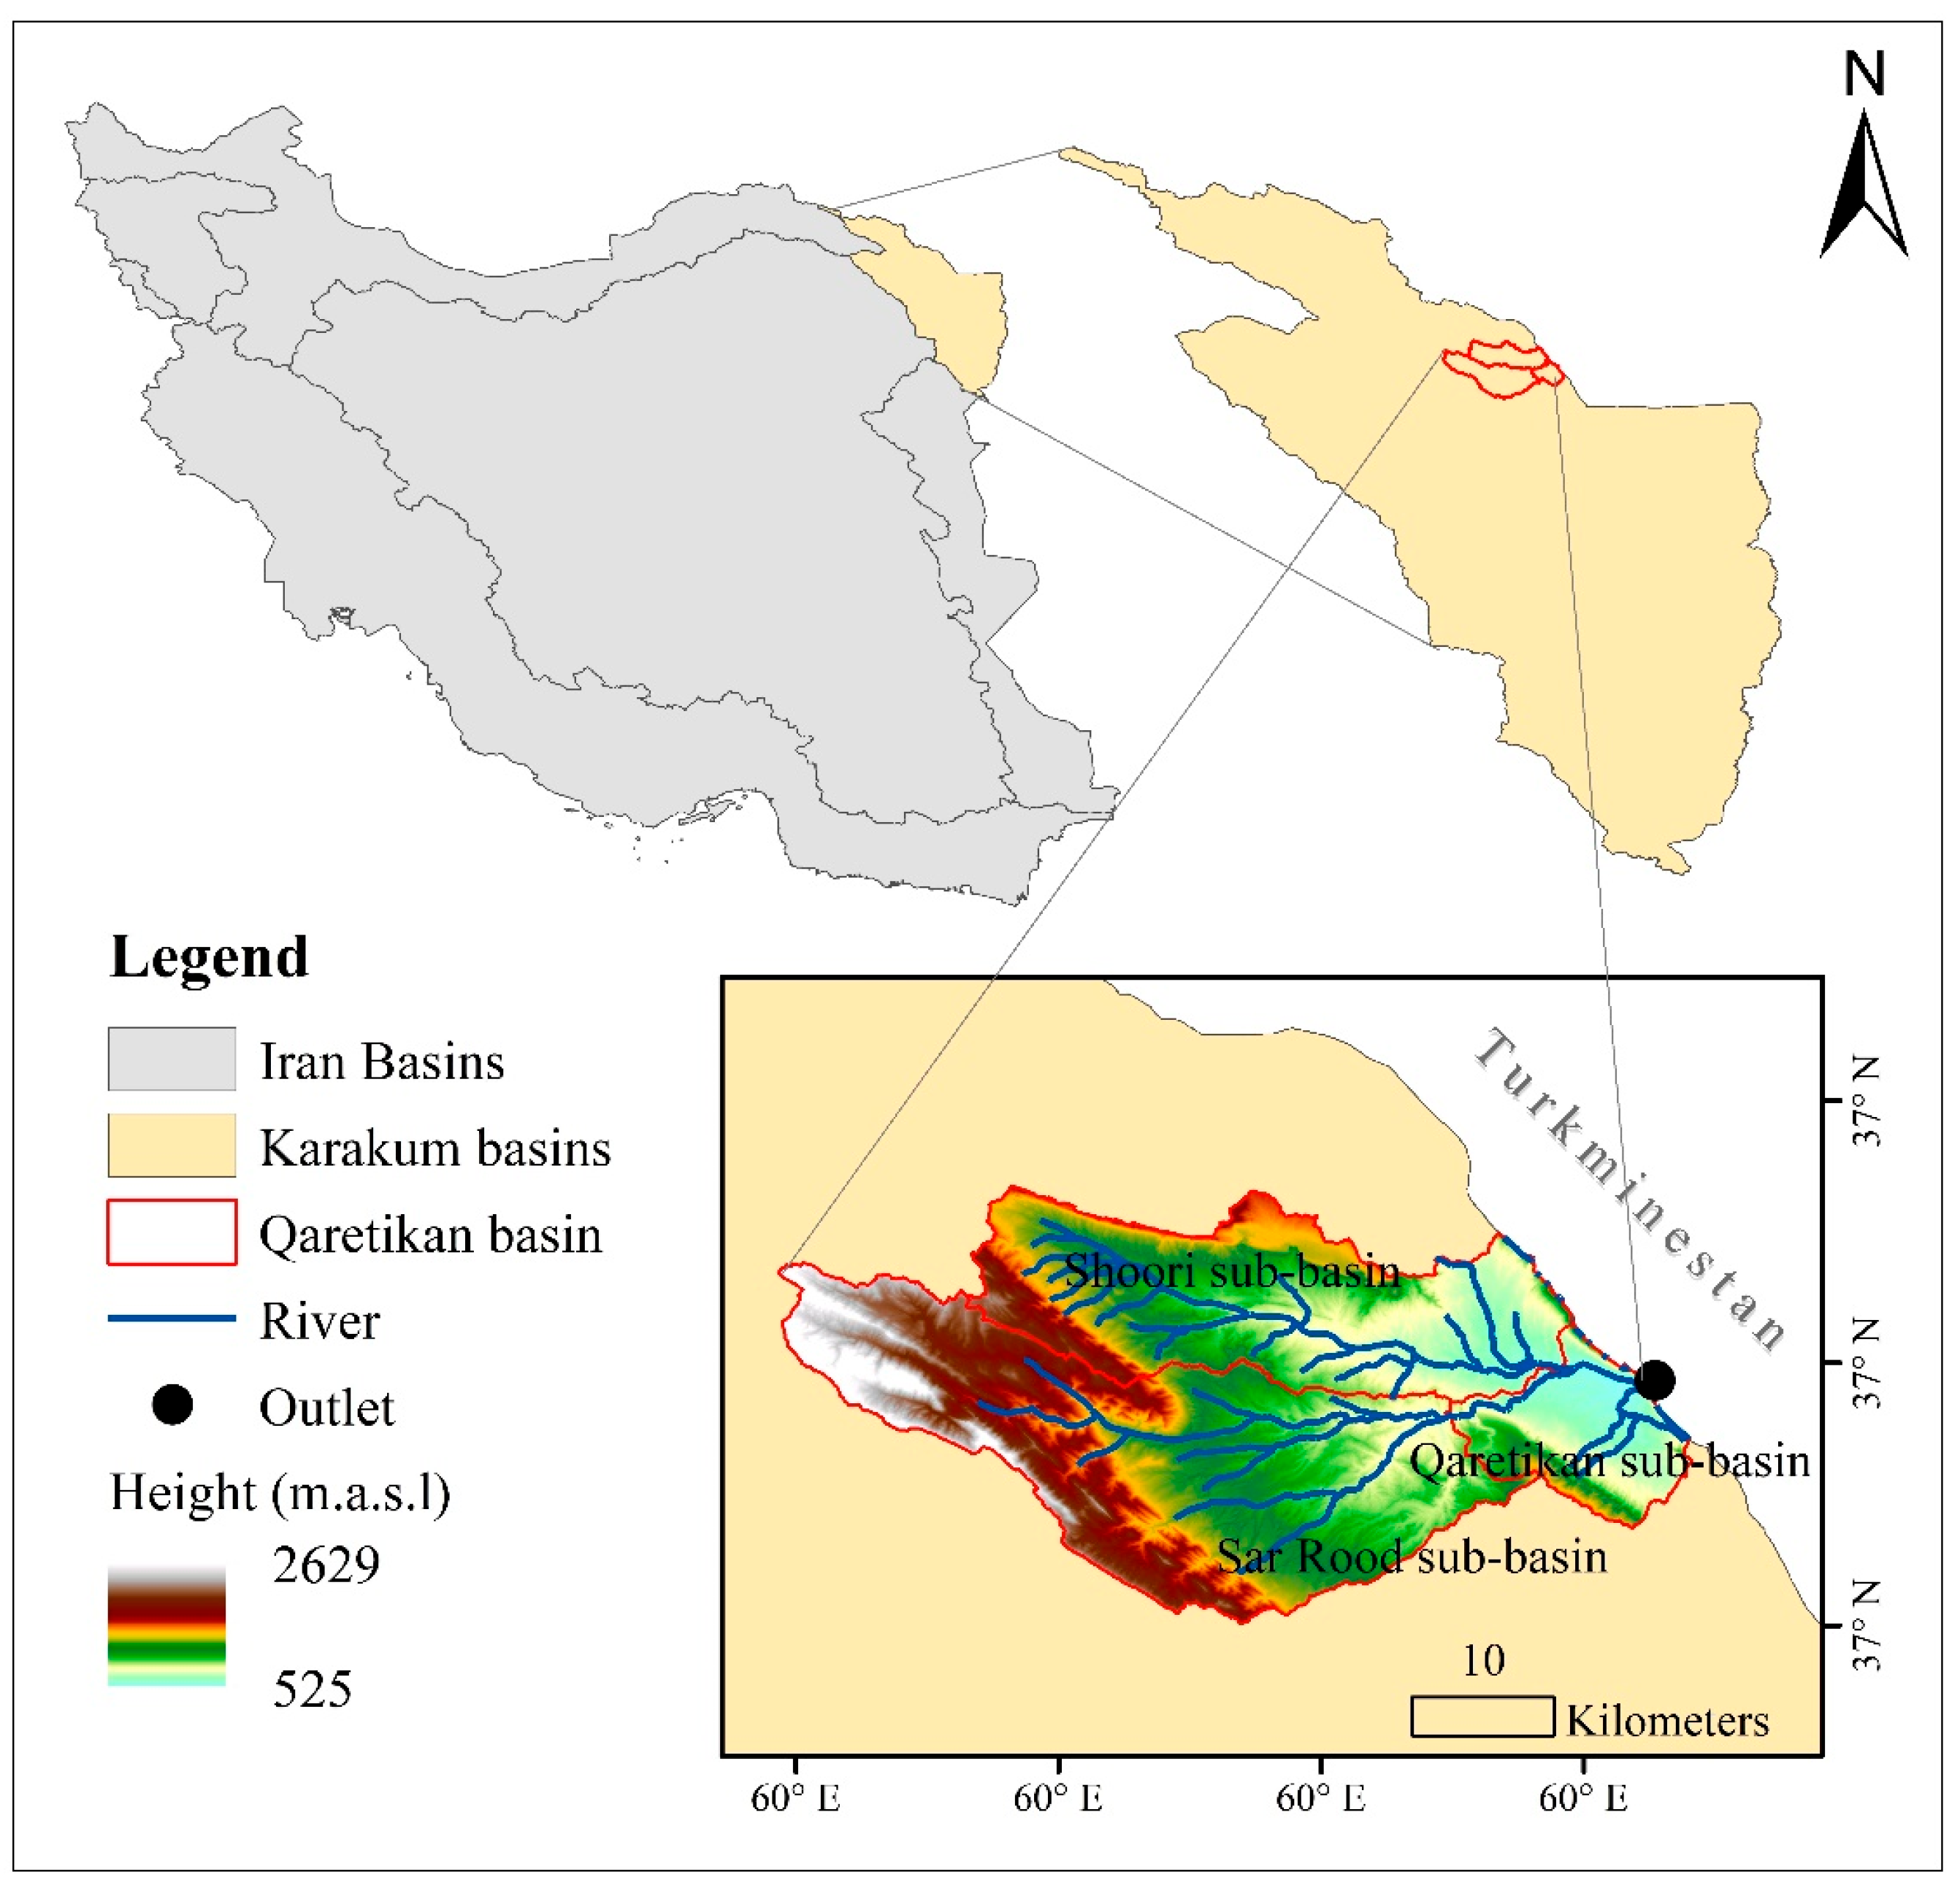
The research area is situated in the Qaretikan river basin, north of Hezar Masjed Mountain and northwest of the Karakum basin in Kalat Naderi City, northeastern Iran. It spans an area of approximately 840 km
2, with elevation ranging from 490 to 2630 m above sea level (m.a.s.l) (
Figure 1).
For better evaluations and with regard to the basin’s diversity in soil structure, slope, vegetation, land use, etc., the study regions are divided into three sub-basins. This study specifically targets the sub-basin of Qaretikan village, located adjacent to Turkmenistan and encompassing the villages of Qaretikan and Qelichabad.
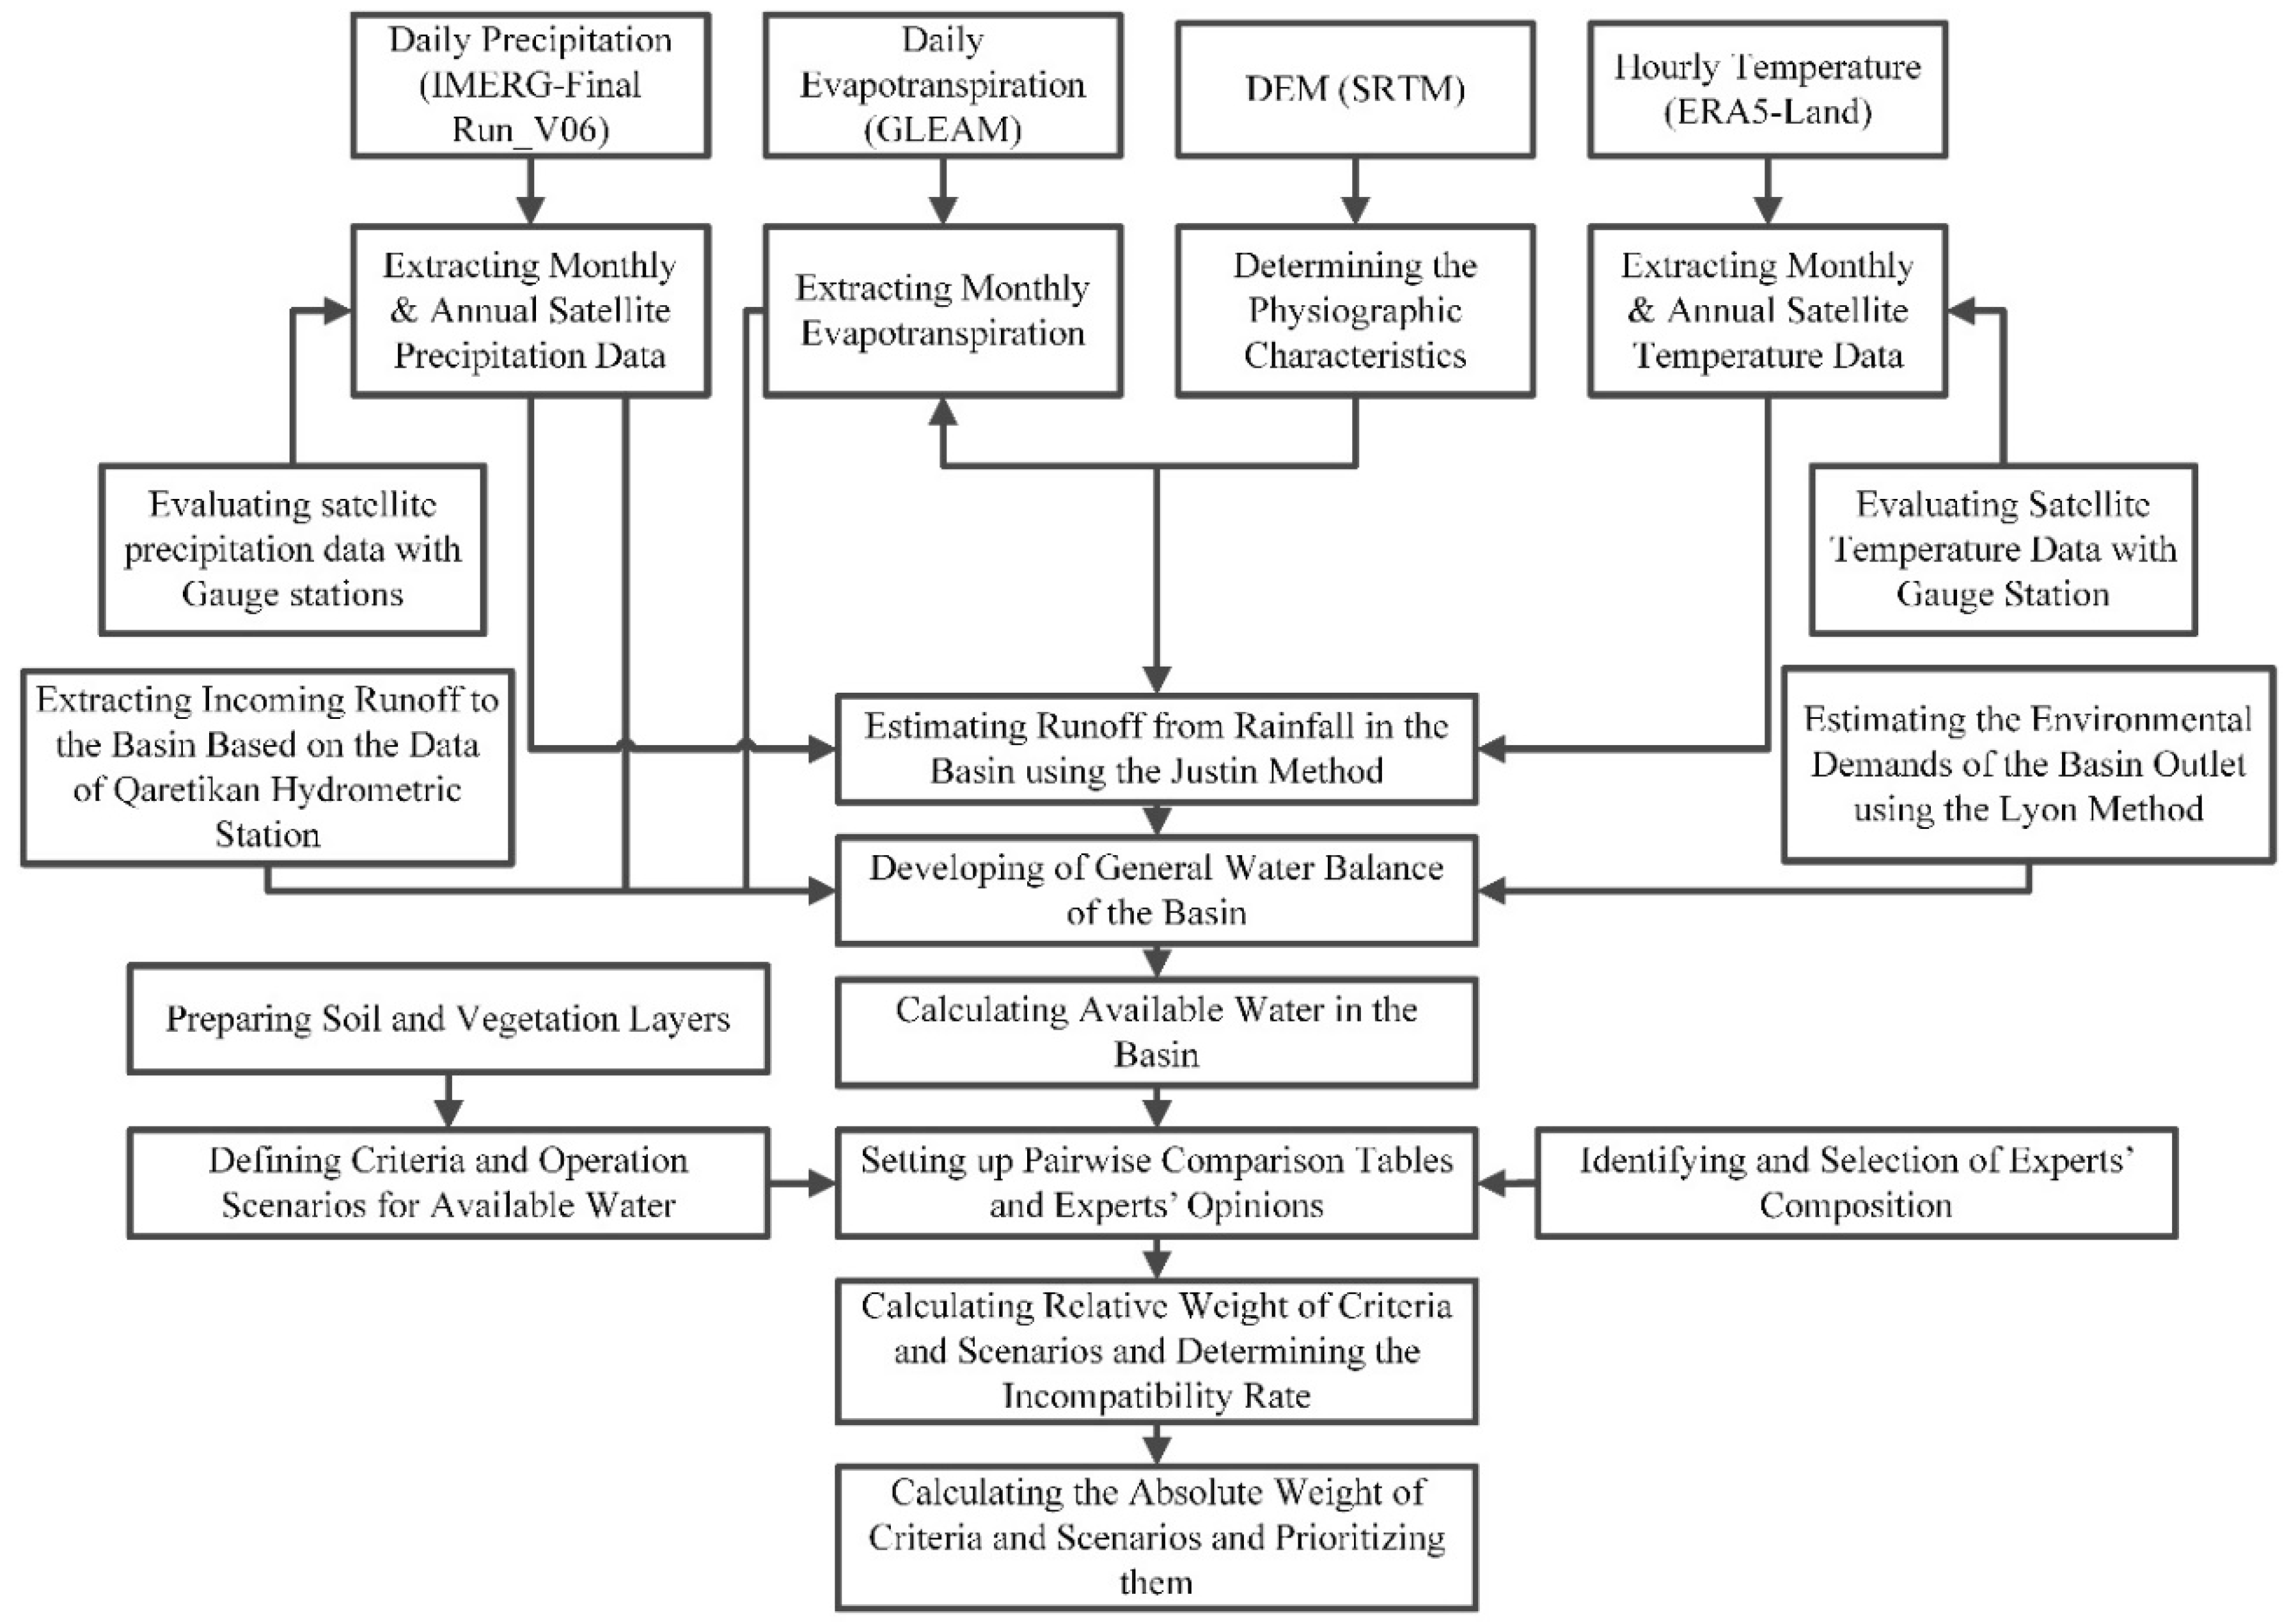
The flow diagram illustrating the proposed methodology is depicted in
Figure 2. The physiographic features of the study area were determined utilizing a 30 m digital elevation model (DEM) sourced from the USGS website
https://earthexplorer.usgs.gov (accessed on 8 November 2022). The outlet of the basin was identified through the analysis of satellite imagery and on-site observations. The study area boundary, stream network, elevation map, and basin and sub-basins’ characteristics were all extracted from the filled DEM.
As a result of the lack of ground-based measurements, the annual average temperature of the basin was derived from the ERA5-Land reanalysis temporal database with a spatial resolution of 0.1° × 0.1° on an hourly time scale
https://cds.climate.copernicus.eu (accessed on 8 November 2022). Limited access to the basin’s nature led to missing precipitation data, making it impractical for short-term statistical analysis. Therefore, reliance on satellite data was deemed necessary in this region. Subsequently, precipitation for the area was estimated from the IMERG-Final Run V06 satellite product with a spatial resolution of 0.1° × 0.1° on a daily time scale from
https://disc.gsfc.nasa.gov (accessed on 14 November 2022) [
37] for water years in the period from 2005 to 2014.
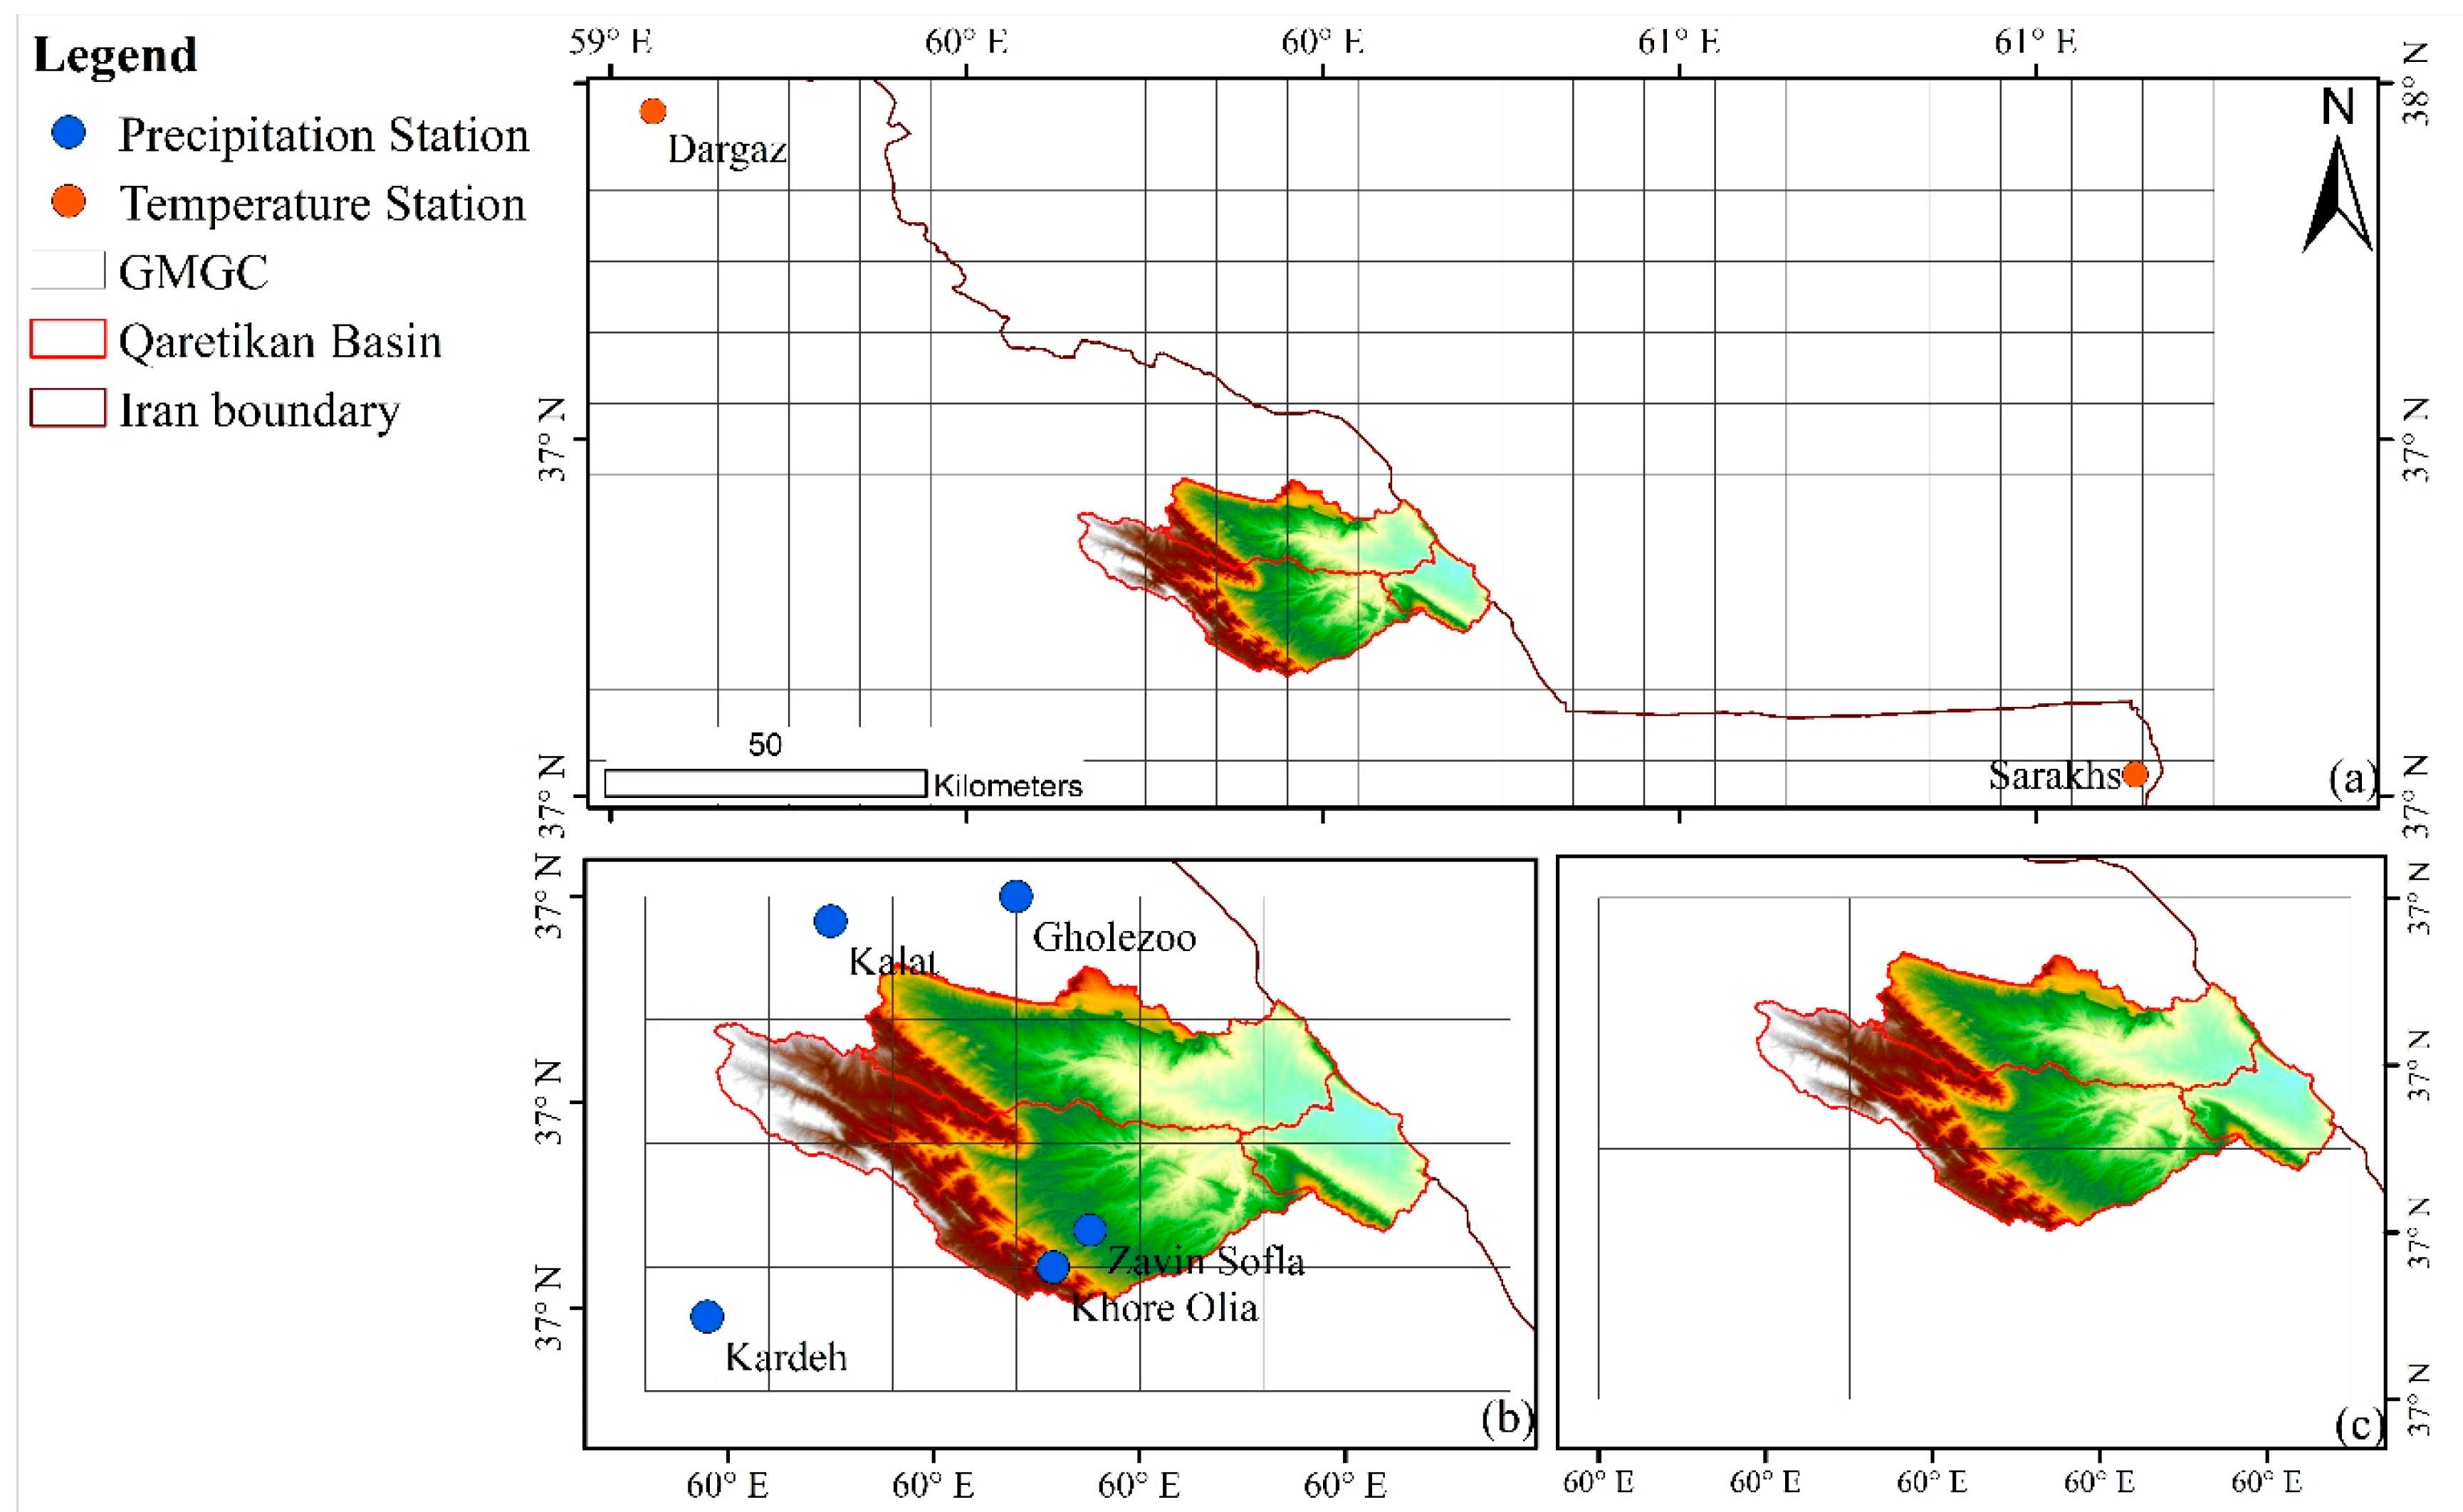
Prior to assessing satellite products, it is important to acknowledge that these products are subject to errors and uncertainties. Therefore, they can only offer estimations of hydrometeorological variables. Given the absence of synoptic and climatological stations in the area, Sarakhs and Dargaz meteorological stations were utilized as the closest stations in the basin’s vicinity to assess temperature data derived from ERA5-Land. The location of these stations and the ERA5-Land grids are depicted in
Figure 3a, while
Table 1 provides details on the characteristics of these stations.
Evaluation of satellite products with ground stations was performed using statistical indices of deviation (
BIAS), correlation coefficient (
CC), and root-mean-square error (
RMSE), calculated using Equations (1)–(3) as follows:
where
and
are the satellite and observational data,
and
are the average values of satellite and observational data, and
is the number of data, respectively.
Furthermore, data obtained from the Qaretikan hydrometric station were utilized to estimate the inflow into the basin. Subsequently, the runoff resulting from precipitation within the basin was calculated utilizing the Justin method. Ultimately, through the calculation of both inflow and runoff, the outflow from the basin was determined.
In the Justin method, runoff in the desired basin is estimated using the data of the adjacent basin. The equations used in this method are as follows:
where
is the area of the basin (km
2),
is the maximum height of the basin (km),
is the minimum height of the basin (km),
is the annual discharge of the basin (MCM),
is the average annual precipitation in the basin (cm), T is the average annual temperature of the basin, S is the average slope of the basin,
is the annual runoff depth of the basin, and
is the Justin coefficient [
38]. In this approach, the difference in elevation and area of the highest and lowest points of the basin, where data from hydrometric stations, annual precipitation, and average annual temperature are accessible, is initially computed. Subsequently, utilizing the equations mentioned above, the Justin coefficient of the basin is established [
39]. By assuming that this coefficient remains constant for neighboring basins, the runoff volume in an ungauged basin is projected based on annual precipitation and average temperature data in addition to the physiographic features of the basin [
31].
Finally, the Lyon method determines environmental flow demands based on runoff leaving the basin [
40]. This method accounts for variability in river flow and consists of three main steps: firstly, identifying wet and dry periods; secondly, calculating average flow; and thirdly, determining environmental demand discharge. The first step involves categorizing months based on their discharge levels. Months with lower discharge than the average annual discharge are classified as dry months, while months with higher discharge are classified as wet months. The second step calculates the average flow by determining the average flow for the same days of each year to create a hydrograph for the entire year. Daily flow values are then organized in ascending order for each month, with the 15th data point representing the mean flow for that month. The final step involves determining the environmental demand discharge. In this step, 40% of the discharge is allocated for wet months, while 60% is allocated for dry months. This allocation ensures that environmental flow demands are appropriately adjusted based on the wetness or dryness of the month. By following these three steps, the Lyon method effectively calculates water demand by considering river flow variability and ensuring that environmental flow requirements are balanced throughout the year.
For assessing the evapotranspiration rate in this basin, data from the Global Land Evaporation Amsterdam Model (GLEAM) v3.2a with a spatial resolution of 0.25° × 0.25° and temporal resolution at daily, monthly, and annual scale were utilized “
https://www.gleam.eu/” (accessed on 22 November 2022) [
41]. The actual evaporation rate was then determined using Equation (7):
where
is the actual evaporation,
is transpiration,
is the evaporation from the bare soil surface,
is evaporation from the open water surface,
is interception loss, and
is sublimation from snow [
42].
To effectively manage the water resources in the Qaretikan basin, a general water balance assessment was conducted. This assessment involves calculating and monitoring water exchanges within a specific area over a certain period, following the principles of the conservation of mass law, known as the water balance [
43]. The main objective of the water balance calculation is to analyze the relationship between input and output components, determine their respective values, and assess the amount of water stored in the study area. The available water resources can be calculated using Equation (8) as presented by Khazaei and Hosseini [
44]:
where
is the amount of available water,
is the amount of rainfall,
is the runoff entering the basin,
is the evapotranspiration that occurs in the basin, and
is the environmental runoff required for the downstream flow of the basin, respectively.
AHP, as a multi-criteria decision-making process developed by Thomas L. Saaty in 1980, involves defining decision options based on criteria importance through pairwise comparisons using expert judgments [
45]. Each option is then scored to indicate its importance, with absolute judgments used to compare options based on specific characteristics (
Table 2). This method allows for hierarchical problem formulation and consideration of qualitative and quantitative criteria [
46]. It also allows for sensitivity analysis on criteria and sub-criteria [
47]. The first step in AHP is creating a process tree that includes the goal, criteria, and options. The goal is represented at the highest level, criteria for decision making at the second level, and decision options at the lowest level [
48]. The key step is selecting criteria and options that impact decision-making goals.
During the hierarchical analysis process, components are compared pairwise, resulting in the formation of a square matrix representing the dimensions of the components. The pairing matrix is then utilized to calculate the relative weight of each element, drawing upon expert opinions. The AHP method is guided by four fundamental principles:
According to the inverse principle, if the priority of index A over index B is n, the priority of index B over index A is 1/n.
The homogeneity principle states that indicators are homogeneous with each other, meaning that the priority of one index over another is neither zero nor infinity.
The dependence principle asserts that each index is dependent on the indices at its higher levels, and this dependency can extend to the highest levels.
The expectations principle dictates that when there is a modification in the hierarchical structure, the analysis of the problem must be revisited [
49].
Following a pairwise comparison, the weight of each option is determined based on its specific criteria (relative weight). Additionally, the weight of each criterion is calculated in relation to the overall goal, and the conclusive weight of each option (absolute weight) is calculated by combining the weight of each option with the weight of the corresponding reference point [
50].
Here,
is the weight of option
relative to criterion
, and
is the weight of criterion
. The method of calculating weights from the decision matrix depends on whether the matrix is compatible or incompatible. In a general definition, if Equation (7) is accepted, the decision matrix is consistent [
51].
The decision matrix obtained from comparing options to a quantitative criterion is always consistent, but not when compared to qualitative criteria. Matrices created based on qualitative criteria and verbal feedback are known as incompatible matrices. The incompatibility rate serves as an indicator of the reliability of the priorities established. A calculated incompatibility rate of 0.1 or less indicates acceptable consistency in comparisons, while a rate higher than 0.1 necessitates a revision of judgments or adjustments to the matrix [
49]. In this study, Expert Choice software Version 11 (trial version) is utilized to determine the incompatibility rate, as well as the weighting of each criterion and option.
3. Results and Discussion
The assessment of satellite products is conducted by comparing ground station data with the values of cell data. Temperature data were evaluated using three statistical indicators:
BIAS,
CC, and
RMSE, which demonstrated the strong performance of ERA5-Land monthly temperature data within the research area. A correlation of 99% was found between ERA5-Land and ground stations, with a slight overestimation (around 3 °C) in temperature estimates. Zou et al.’s [
27] findings demonstrated that ERA5-Land is mostly consistent with in situ measurements (with a correlation coefficient of 0.97). The researchers noted that ERA5-Land tends to overestimate temperatures at high altitudes in China.
In order to assess the accuracy of satellite precipitation data, stations located near the basin were used. The rain gauge locations and IMERG grids are displayed in
Figure 3b. Evaluation of the IMERG data at rain gauge locations revealed a high level of precision in predicting precipitation. Overall, there is a strong correlation between IMERG and ground stations (
CC ≥ 0.7), with the highest correlation at 89% and the lowest at 70%. There is some overestimation in areas where the highest
RMSE is 19.79 mm/month, and the
BIAS ranges from −0.22 to 0.19 mm/month. For more detailed information on the IMERG product, refer to [
31]. This product demonstrated strong performance in another region within the same province, achieving a high correlation of 89.3%. This indicates the satellite product’s accurate precipitation estimation and high performance in this particular geographical area. Compared to another study conducted in the province, the
BIAS in Qaretikan is lower, ranging from −6 to 3.7 [
9]. This suggests that this product provides a more precise estimation of precipitation in this specific area.
Following this assessment, monthly precipitation was calculated by aggregating the IMERG daily precipitation. The findings revealed a wide variation in precipitation amounts, ranging from 0.13 mm in August to 359.3 mm in March. Additionally, the majority of precipitation occurs between February and May.
In the subsequent stage, data on evapotranspiration was acquired from the GLEAM database. The amount of evaporation in each cell was multiplied by the cell’s area share, divided by the total basin area, and summed. The findings are presented in [
31]. Evapotranspiration varies significantly throughout the year. Although the potential evapotranspiration is high, the lower actual evapotranspiration volume in summer compared to other seasons is due to insufficient precipitation and water availability. This product demonstrates strong performance with a high correlation coefficient (above 0.7) and low
RMSE in estimation [
25], indicating its reliability as a source for evapotranspiration values in the study area.
As previously stated, data from the Qaretikan hydrometric station, situated upstream of the basin, were used to compute the monthly runoff entering the basin. The monthly inflow rate into the basin varies from 0.037 MCM in July to 2.727 MCM in April.
Since the study site is near the country border and mostly unreachable, there is no hydrometric station to calculate the outflow of the basin. Therefore, runoff is estimated from rainfall in the basin using Justin’s experimental method. The Justin method demonstrates strong performance in estimating runoff, exhibiting a high correlation in ungauged basins. It also shows lower
RMSE when compared to other methods such as IDOI, Lacey, and Coutagine in the majority of locations. This method is particularly recommended for regions characterized by high altitude and temperature gradients, as well as a high flow coefficient [
52].
The Qaretikan hydrometric station is situated upstream of the Qaretikan village, serving as an adjacent station. For the collection of upstream data, the nearby basins of Shuri and Sarrud were utilized. The average annual temperature was calculated using temperature data from ERA5, while the annual precipitation amount was determined using data from the IMERG satellite product. Additionally, the average slope, minimum altitude, and maximum altitude were taken into account based on the physiographic features of the area.
Table 3 displays the outcomes of the Justin method for the Qaretikan village basin, revealing that there was a total of 0.95 MCM of runoff within this specific watershed. The method utilized presents runoff as the depth of annual runoff.
Calculation of the water balance requires the monthly runoff data. Therefore, the monthly data from a nearby station was utilized to determine the monthly portion of the total annual runoff at the specific station. The runoff is computed on a monthly basis at the outlet of the basin. The outflow runoff of the basin is derived by adding the inflow and the runoff from precipitation within the basin. The monthly runoff in the basin ranges between 1.67 × 10
−2 and 0.2 × 10
−2 MCM [
53].
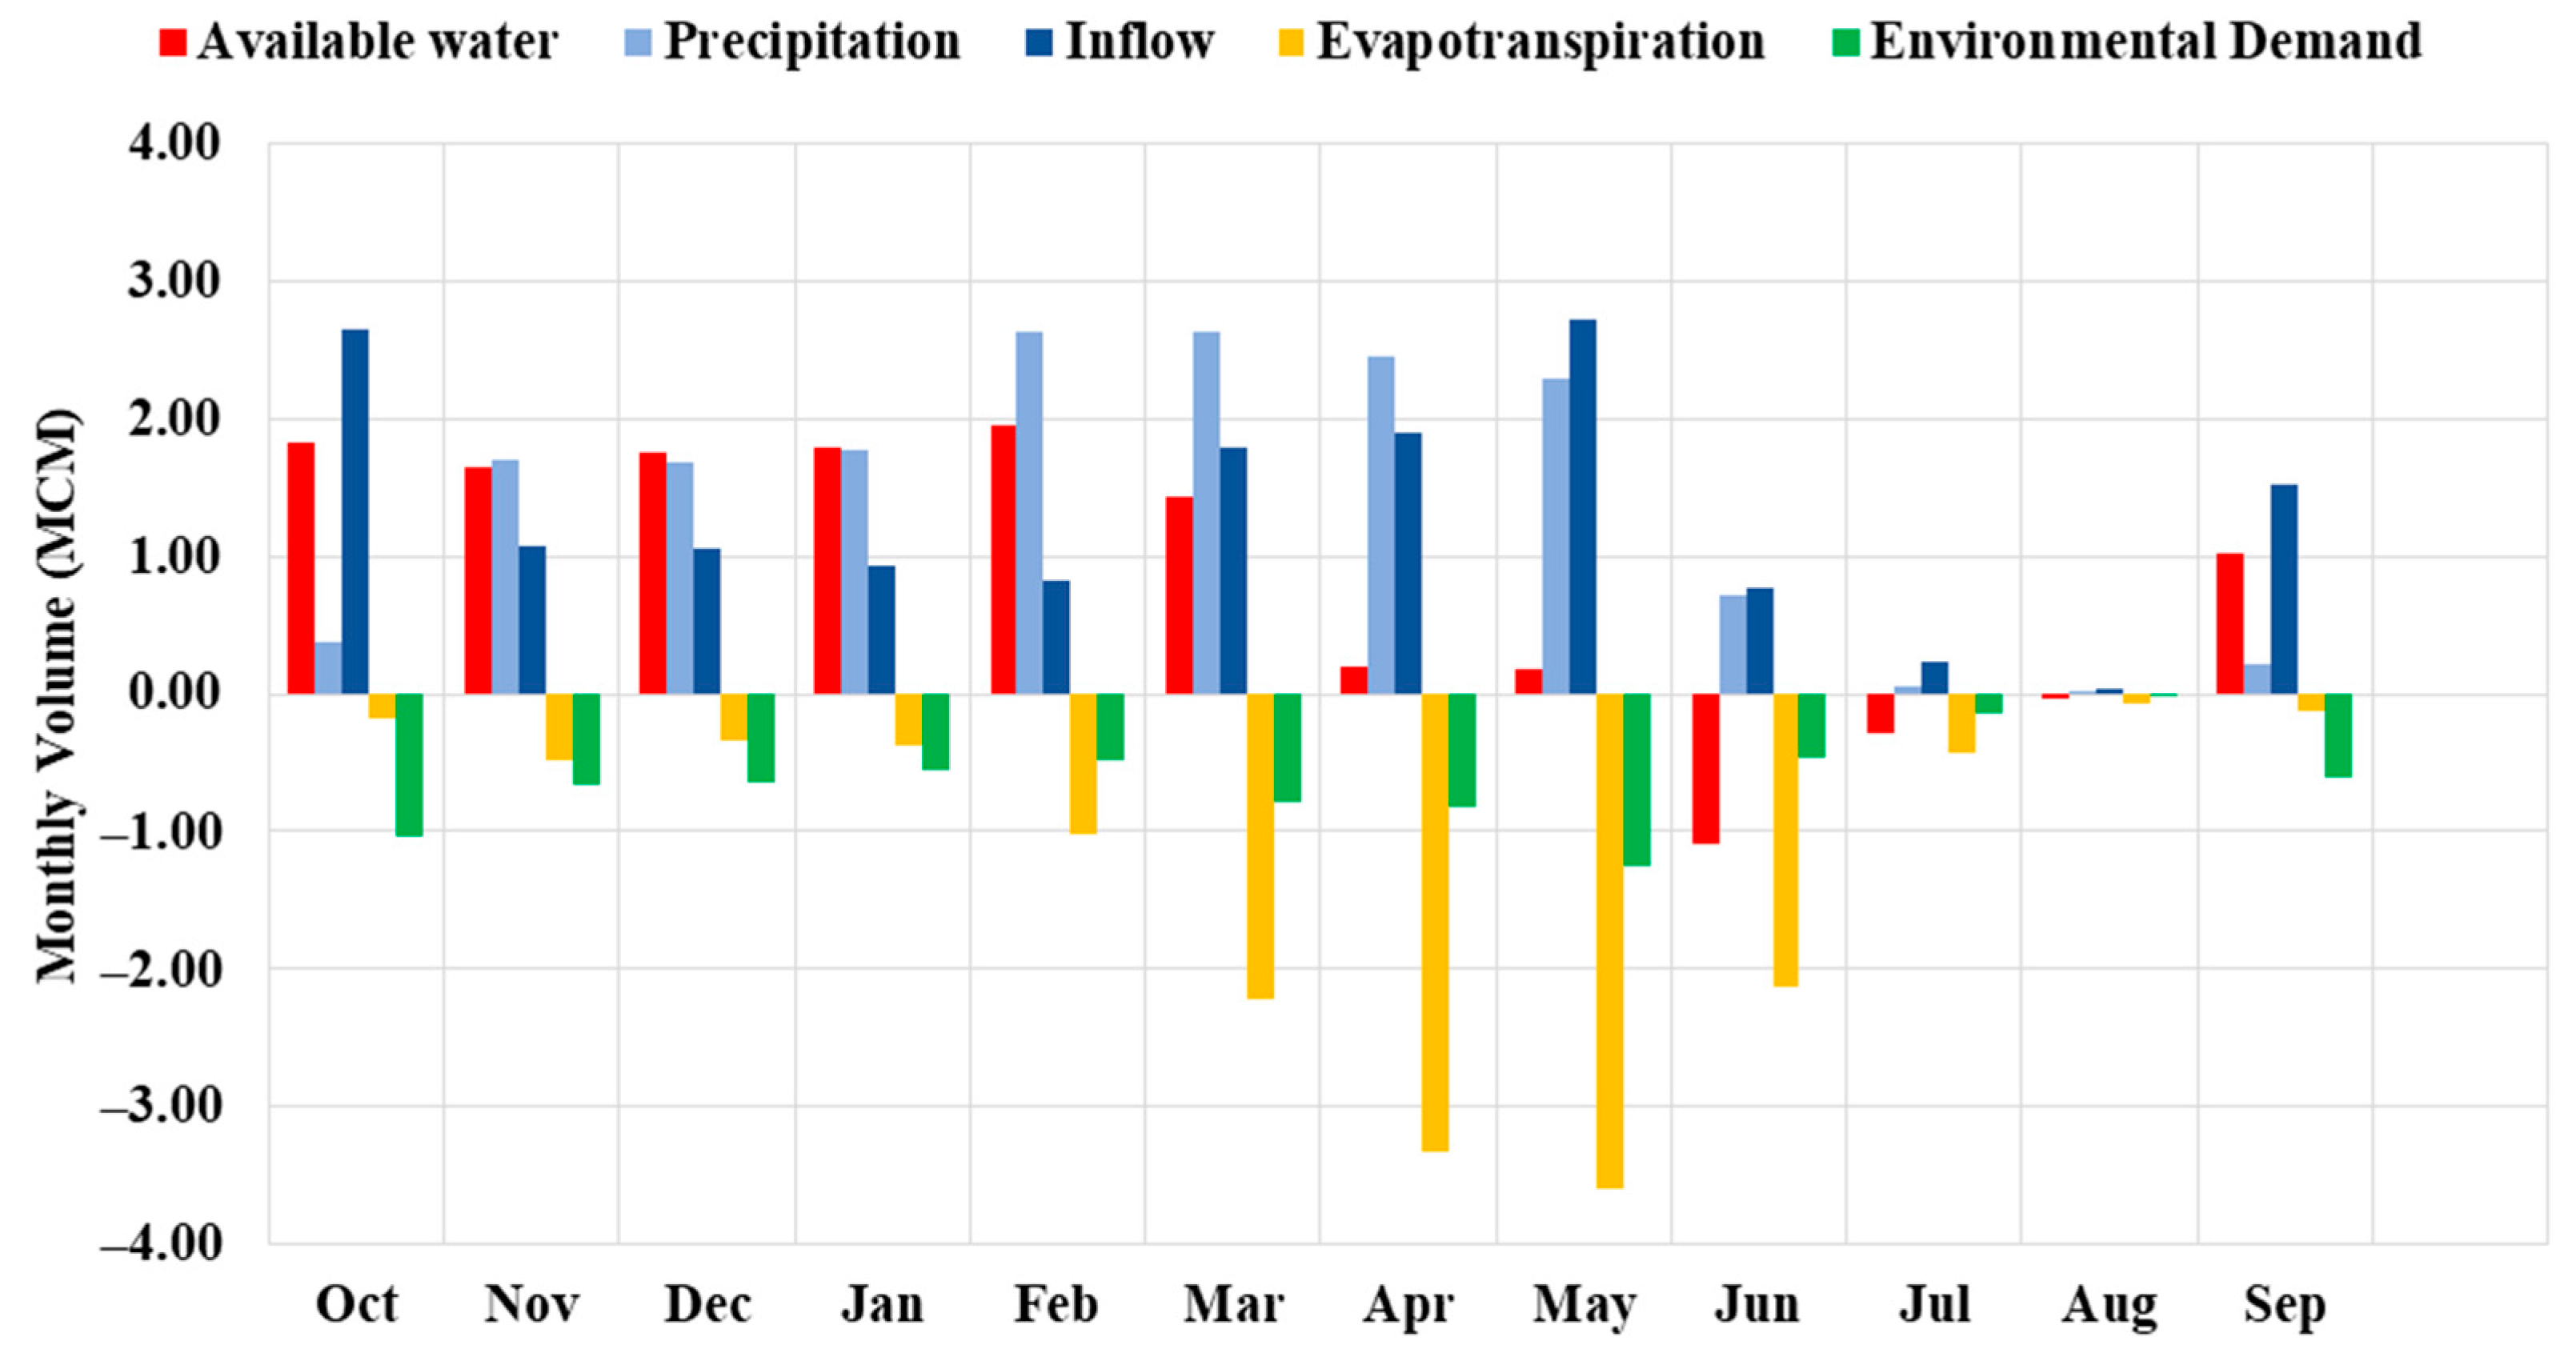
When planning for optimal use of water resources in a basin, it is important to consider downstream environmental runoff as the minimum outflow required to maintain the river’s stability. The Lyon method is commonly utilized for this purpose, with a runoff for environmental flow coefficient conversion of 0.4 for high water months and 0.6 for low water months. This study analyzed data on monthly discharge, inflow, and runoff within the basin to determine environmental requirements on a monthly basis. Results indicated a slight variation in environmental flow throughout the year, with the lowest volume of 0.02 MCM in May and the highest volume of 1.25 MCM in August. The months of May, October, April, and March were found to be the main contributors to environmental demands. Estimating all components of the water balance, the monthly water availability in the basin was calculated.
Figure 4 illustrates the volume of water in each component of the water balance and the total water available in the basin for each month of the year.
As shown in
Figure 4, the availability of water in May, June, and July is negative as a result of increased transpiration during these months. This leads to a significant decrease in surface water flow within the basin, leading to the reliance on groundwater from shallow wells for agricultural irrigation. However, the lack of adequate data on groundwater resources has led to their exclusion from this study. Consequently, a substantial amount of evapotranspiration supported by groundwater resources is not accounted for in the water balance analysis.
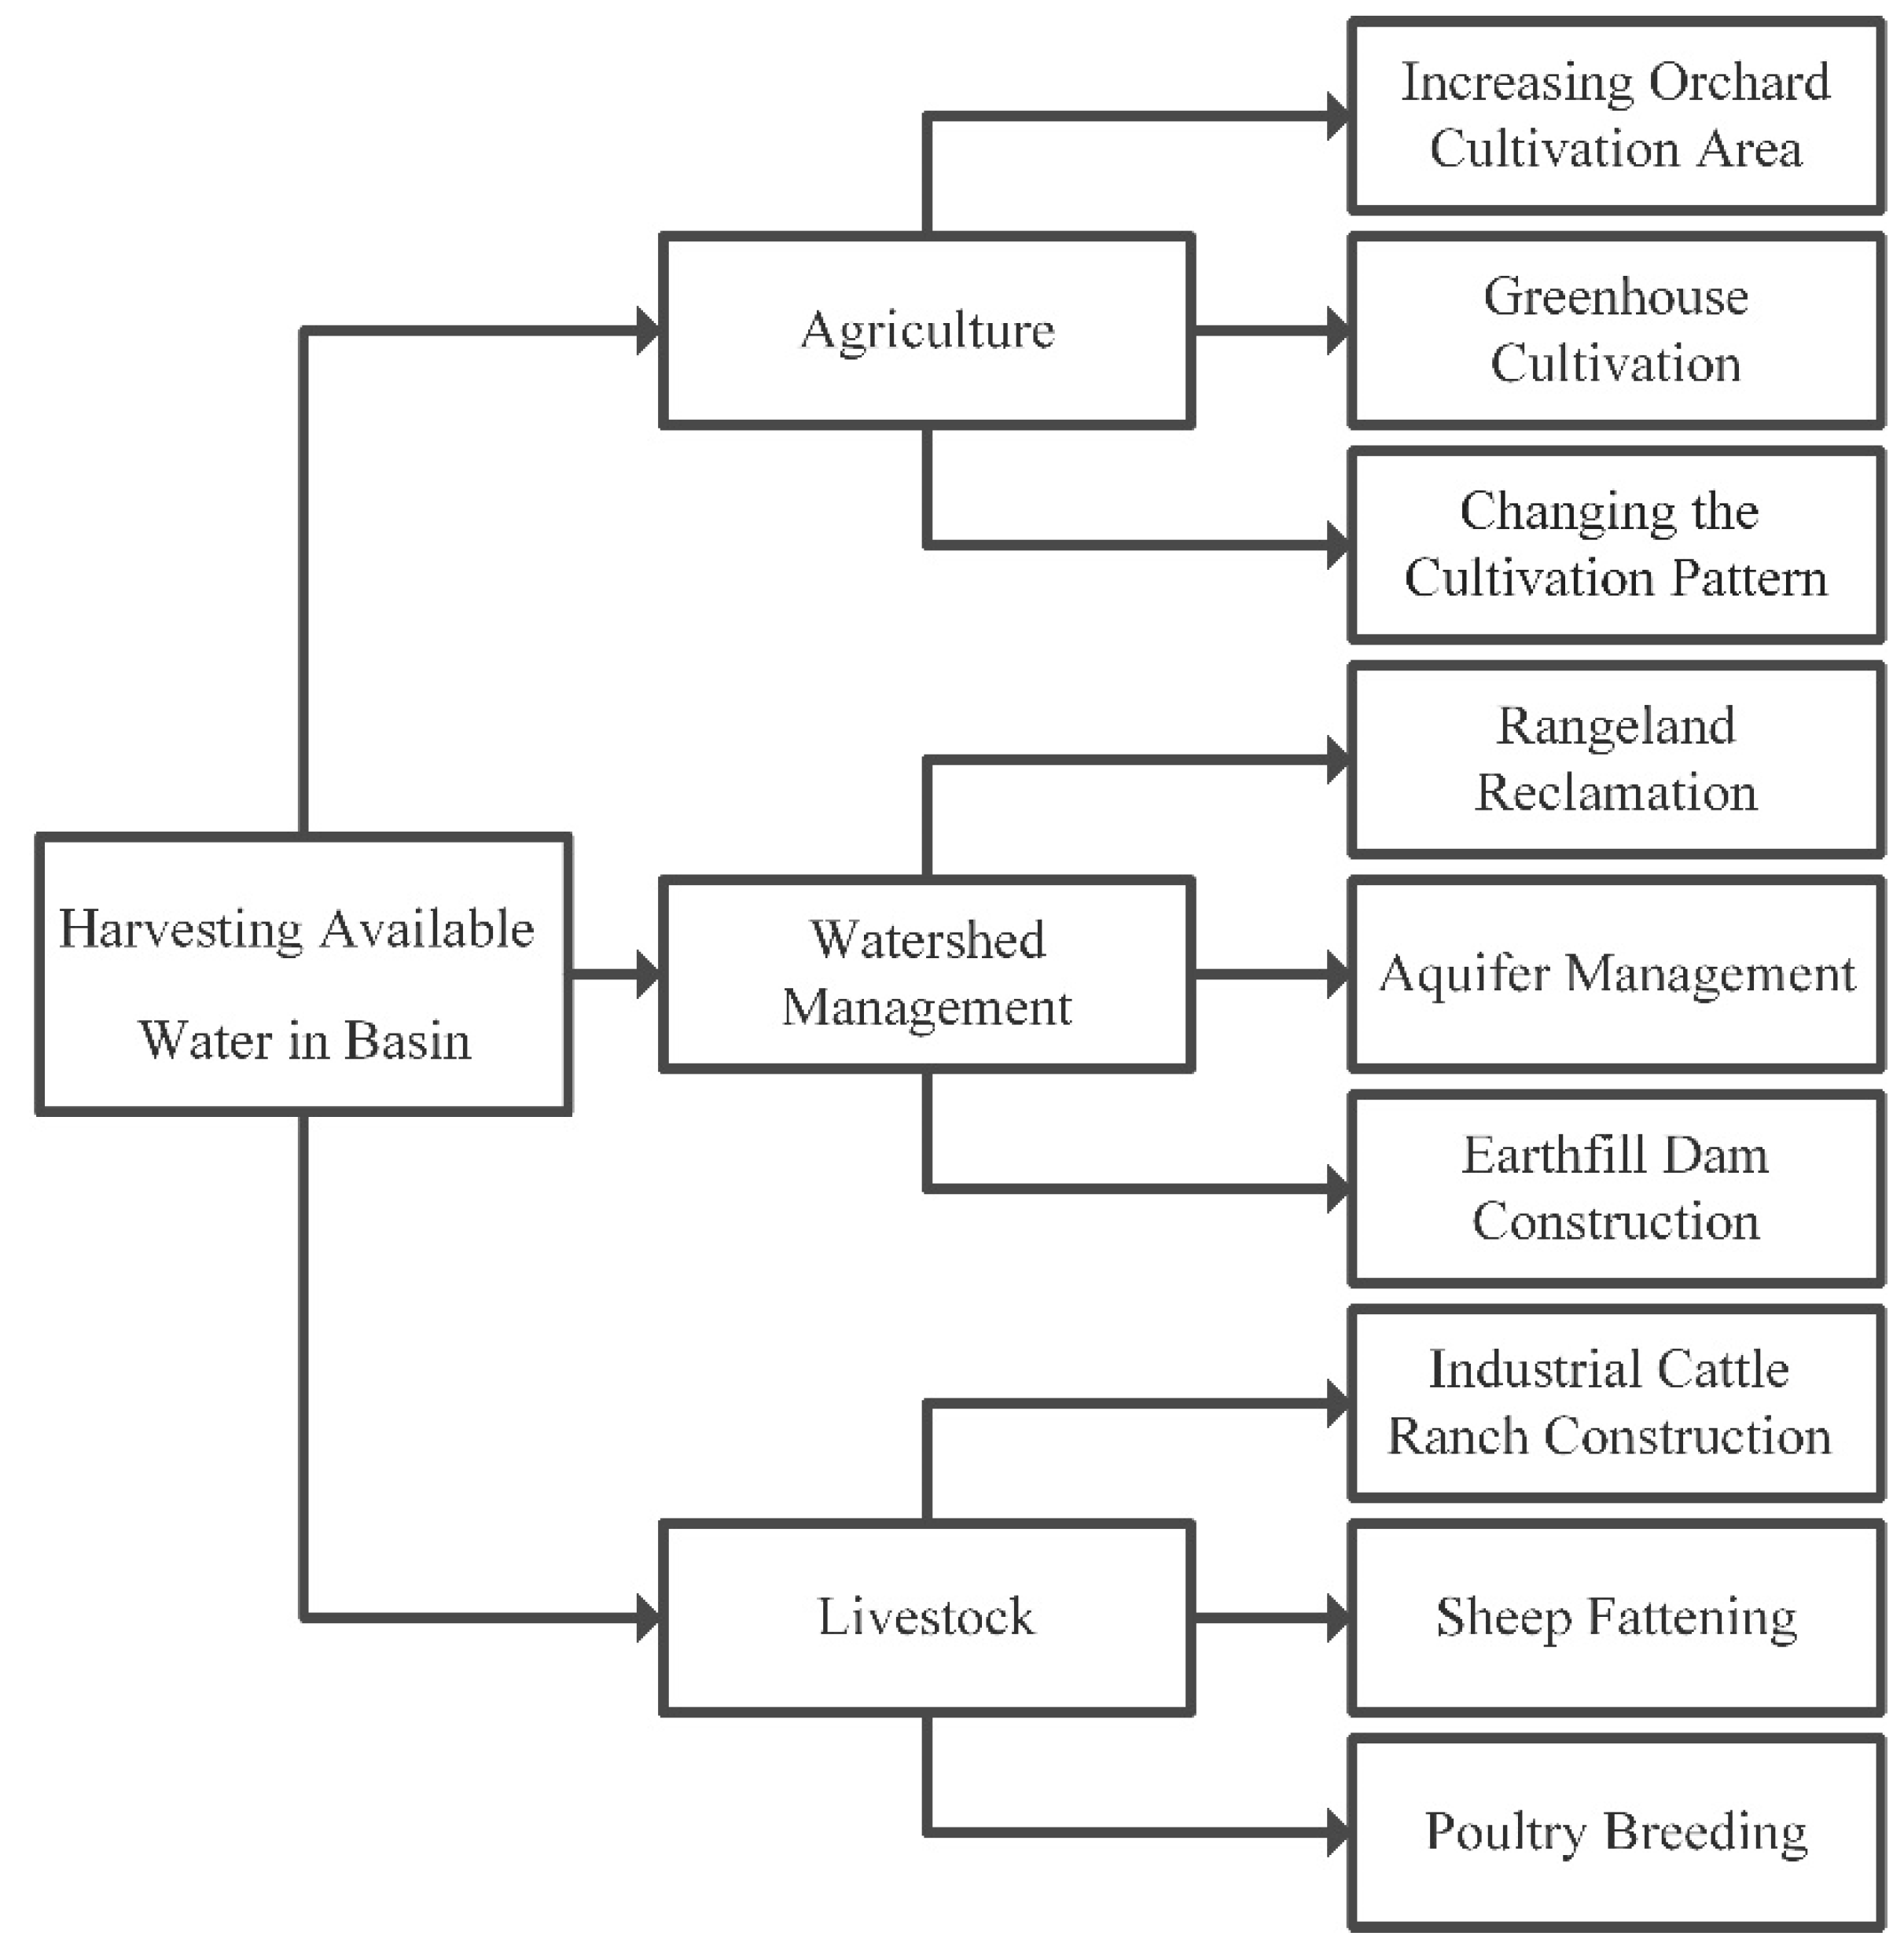
After quantifying the available water resources, analyzing water consumption patterns in different sectors, and examining soil properties and vegetation data, a decision hierarchy tree was developed. This hierarchical framework, depicted in
Figure 5, acts as a comprehensive guide for making decisions that consider these key factors. The next phase involved creating pairwise comparison tables, which were prepared for experts as detailed in
Table 4.
The fluctuating numbers of experts in various categories in the study context reflect the practical limitations of expert availability and accessibility. Nevertheless, the experts chosen for participation were selected based on their relevance to the evaluation criteria and their ability to offer valuable perspectives. While the quantity of experts in each field varies from one to four in the table provided, it is essential to consider the expertise and depth of knowledge of each individual within their respective field. For example, local farmers may not possess the same formal education level as individuals with an academic background in water resources management; however, they bring valuable experiential knowledge of the area and its potential. By involving experts from diverse fields and levels of expertise in the decision-making process, as well as including them in criteria weighting, the final assessment can benefit from a range of perspectives and considerations.
After collecting expert opinions through pairwise comparison matrices, the data were aggregated using the geometric mean method to create a consolidated matrix for inputting priorities into Expert Choice software and conducting weighting.
Table 5 illustrates the comparative weights of criteria and options. According to the findings, the incompatibility rates for pairwise comparisons of criteria such as agricultural, watershed management, and livestock options were 0.02, 0.002, and 0.007, correspondingly.
With all values being less than 0.1, the conducted pairwise comparisons are deemed to be consistent. Next, by multiplying the weight of each option within the respective criterion, the absolute weight of each option was calculated (
Table 6).
The utilization of the Analytic Hierarchy Process (AHP) in conjunction with remote sensing data has demonstrated its effectiveness in practical applications for watershed management [
34]. Through the incorporation of data from various sources including IMERG, ERA5-Land, and GLEAM, researchers can accurately predict precipitation, temperature, evapotranspiration, and runoff in areas without monitoring stations. The AHP methodology enables the prioritization of different water management approaches based on a range of criteria such as environmental impact, social considerations, and economic viability. By integrating remote sensing data with AHP, decision makers are empowered to make well-informed decisions that promote sustainable and efficient practices in watershed management.
As per the analysis conducted by experts and specialists, agriculture should be prioritized over other criteria in the Qaretikan river basin due to the timing of water distribution. Greenhouse construction has been assigned a high priority rank as it allows for cultivation throughout the year, reducing water consumption and enabling year-round growth. In the basin, water restrictions are only present during late spring and summer. Implementing greenhouses can help conserve water, boost economic and social development for locals, and extend agricultural activities beyond traditional growing seasons. Crops such as tomatoes, cucumbers, and peppers, which require limited water, are commonly grown in the province using 2–5 L of water per plant [
54].
If managers aim to enhance the agricultural sector, constructing greenhouses could be the most effective option. This could be followed by expanding orchard cultivation to reduce water loss, which is the second most important choice among all possibilities. The least important option in the agricultural sector is altering the cultivation pattern, which ranks sixth among all alternatives. By changing the cultivation pattern, farmers can utilize water-efficient seeds and crops with higher productivity and economic value. This not only supports farmers’ economic growth but also promotes sustainable agriculture.
Experts emphasize watershed management as a crucial priority, with rangeland reclamation being the primary solution to tackle the challenges posed by rugged terrain and seasonal flooding in the basin. Initiatives for rangeland reclamation have the potential to reduce flood risks, protect communities in the basin, and improve the quality of pastures for livestock grazing. This, in turn, can lead to higher livestock production and economic growth. The following priority in watershed management is aquifer management, which is ranked fifth among available options. This highlights the significance of utilizing groundwater during dry periods.
Since groundwater is utilized during periods of low precipitation, the implementation of small structures such as check dams and gabion dams can enhance water infiltration, restore pastures, and satisfy the water requirements of livestock. Turkey nest dams can be built in appropriate locations to gather water for livestock, while also promoting the cultivation of fruit gardens during droughts. Groundwater management initiatives not only improve water infiltration and elevate the groundwater table, but they also support domestic and wild animals by capturing runoff water in the basin, thereby aiding in the sustainability of ecosystems.
Reducing water consumption within the livestock industry is essential, particularly in sheep fattening, which benefits from expertise in the region. Improving practices in cattle and poultry farming, through a lower priority, supports the broader strategy for managing water resources and promoting sustainable agricultural development in the area.
Securing adequate funding presents a significant challenge in implementing the proposed options. In order to address this challenge, it is crucial to develop a strategic funding plan that aligns with the priorities identified through the AHP evaluation. The weighted options provide valuable insights into established priorities based on expert judgments and criteria considerations. By prioritizing funding allocation towards options with higher weights and priorities, e.g., greenhouse cultivation, we can ensure that resources are effectively utilized. The government or the Agriculture Organization of Khorasan Razavi could potentially support farmers by offering facilities such as free or low-interest loans. Diversifying funding sources by seeking government grants, private investments, and forming partnerships with agricultural organizations can strengthen sustainable agriculture initiatives. Crafting a detailed funding proposal that outlines objectives, expected outcomes, budget requirements, and timelines for each option is a practical approach to securing funding. Involving relevant stakeholders, including agricultural experts and local communities, in the funding process can help secure the necessary funds. By aligning effective funding strategies with prioritized options, we can bridge the gap between theory and practice, thus facilitating the implementation of agricultural innovations.
This study addresses concerns about potential data loss and increased uncertainty when combining qualitative expert opinions with quantitative remote sensing data, emphasizing the strengths and advantages of this approach. Despite some level of uncertainty, the satellite data utilized in the study accurately estimated water balance components, demonstrating reliability based on BIAS, CC, and RMSE assessments. This successful performance underscores the accuracy of remote sensing techniques and alleviates concerns regarding data quality. By incorporating both satellite data and expert opinions, this study offers valuable insights for areas without ground station measurements, filling critical data gaps. By prioritizing water resources based on expert input and geographical characteristics, the study ensures that uncertainties in estimating water availability do not hinder decision making. Overall, this study highlights the significance and advantages of combining qualitative and quantitative data in challenging data collection environments, resulting in meaningful outcomes and valuable insights.
4. Conclusions
The limited availability of meteorological and hydrological ground-based data has always posed a significant challenge to the management and planning of water resources. Utilizing remote sensing data and GIS can be instrumental in addressing this issue, particularly in areas where a sufficient ground monitoring network is lacking.
To gather essential data for conducting a water balance analysis in the ungauged Qaretikan basin, satellite datasets from reanalysis were leveraged in conjunction with remote sensing and GIS techniques. In general, the integration of ground-based validation and remote sensing methods was essential in ensuring the accuracy and credibility of the data utilized in this research. The thorough assessment procedure and the subsequent estimation technique, which relied on verified data sources, enhanced the dependability and integrity of the findings presented in this paper. Through this approach, information regarding soil, vegetation, precipitation, stream network, and basin slope was obtained through satellite data processing. Additionally, GIS was used to process and extract various layers and datasets related to temperature and evapotranspiration. The results of the evaluations indicated that the reanalyzed global temperature data accurately estimated the temperature of the basin. However, the satellite precipitation product showed lower accuracy in representing the precipitation data for the basin but still with an acceptable correlation. Based on the Justin method, the estimated annual inflow and runoff in the basin were approximately 15.9 and 1 MCM, respectively. Using the Lyon method, the annual environmental water demand required to sustain river stability was determined to be around 7.5 MCM. The annual water availability in the basin for various purposes was estimated to be about 11.8 MCM. The results highlighted the importance of prioritizing the design and implementation of a storage dam to meet agricultural water demands and manage flood risks effectively.
In order to effectively prioritize the utilization of available water resources in the basin, a hierarchical analysis approach was utilized in this study. After identifying possible criteria and options, expert opinions were weighted using pairwise comparison matrices.
The analysis has identified agriculture, particularly greenhouse construction, as a top priority in the Qaretikan river basin. Greenhouses offer benefits such as reduced water usage and year-round cultivation, which help address water restrictions during late spring and summer. Other priorities include expanding fruit gardens, utilizing water-efficient seeds, and implementing watershed management strategies such as rangeland reclamation to manage the basin’s rugged terrain and seasonal flooding. Managing aquifers, including small-scale interventions like check dams, is also crucial for groundwater utilization during dry seasons. Reducing water consumption in the livestock sector, with a focus on sheep fattening, and improving cattle and poultry farming practices further support sustainable agricultural development in the basin.
This research demonstrated that integrating remote sensing and GIS techniques with multi-criteria decision-making methods proves to be a potent tool in assessing, managing, and planning water resources, particularly in unmonitored transboundary basins.
The study acknowledges the utility of satellite data in estimating water balance components in regions with sparse ground station measurements, while also raising doubts about the accuracy of results. It is recommended that researchers validate the method in areas with adequate runoff data from ground-based stations. Future research should concentrate on utilizing different satellite precipitation datasets to enhance the accuracy of rainfall analysis in the basin by incorporating the Justin method and combining both quantitative and qualitative data to address uncertainties in evaluating the effects of climate change on water resources in unmonitored basins. Furthermore, future research could focus on evaluating the efficacy of integrated water resource management strategies that combine indigenous knowledge, community involvement, and advanced technologies to encourage sustainable water utilization within unmonitored basins.

 ,
, 
