
Impact of COVID-19 Restrictions on Air Quality Levels in Samsun, Turkey †


Department of Meteorology, Faculty of Aeronautics and Astronautics, University of Samsun, 55200 Samsun, Turkey
†
Presented at the 4th International Electronic Conference on Atmospheric Sciences, 16–31 July 2021; Available online: https://ecas2021.sciforum.net .
Environ. Sci. Proc. 2021, 8(1), 6; https://doi.org/10.3390/ecas2021-10692
Published: 22 July 2021
(This article belongs to the Proceedings of The 4th International Electronic Conference on Atmospheric Sciences)
Abstract
:The outbreak of the novel coronavirus SARS-CoV-2 (hereafter COVID-19) has changed the daily routines of people around the world. The first case of COVID-19 was confirmed in December 2019, whilst it was confirmed on 11 March 2020 in Turkey. After the number of cases reached 4500 per day by 10 April, the government declared more restrictive lockdown measures for 31 metropolitan cities, which were implemented for the following weekends and national and religious holidays. The changes in the concentrations of CO, NOx, NO2 and PM10 during the period of these measures with respect to the pre-lockdown period and for different levels of measures for Samsun, the biggest city of the Karadeniz region, were investigated in this study. The daily mean concentrations of CO, NOx, NO2 and PM10 were obtained from Tekkekoy station due to it having data completeness greater than 95% for all pollutants. The average CO, NOx and NO2 concentrations during the lockdown period declined with respect to the pre-lockdown period, whilst PM10 increased by 3%. The average concentrations of all the pollutants decreased when the level of restrictions increased during the COVID-19 lockdown period. The number of days exceeding the WHO limit for PM10 was decreased during the lockdown period to 16 days with respect to the pre-lockdown period at 19 days. There was only a positive weak relationship between the mobility decrease rate and NO2 concentrations.
1. Introduction
The first positive case of SARS-CoV-2 (hereinafter COVID-19) was detected in Turkey on 11 March 2020. After the confirmation of the first case, some measures such as a stay-at-home order and restrictions on airway transportation were implemented by the Turkish government. However, the number of cases reached 4500 on 10 April. Then, more strict measures were applied for 30 crowded cities including Samsun. These measures were lockdown on the weekends, cancellation of intercity travel, etc.
Several studies declared an improvement in air quality due to the partial and total lockdowns related to COVID-19 [1,2,3,4,5,6,7]. The work of [4] showed that the improvement in air quality in Barcelona was related to the quarantine measures. The study of [6] investigated the improvement in ozone levels in Rio de Janeiro, Brazil. The work of [7] showed an increase in air quality in terms of the reduction in the concentrations of PM2.5, PM10, SO2, CO and NO2 in China. Moreover, Ref. [6] discussed the impact of the partial lockdown on the ozone levels in the city of Rio de Janeiro, Brazil. Additionally, the study of [4] showed that the quarantine measures led to an improvement in air quality in Barcelona. Studies in several European cities such as Barcelona, Istanbul, Madrid, Milan and Munich also reported an improvement in air quality. The work of [5] reported reductions in PM10 (32–43%), PM2.5 (19–47%), NO2 (29–44%), CO (40–58%) and SO2 (34–69%) in Istanbul, a megacity in Turkey.
Meanwhile, a few studies included mobility to understand the effect of traffic on air quality during the COVID-19 measures [8,9]. The work of [8] found a significant correlation between mobility and trends of PM2.5 and NO2 for Singapore. The study of [9] declared that mobility and airborne particulate matter have an impact on the risk of COVID-19 transmission.
Samsun, located in the central part of the Black Sea Region of Turkey, is the most crowded and developed city of the region. In this study, the change in air pollutant concentrations during the lockdown in Turkey was investigated. The effect of mobility was considered as well.
2. Materials and Methods
Samsun, located in the central part of the Black Sea Region of Turkey, is the most crowded and developed city of the region (Figure 1). Its population was 1,356,000 by the end of 2020 [10], and it is the 16th crowded city of Turkey. It is surrounded by the Black Sea in the north, Ordu city in the east, Tokat and Amasya in the south and Sinop and Çorum cities in the west. The city has an area of about 9725 km2, and 45% of this area is mountains, 37% plateaus and 18% plains.
There are 6 air quality monitoring stations in the city operated by the Central Black Sea Clean Air Center. However, only Tekkekoy station has data completeness greater than 95% during the period of the COVID-19 lockdown measures. PM10, CO, NOx and NO2 are monitored at Tekkekoy station. The information about Tekkekoy station is presented in Table 1. The change in the concentrations of air pollutants during the period of the COVID-19 lockdown measures and the number of exceedances of the limit values according to the World Health Organization [11] were calculated. According to the WHO guidelines, the limit for PM10 for 24 h is 50 µg/m3, while the NO2 limit for 1 h is 200 µg/m3. Therefore, only the exceedance numbers for PM10 and NO2 were calculated.
Some periods were defined according to the COVID-19 measures in order to conduct the comparison of air pollutant concentrations. Some periods were chosen to perform the comparisons of the pollutant concentrations. The period from 1 January to 17 March 2020 was defined as pre-lockdown, and the period from 18 March to 1 June 2020 was defined as lockdown. The changes in the concentrations of pollutants were analyzed for three different steps. Firstly, the change in concentrations and the exceedance numbers during the lockdown with respect to the pre-lockdown were investigated.
Secondly, the change in the concentration levels of air pollutants during the lockdown was investigated by dividing the lockdown period into two parts: the first one covers the dates where full lockdown measures were applied for metropolitan cities, and the second covers the remaining lockdown days. Thirdly, the concentrations during the lockdown were compared to the same period in the previous year.
In the last part of the study, mobility data of [12] were used to analyze the effect of mobility on the air quality. These data are represented as the percent change from a baseline in six categories. The baseline is the median value of mobility data covering the period from 3 January to 6 February 2020. The mobility data are explained in six different categories as introduced by [12], but only workplace mobility data were used to represent the traffic change.
3. Results
3.1. Comparison of Lockdown and Pre-Lockdown Periods
The daily concentrations of CO, NO2, NOx and PM10 for the period from 1 January to 1 June 2020 are shown in Figure 2. The decline in the concentrations of CO, NO2 and NOx are clear, while the change in the concentration of PM10 is not clear. The mean concentrations before the lockdown and during the lockdown are shown in Table 2. As shown in Table 2, the mean concentrations of CO, NO2 and NOx declined by 72, 37 and 35%, while the mean concentration of PM10 increased by 3% during the lockdown according to the period before the lockdown.
The numbers of exceedances for NO2 and PM10 are shown in Table 3. NO2 did not exceed the WHO limits for both the pre-lockdown and lockdown periods. PM10 concentrations exceeded the WHO limits 19 times before the lockdown and 16 times during the lockdown, although the mean concentrations of PM10 increased during the lockdown according to the pre-lockdown period. The days that exceeded the WHO limits decreased by 16% during the lockdown with respect to the pre-lockdown period.
3.2. Comparison of Sub-Periods in Lockdown Period
The mean concentrations of air pollutants during the period of the full lockdown measures and the remaining days and the percent change during the full lockdown days with respect to the remaining days are shown in Table 4. As shown in Table 4, the concentration of all the pollutants decreased. The CO concentration decreased just 1% during the period of the full lockdown measures with respect to the remaining days of the lockdown. NO2, NOx and PM10 decreased by 25, 20 and 18%, respectively.
3.3. Comparison of the Lockdown Concentrations with the Same Period of 2019
The mean concentrations of the air pollutants during the lockdown period and the same period in 2019 are shown in Table 5. NO2 concentrations did not change during the lockdown with respect to 2019. CO and NOx increased by 4 and 2.5%, respectively, whilst PM10 decreased by 21%.
3.4. Relationship between Mobility and Air Pollution
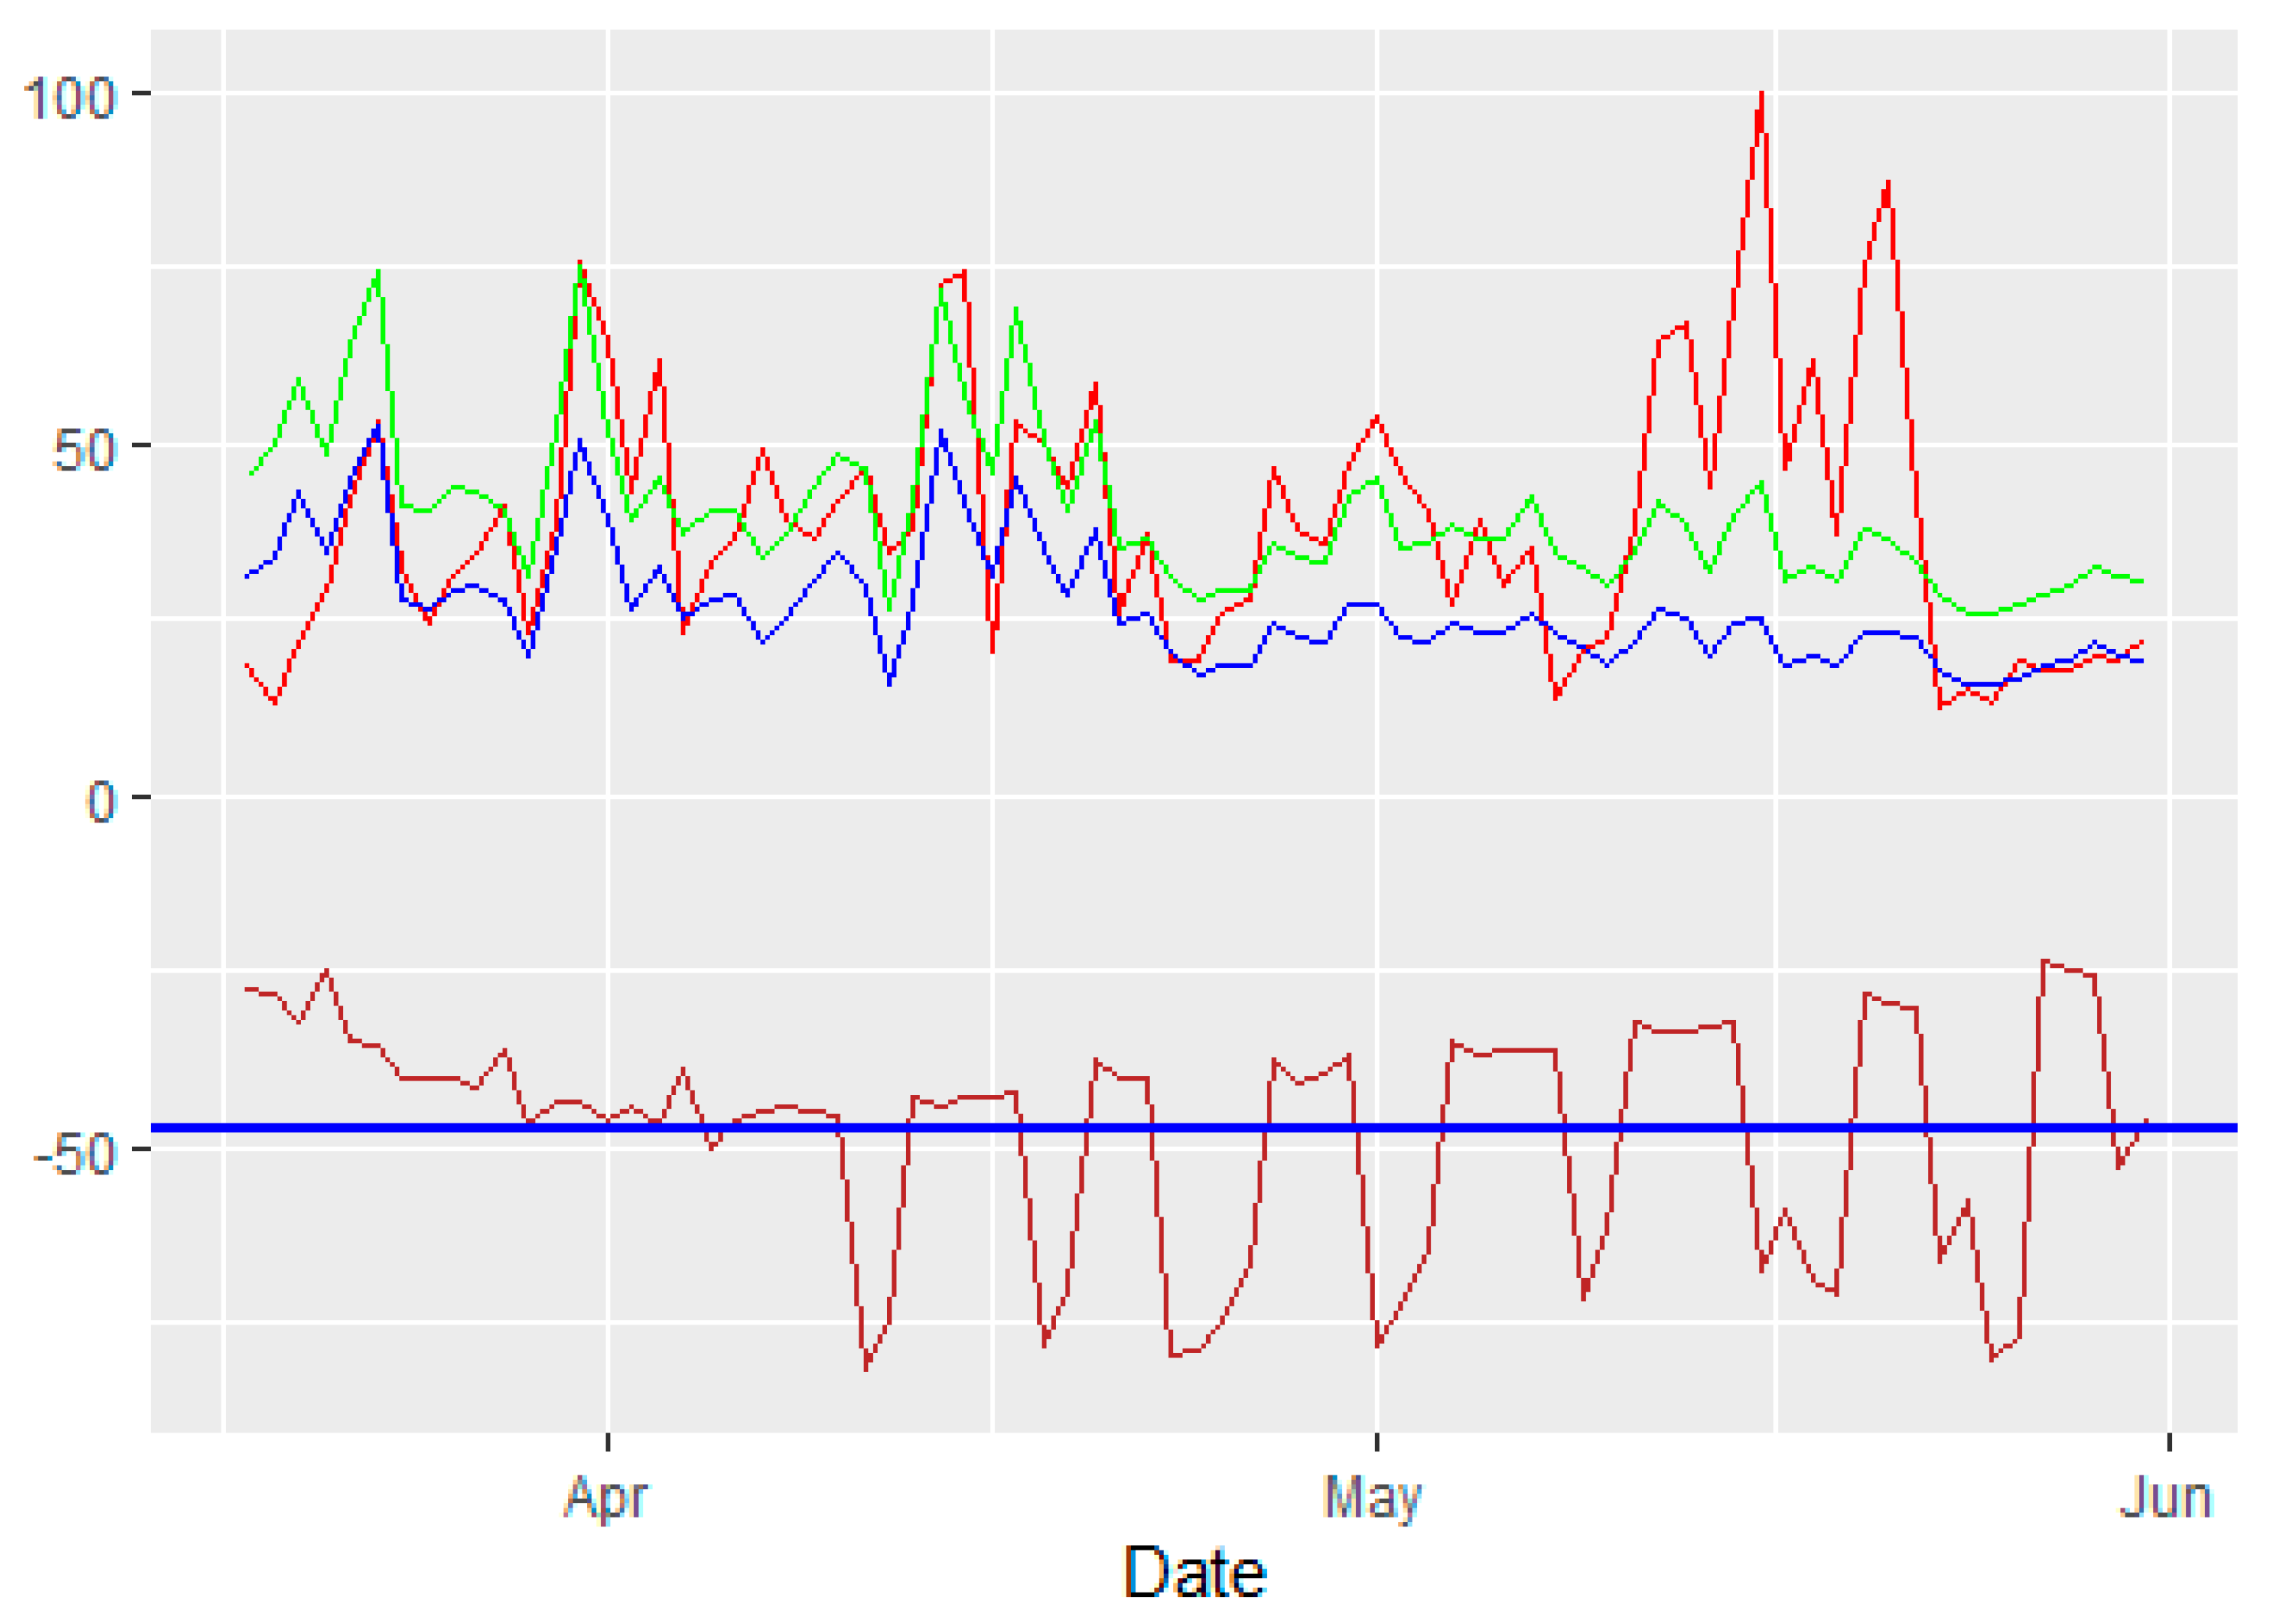
The time series of the mobility data and daily average NOx, NO2 and PM10 concentrations during the lockdown period is shown in Figure 3. The CO concentrations are not plotted due to the greater values of CO. As shown in Figure 3, the overall average of work mobility change in Samsun was 49%. The peak mobility values in the figure represent the full lockdown measures applied for metropolitan cities. During these peaks, declines in the mean concentration of the air pollutants are obvious.
The correlation between mobility change and pollutant concentrations was calculated and tested via Pearson’s test, and the results are shown in Table 6. The correlation coefficients between mobility and CO, NOx and PM10 were 0.15, 0.27 and 0.08, respectively, and were not statistically significant. The correlation coefficient between mobility and NO2 was 0.30, and it was statistically significant at the 99% confidence level.
4. Conclusions
The daily routines of people in all countries have been changed by COVID-19. In Turkey, after the confirmation of the first case on 11 March 2020, authorities implemented some rules such as shutting down airway transportation and moving to online education. However, by 10 April, the number of cases reached 4500, and more restrictive measures were imposed on 31 major cities including Samsun. The changes in the concentrations of CO, NOx, NO2 and PM10 in Samsun during the period of these measures and their relationship with the decrease in mobility were investigated in this study. The main findings are as follows:
- The mean concentrations of CO, NO2 and NOx declined by 72, 37 and 35%, while the mean concentration of PM10 increased by 3% during the lockdown according to the pre-lockdown period. The PM10 concentrations exceeded the WHO limits 19 times before the lockdown and 16 times during the lockdown, although the mean concentrations of PM10 increased during the lockdown according to the pre-lockdown period.
- The mean concentration of all the pollutants decreased during the period of the full lockdown measures compared to the remaining lockdown days at different levels. The CO concentration decreased just 1% during the period of the full lockdown measures with respect to the remaining days of the lockdown. NO2, NOx and PM10 decreased by 25, 20 and 18%, respectively.
- NO2 concentrations did not change during the lockdown with respect to 2019. CO and NOx increased by 4 and 2.5%, respectively, whilst PM10 decreased by 21%.
- The correlation between mobility change and pollutant concentrations was calculated and tested via Pearson’s test. Only the correlation coefficient between mobility and NO2 was statistically significant at the 99% confidence level, with a value of 0.30.
Institutional Review Board Statement
Not applicable.
Informed Consent Statement
Not applicable.
Data Availability Statement
The data presented in this study are available on request from the corresponding author.
References
- Baldasano, J.M. COVID-19 lockdown effects on air quality by NO2 in the cities of Barcelona and Madrid (Spain). Sci. Total Environ. 2020, 741, 140353. [Google Scholar] [CrossRef] [PubMed]
- Collivignarelli, M.C.; Abbà, A.; Bertanza, G.; Pedrazzani, R.; Ricciardi, P.; Miino, M.C. Lockdown for CoViD-2019 in Milan: What are the effects on air quality? Sci. Total Environ. 2020, 732, 139280. [Google Scholar] [CrossRef] [PubMed]
- Nakada, L.Y.K.; Urban, R.C. COVID-19 Pandemic: Impacts on the Air Quality during the Partial Lockdown in São Paulo State, Brazil. Sci. Total Environ. 2020, 730, 139087. [Google Scholar] [CrossRef] [PubMed]
- Tobías, A.; Carnerero, C.; Reche, C.; Massagué, J.; Via, M.; Minguillón, M.C.; Alastuey, A.; Querol, X. Changes in air quality during the lockdown in Barcelona (Spain) one month into the SARS-CoV-2 epidemic. Sci. Total Environ. 2020, 726, 138540. [Google Scholar] [CrossRef] [PubMed]
- Şahin, Ü.A. The Effects of COVID-19 Measures on Air Pollutant Concentrations at Urban and Traffic Sites in Istanbul. Aerosol. Air Qual. Res. 2020, 20, 1874–1885. [Google Scholar] [CrossRef]
- Siciliano, B.; Dantas, G.; Silva, C.M.; Arbilla, G. Increased ozone levels during the COVID-19 lockdown: Analysis for the city of Rio de Janeiro, Brazil. Sci. Total Environ. 2020, 737, 139765. [Google Scholar] [CrossRef] [PubMed]
- Xu, K.; Cui, K.; Young, L.H.; Hsieh, Y.K.; Wang, Y.F.; Zhang, J.; Wan, S. Impact of the COVID-19 Event on Air Quality in Central China. Aerosol. Air Qual. Res. 2020, 20, 915–929. [Google Scholar] [CrossRef] [Green Version]
- Li, J.; Tartarini, F. Changes in air quality during the COVID-19 lockdown in Singapore and associations with human mobility trends. Aerosol. Air Qual. Res. 2020, 20, 1748–1758. [Google Scholar] [CrossRef]
- Wang, B.; Liu, J.; Li, Y.; Fu, S.; Xu, X.; Li, L.; Zhou, J.; Liu, X.; He, X.; Yan, J.; et al. Airborne particulate matter, population mobility and COVID-19: A multi-city study in China. BMC Public Health 2020, 20, 1585. [Google Scholar] [CrossRef] [PubMed]
- TUIK. Turkish Statistical Institute, Population and Housing Census 2020. Available online: https://data.tuik.gov.tr/Bulten/DownloadIstatistikselTablo?p=D/iyuDY0YaNRJp8DX69ESortYsYRQss36XKkV5ynlsLTp4WYhvc8Woz6qEb2bTRj (accessed on 15 February 2021).
- World Health Organization (WHO). WHO Air Quality Guidelines for Particulate Matter, O3, Nitrogen Dioxide and Sulfur Dioxide: Global Update 2005, Summ. Risk Assess. 2006. Available online: http://apps.who.int/iris/bitstream/10665/69477/1/WHO_SDE_PHE_OEH_06.02_eng.pdf (accessed on 10 June 2021).
- Google. COVID–19 Community Mobility Reports. 2020. Available online: https://www.google.com/covid19/mobility/?hl=en-GB (accessed on 20 December 2020).
Figure 1.
Samsun and its location in Turkey.
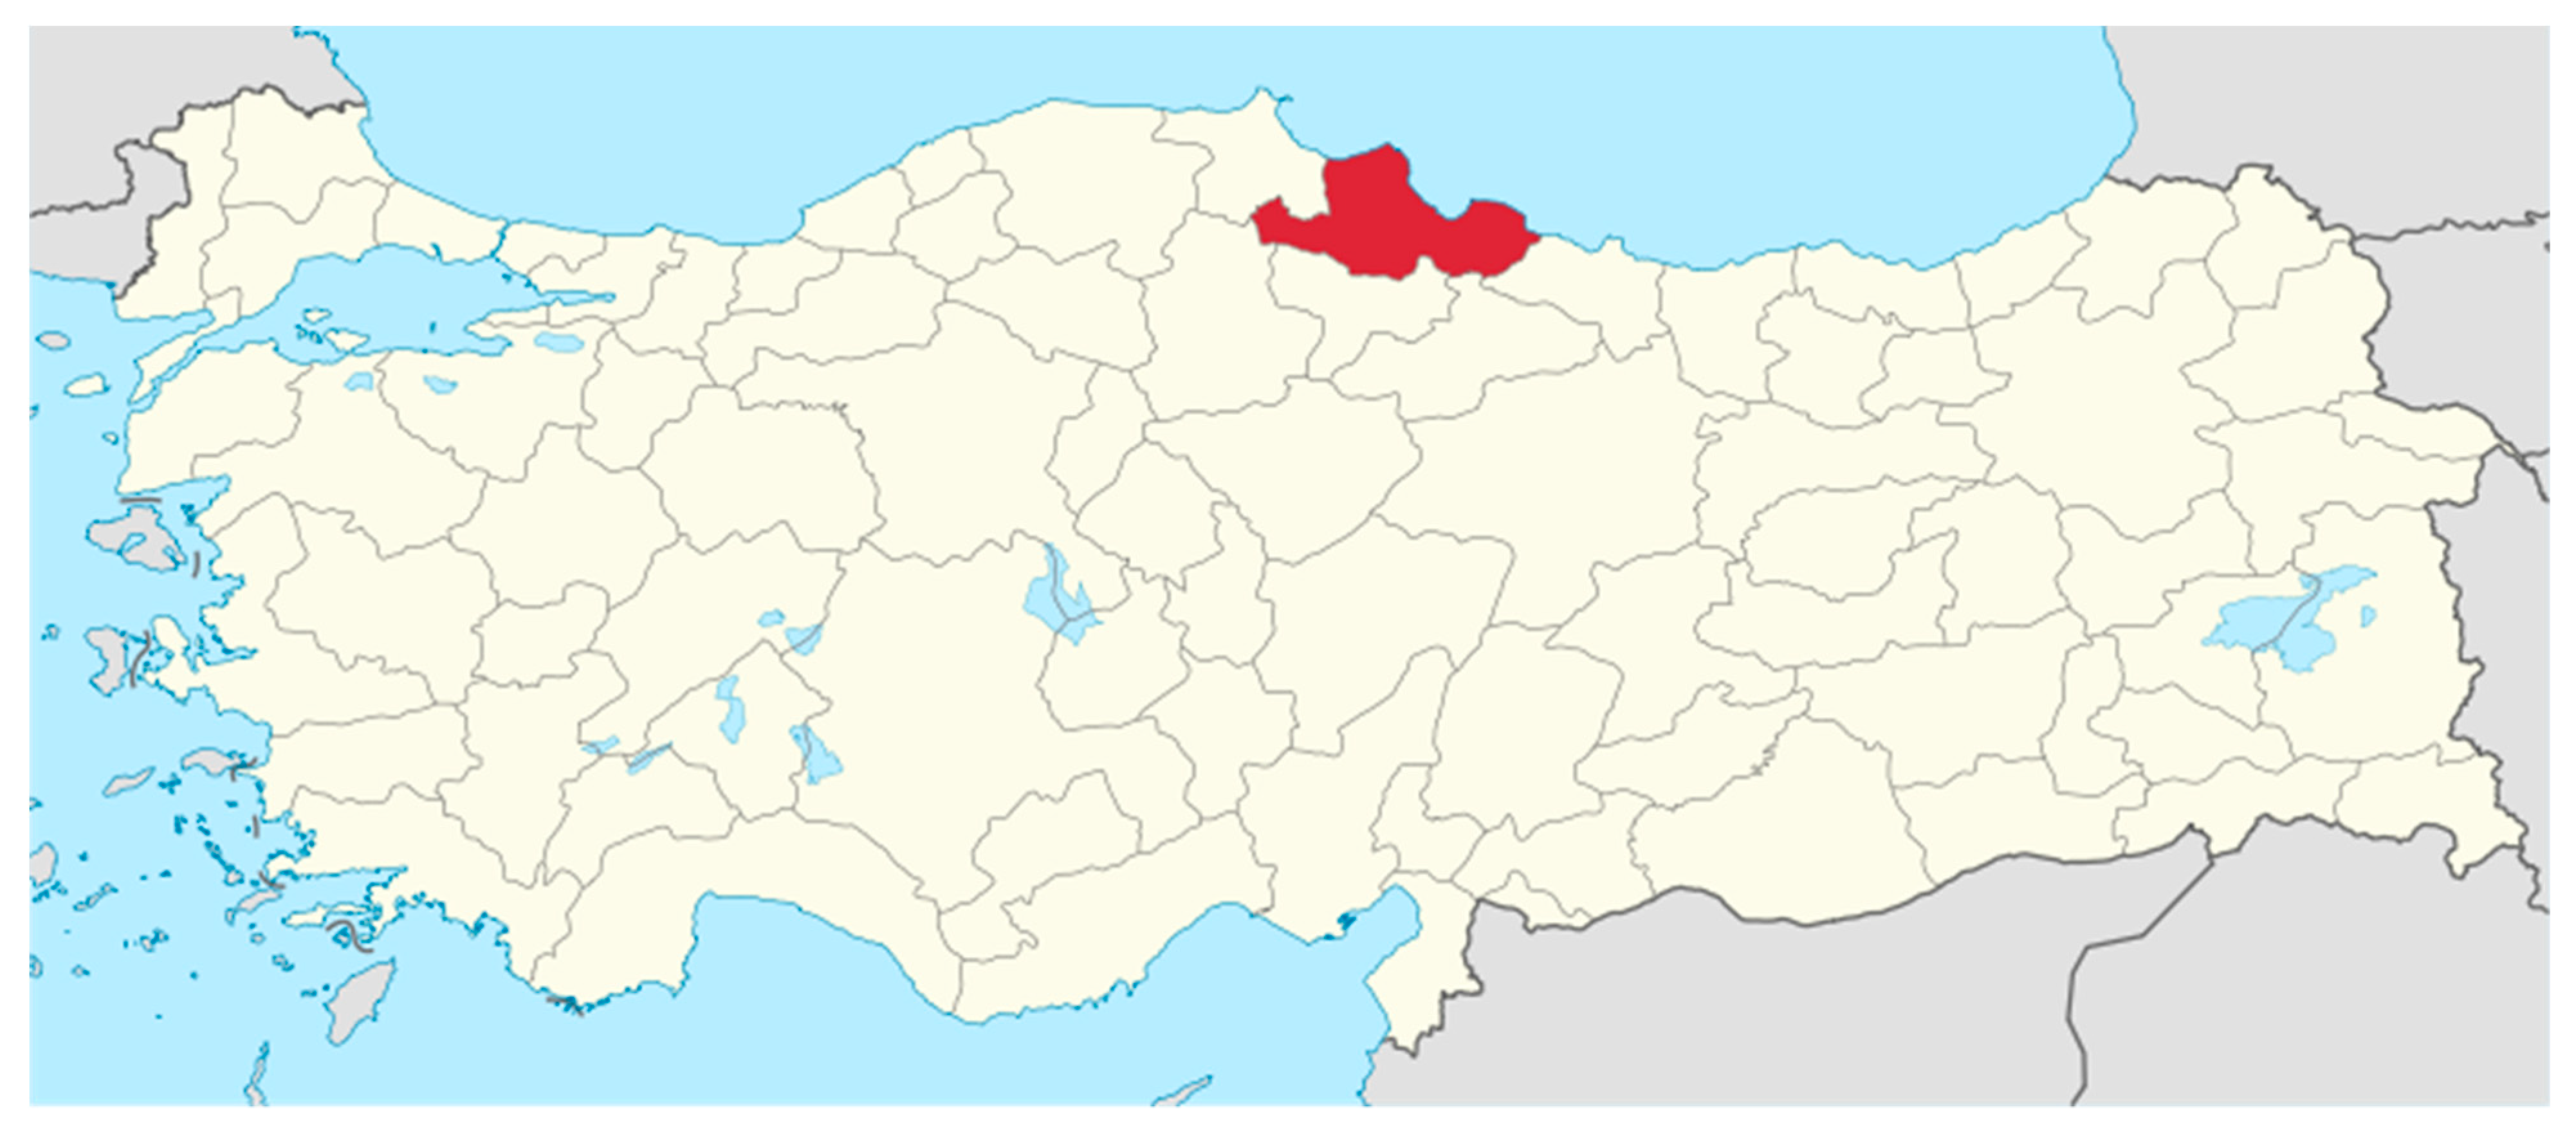
Figure 2.
The daily mean concentration of air pollutants from 1 January to 1 June 2020. The blue dashed vertical line represents the start of the measures, and the red dashed vertical line represents the end of the measures.
Figure 2.
The daily mean concentration of air pollutants from 1 January to 1 June 2020. The blue dashed vertical line represents the start of the measures, and the red dashed vertical line represents the end of the measures.
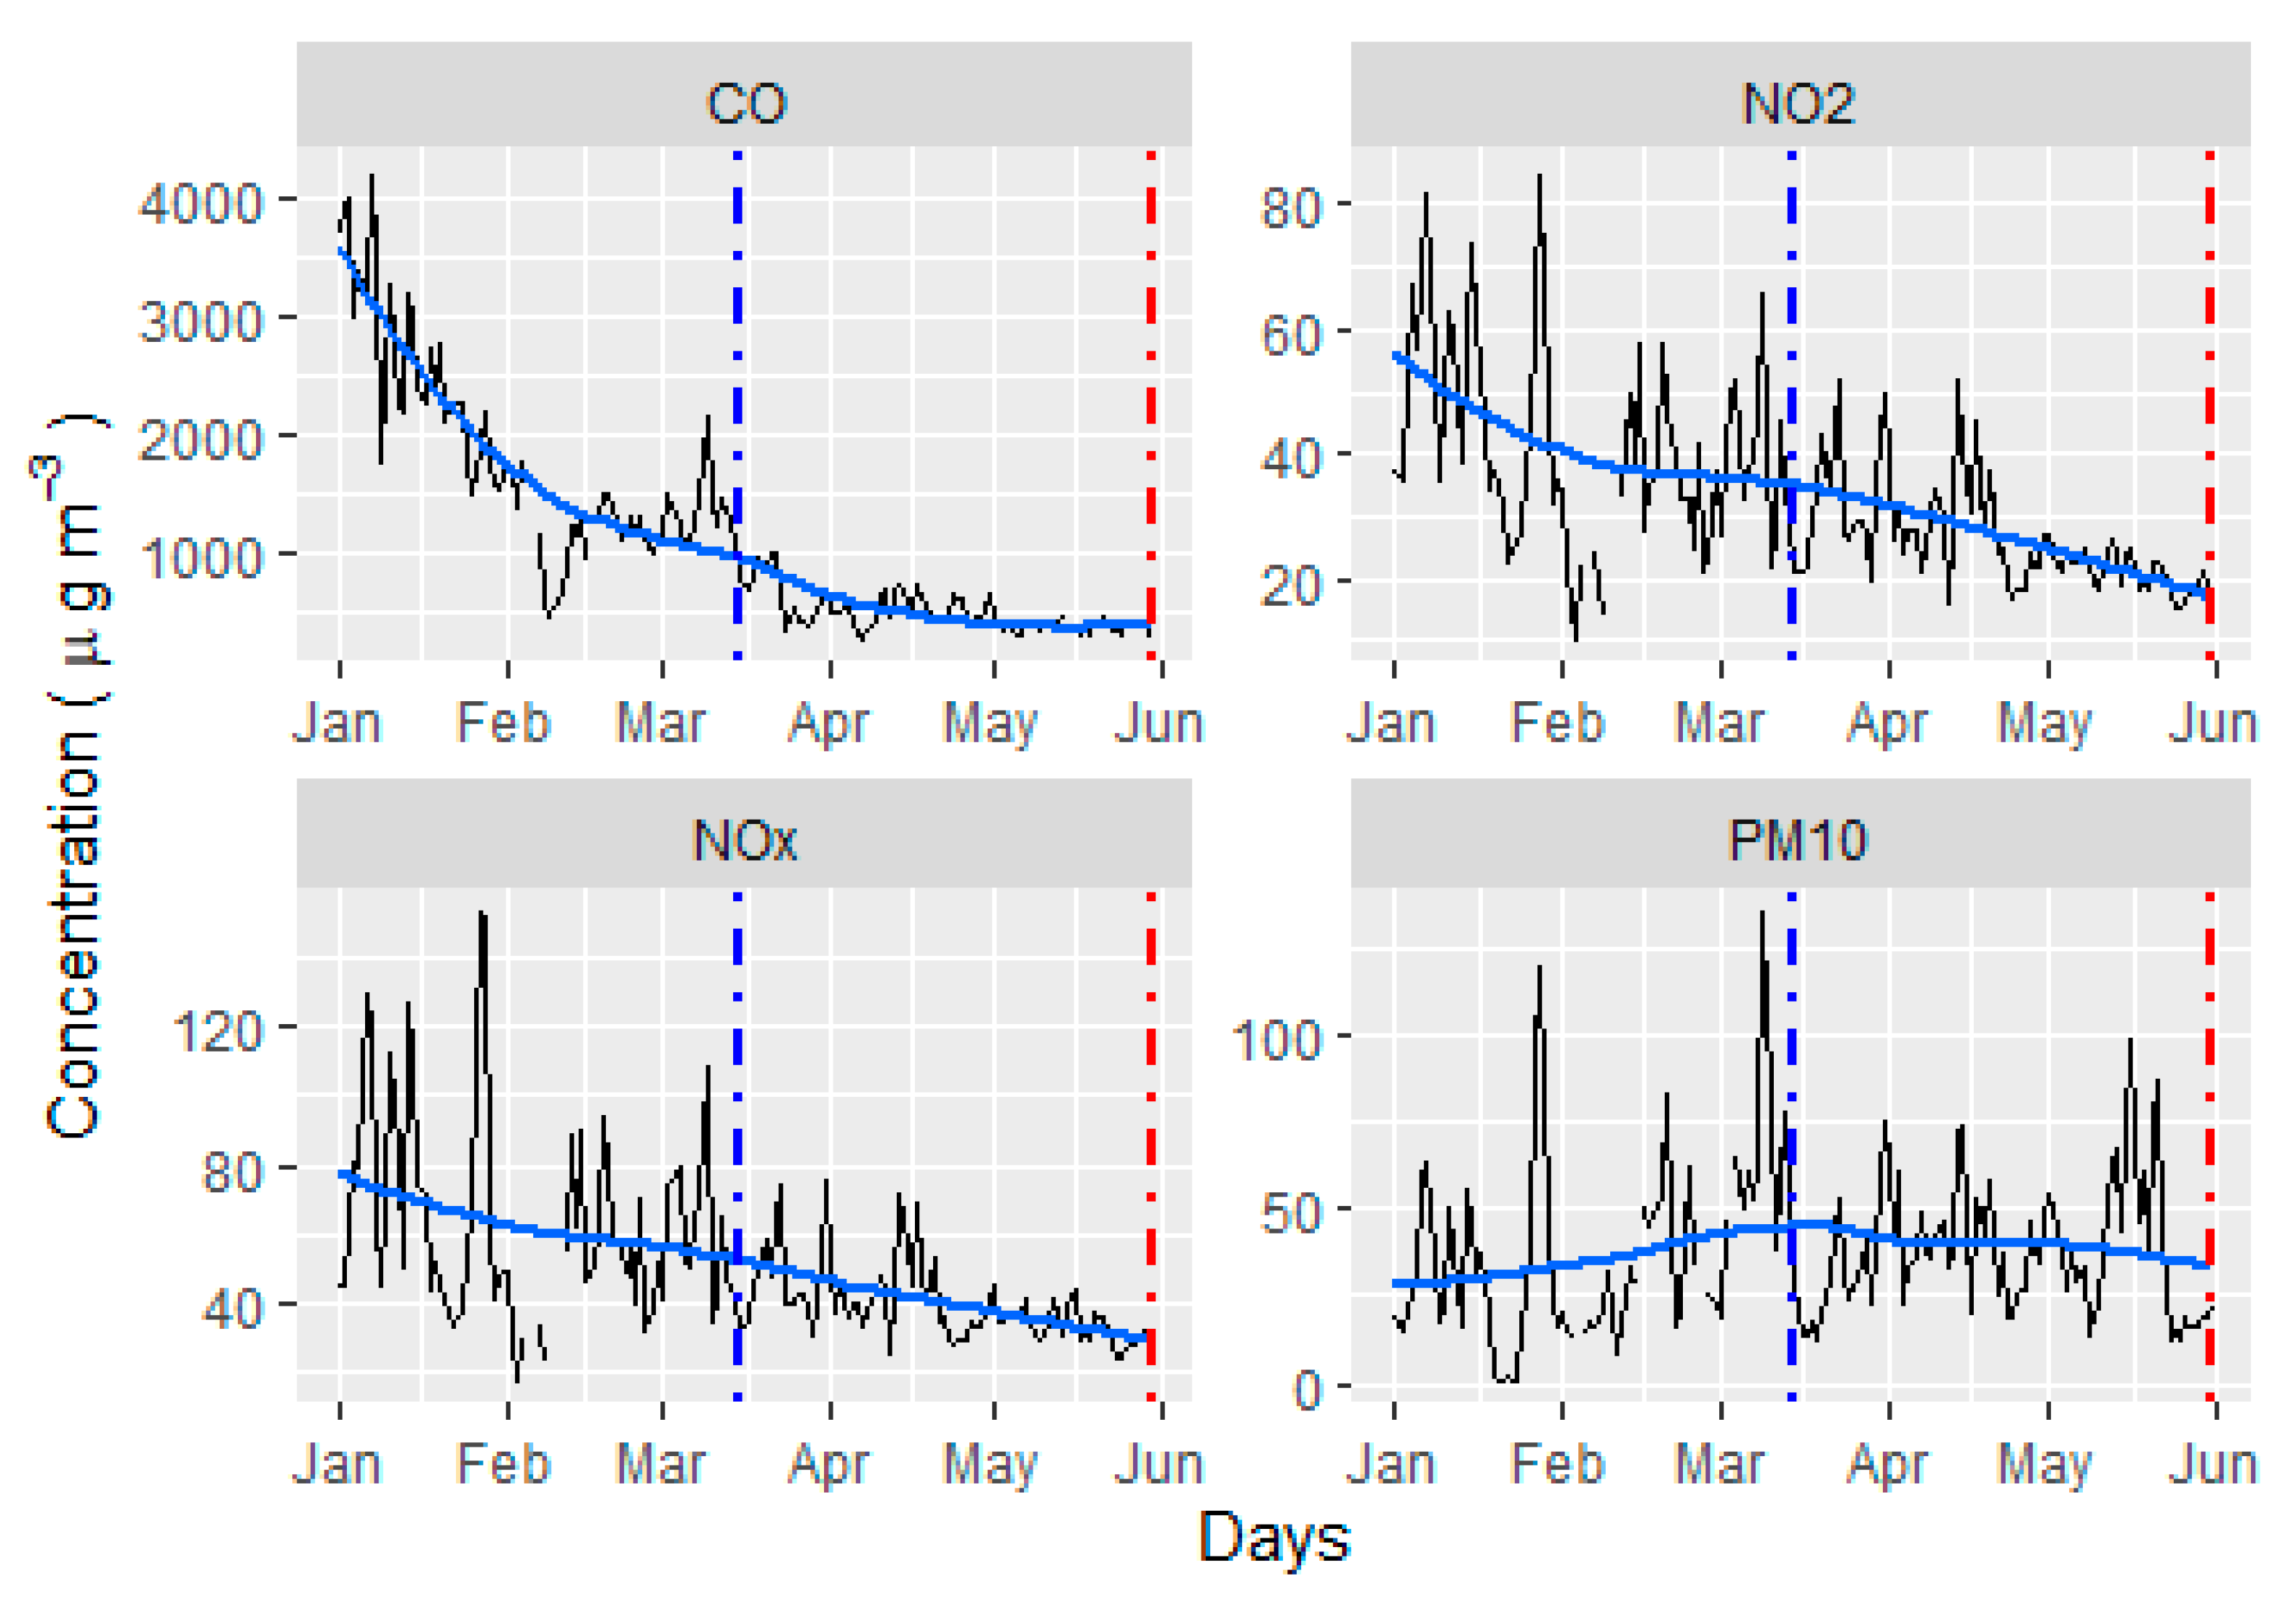
Figure 3.
Time series of the mobility during the LDM period with respect to 1 January–16 February 2020 (negative values on y axis, blue line represents the average mobility change during LDM period) and PM10 (red), NOx (green) and NO2 (blue) concentrations during LDM period (positive values).
Figure 3.
Time series of the mobility during the LDM period with respect to 1 January–16 February 2020 (negative values on y axis, blue line represents the average mobility change during LDM period) and PM10 (red), NOx (green) and NO2 (blue) concentrations during LDM period (positive values).

Table 1.
Description of the air pollutants at Tekkekoy station.
| Station | PM10 | CO | NOx | NO2 |
|---|---|---|---|---|
| Tekkekoy | 2019–2020 | 2019–2020 | 2019–2020 | 2019–2020 |
Table 2.
The mean concentrations before and during the lockdown and percent change.
| Pollutant | Before Lockdown (µg/m3) | Lockdown (µg/m3) | Change (%) |
|---|---|---|---|
| CO | 1807 | 496 | −73 |
| NO2 | 41 | 26 | −37 |
| NOx | 62 | 40 | −35 |
| PM10 | 37 | 38 | +3 |
Table 3.
Number of exceedances for NO2 and PM10.
| Pollutant | Before Lockdown | Lockdown | Change (%) |
|---|---|---|---|
| NO2 | 0 | 0 | - |
| PM10 | 19 | 16 | −16 |
Table 4.
The mean concentrations during the period of the full lockdown measures and the remaining days, and percent change.
Table 4.
The mean concentrations during the period of the full lockdown measures and the remaining days, and percent change.
| Pollutant | Full Lockdown Days (µg/m3) | Remaining Days (µg/m3) | Change (%) |
|---|---|---|---|
| CO | 497 | 491 | −1 |
| NO2 | 28 | 21 | −25 |
| NOx | 41 | 33 | −20 |
| PM10 | 40 | 31 | −18 |
Table 5.
The average pollutant concentrations during the lockdown and the same period of the previous year.
Table 5.
The average pollutant concentrations during the lockdown and the same period of the previous year.
| Pollutant | 2019 (µg/m3) | 2020 (µg/m3) | Change (%) |
|---|---|---|---|
| CO | 474 | 496 | +4 |
| NO2 | 26 | 26 | 0 |
| NOx | 39 | 40 | +2.5 |
| PM10 | 48 | 38 | −21 |
Table 6.
Pearson’s correlation coefficients between work mobility and pollutant concentrations.
| CO | NOx | NO2 | PM10 | |
|---|---|---|---|---|
| Correlation Coefficient | 0.15 | 0.27 | 0.30 * | 0.08 |
* denotes the correlation coefficient is statistically significant at 99% level.
Publisher’s Note: MDPI stays neutral with regard to jurisdictional claims in published maps and institutional affiliations. |
© 2021 by the author. Licensee MDPI, Basel, Switzerland. This article is an open access article distributed under the terms and conditions of the Creative Commons Attribution (CC BY) license (https://creativecommons.org/licenses/by/4.0/).
Share and Cite
MDPI and ACS Style
Efe, B. Impact of COVID-19 Restrictions on Air Quality Levels in Samsun, Turkey. Environ. Sci. Proc. 2021, 8, 6. https://doi.org/10.3390/ecas2021-10692
AMA Style
Efe B. Impact of COVID-19 Restrictions on Air Quality Levels in Samsun, Turkey. Environmental Sciences Proceedings. 2021; 8(1):6. https://doi.org/10.3390/ecas2021-10692
Chicago/Turabian StyleEfe, Bahtiyar. 2021. "Impact of COVID-19 Restrictions on Air Quality Levels in Samsun, Turkey" Environmental Sciences Proceedings 8, no. 1: 6. https://doi.org/10.3390/ecas2021-10692