Proceeding Paper

Assessing the Potential of a Long-Term Climate Forecast for Cuba Using the WRF Model †

by
Lourdes Álvarez-Escudero
1,*,
Yandy G. Mayor
2,
Israel Borrajero-Montejo
1 and
Arnoldo Bezanilla-Morlot
1
1
Institute of Meteorology, Havana 11700, Cuba
2
Centro de Investigación Científica y de Educación Superior de Ensenada CICESE, Ensenada 22860, Mexico
*
Author to whom correspondence should be addressed.
Presented at the 4th International Electronic Conference on Atmospheric Sciences, 16–31 July 2021; Available online: https://ecas2021.sciforum.net.
Environ. Sci. Proc. 2021, 8(1), 44; https://doi.org/10.3390/ecas2021-10338
Published: 22 June 2021
(This article belongs to the Proceedings of The 4th International Electronic Conference on Atmospheric Sciences)

Abstract

:
Seasonal climatic prediction studies are a matter of wide debate all over the world. Cuba, a mainly agricultural nation, should greatly benefit from the knowledge, which is available months in advance of the precipitation regime and allows for the proper management of water resources. In this work, a series of six experiments were made with a mesoscale model WRF (Weather Research and Forecasting Model) that produced a 15-month forecast for each month of cumulative precipitation starting at two dates, and for three non-consecutive years with different meteorological characteristics: one dry year (2004), one year that started dry and turned rainy (2005), and one year where several tropical storms occurred (2008). ERA-Interim reanalysis data were used for the initial and border conditions and experiments started 1 month before the beginning of the rainy and the dry seasons, respectively. In a general sense, the experience of using WRF indicated that it was a valid resource for seasonal forecast, since the results obtained were in the same range as those reported by the literature for similar cases. Several limitations were revealed by the results: the forecasts underestimated the monthly cumulative precipitation figures, tropical storms entering through the borders sometimes followed courses different from the real courses inside the working domain, storms that developed inside the domain were not reproduced by WRF, and differences in initial conditions led to significantly different forecasts for the corresponding time steps (nonlinearity). Changing the model parameterizations and initial conditions of the ensemble forecast experiments was recommended.

1. Introduction

Meteorological forecasting is a matter of utmost importance for social development. In recent decades, it is associated with the development in computer sciences and technologies, the so-called numerical forecasts always yield more truthful simulations of the atmospheric behavior, ranging from world to mesoscale area coverage, and from very short-term forecasts of a few hours to projections of about one hundred years. Sub-seasonal and seasonal forecasts are a matter of widespread discussion and research is in full development given the great number of factors involved in the performance of forecasting models which can generate uncertainties [1]. Seasonal forecasting lies beyond the deterministic time lapse and can only be achieved through a probabilistic approach. The main meteorological centers offering this kind of product do so based on ensembles of different sizes, where its members use global models of low resolution that are run with different sets of initial conditions [2]. In some cases, atmospheric models are coupled to oceanic models [3,4,5] and, in other cases, observed or forecasted sea surface temperature anomalies are taken into account [6,7,8], as they are the main forcing factors in this scale. Since the establishment of the predictability of “El Niño”, event [9,10] bases were settled for the development of operational seasonal forecasts.
A mainly agricultural country such as Cuba should greatly benefit from the knowledge which is available months in advance of the precipitation regime. However, the only precedents of seasonal forecasts so far are found in the work of Cárdenas [11], who established a system of monthly cumulative precipitation forecasts up to 6 months in advance, based on multiple linear regression. In this forecasting system, the sea surface temperature is included among the predictors as a teleconnection index and as an extreme temperature and cumulative precipitation forecast service that is currently operational for the whole country and three regions within it. This forecast operates 1 month in advance, based on global models results offered by IRI (International Research Institute for Climate and Society) and expert criteria (http://www.insmet.cu/asp/genesis.asp?TB0=PLANTILLAS&TB1=PCLIMA&TB2=/clima/pronosticoclimatico.htm accessed on 14 October 2013). Some effort has been made to carry sensibility studies with different parameterizations for variables such as precipitation, temperature and wind in the summer season using the RegCM model for the Caribbean region [12].
If the information from the global supply of seasonal precipitation models for Cuba is analyzed, the results are of scarce and litle detail; due to the narrow and elongated shape of the island approximately only 11 grid points lie over the Cuban territory. In these circumstances, regional models should supply the added value of an improved representation of local and regional climatic processes [13]. The concept of downscaling follows the basic principle that regional models should not alter climatic simulations at scales that can be successfully represented at the resolutions of global models [14,15], while smaller xcale features such as precipitation [16] and coastal winds [17] are found to typically improve in the results of regional models. To determine how robust the added details are, systematic experimentation is needed with different regional and global climate models [18], which constitutes a further motivation for ensemble forecasting studies [19,20,21].
Therefore, the objective of this work is to make a preliminary assessment of the accuracy and cumulative precipitation behavior of WRF as a regional model for the seasonal precipitation forecast in Cuba through experiments carried out over periods. This introduction briefly places the study in a broad context and defines the purpose of the work and its significance.

2. Materials and Methods

2.1. Design of Experiments

The numerical model selected for the proposed experiments was the WRF (Weather Research and Forecasting Model) Version 3.5.1 [22], a widely known open-source numerical model. There is already a working experience in Cuba with this model in short and mid-range forecasts.
Initial and border conditions were supplied by ERA-Interim reanalysis data (European Center for Medium-Range Weather Forecasts Re-Analysis), with a time resolution of 6 h, approximately 75 km horizontal grid size and 60 vertical levels. These data were obtained from a ground–oceanic–atmospheric coupled model with 4d variational assimilation [23,24,25]. Elevation and land use data were assimilated from the U.S. Geological Survey (USGS) with 30” and ~900 m resolution, which are available from the WRF website: http://www2.mmm.ucar.edu/wrf/users/download/get_sources_wps_geog.html (accessed on 23 September 2013). Figure 1 shows the simulation domain used in this study. It had a spatial resolution of 25 km and covered a region with coordinates between 8°03′ N and 34°03′ N and between 62°09′ W and 99°34′ W. Figure 1 also shows the section of the domain used for evaluation, which surrounds Cuba and the nearby sea areas. Table 1 shows the set of main configuration options for WRF applied in the simulations.

2.2. Real Data and Evaluation Methodology

The TRMM (Tropical Rainfall Measuring Mission) database and values of the mean cumulative monthly precipitation from the National Network of Stations of the Institute of Meteorology of Cuba (RE-INSMET), as well as those from the National Institute of Hydraulic Resources, were used to evaluate the accuracy of the precipitation forecasts from WRF. These data corresponded to the area under study, as shown in Figure 1. The evaluation using the TRMM data was made in two different ways: one method considered all grid points within the area and the other considered only grid points that were inland. For the stations networks, mean values for the whole territory were calculated, yielding figures that were representative of the whole country. These were compared with the mean monthly cumulative values for each network and with the mean monthly cumulative values obtained from the inland TRMM grid points. In all cases the Pearson correlation coefficient and the mean square error were used as comparison parameters.

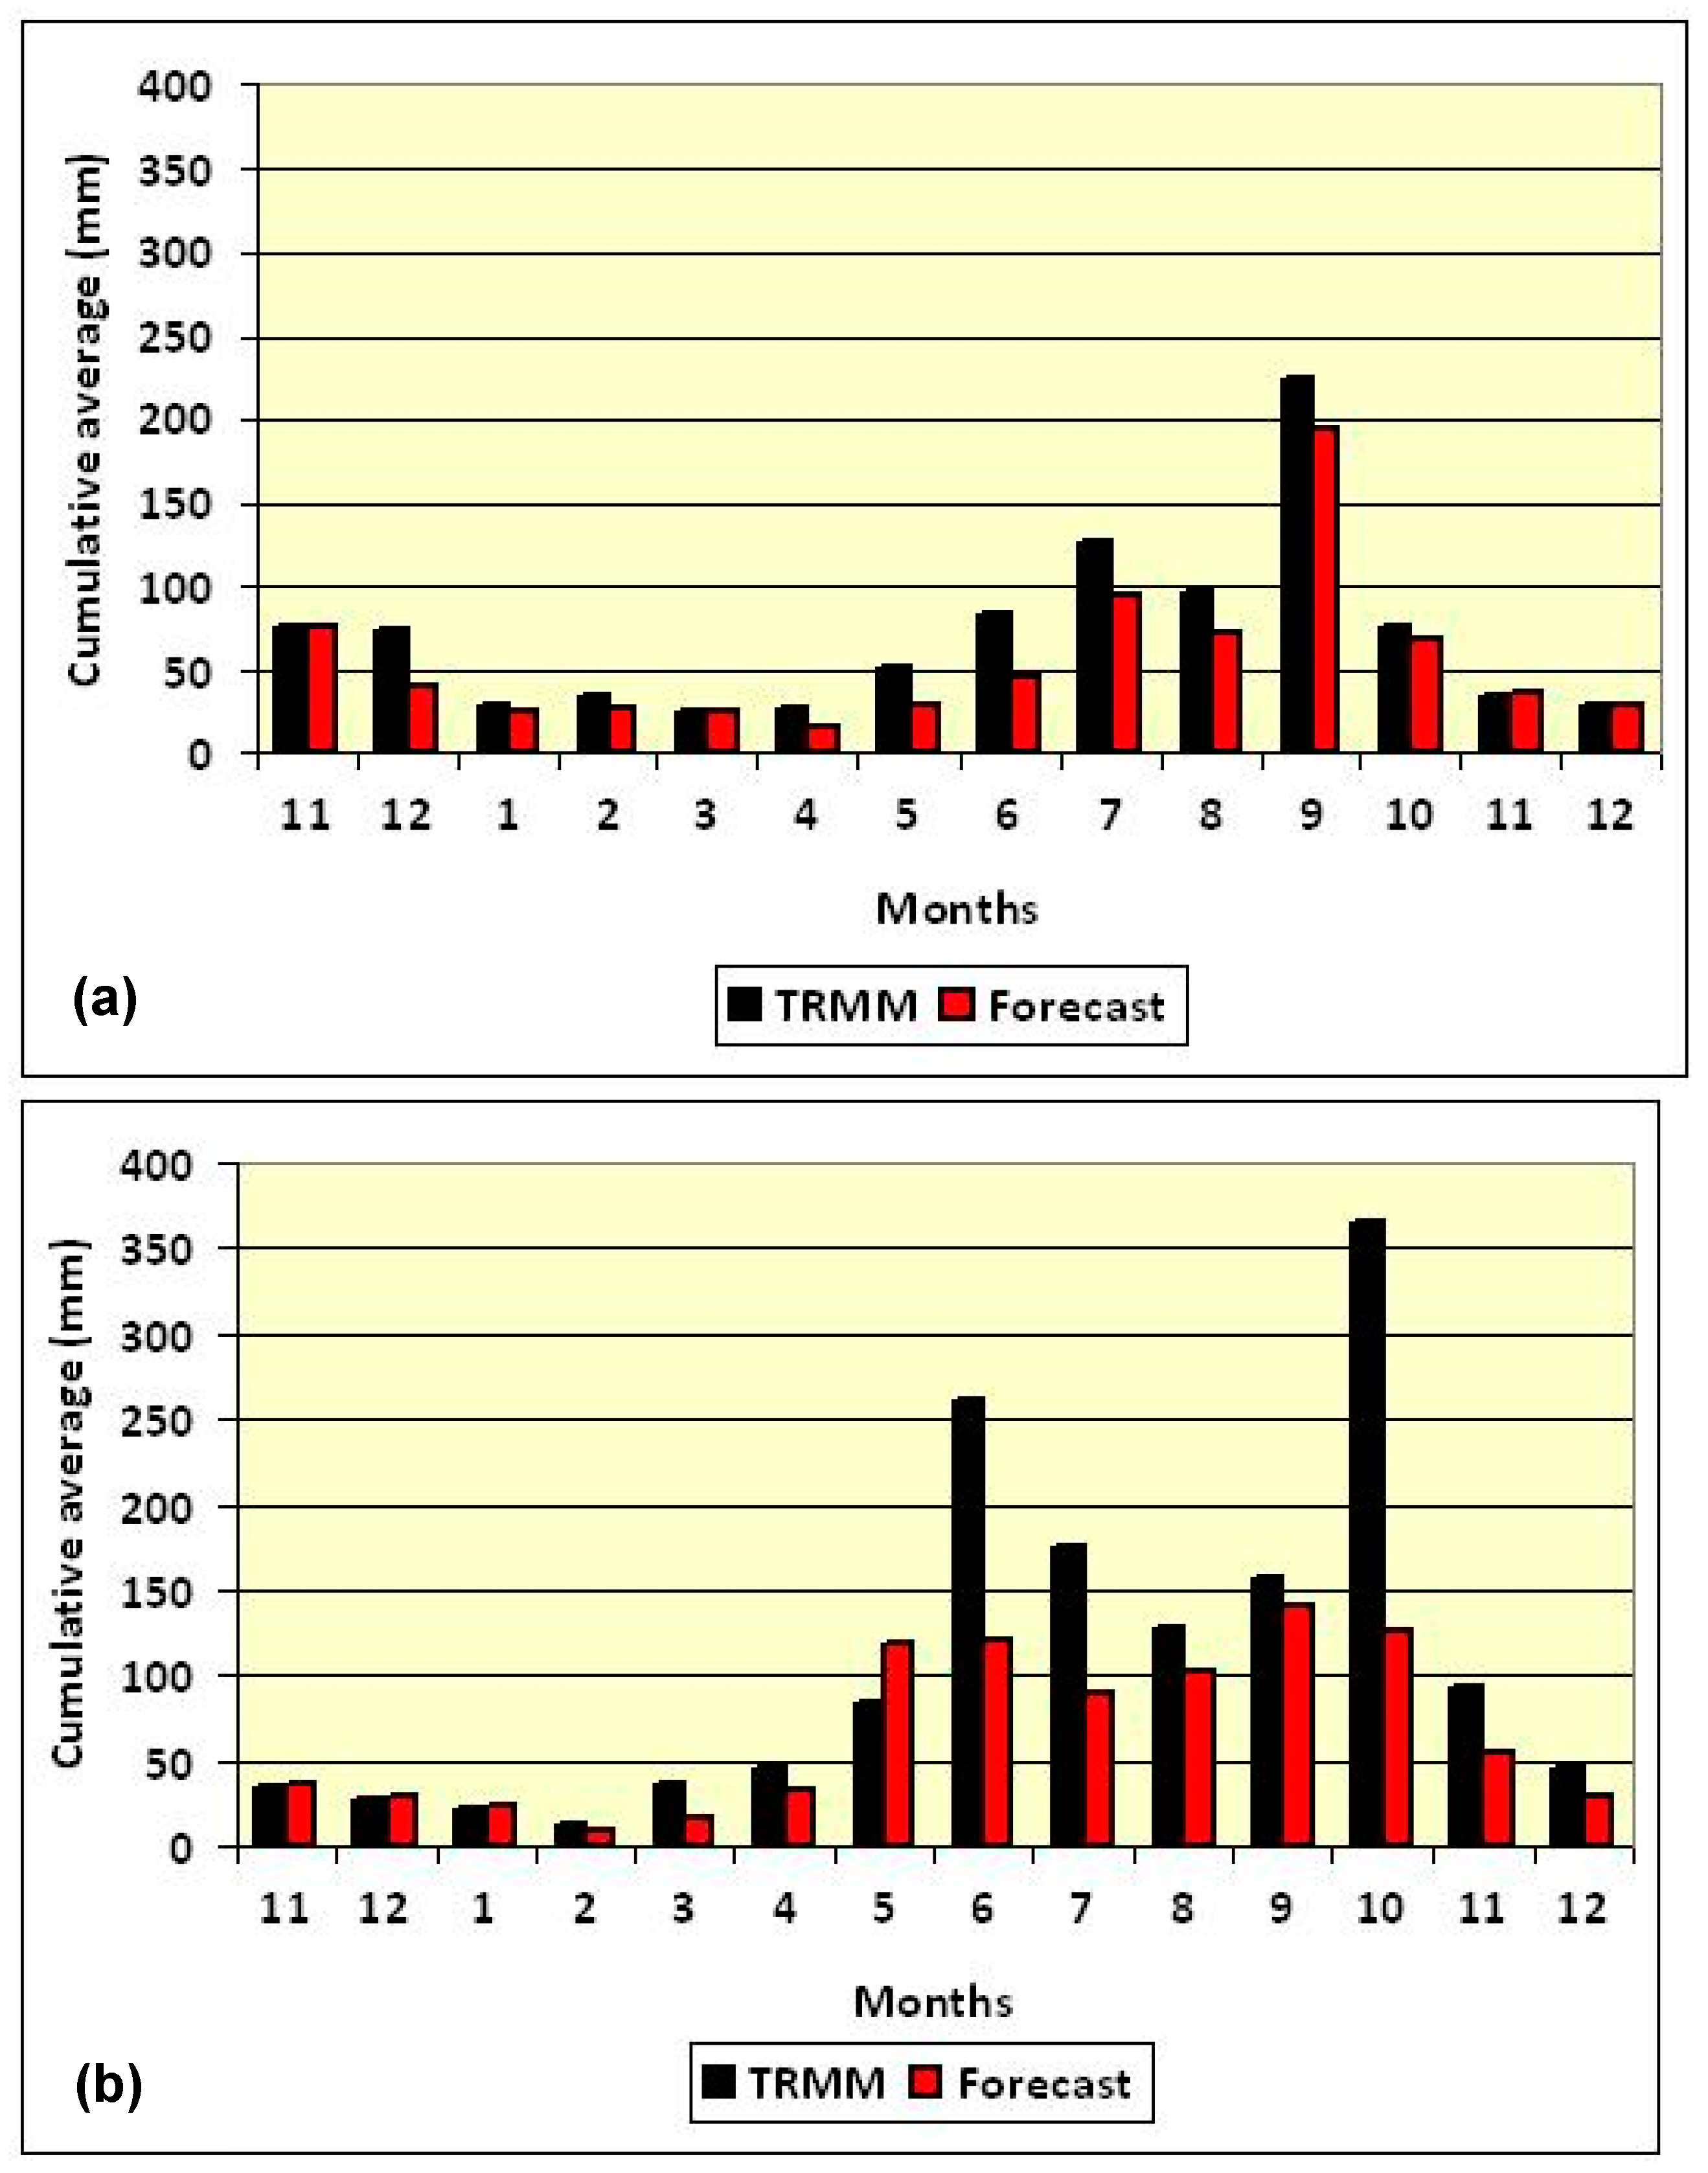
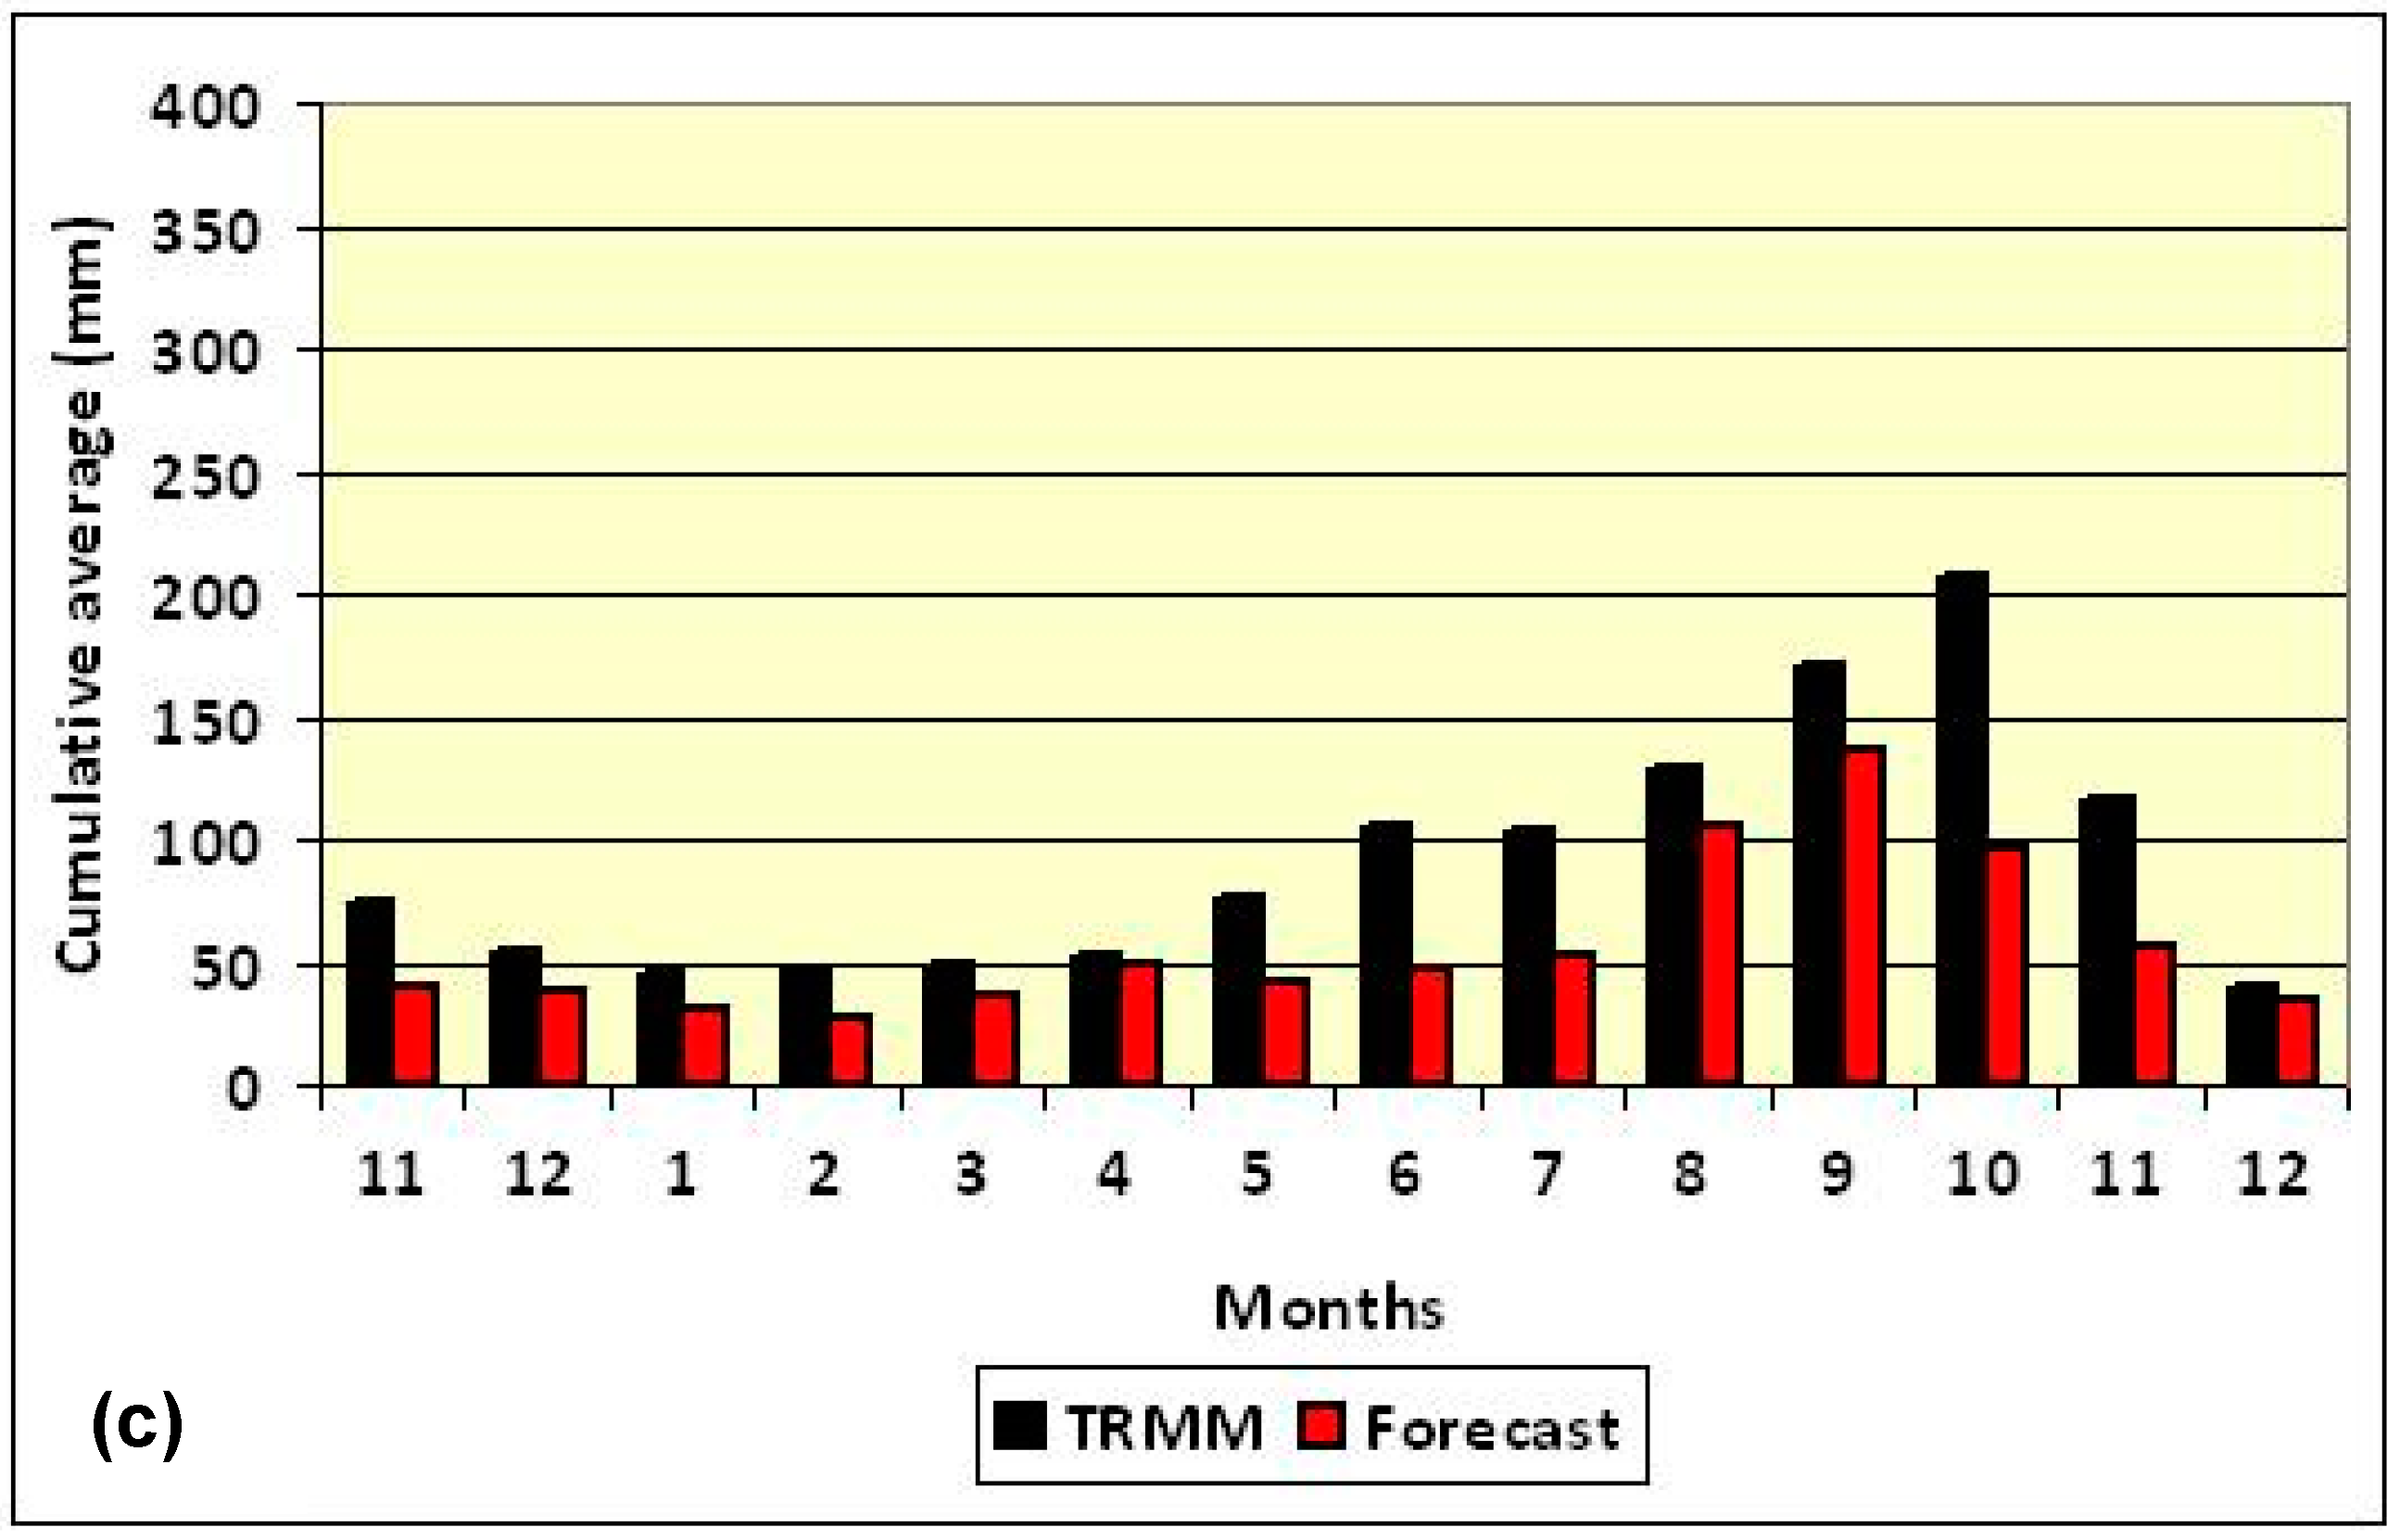
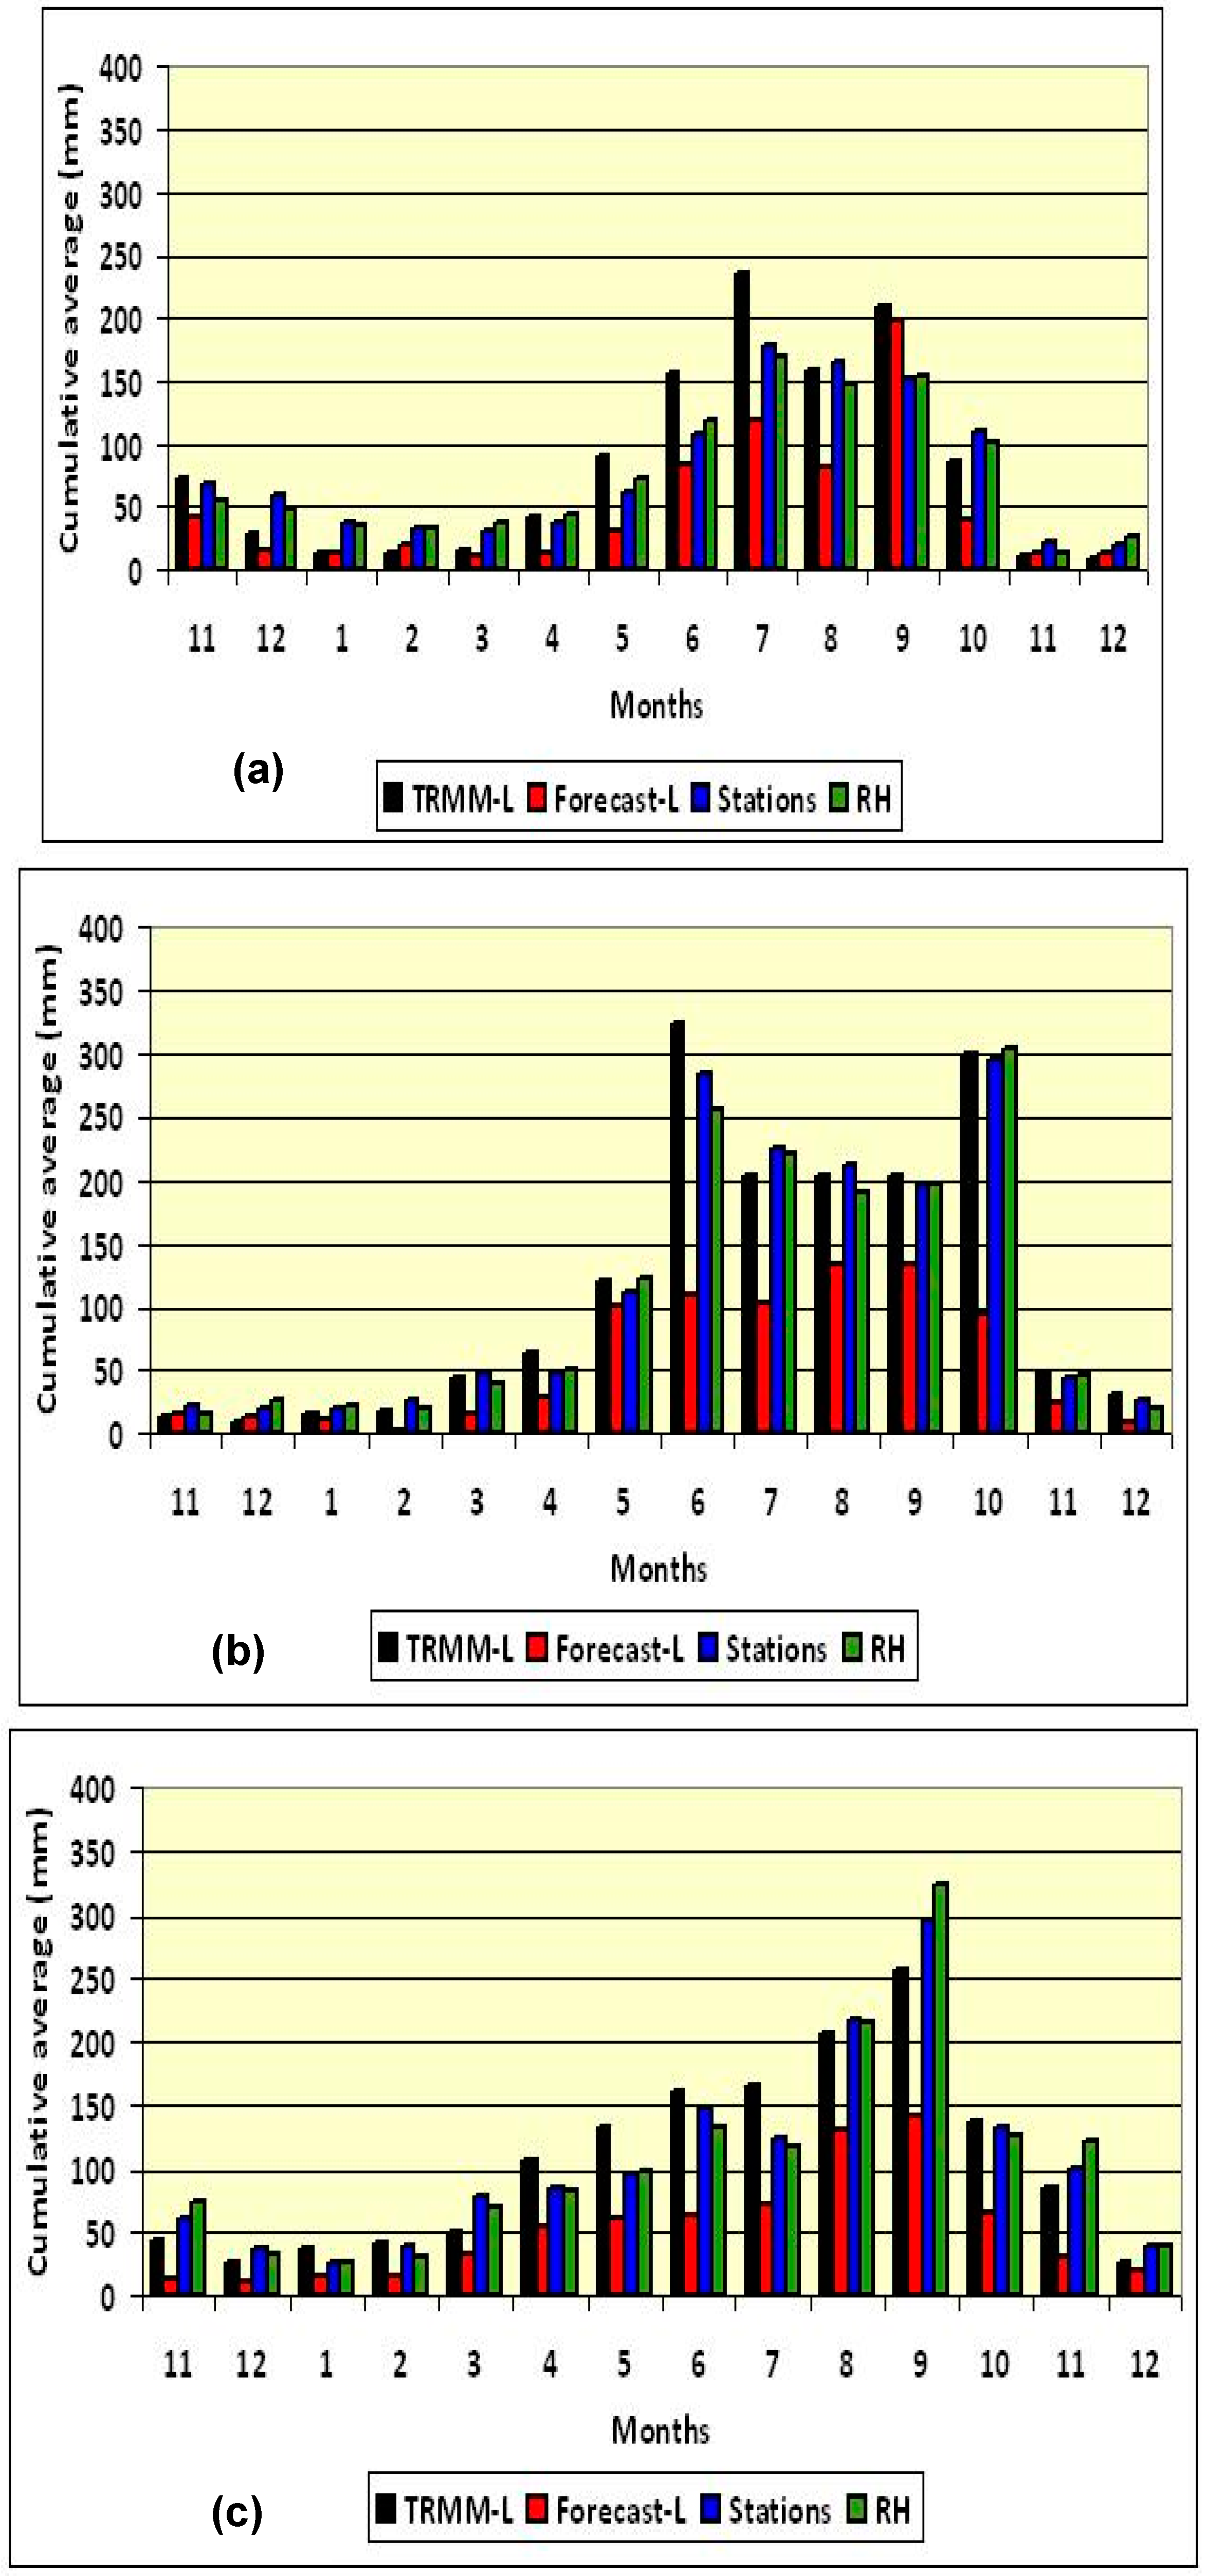
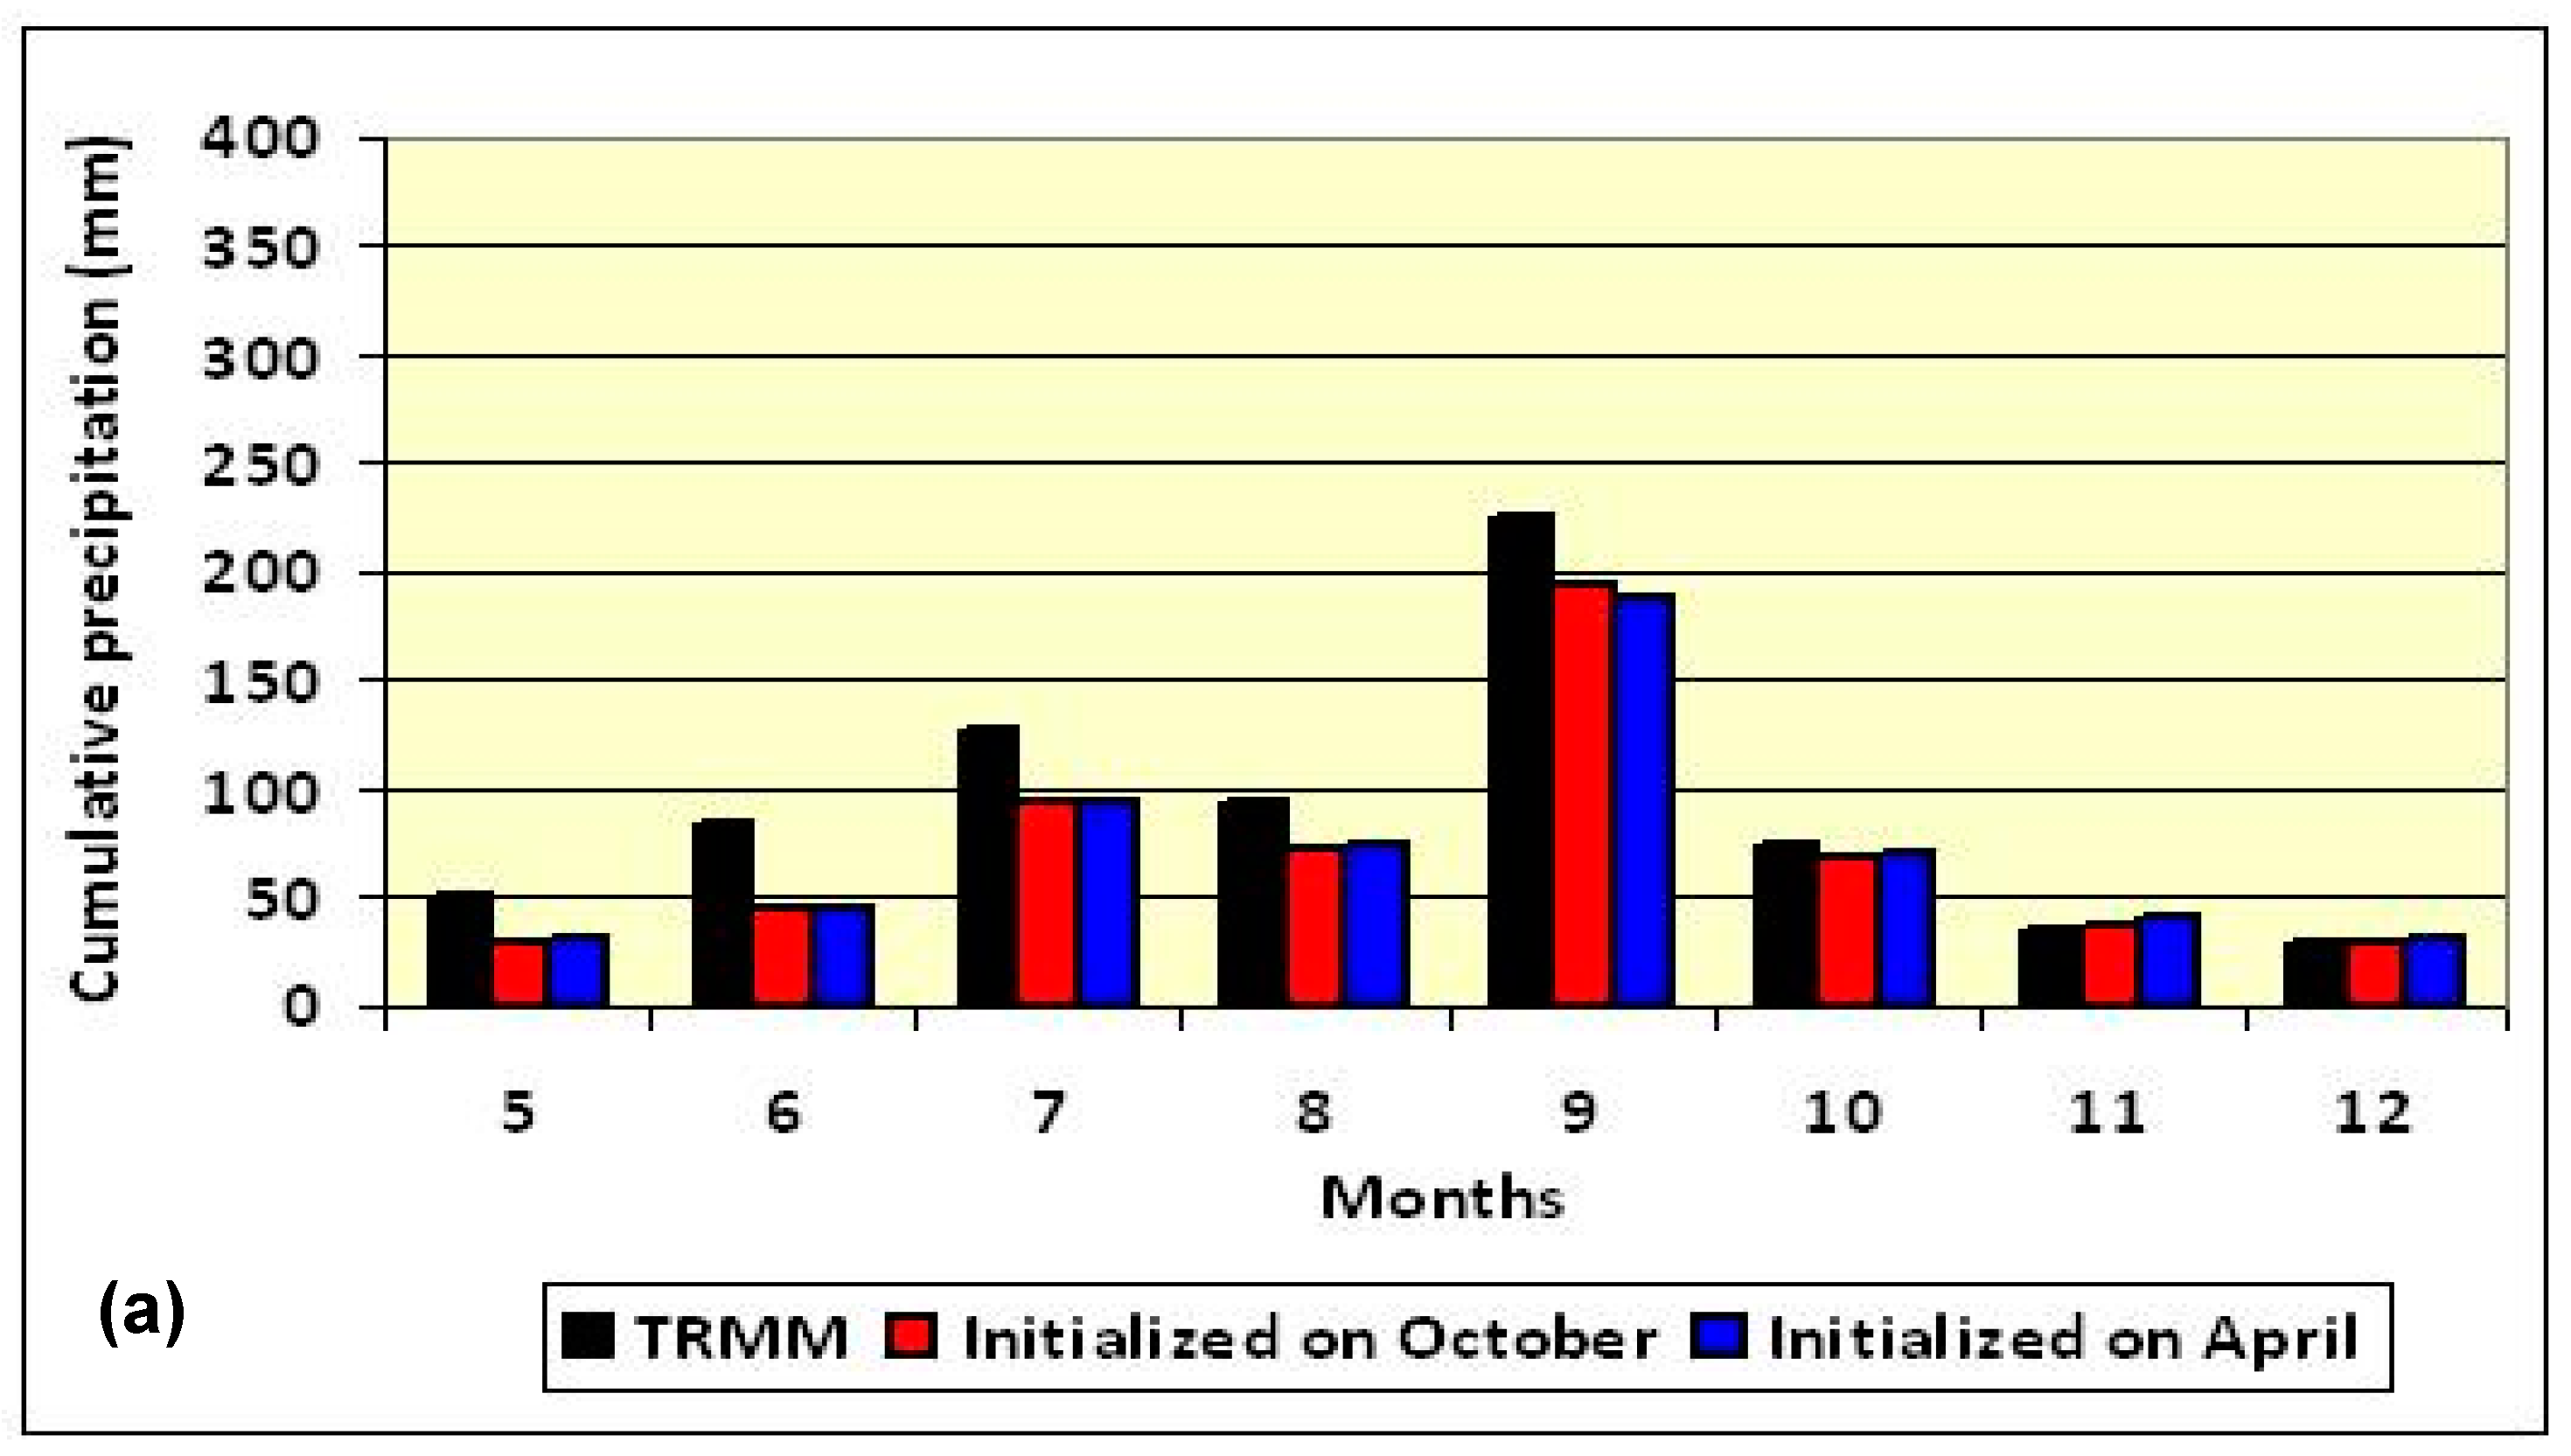
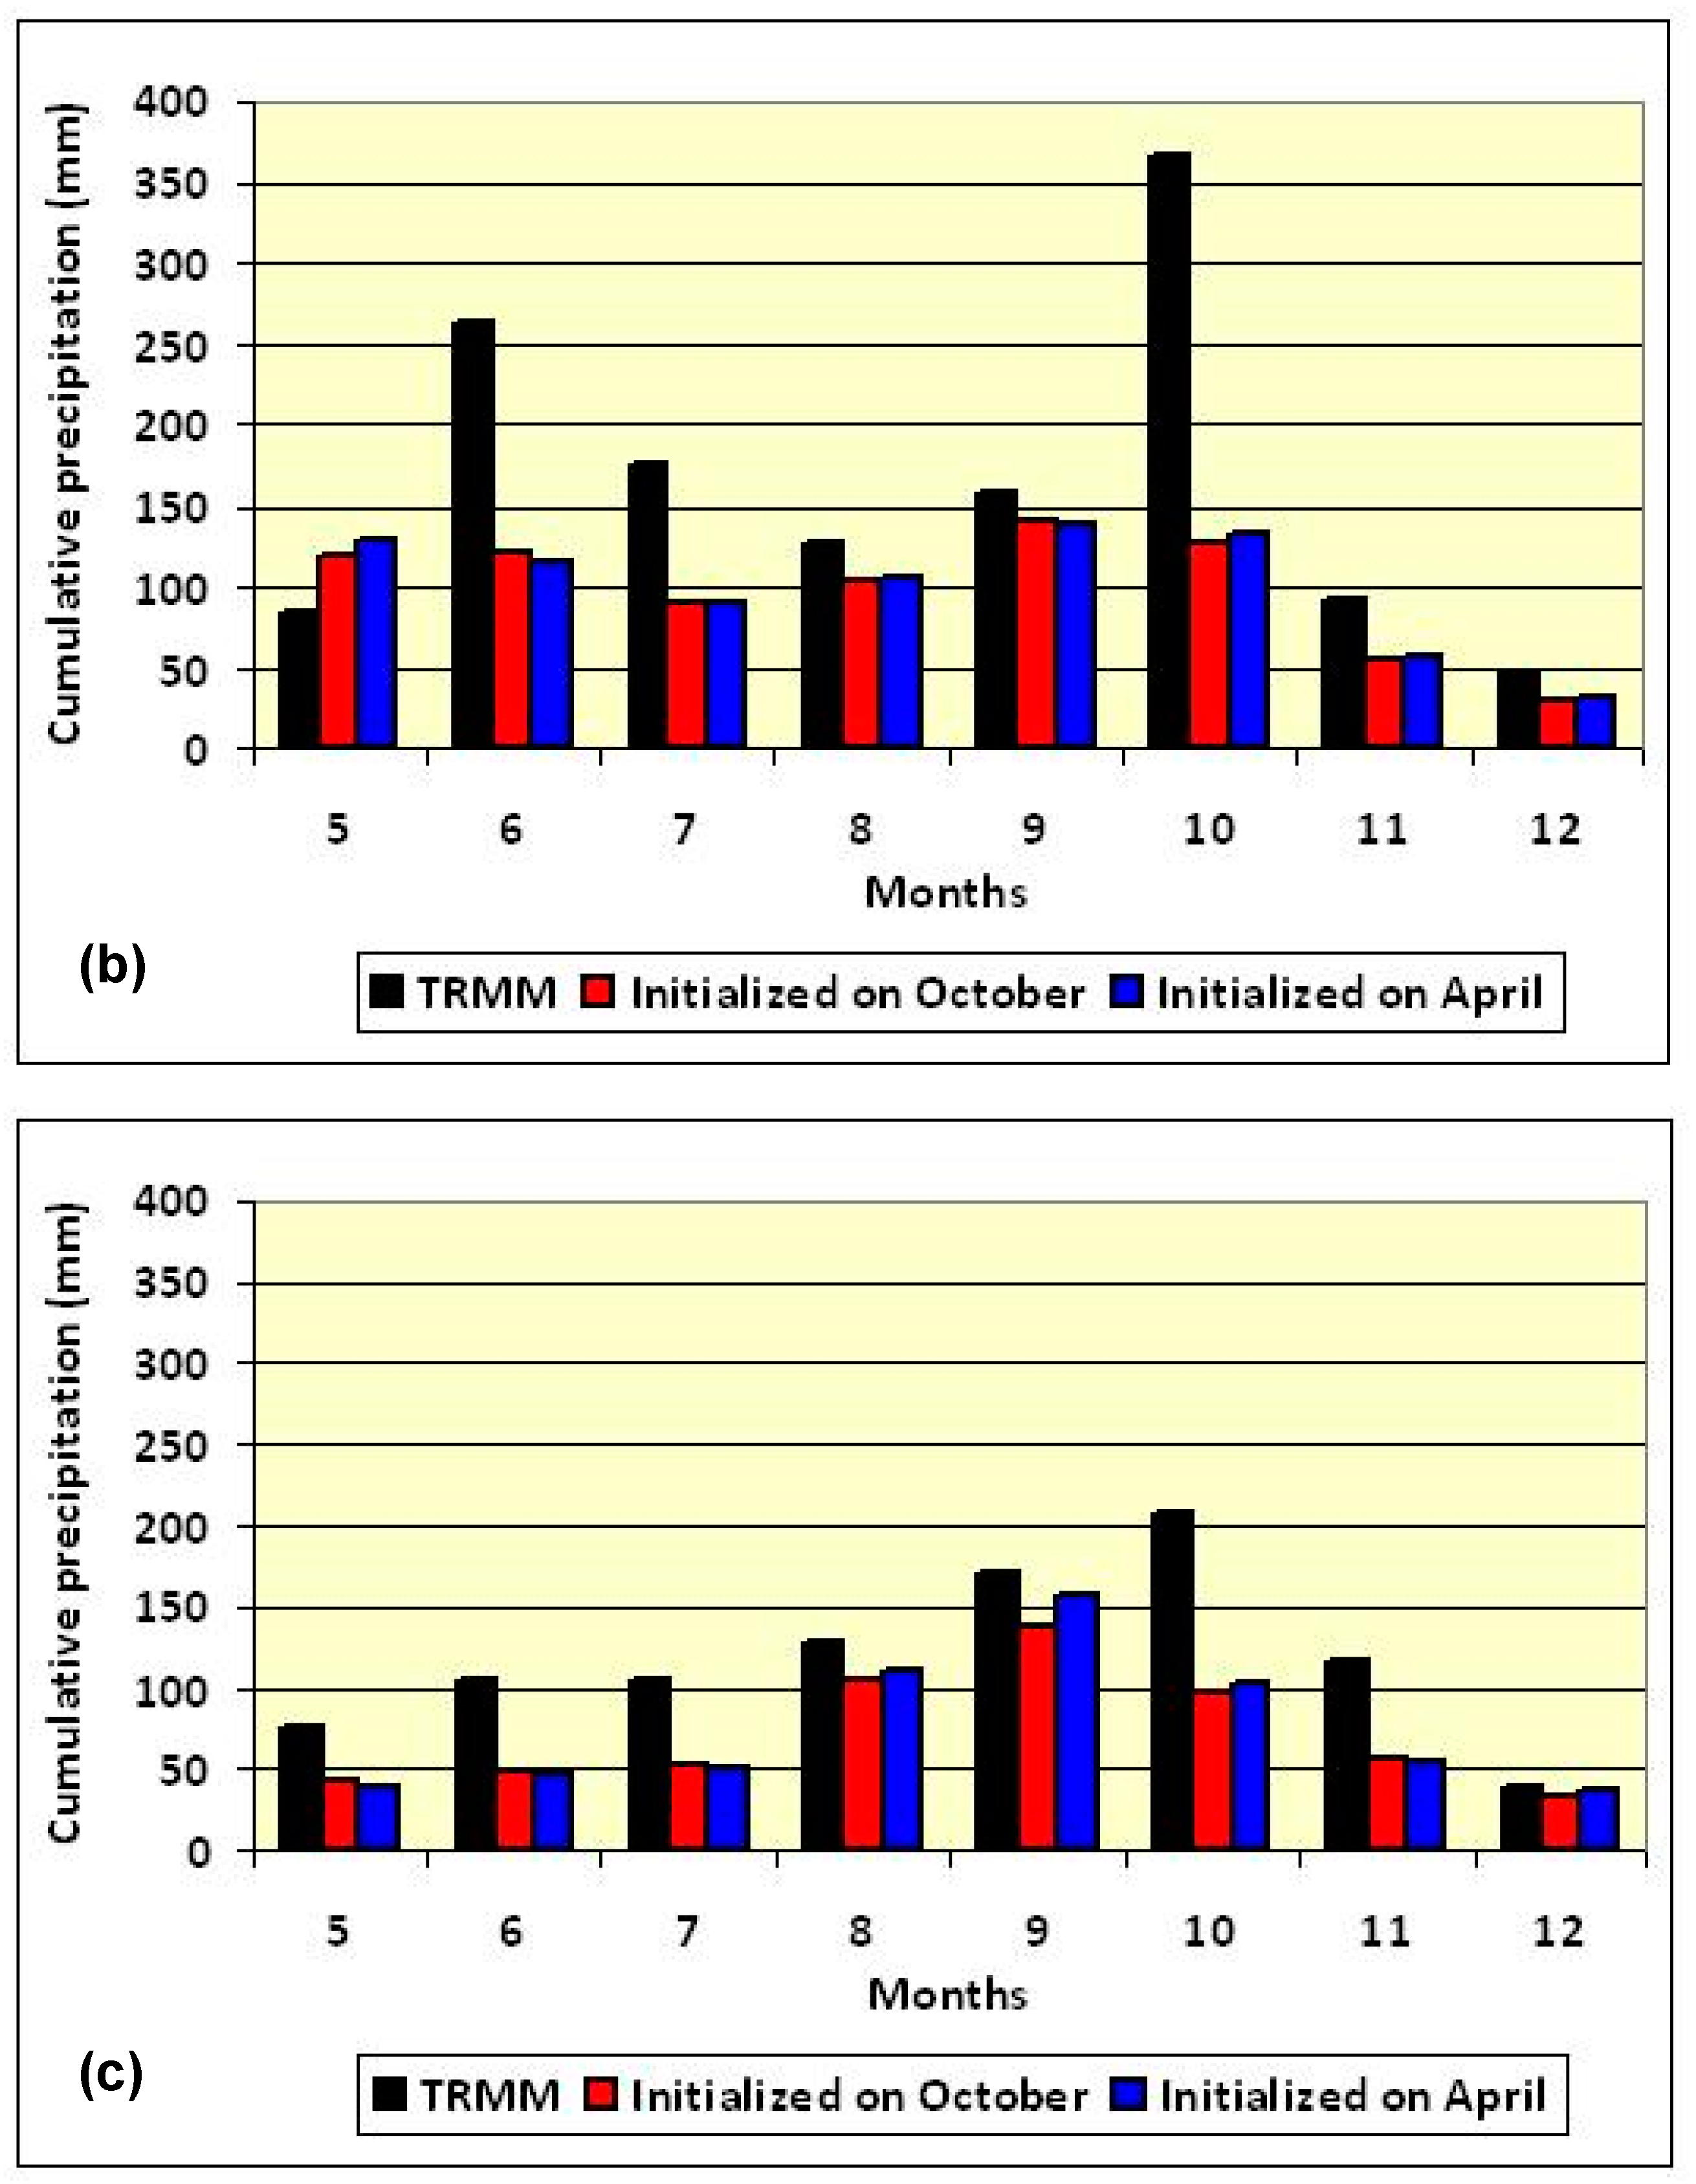
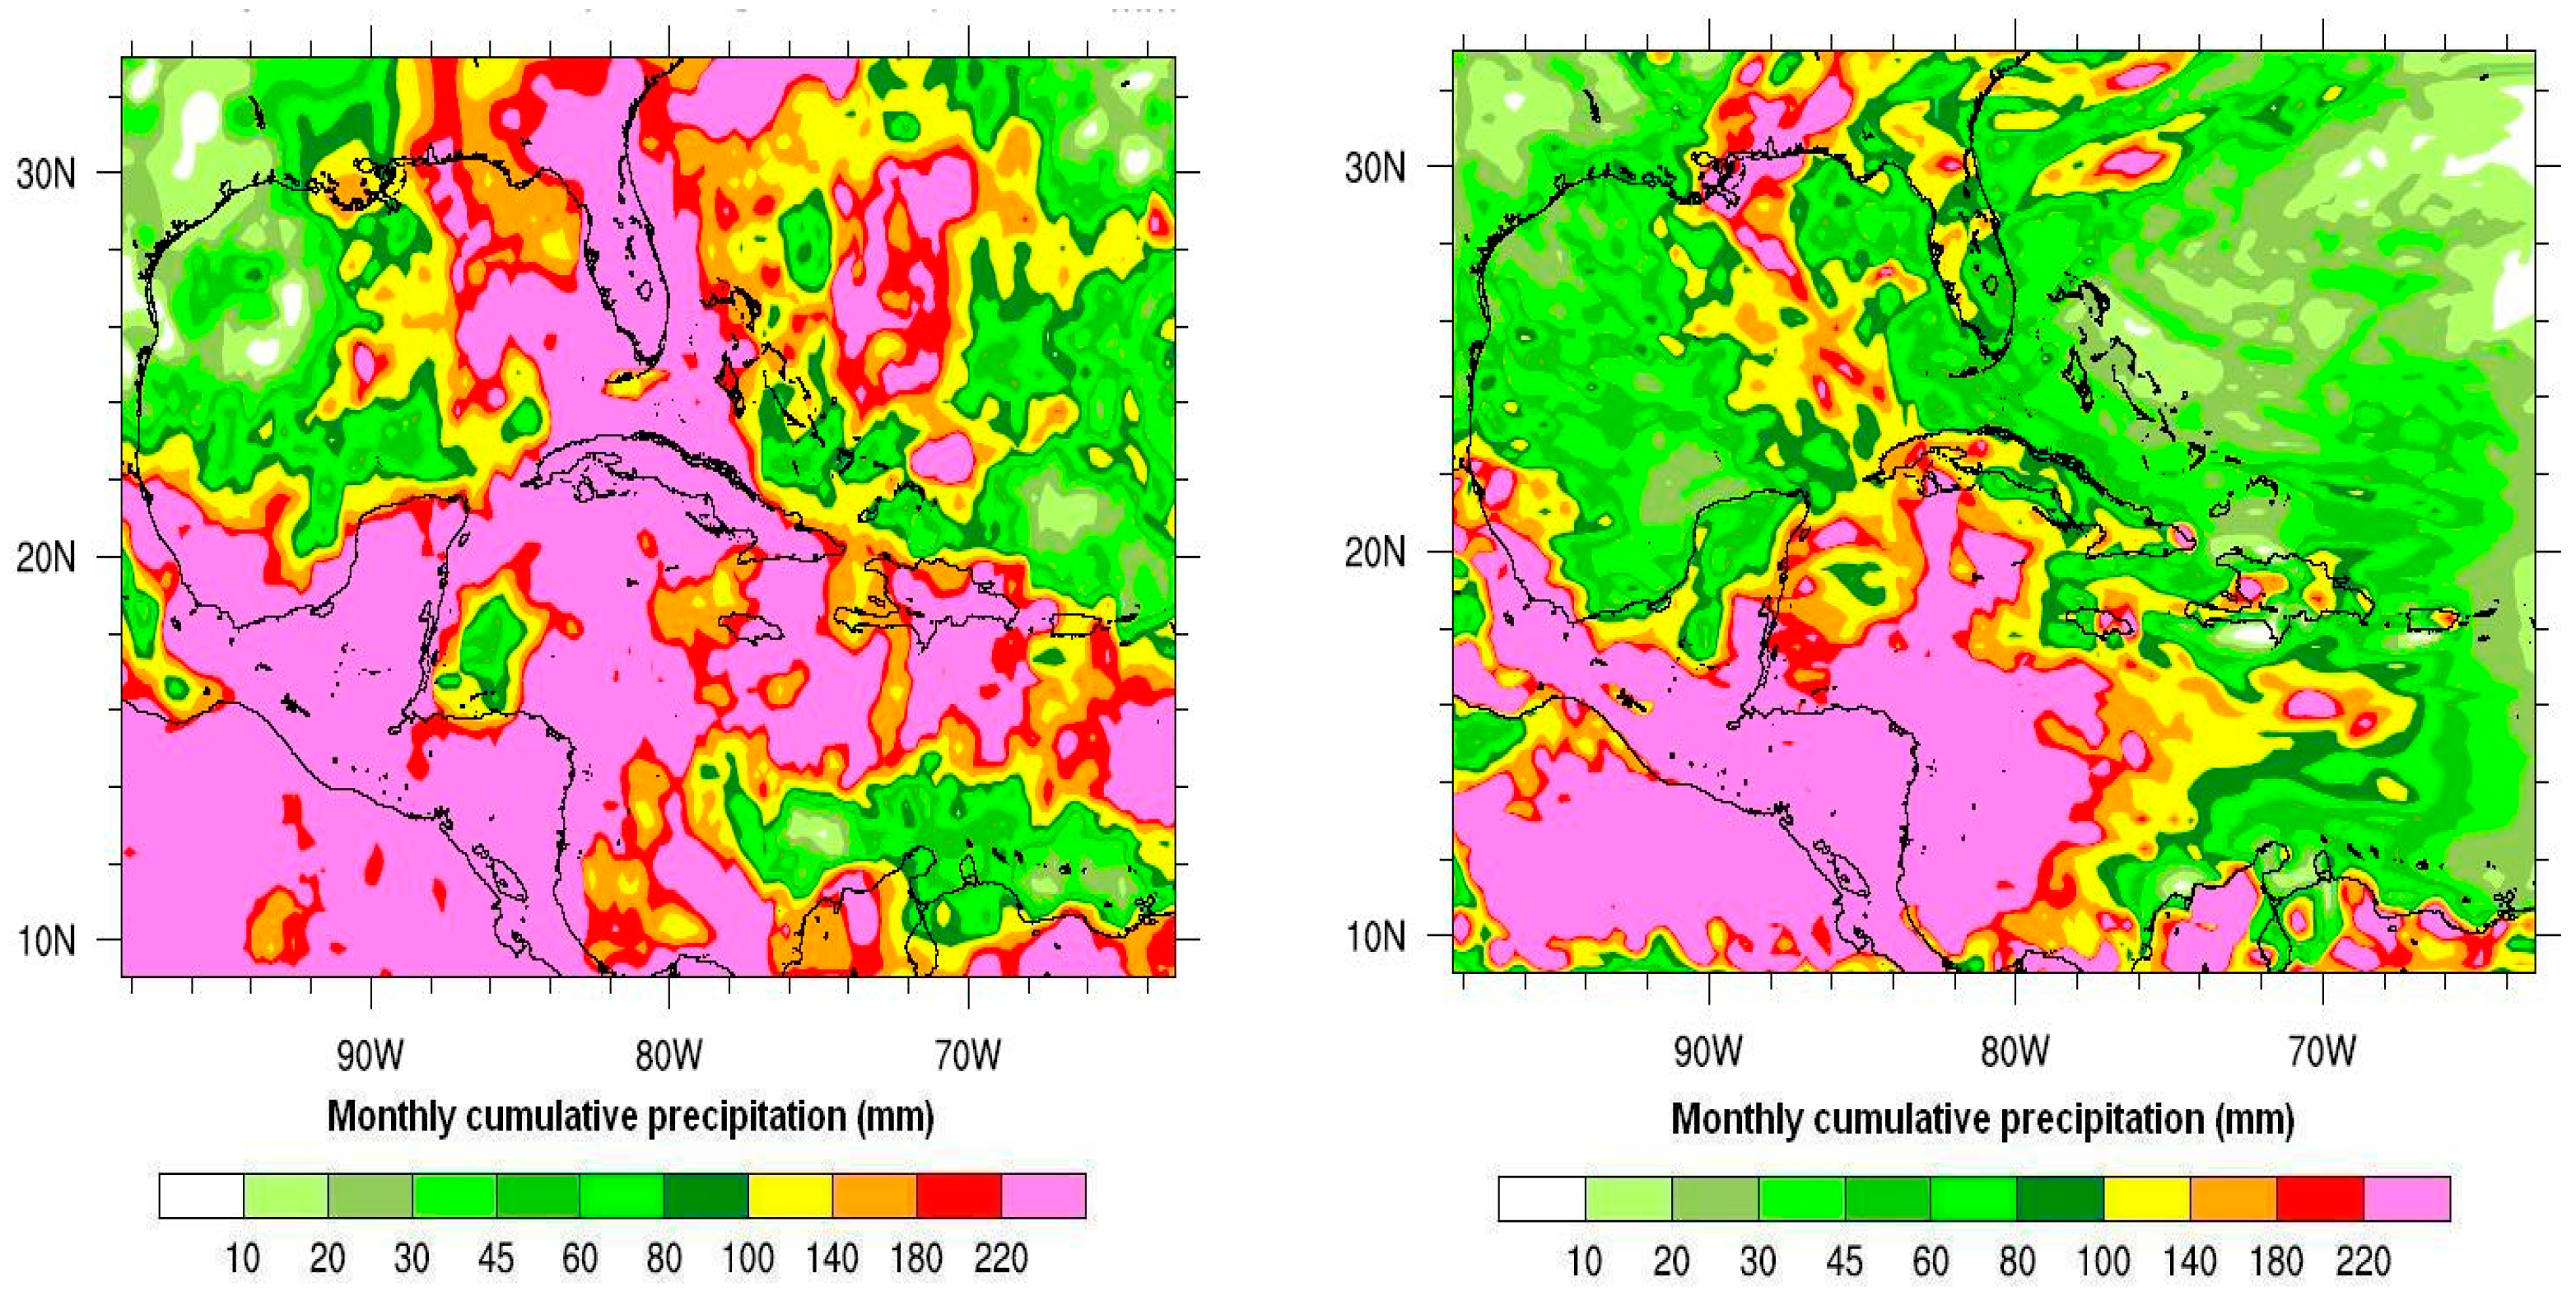
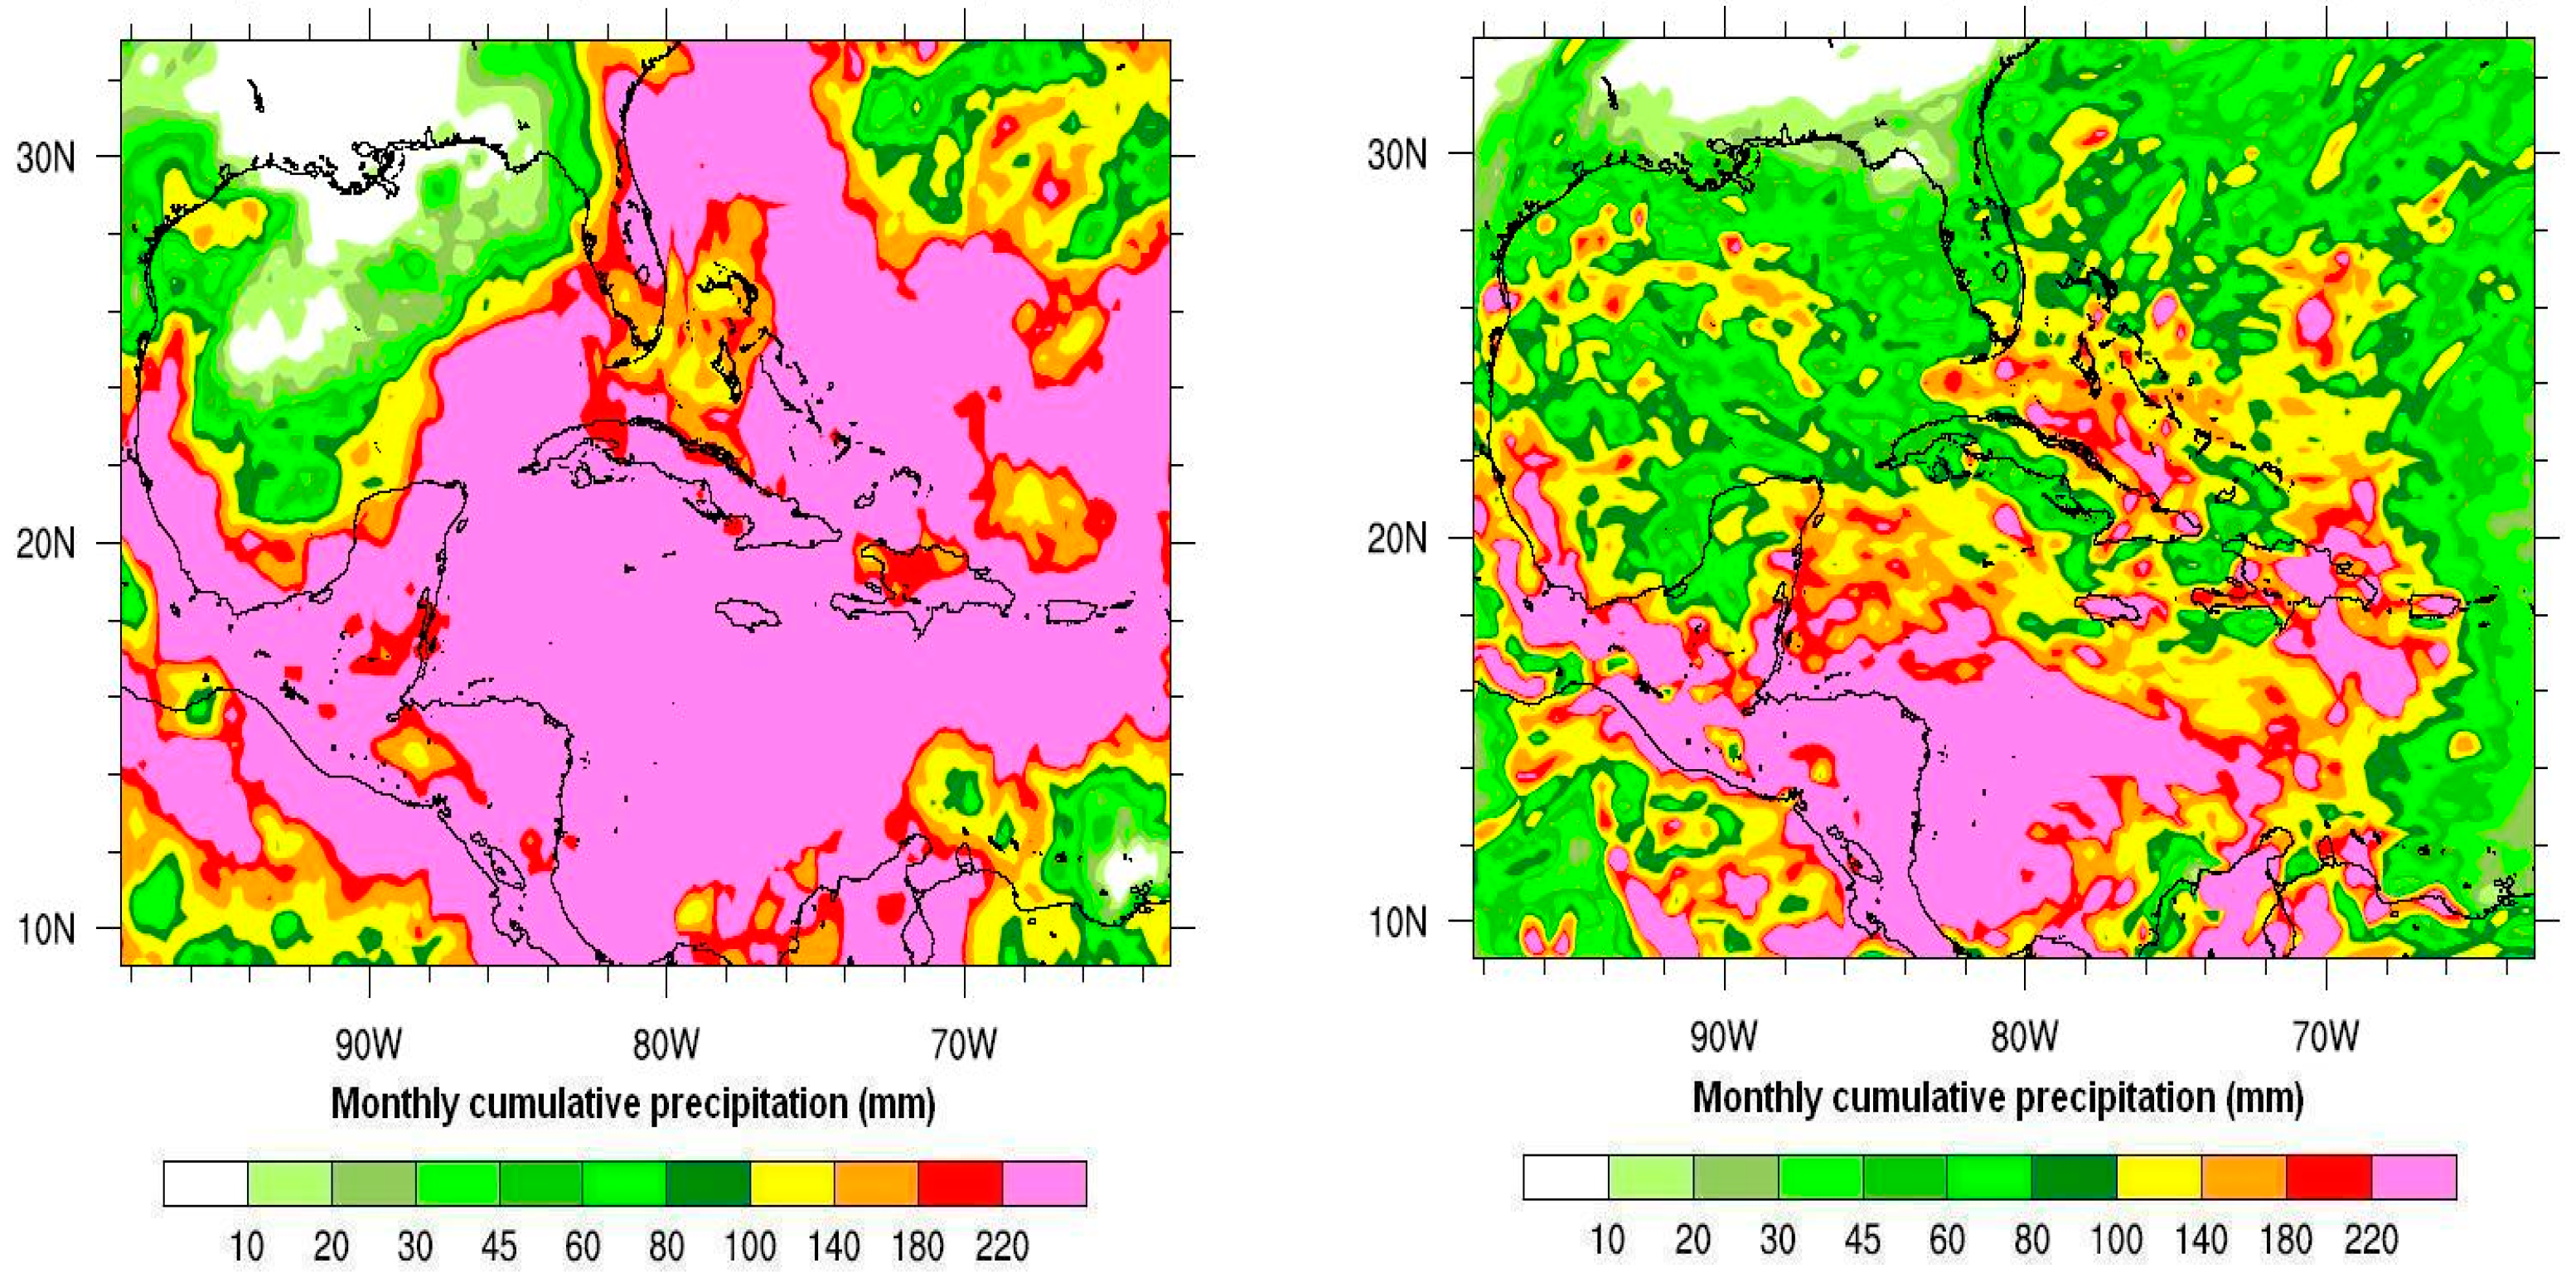
3. Results and Discussion

The comparison between the mean cumulative values for all points of the evaluation area and TRMM base values for the experiments, started on 1st October, is shown in Figure 2. The greatest discrepancies lay in the period of 2004–2005, though forecasted values underestimated those from TRMM in a general manner. In the period 2003–2004 the correlation coefficient between the two curves was high (0.97) but the spatial distribution given by the correlation between the grid points reached its maximum in the month of February, with a modest value of 0.62; the worst performing months, September and October, had negative correlations. The mean square error for all months was 52 mm. The period of 2004–2005 showed a lower correlation between the two curves (0.80) and the point-to-point correlation reached its maximum in March, measuring only 0.54. The worst performance was in May and September, where negative correlations were observed. The mean square error for all months was 87 mm. In this period, there were two months with remarkable differences between forecasts and TRMM that, as discussed later, corresponded to the presence of tropical storms that were generated within the model domain and were not reproduced.
The period of 2007–2008 showed a correlation coefficient of 0.86 between the curves and the maximum correlation point-to-point value was 0.54 in October. March and December had the worst correlations, both measuring 0.01. The average mean square error was 73 mm.
In a general sense, the values obtained were in agreement with the parameters published for global forecasts at the Lead Centre for the Long-Range Forecast Verification System’s web page, http://www.bom.gov.au/cgi-bin/climate/wmo.cgi (accessed on 20 September 2013) for the main centers that published this kind of information. Additionally, in experiments undertaken for the area of Cuba [32] using the model RegCm 4.3 [33], correlations between 0.1 and 0.6 were obtained between the forecasted values and those from TRMM, while forecasts also underestimated the real values, mainly when the Tiedtke cumulus parameterization [34] was used.
Differences in point-to-point correlations depended very much on the main or most frequent weather system generating precipitation for the month under evaluation, so September 2004, with a correlation of −0.02 was signaled by the presence of Hurricane Ivan. The forecast estimated the hurricane’s trajectory as crossing through the center of Cuba, when, in reality, it maintained a westerly course toward the strait of Yucatan. This produced forecasts of large cumulative totals in places where such values were absent, and vice versa, thus yielding this poor correlation. In Figure 3, the spatial distribution of forecasted and TRMM cumulative means inland are shown.
If the same comparison was made for June 2004, where the correlation coefficient is 0.47, even with a high cumulative mean, showed (Figure 4) that forecasts better explained the spatial distribution of phenomena that generated precipitation, which in this case seemed to be convective development due to diurnal heating.
If comparisons are made for the inland points and ground networks, RE-INSMET and RE-INRH are also taken into account. The results for every period under study can be seen in Figure 5.
Figure 5 shows the closeness of values from both networks and, for the periods 2004–2005 and 2007–2008, with data from TRMM; for the period 2003–2004 these values are somewhat different. In all cases forecasted values underestimate the real values with the highest difference occurring in the rainy season of 2004–2005.
For the period 2003–2004, the coefficient of correlation between the forecast and TRMM curves was high (0.90), though a little lower than when the whole grid was evaluated. The spatial distribution given by the point-to-point correlation over the area evaluated reached its maximum in June, at 0.69, while the worst performance corresponded to November and September, where negative correlations were observed. The mean square error for all months was 56 mm.
The period 2004–2005 showed a correlation between curves of 0.87 and the point-to-point correlation reached its maximum value of 0.65 in March. The worst months were January, November and December, all with negative correlations. The mean square error for all months was 78 mm.
The period 2007–2008 showed a correlation between forecasts and a TRMM of 0.96, much higher than the corresponding value for the whole area. The point-to-point correlation reached its maximum value of 0.64 for May and its worst value of −0.05 in December. The mean square error was also 78 mm.
If the month-to-month change was evaluated by assigning a plus sign when both the forecasts and TRMM changed in the same direction, and a minus sign when they changed in opposite directions, the results shown in Figure 6 were obtained. Figure 6 shows that the worst performance occurs in the period 2007–2008, with changes for four months wrongly forecasted. The month with the poorest results was September, which failed in 2004–2005 and 2007–2008. These periods were signed by the presence of tropical storms in the area.
If based on the cumulative data from stations, terciles are calculated for the precipitation distribution using as a baseline the period from 1983–2012. The results from model forecasts and station data can then be classified according to their belonging to the “lower” (first) tercile, the “normal” (second) tercile, or the “higher” (third) tercile, and it is possible to evaluate how they are related in this regard. To achieve a more general classification, the percentage of occurrence of “true positives” is considered as the number of cases when values from both series lie in the same tercile against the total of cases. Categories are merged into two groups, “Normal–Low” (NL) for terciles 1 and 2 and “normal–high” (NH) for terciles 2 and 3. Results are summarized in Table 2.
Table 2 shows that the period with the greatest accuracy was 2003–2004, which was the driest, and when only inland points were evaluated, assertiveness was generally less than when all points were considered. This might be related to the parameterizations selected for convective development, a phenomenon that was more relevant inland due to diurnal heating. It would be interesting to carry out sensibility tests with different cumulus parameterizations, or even ensemble experiments to consider the group accuracy against individual members. Even though as shown in Table 2, assertiveness percentages were high, it must be taken into account that these forecasts were fed with reanalysis data, so they could be considered as “perfect forecasts”.
Since experiments started on 1st April, results were similar to those started on 1st October. The only period in which both experiments coincided is analyzed here; from May to December for the years 2004, 2005 and 2008.
Figure 7 shows the mean monthly cumulative values for the whole area evaluated, as given by the model forecast and by the TRMM base. The analysis revealed very little difference between forecasts started at different dates, the correlation coefficients between them was 0.99 for all the years selected, and the maximum difference was 5 mm for the year 2005. The largest point-to-point difference was recorded in September 2008.
Regarding the comparison with TRMM data, cumulative values were underestimated by forecasts. The best correlation was reached in 2004 (0.97) and the worst was reached in 2005 (0.6); June and October were the most discordant months. The reason for this difference might be the presence of tropical organisms which, even though they did not affect the country directly, had close trajectories. For instance, in June 2005, within the model’s domain, Hurricane Arlene approached the Western region of Cuba, as did Hurricane Wilma in October. These organisms, unlike hurricane Ivan, did not enter the model domain through the borders but were generated by WRF as precipitation-producing disturbances which didn’treach the intensity of the real events (Figure 8 and Figure 9). Other important phenomena originating within the domain area were not generated at all by the model. This suggests that if the model domain was made smaller, more cyclones could be detected as they were introduced through the borders; however, this would make the borders too close to the area of interest, which could introduce spurious waves due to the integration of equations within a very limited area.
An improvement to consider would be the increase in the resolution of the model grid to achieve a better representation of tropical storms and hurricanes. Additionally, in the month of June 2005, important cumulative values were demonstrated in TRMM data over the central region of Cuba which could have been associated with the Tropical Upper Tropospheric Troff (TUTT) or other waves present at the time. This was not properly represented in the forecasts either.
If September 2008, which was the month with the greatest difference between mean cumulative totals forecasted by both initializations analyzed, spatial distribution maps appeared to be quite alike (Figure 10), except near the central region of Cuba, where the experiment initialized on October 1st 2007 showed much lower values than those from the 1st April 2008 experiment. This could have been related to the effect of model nonlinearity on long-term forecasts, since the main differences occurred toward the center of the domain, where there was a lesser influence of border conditions supplied by reanalysis. Should the model be run with data from a global model, differences could be relevant over the whole domain, but mainly around the center which was the area of most interest, hence the importance of ensembles to dampen these variations. A similar case was noticed in May 2005 with the same effects.
When the coincidence between values from forecasts initialized at different dates was evaluated for inland points, its behavior was very similar to when all points were considered. Correlations between both forecasts ranged between 0.96 and 0.99. The results of the correlations with TRMM data were sometimes better and sometimes worse than when all points were considered. The values were 0.87 for 2004, 0.62 for 2005, and 0.95 for 2008.

4. Conclusions and Recommendations

Dynamic downscaling based on the use of WRF was a valid resource to achieve seasonal forecasts, since results obtained showed a similar behavior to those from global models over large periods of time.
In all experiments conducted, the forecasts underestimated the real values of monthly cumulative values.
Hurricanes and tropical storms were poorly reproduced, as their trajectories were different from the real trajectories, both when perturbations were fed from reanalysis data border conditions and when they were generated within the model’s domain.
The ability to forecast changes in the trend of monthly cumulative values had its worst period in September specifically due to the presence of tropical storms in the study area.
The evaluation of the number of hits per tercile had its best performance over the period 2003–2004, the driest of all the periods studied. Generally the percentage of assertiveness by terciles was considered high, around 80%, though it must be taken into account that forecasts were fed with reanalysis data, which made them “perfect forecasts”.
Differences in the initial conditions of the experiments carried out led to different forecast solutions for equal positions in time, predicted for regions distant from the domain borders as a result of the nonlinearity of the model.
Changing the model parameterizations and initial conditions of ensemble forecast experiments is recommended in future studies.

Data availability Statement

The WRF model and all associated geographic data are freely available at the addresses cited above on Section 2.1. Initialization and boundary conditions for the WRF runs are available from the ERA-Interim site https://confluence.ecmwf.int/display/CKB/How+to+download+ERA-Interim+data+from+the+ECMWF+data+archive (accessed on 22 May 2021). Precipitation data for the evaluation of the forecasts are available at the TRMM site https://gpm.nasa.gov/data/directory (accessed on 22 May 2021). Local stations precipitation data can be accessed through contact aith the authors.

Conflicts of Interest

The authors declare no conflict of interest.

References

  1. WWRP/THORPEX-WCRP. Sub-seasonal to Seasonal Prediction Research Implementation Plan. 2012. Available online: https://www.wmo.int/pages/prog/arep/wwrp/new/documents/capabilities_in_sub_seasonal_prediction_final.pdf (accessed on 12 September 2013).
  2. Fu, X.; Wang, B.; Lee, J.Y.; Wang, W.; Gao, L. Sensitivity of dynamical intraseasonal prediction skills to different initial conditions. Mon. Weather Rev. 2011, 139, 2572–2592. [Google Scholar] [CrossRef]
  3. Stockdale, T.N.; Anderson, D.L.T.; Balmaseda, M.A.; Doblas-Reyes, F.; Ferranti, L.; Mogensen, K.; Palmer, T.; Molteni, F.; Vitart, F. ECMWF seasonal forecast system 3 and its prediction of sea surface temperature. Clim. Dyn. 2011, 37, 455–471. [Google Scholar] [CrossRef]
  4. Arribas, A.; Glover, M.; Maidens, A.; Peterson, K.; Gordon, M.; MacLachlan, C.; Graham, R.; Fereday, D.; Camp, J.; Scaife, A.A.; et al. The GloSea4 Ensemble Prediction System for Seasonal Forecasting. Mon. Weather Rev. 2011, 139, 1891–1910. [Google Scholar] [CrossRef]
  5. Saha, S.; Moorthi, S.; Wu, X.; Wang, J.; Nadiga, S.; Tripp, P.; Behringer, D.; Hou, Y.-T.; Chuang, H.-Y.; Iredell, M.; et al. The NCEP Climate Forecast System Version 2. J. Clim. 2014, 27, 2185–2208. [Google Scholar] [CrossRef]
  6. Landman, W.A.; Kgatuke, M.-J.; Mbedzi, M.; Beraki, A.; Bartman, A.; Du Piesanie, A. Performance comparison of some dynamical and empirical downscaling methods for South Africa from a seasonal climate modelling perspective. Int. J. Clim. 2009, 29, 1535–1549. [Google Scholar] [CrossRef]
  7. Cavalcanti, I.F.A.; Marengo, J.A.; Satyamurty, P.; Nobre, C.A.; Trosnikov, I.; Bonatti, J.P.; Manzi, A.O.; Tarasova, T.; Pezzi, L.P.; D’Almeida, C.; et al. Global Climatological Features in a Simulation Using the CPTEC–COLA AGCM. J. Clim. 2002, 15, 2965–2988. [Google Scholar] [CrossRef] [Green Version]
  8. Coelho, C.A.S.; Stephenson, D.B.; Balmaseda, M.; Doblas-Reyes, F.J.; Van Oldenborgh, G.J. Toward an integrated seasonal forecasting system for South America. J. Clim. 2006, 19, 3704–3721. [Google Scholar] [CrossRef] [Green Version]
  9. Palmer, T.N.; Anderson, D.L.T. The prospects for seasonal forecasting—A review paper. Q. J. R. Meteorol. Soc. 1994, 120, 755–793. [Google Scholar]
  10. Jin, E.K.; Kinter, J.L.; Wang, B.; Park, C.K.; Kang, I.S.; Kirtman, B.P.; Kug, J.S.; Kumar, A.; Luo, J.J.; Schemm, J. Current status of ENSO prediction skill in coupled ocean-atmosphere model. Clim. Dyn. 2008, 31, 647–664. [Google Scholar] [CrossRef]
  11. Cárdenas, P.A. Pronóstico de totales mensuales de lluvia en Cuba. Un modelo con varios meses de adelanto. Rev. Cuba. De Meteorol. 1999, 6, 47–51. [Google Scholar]
  12. Martinez-Castro, D.; Rocha RP da Bezanilla-Morlot, A.; Álvarez-Escudero, L.; Reyes-Fernández, J.P.; Silva-Vidal, Y.; Arritt, R.W. Sensitivity studies of the RegCM3 simulation of summer precipitation, temperature and local wind field in the Caribbean Region. Theor. Appl. Climatol. 2006, 86, 5–22. [Google Scholar] [CrossRef]
  13. Rummukainen, M. State-of-the-art with regional climate models. WIREs Clim. Chang. 2010, 1, 82–96. [Google Scholar] [CrossRef]
  14. Grotch, S.L.; MacCracken, M.C. The use of general circulation models to predict regional climatic change. J Clim. 1991, 4, 286–303. [Google Scholar] [CrossRef] [Green Version]
  15. Jones, R.G.; Murphy, J.M.; Noguer, M.M. Simulation of climate change over Europe using a nested regional climate model. I: Assessment of control climate, including sensitivity to location of lateral boundaries. Q. J. R. Meteorol. Soc. 1995, 121, 1413–1449. [Google Scholar]
  16. Feser, F. Enhanced detectability of added value in limited-area model results separated into different spatial scales. Mon. Weather Rev. 2006, 134, 2180–2190. [Google Scholar] [CrossRef] [Green Version]
  17. Winterfeldt, J.; Weisse, R. Assessment of value added for surface marine wind speed obtained from two Regional Climate Models (RCM). Mon. Weather Rev. 2009, 137, 2955–2965. [Google Scholar] [CrossRef] [Green Version]
  18. Deque, M.; Jones, R.G.; Wild, M.; Giorgi, G.; Christensen, J.H.; Hassell, D.C.; Vidale, P.L.; Rockel, B.; Jacob, D.; Kjellstrom, E.; et al. Global high resolution versus Limited Area Model climate change projections over Europe: Quantifying confidence level from PRUDENCE results. Clim. Dyn. 2005, 25, 653–670. [Google Scholar] [CrossRef]
  19. Rummukainen, M.; Bergstrom, S.; Persson, G.; Rodhe, J.; Tjernstrom, M. The Swedish regional climate modelling programme, SWECLIM: A review. AMBIO J. Hum. Environ. 2004, 33, 176–182. [Google Scholar] [CrossRef]
  20. Giorgi, F.; Diffenbaugh, N.S.; Gao, X.J.; Coppola, E.; Dash, S.K.; Frumento, O.; Rauscher, S.A.; Remedio, A.; Sanda, I.S.; Steiner, A.; et al. The regional climate change hyper-matrix framework. Eos Trans. Am. Geophys. Union 2008, 89, 445–446. [Google Scholar] [CrossRef]
  21. Giorgi, F.; Jones, C.; Asrar, G. Addressing climate information needs at the regional level: The CORDEX framework. WMO Bull. 2009, 58, 175–183. [Google Scholar]
  22. Skamarock, W.C.; Klemp, J.B.; Dudhia, J.; Gill, D.O.; Barker, D.M.; Duda, M.; Huang, X.-Y.; Wang, W.; Powers, J.G. A Description of the Advanced Research WRF Version 3, NCAR Technical Note. 2008. Available online: http://www2.mmm.ucar.edu/wrf/users/docs/arw_v3.pdf (accessed on 15 September 2013).
  23. Courtier, P.; Thépaut, J.N.; Hollingsworth, A. A Strategy for Operational Implementation of 4D-Var, Using an Incremental Approach. Q. J. R. Meteorol. Soc. 1994, 120, 1367–1387. [Google Scholar] [CrossRef]
  24. Veerse, F.; Thepaut, J.N. Multiple-Truncation Incremental Approach for Four-Dimensional Variational Data Assimilation. Q. J. R. Meteorol. Soc. 1998, 124, 1889–1908. [Google Scholar] [CrossRef]
  25. Dee, D.P.; Uppala, S.M.; Simmons, A.J.; Berrisford, P.; Poli, P.; Kobayashi, S.; Andrae, U. The ERA-Interim Reanalysis: Configuration and Performance of the Data Assimilation System. Q. J. R. Meteorol. Soc. 2011, 137, 553–597. [Google Scholar] [CrossRef]
  26. Janjic, Z.I. The step-mountain eta coordinate model: Further developments of the convection, viscous sublayer and turbulence closure schemes. Mon. Weather Rev. 1994, 122, 927–945. [Google Scholar] [CrossRef] [Green Version]
  27. Weisman, M.L.; Wang, W.; Dudhia, J.; Manning, K.W. Systematic boundary-layer biases in the WRF-ARW real-time convective forecasts. In Proceedings of the 7th WRF Users’ Workshop, Boulder, CO, USA, 19 June 2006; Available online: http://nldr.library.ucar.edu/repository/collections/OSGC-000-000-005-764 (accessed on 18 September 2013).
  28. Grell, G.A.; Freitas, S.R. A scale and aerosol aware stochastic convective parameterization for weather and air quality modeling. Atmos. Chem. Phys. 2014, 14, 5233–5250. [Google Scholar] [CrossRef] [Green Version]
  29. Mayor, Y.G.; Mesquita, M.D.S. Numerical Simulations of the 1 May 2012 Deep Convection Event over Cuba: Sensitivity to Cumulus and Microphysical Schemes in a High-Resolution Model. Adv. Meteorol. 2015, 2015, 973151. [Google Scholar] [CrossRef] [Green Version]
  30. Lin, Y.L.; Farley, R.D.; Orville, H.D. Bulk parameterization of the snow field in a cloud model. J. Appl. Meteorol. Climatol. 1983, 22, 1065–1092. [Google Scholar] [CrossRef] [Green Version]
  31. Iacono, M.J.; Delamere, J.S.; Mlawer, E.J.; Shephard, M.W.; Clough, S.A.; Collins, W.D. Radiative forcing by long-lived greenhouse gases: Calculations with the AER radiative transfer models. J. Geophys. Res. 2008, 113, D13103. [Google Scholar] [CrossRef]
  32. Vichot-Llano, A.; Martínez-Castro, D.; Centella-Artola, A.; Bezanilla-Morlot, A. Sensibilidad al cambio de dominio y resolución de tres configuraciones del modelo climático regional RegCM 4.3 para la región de América Central y el Caribe. Rev. Climatol. 2014, 14, 45–62. [Google Scholar]
  33. Giorgi, F.; Coppola, E.; Solmon, F.; Mariotti, L.; Sylla, M.B.; Bi, X.; Elguindi, N.; Diro, G.T.; Nair, V.; Giuliani, G.; et al. RegCM4: Model description and preliminary tests over multiple CORDEX domains. Clim. Res. 2012, 52, 7–29. [Google Scholar] [CrossRef] [Green Version]
  34. Tiedtke, M. A Comprehensive Mass Flux Scheme for Cumulus Parameterization in large-scale models. Mon. Weather Rev. 1989, 117, 1779–1800. [Google Scholar] [CrossRef] [Green Version]
Figure 1. Representation of the domain of the experiments. Enclosed in the rectangle is the area chosen for evaluation.
Environsciproc 08 00044 g001
Figure 2. Monthly mean cumulative values from model forecasts and TRMM base for experiments started on 1st October: (a) corresponds to period 2003–2004, (b) to 2004–2005 and (c) to 2007–2008.
Environsciproc 08 00044 g002aEnvironsciproc 08 00044 g002b
Figure 3. Spatial distribution of monthly cumulative values from TRMM (left) and WRF started on October 1st 2003 (right) for September 2004.
Environsciproc 08 00044 g003
Figure 4. Spatial distribution of monthly cumulative values from TRMM (left) and WRF started on October 1st 2003 (right) for June 2004.
Environsciproc 08 00044 g004
Figure 5. Monthly cumulative precipitation means from points over land for model forecasts, TRMM base, INSMET stations (RE-INSMET) and INRH stations (R-INRH), for experiments started on 1st October: (a) corresponds to period 2003–2004, (b) to 2004–2005 and (c) to 2007–2008.
Environsciproc 08 00044 g005
Figure 6. Evaluation of month-to-month change assuming a plus sign if both the model forecast and TRMM data change in the same direction, and a minus sign if they change in opposite directions for the three periods studied.
Environsciproc 08 00044 g006
Figure 7. Monthly cumulative precipitation means from model forecasts over the period in which both initializations coincide, and TRMM data: (a) corresponds to 2004, (b) to 2005 and (c) to 2008.
Environsciproc 08 00044 g007aEnvironsciproc 08 00044 g007b
Figure 8. Spatial distribution of monthly cumulative values from TRMM (left) and WRF started on October 1st 2004 (right) for June 2005.
Environsciproc 08 00044 g008
Figure 9. Spatial distribution of monthly cumulative values from TRMM (left) and WRF started on October 1st 2004 (right) for October 2005.
Environsciproc 08 00044 g009
Figure 10. Spatial distribution of monthly cumulative values from WRF started on October 1st 2007 (left) and on April 1st 2008 (right) for September 2008.
Environsciproc 08 00044 g010
Table 1. WRF runtime options applied in the experiments.
ParametersOptionComments/References
Experiments6In the table they are referred to as Exp. 1 to 6.
Start DatesExp. 1: 1/10/2003
Exp. 2: 1/04/2004
Exp. 3: 1/10/2004
Exp. 4: 1/04/2005
Exp. 5: 1/10/2007
Exp. 6: 1/04/2008
The periods studied were chosen taking into account the availability of data, ensuring that different meteorological conditions would be met (dry and rainy periods, presence of tropical storms and hurricanes, etc.). Start dates and periods were chosen in a manner such that experiments would overlap.
Simulation Times15 monthsThe first month was considered as the period of model self-tunning (spin up).
Ocean–Atmosphere Interactionsst_update = 1Sea surface temperature was updated every 6 h. Data from Era-Interim.
Boundary Layer ParameterizationMellor-Yamada-JanjicJanjic, (1994) [26]. This parameterization obtained satisfactory results in convective forecasts [27]
Parameterization of CumuliGrell-FreitasGrell and Freitas, (2013) [28]. This scheme was chosen as it was used at the Institute of Meteorology of Cuba with favorable results [29].
Microphysics ParameterizationLin et al.Lin et al. (1983) [30]. This was a parameterization of a relatively low computational cost, which included ice and graupel formation processes adequate for simulations with real data.
Short- and Long-Wave ParameterizationRapid Radiative Transfer Model (RRTMG)Iacono et al. (2008) [31]. These schemes represent the variability of the clouds field, which was not attached to the domain resolution.
Table 2. Percentages of occurrence of true positives for tercile categories “normal–low” (NL) and “normal–high” (NH) for three pairs of series: model and TRMM values for the whole grid (T-F), model and TRMM values for points inland (TL-FL), and model and station values inland (FL-S).
SeasonCategoryT-FTL-FLFL-S
2003–2004NL937979
NH1007971
2004–2005NL937979
NH798686
2007–2008NL868686
NH867179
Average NL 90.681.381.3
Average NH 88.378.678.6
Publisher’s Note: MDPI stays neutral with regard to jurisdictional claims in published maps and institutional affiliations.

