1. Introduction
Earthquakes, natural disasters that result from the sudden release of energy in the Earth’s crust, have long been a subject of scientific study and fascination. Researchers have been exploring various methods to detect and predict earthquakes, including the analysis of earthquake precursors. Studies, as such, involved geological features [
1,
2], lineament analysis [
3], latent heat increase [
4], thermal anomalies [
5], remote sensing, and multi-parametric approaches [
6,
7], which have provided significant light for critical earthquake precursors. These precursors are subtle changes in the Earth’s environment that occur before an earthquake and can provide valuable insights into the seismic activity.
The ionosphere, a layer of the Earth’s atmosphere, is known to be affected by seismic activity. Large earthquakes can cause disturbances in the ionosphere that can be detected using GPS-derived vertical total electron content (vTEC). The detection of ionospheric TEC anomalies has been investigated in several studies using Global Ionospheric Maps (GIMs) and GPS-derived TEC data [
8]. These studies have focused on analyzing TEC anomalies before major earthquakes, such as the Kumamoto-shi earthquake in Japan [
8], the Colima earthquake [
9], and earthquakes in the Himalayan region [
10]. By examining the TEC data from GPS stations located near the epicenter of these earthquakes, it is possible to identify significant anomalies in TEC values. The relationship between earthquakes and ionospheric TEC is a complex and ongoing area of research. Understanding these seismo-ionospheric irregularities can provide valuable insights into the mechanisms and processes associated with earthquakes. Furthermore, the detection of TEC anomalies could potentially contribute to the development of early warning systems for earthquakes.
In this research, we delved into an analysis of seismo-ionospheric irregularities using the available PRNs (Pseudo-Random Numbers) TEC data from the closest epicentral cGPS (continuous Global Positioning System) stations for three of the largest earthquakes in the last decade. We explored the methods used to detect and analyze TEC anomalies, the significance of these anomalies in earthquake precursor detection, and the potential applications of this research in improving our understanding of seismic activity.
2. Materials and Methods
This study focuses on the three most devastating and significant earthquakes which have occurred after 2010, each with a magnitude exceeding 7.5. To estimate the Total Electron Content (TEC), close-range cGPS stations were employed, as detailed in
Table 1. RINEX data from these stations, collected within a 45-day timeframe preceding each event, were scrutinized. Calculations utilized GPS-TEC software (version 3.2) developed by Gopi Krishna Seemala [
11]. This software employed pseudo-range codes (P1 and P2) from GPS stations to compute Slant TEC (sTEC), which signifies the electron content between satellites and ionospheric receivers along a slant trajectory. This calculation involved a geometry-free linear combination of GPS observations.
The obtained sTEC values is then converted to vertical TEC (vTEC) while considering a model of the ionosphere resembling a thin spherical shell. In accordance with the single-layer model (SLM), an extremely thin layer positioned consistently above the Earth’s surface was assumed to contain all the available free electrons [
12]. The determination of vTEC at the ionospheric pierce point involved the utilization of a mapping function [
13] based on the SLM. For this analysis, the ionospheric layer’s altitude was fixed at 350 km, and GPS receivers were sampled every 30 s [
14].
A statistical foundation for the upper and lower boundary was established using a 15-day moving average and standard deviation [
14], as illustrated by Equation (1),
where
X signifies the mean and
σ represents the standard deviation. Instances where the vTEC values surpassed the upper and lower limits were classified as anomalies. For the anomaly days, the peak anomaly time for the positive and negative anomaly were deduced from Equations (2) and (3),
where PPA is the Peak Positive Anomaly time, PNA is the Peak Negative Anomaly time, UB is the Upper Boundary and LB represents the Lower Boundary.
In addition to the TEC observations, the study also assessed Disturbance Storm Time (DST) and Planetary Solar (KP) indices. A geomagnetic storm is identified when the DST value crosses below −35 units, signifying a significant disturbance. To differentiate seismic anomalies from those observed on regular days without any impact from geomagnetic storms or solar flares, this study considered anomalies that occurred during periods of normal geomagnetic conditions.
3. Results and Discussions
The statistical analysis of ionospheric Total Electron Content (TEC) is an important area of research for understanding the relationship between the TEC and seismic activity. In this research, we have investigated the correlations between the TEC and pre-earthquake seismic activities to identify potential correlations between TEC anomalies and seismic activity for the Japan (9.1 Mw), Nepal (7.8 Mw), and Turkey (7.8 Mw) earthquakes.
3.1. Japan (9.1 Mw) Earthquake
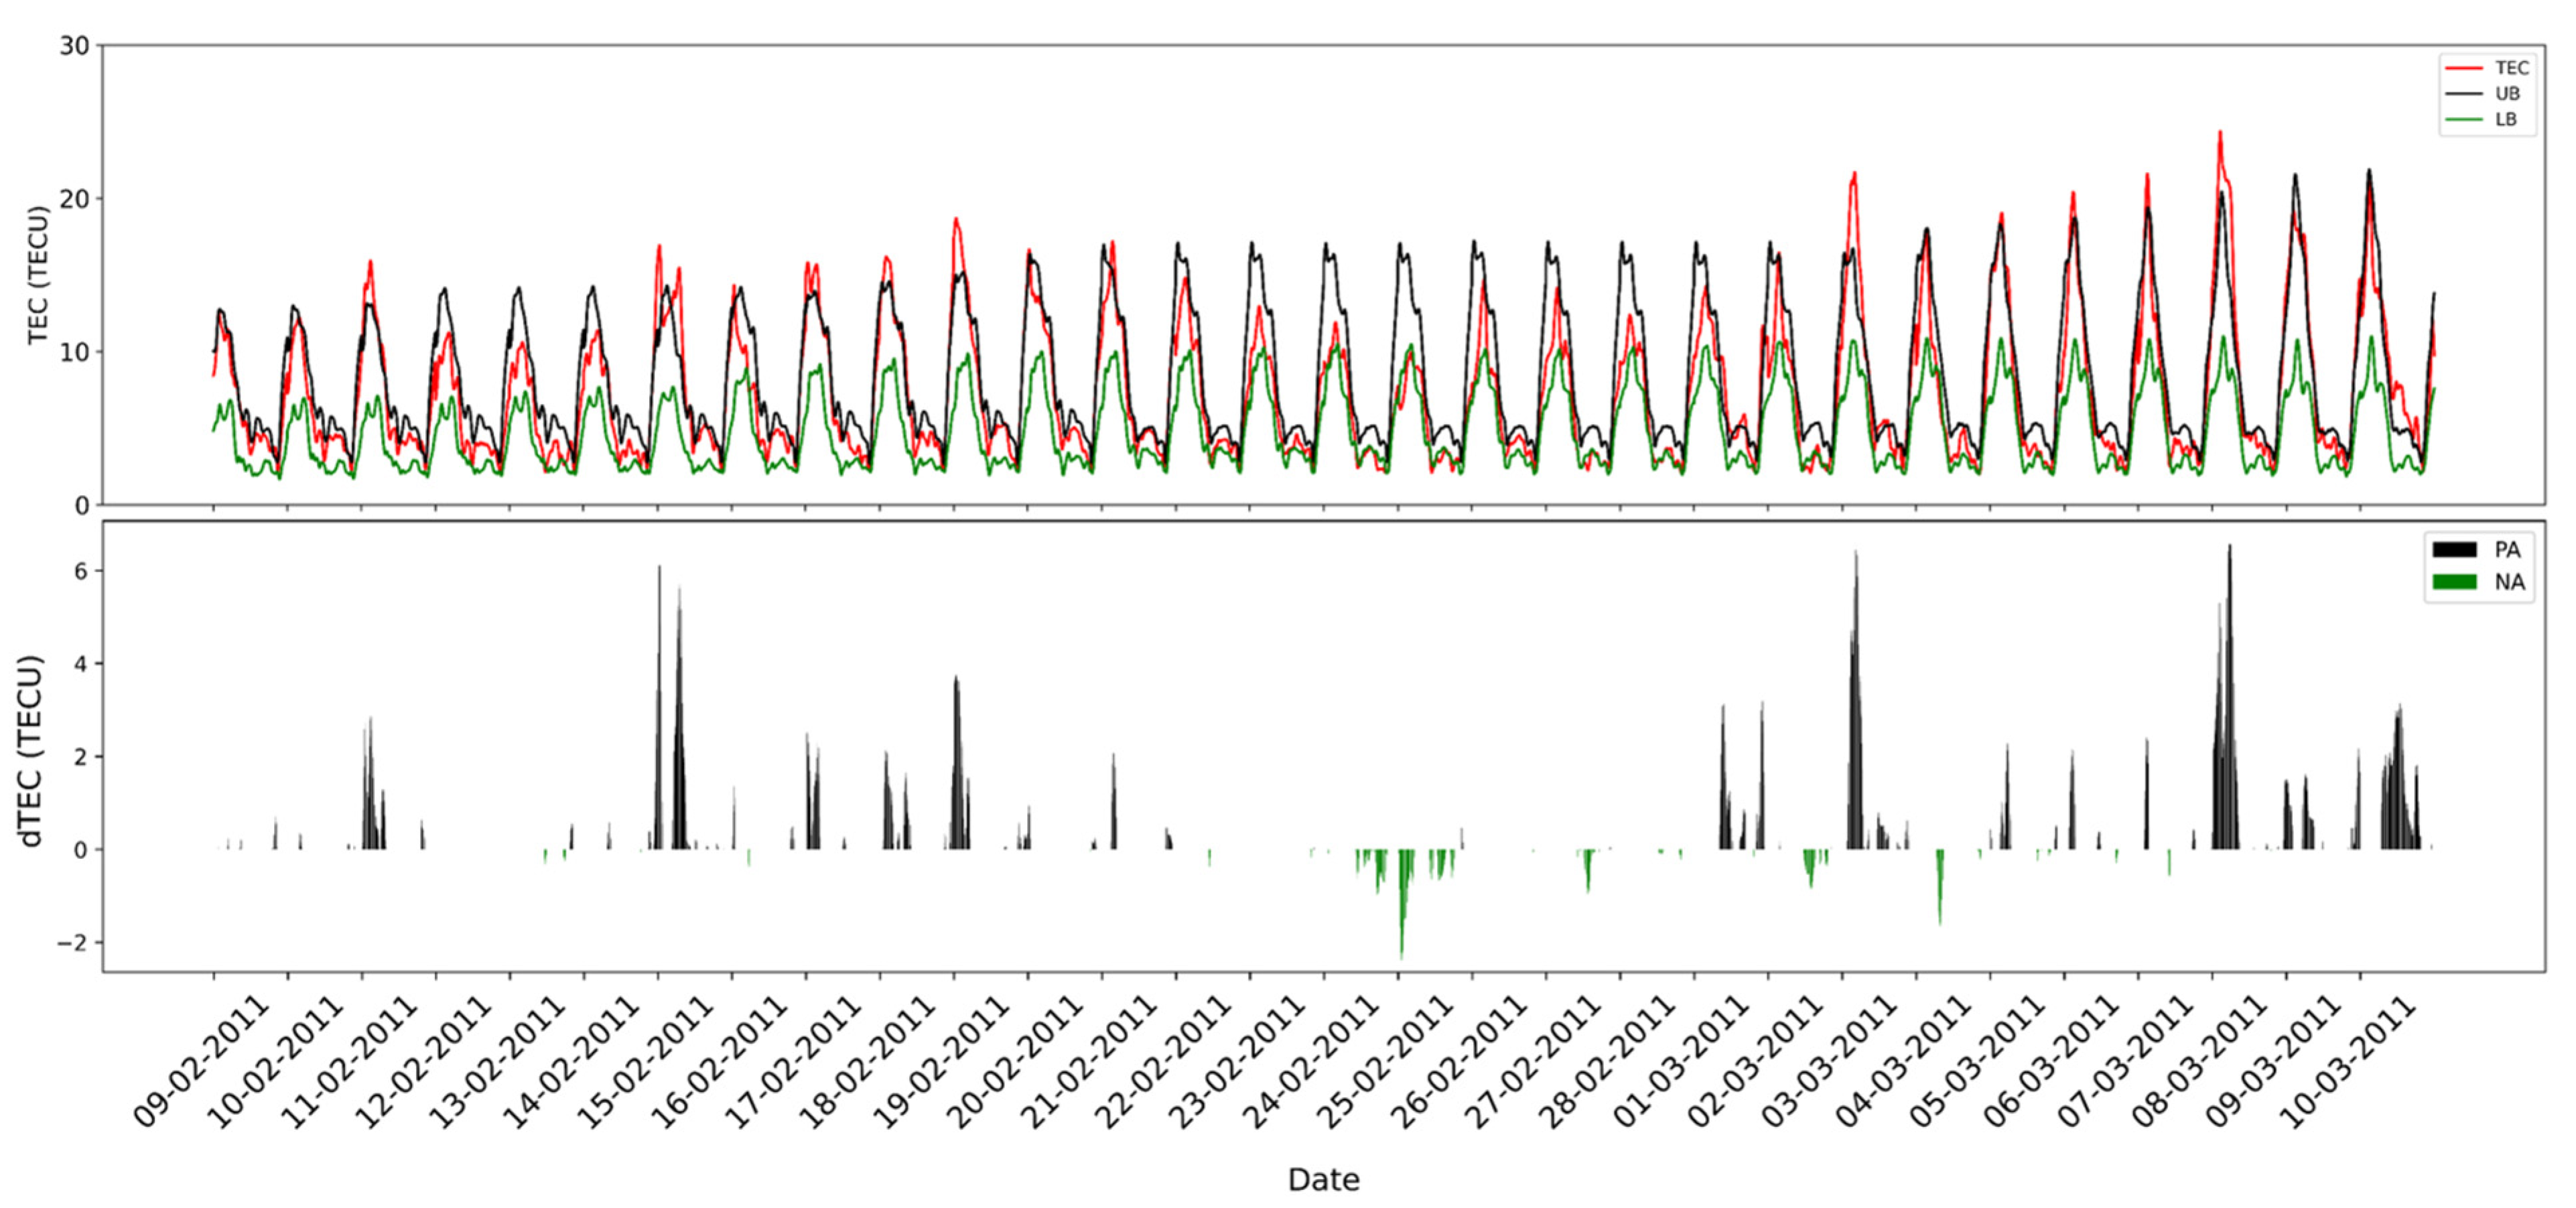
The Tohoku earthquake of Japan, also known as the Great East Japan earthquake, was a natural disaster that occurred on 11 March 2011. The earthquake was caused by thrust faulting at the plate boundary between the Pacific and North American plates. The earthquake had a magnitude of 9.1, making it the most powerful earthquake recorded in Japan since 1900 and the fourth most powerful ever detected worldwide. In
Figure 1, variations in the Total Electron Content (TEC) are depicted for the period of 30 days prior to the earthquake of 11 March 2011, utilizing data from the closest continuous GPS (cGPS) station, MIZU, situated at 142 km from the earthquake’s epicenter. The analysis reveals several positive anomalies between 14–19 February and 3 March 2011, as well as between 7–10 March 2011. The black and green polygon denotes instances where the TEC values exceed the limits set by Equation (1). Of notable significance, a pronounced anomaly displaying a TEC concentration exceeding 6 TECU was evident on 8 March 2011, markedly three days before the main earthquake event. The most substantial negative anomaly, dipping below 2 TECU, was observed on 25 February 2011. The PPA anomaly for 8 March is calculated to be 01.10 UTC while the NPA for 25 February is 05.47 UTC as per Equations (2) and (3).
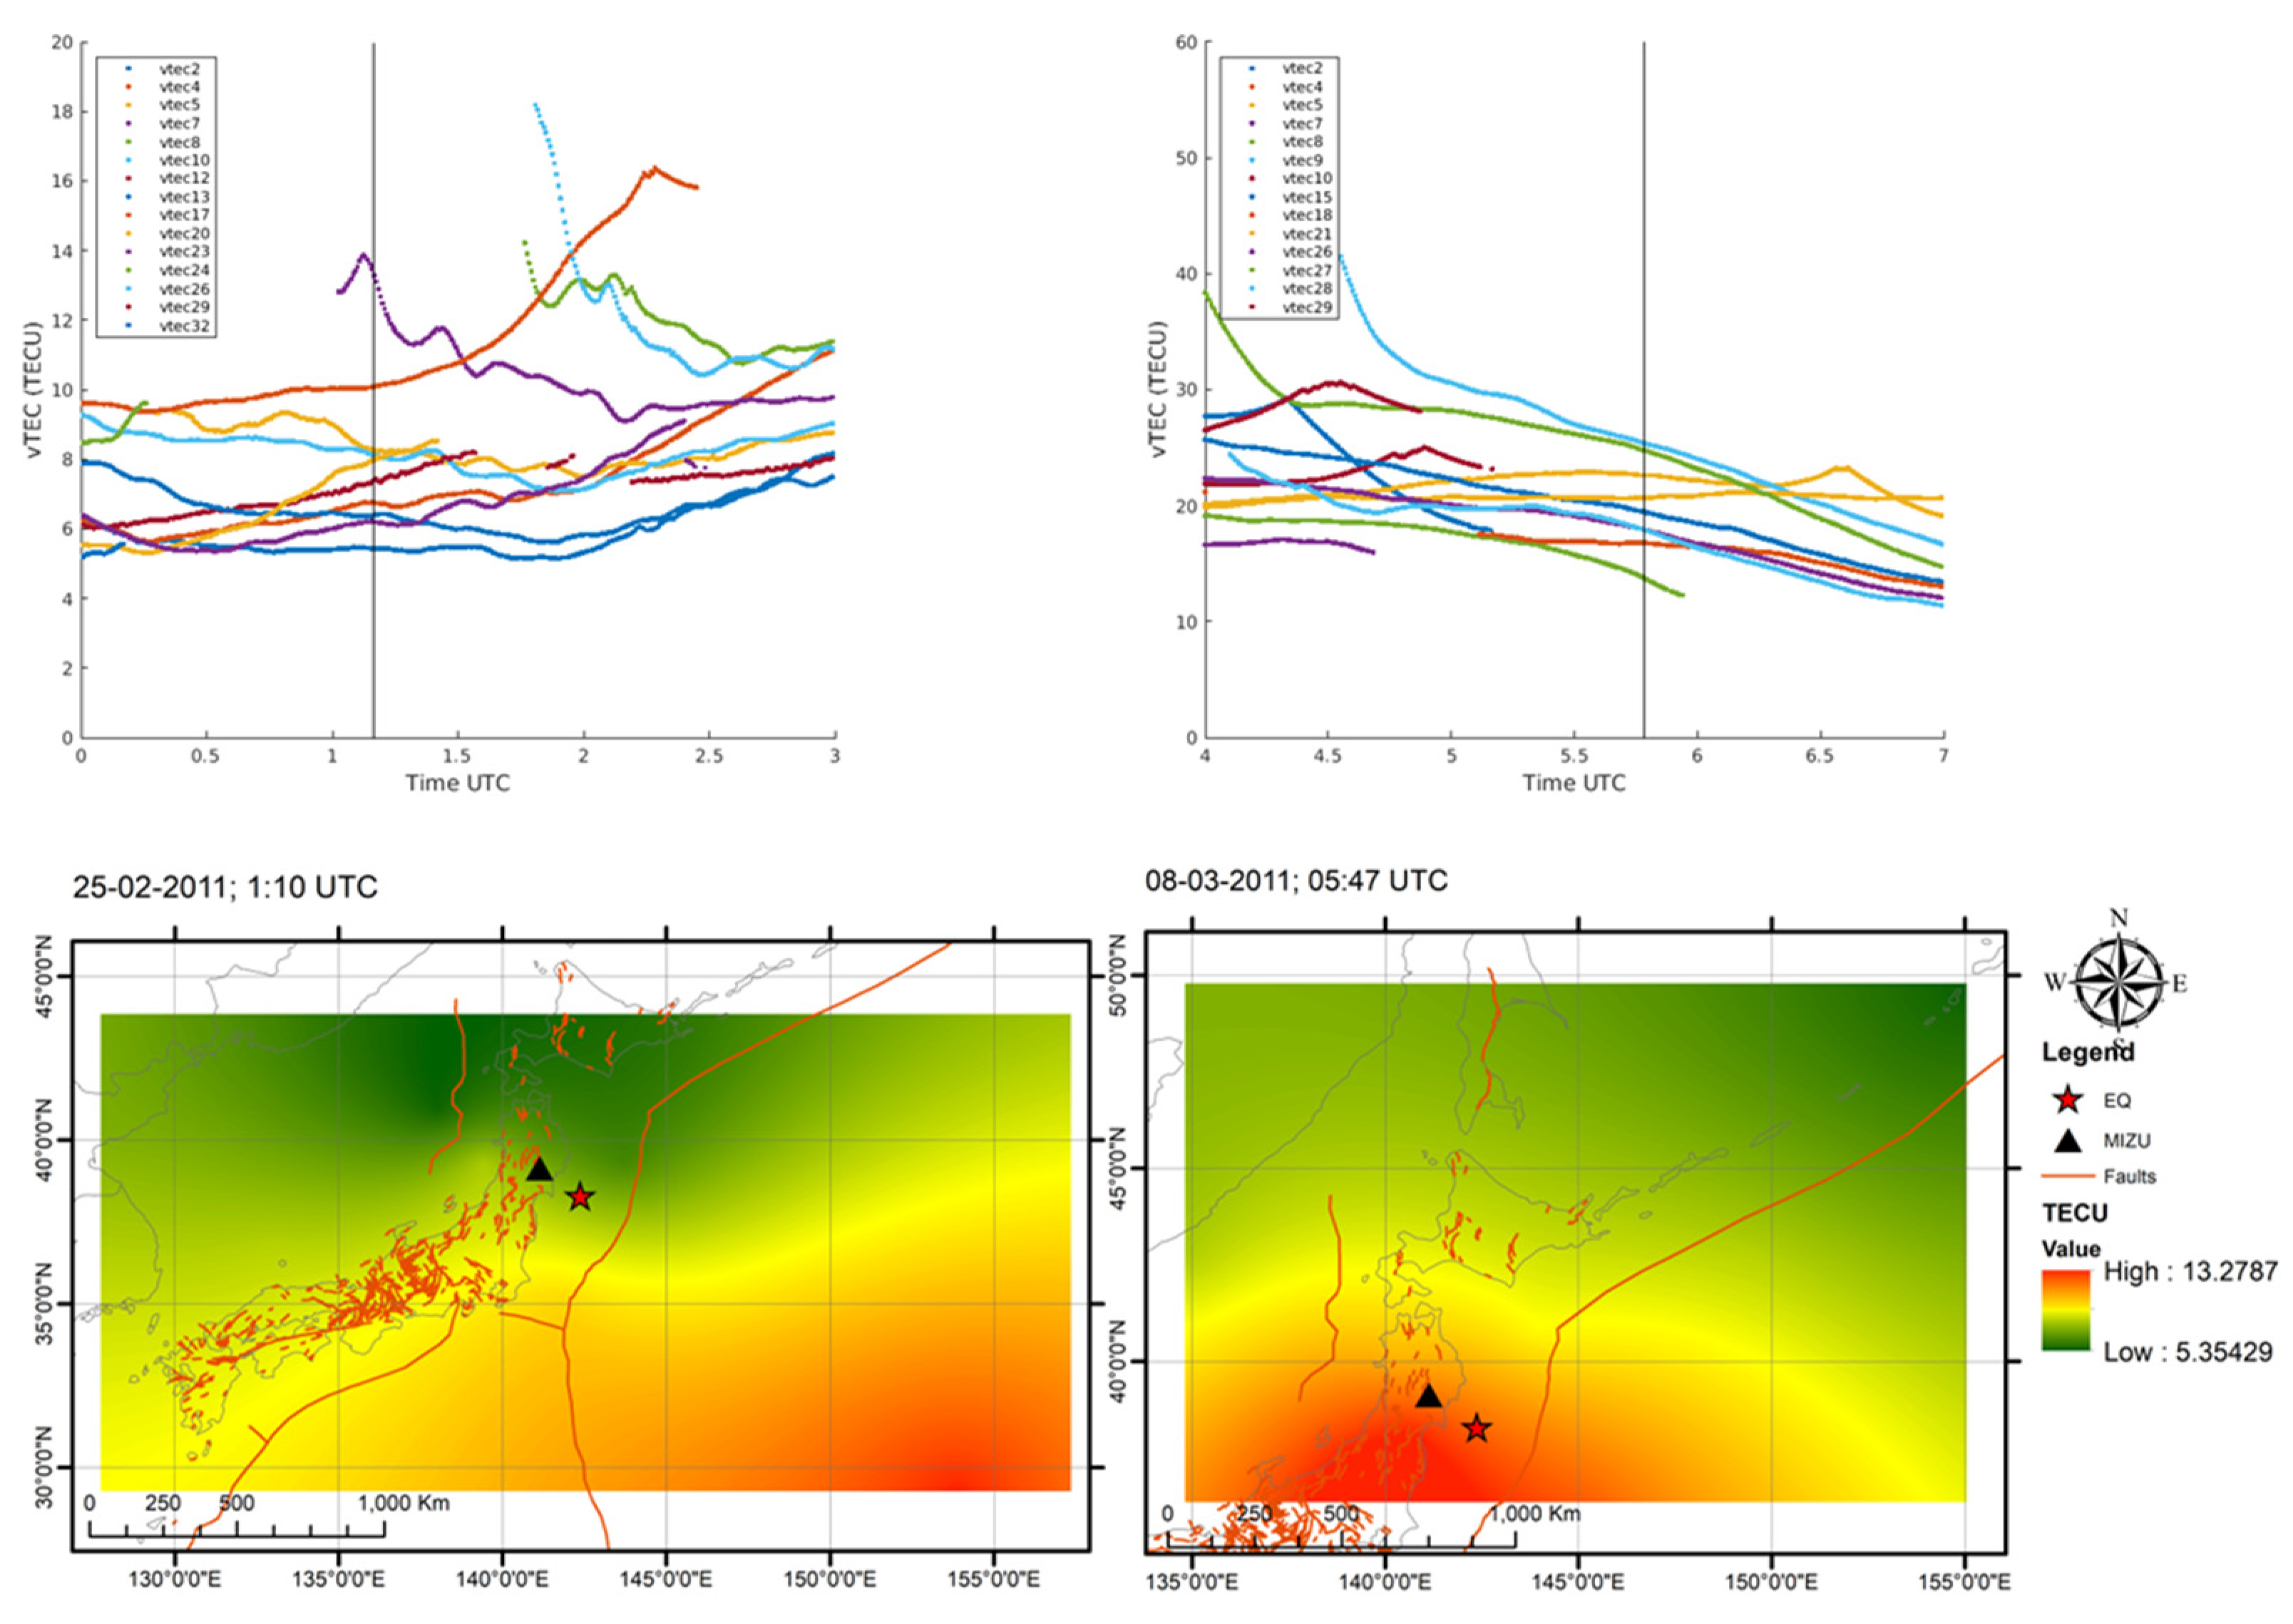
Figure 2’s upper-left and upper-right panels depict the PRNs available at the nearest station, MIZU, corresponding to the Peak Negative Anomaly (PNA) and Peak Positive Anomaly (PPA) times, respectively. The upper-left panel illustrates the vTEC behavior of each PRN at the anomaly time of 01:10 UTC during PNA. Conversely, the upper-right panel presents the vTEC behavior of each PRN at the PPA time of 05:47 UTC. The black line represents the anomaly time for each PNA and PPA. Applying kriging interpolation to the PRNs’ vTEC values for each anomaly time produced the lower panel of
Figure 2 for each anomaly time. The figure clearly illustrates that the anomaly zone lies in close proximity to the epicenter. Specifically, the PNA’s most substantial negative anomaly occurred near the epicenter on 25 February 2011. In contrast, the positive anomaly is noted near the epicenter for PPA on 8 March 2011, as evidenced by the lower-right and lower-left panels of
Figure 2.
3.2. Nepal (7.8 Mw) Earthquake
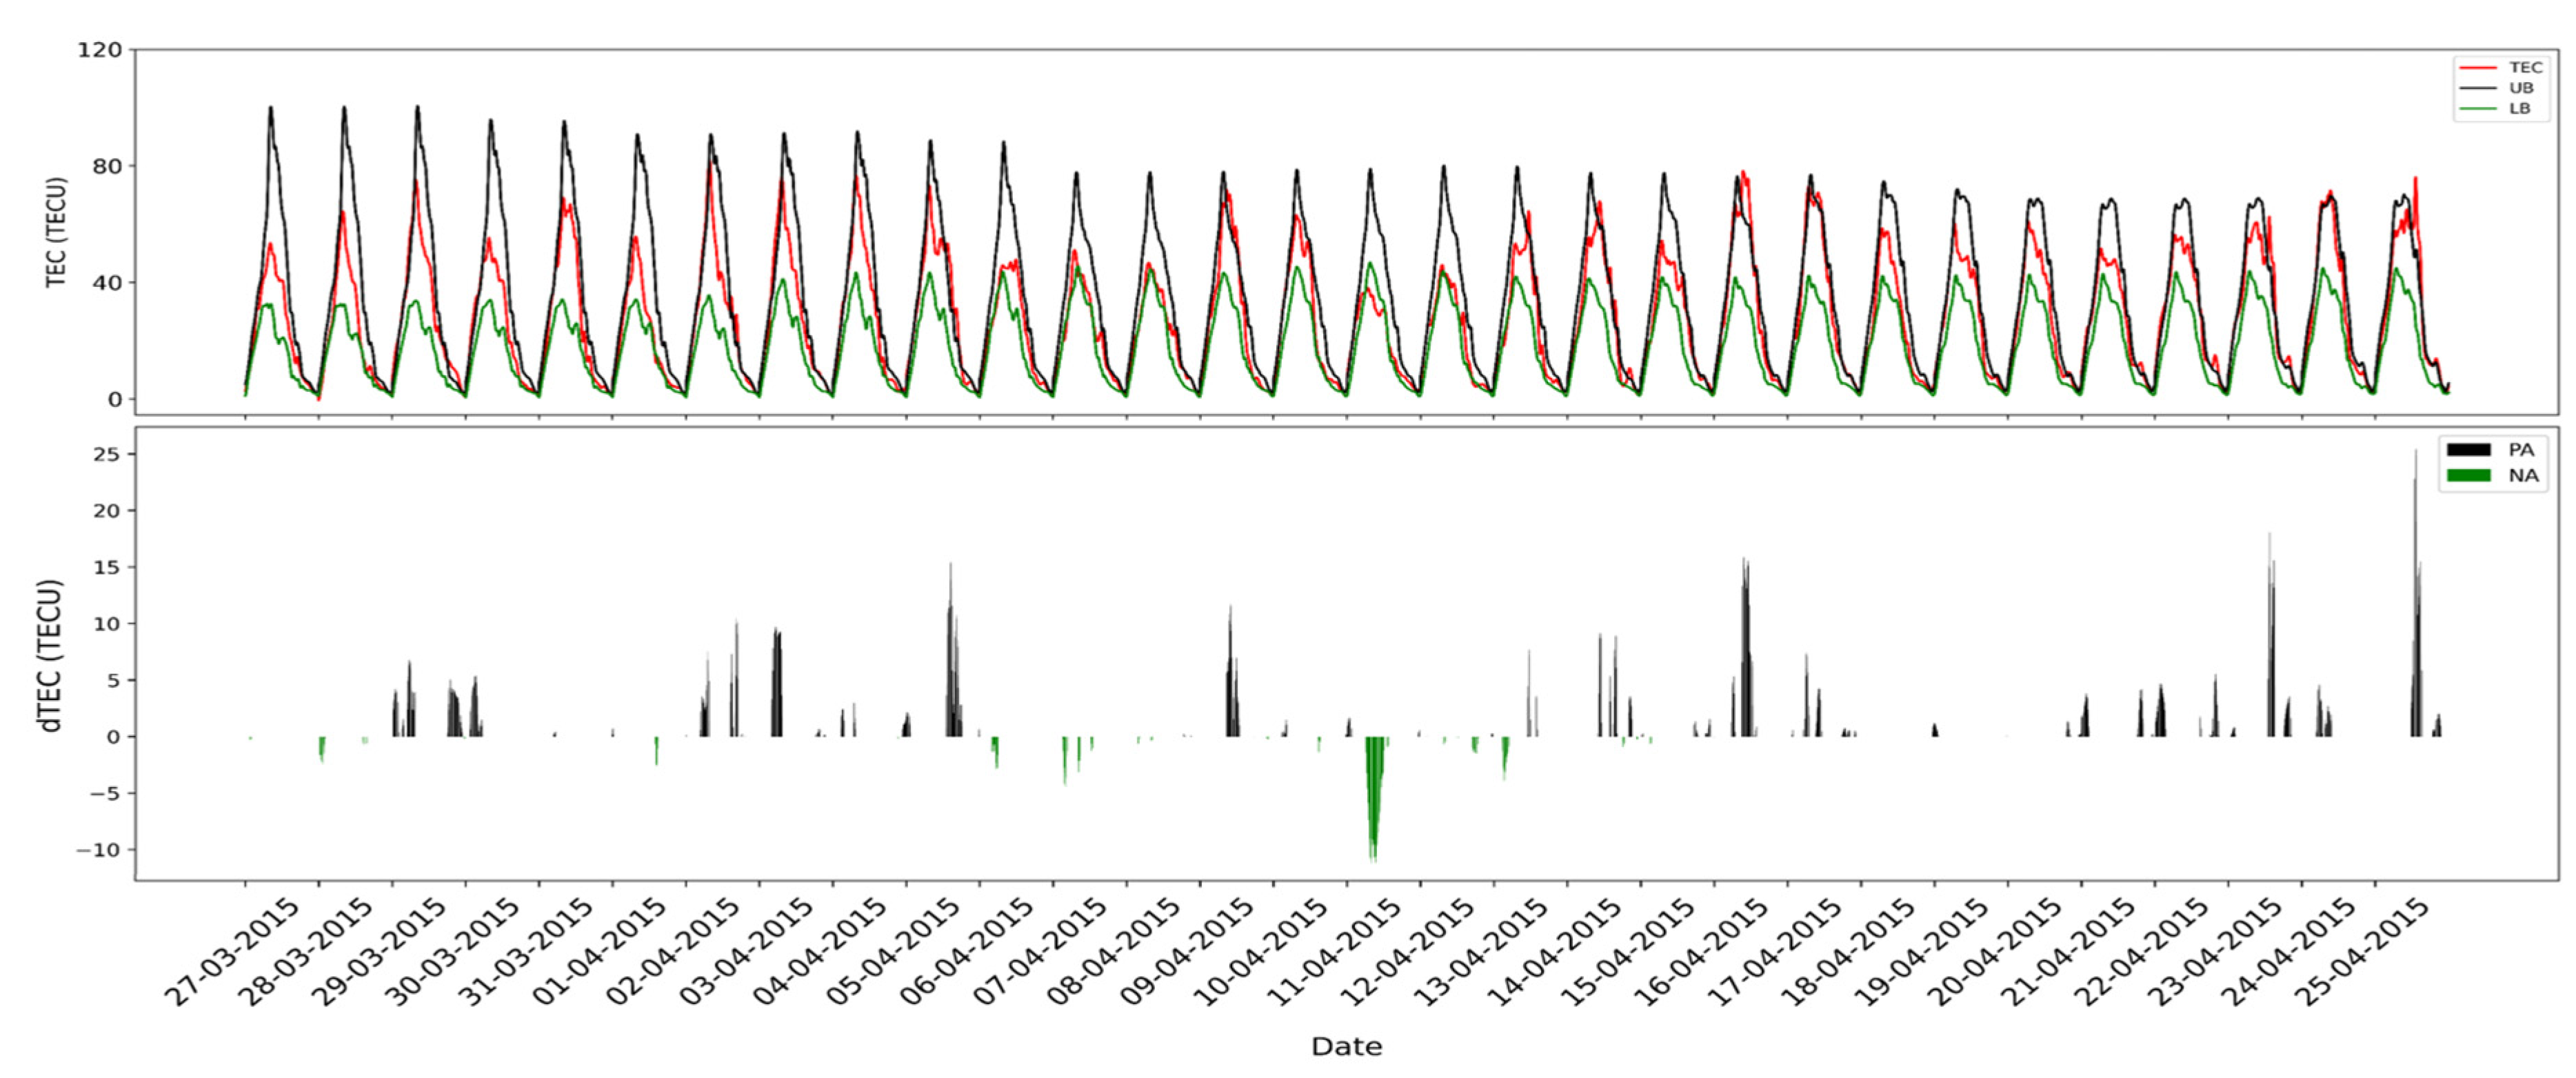
The Nepal earthquake of 25 April 2015, also known as the Gorkha earthquake, was a devastating seismic event that struck Nepal with a magnitude of 7.8 Mw.
Figure 3 displays the TEC variations thirty days prior to the event. It is observed that a continuous positive anomaly is seen with the highest being on 25 April with a TECU difference of 25 units, just a few hours prior to the event. The PPA is calculated to be at 13.08 UTC, while a promiscuous negative anomaly was observed to be on 11 April with a TECU difference of 10 units, the PNA was calculated to be 07.45 UTC.
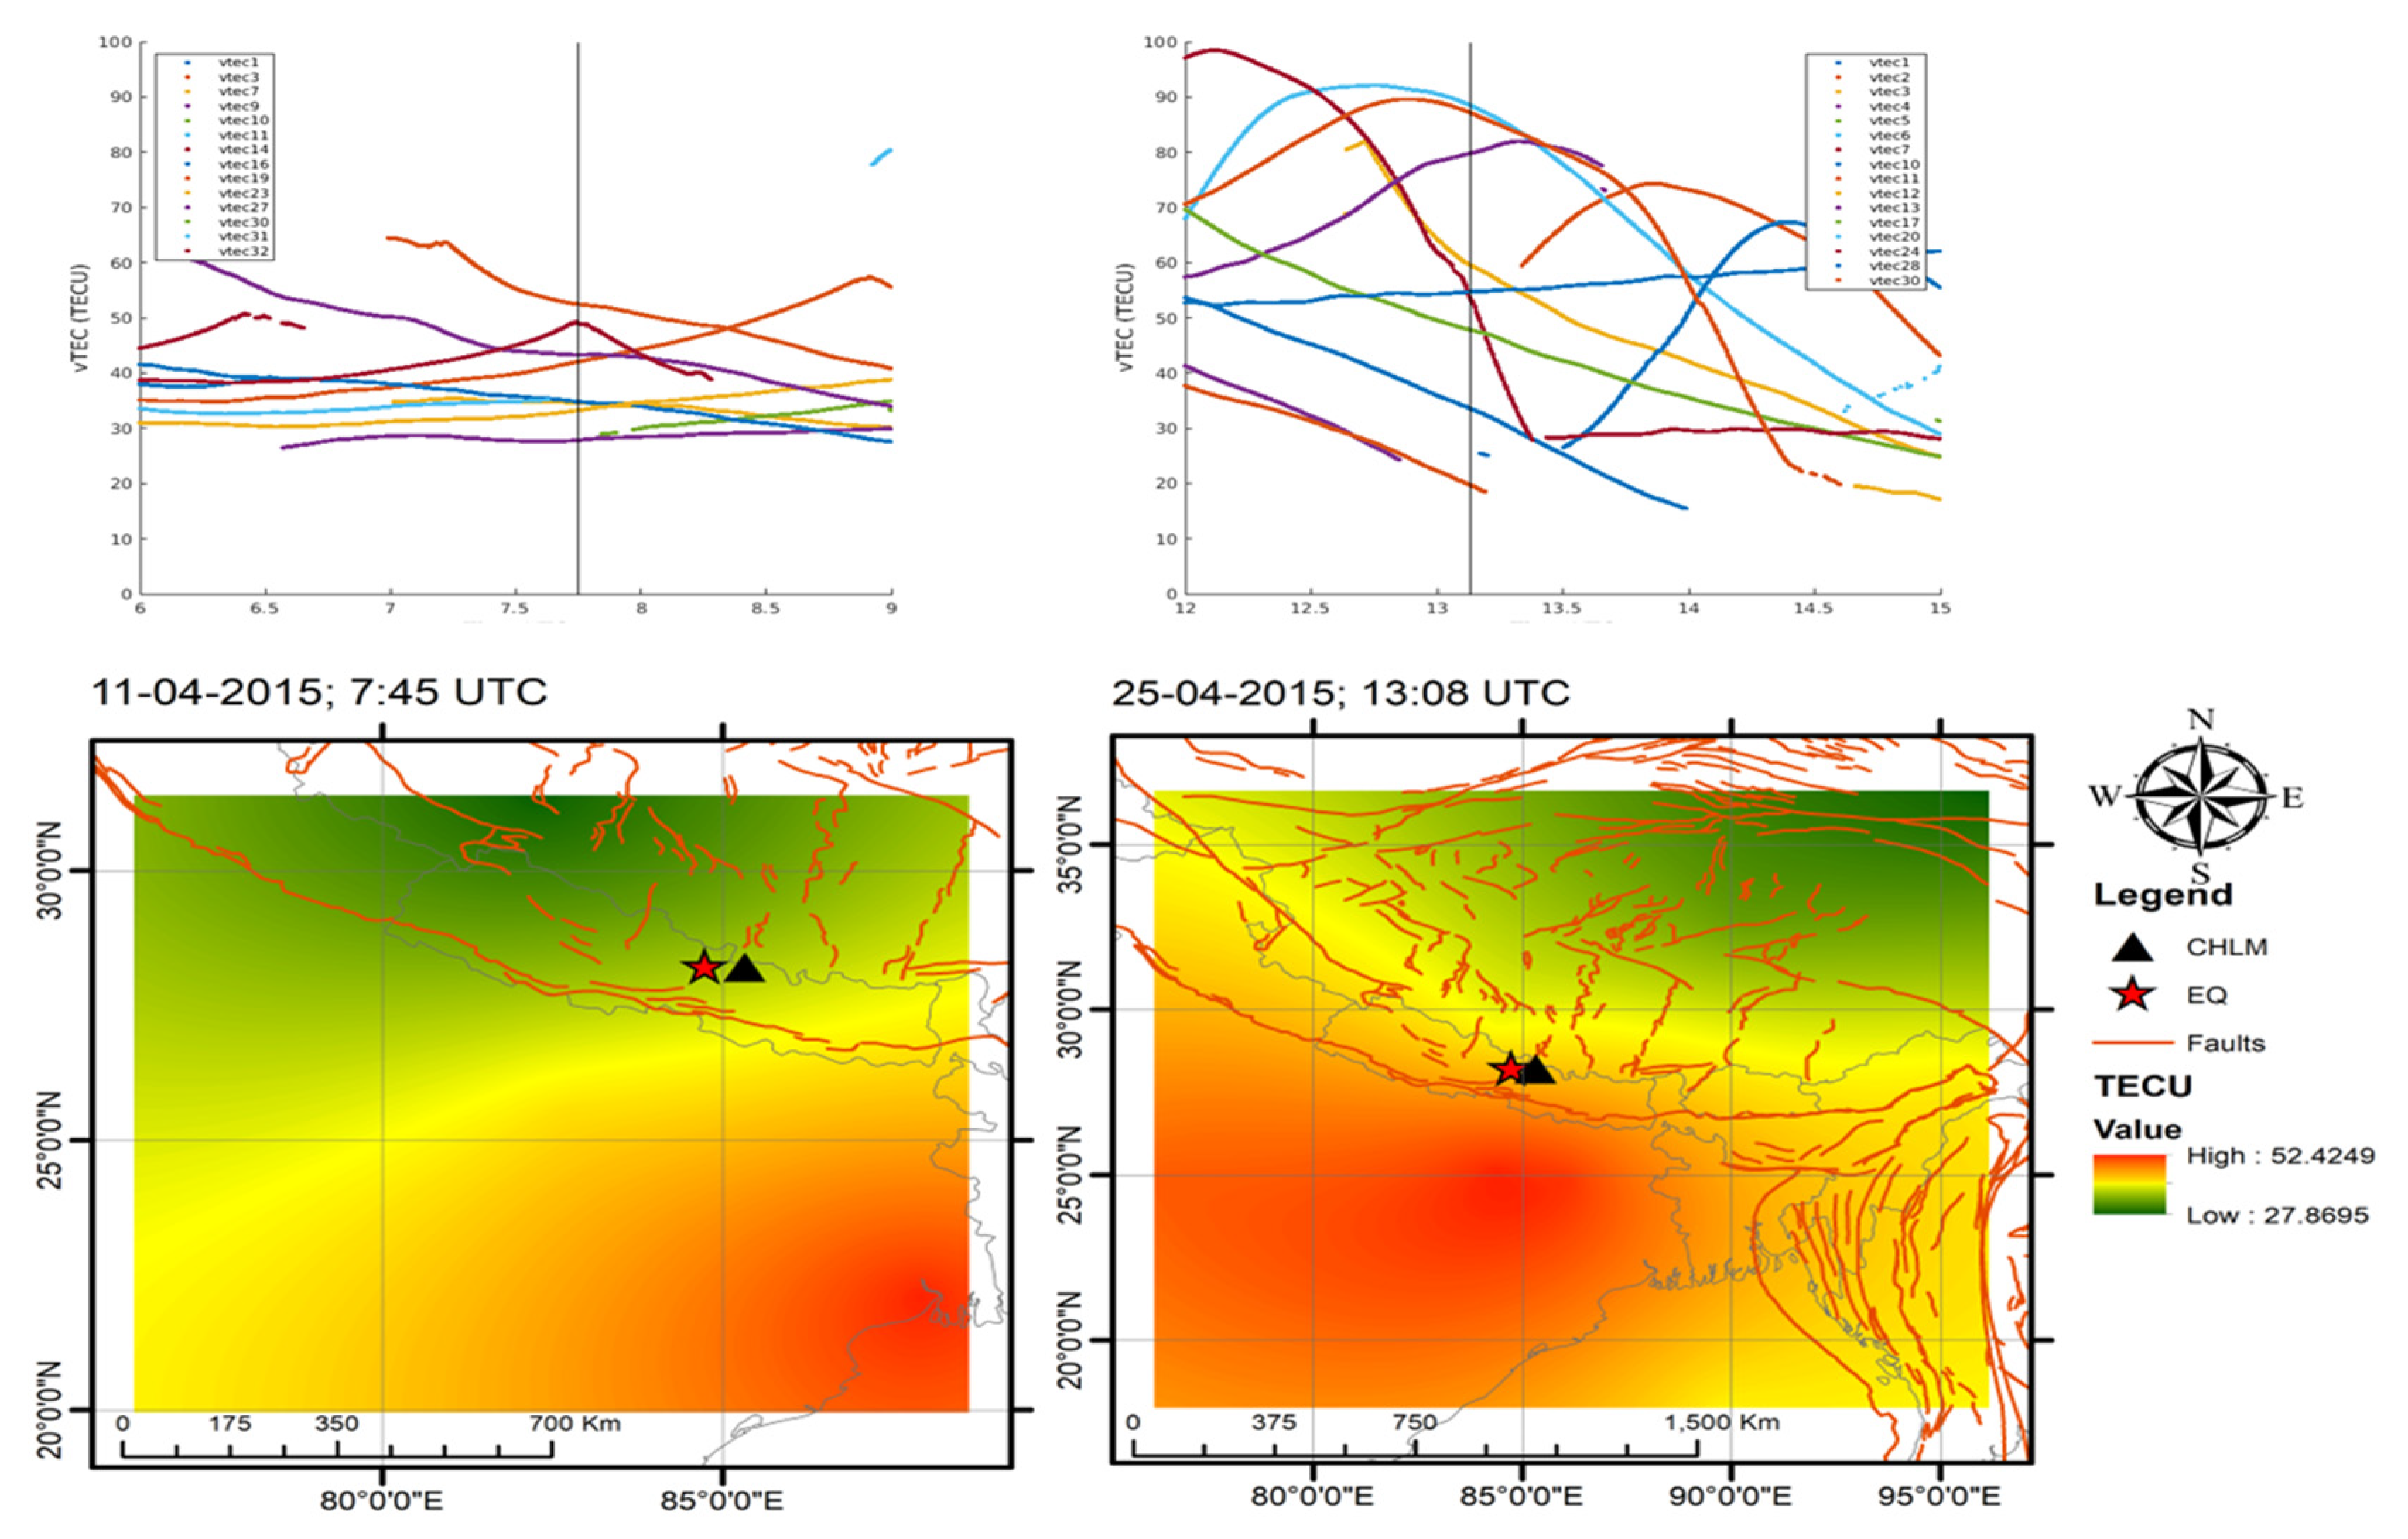
Figure 4 illustrates the behavior of vTEC PRNs concerning both the Peak Negative Anomaly (PNA) and Peak Positive Anomaly (PPA). Consistent with the findings related to the Japan earthquake, it is also evident in this instance that the anomaly zone is situated in proximity to the epicenter. The upper-left and upper-right panels showcase the available PRN data at the nearest station, CHLM, for the PNA and PPA times, respectively. In the lower panel, it becomes clear that the most significant negative anomaly for the PNA occurred near the epicenter on 11 April 2015. Conversely, the positive anomaly was observed near the epicenter for PPA on 25 April 2015. These observations are clearly demonstrated in the lower-right and lower-left panels of
Figure 4.
3.3. Turkey (7.8 Mw) Earthquake
The Turkey earthquake of 6 February 2023, was a major seismic event that struck southeastern Turkey near the Syrian border with a magnitude of 7.8 Mw. On 28 January 2023, a highly notable positive anomaly in Total Electron Content (TEC) was observed, indicating a difference of 15 TECU, a full 8 days before an event. Interestingly, a negative anomaly characterized by a significant difference of 5 TECU was noticed just a day after the positive anomaly, as illustrated in
Figure 5. The Peak Positive Anomaly (PPA) for 28 January was determined to be at 10.16 UTC, while the Peak Negative Anomaly (PNA) for 29 January was calculated to be at 14.19 UTC. Similar to the conclusions drawn from the Japan and Nepal earthquakes, it is apparent in this case as well that the anomaly region is positioned close to the epicenter. As depicted in
Figure 6, the upper-left and upper-right panels provide an overview of the PRN data available at the nearest station, MERS, for the PNA and PPA times, respectively. Notably, both the negative and positive anomalies at their respective peak times are situated in proximity to the epicenter. This emphasizes the notion that estimating the TEC using PRNs from the nearest cGPS station could serve as an effective earthquake precursor.
4. Conclusions
In conclusion, this study’s examination of ionospheric Total Electron Content (TEC) anomalies in relation to seismic activity reveals promising correlations for earthquake precursor detection. Analyzing notable earthquakes in Japan, Nepal, and Turkey, this research identifies consistent positive and negative TEC anomalies prior to seismic events, often near the epicenters. While preliminary, these findings suggest TEC anomalies could serve as indicators of impending earthquakes. Nevertheless, this study underscores the necessity of expanded datasets and further research to strengthen these connections. Ultimately, this work opens an avenue for advancing earthquake precursor detection methods and emphasizes the potential significance of TEC anomalies in seismic monitoring and early warning systems utilizing the available PRNs from the nearest cGPS stations.
Author Contributions
Conceptualization, K.N. and C.L.U.; methodology, K.N.; software, K.N.; validation, R.R.A., G.S. and M.E.T.S.; formal analysis, K.N.; investigation, K.N. and C.L.U.; resources, K.N.; data curation, C.L.U.; writing—original draft preparation, K.N.; writing—review and editing, K.N.; visualization R.R.A.; supervision, G.S.; project administration, M.E.T.S.; funding acquisition, K.N. All authors have read and agreed to the published version of the manuscript.
Funding
This work was carried out with the support (CVU: 1182470) of the National Council of Science and Technology (CONACyT) in Mexico.
Data Availability Statement
The data can be made available by the corresponding author upon request.
Acknowledgments
The authors would like to thank USGS, UNAVCO, National Oceanic and Atmospheric Administration (NOAA for freely providing high-quality data for the analysis.
Conflicts of Interest
The authors declare no conflicts of interest.
References
- Malik, J.N.; Nakata, T. Active Faults and Related Late Quaternary Deformation along the Northwestern Himalayan Frontal Zone, India. Annals of Geophysics. Ann. Geophys. 2003, 46, 917–935. Available online: http://hdl.handle.net/2122/996 (accessed on 20 March 2023).
- Sharma, M.L.; Lindholm, C. Earthquake hazard assessment for Dehradun, Uttarakhand, India, including a characteristic earthquake recurrence model for the Himalaya Frontal Fault (HFF). Pure Appl. Geophys. 2012, 169, 1601–1617. [Google Scholar] [CrossRef]
- Romero-Andrade, R.; Trejo-Soto, M.E.; Nayak, K.; Hernández-Andrade, D.; Bojorquez-Pacheco, N. Lineament analysis as a seismic precursor: The El Mayor Cucapah earthquake of April 4, 2010 (MW7. 2), Baja California, Mexico. Geod. Geodyn. 2023, 14, 121–129. [Google Scholar] [CrossRef]
- Dey, S.; Singh, R.P. Surface latent heat flux as an earthquake precursor. Nat. Hazards Earth Syst. Sci. 2003, 3, 749–755. [Google Scholar] [CrossRef]
- Saraf, A.K.; Choudhury, S. Thermal remote sensing technique in the study of pre-earthquake thermal anomalies. J. Indian Geophys. Union 2005, 9, 197–207. [Google Scholar]
- Hayakawa, M. Lower ionospheric perturbations associated with earthquakes, as detected by sub ionospheric VLF/LF radio signals. In Electromagnetic Phenomena Associated with Earthquakes; Hayakawa, M., Ed.; Transworld Research Network: Trivandrum, India, 2009; pp. 137–186. [Google Scholar]
- Ouzounov, D.; Liu, D.; Chunli, K.; Cervone, G.; Kafatos, M.; Taylor, P. Outgoing long wave radiation variability from IR satellite data prior to major earthquakes. Tectonophysics 2007, 431, 211–220. [Google Scholar] [CrossRef]
- Dong, Y.; Gao, C.; Long, F.; Yan, Y. Suspected Seismo-Ionospheric Anomalies before Three Major Earthquakes Detected by GIMs and GPS TEC of Permanent Stations. Remote Sens. 2022, 14, 20. [Google Scholar] [CrossRef]
- Nayak, K.; Romero-Andrade, R.; Sharma, G.; Zavala, J.L.C.; Urias, C.L.; Trejo Soto, M.E.; Aggarwal, S.P. A combined approach using b-value and ionospheric GPS-TEC for large earthquake precursor detection: A case study for the Colima earthquake of 7.7 Mw, Mexico. Acta Geod. Geophys. 2023, 58, 515–538. [Google Scholar] [CrossRef]
- Sharma, G.; Mohanty, S.; Kannaujiya, S. Ionospheric TEC modeling for earthquakes precursors from GNSS data. Quat. Int. 2017, 462, 65–74. [Google Scholar] [CrossRef]
- Seemala GP (2017) GPS-TEC Analysis Application. Technical Document. Available online: http://seemala.blogspot.com (accessed on 10 August 2022).
- Wild, U. Ionosphere and Geodetic Satellite Systems: Permanent GPS Tracking Data for Modelling and Monitoring; Geod Geophys Arb: Zürich, Switzerland, 1994; Volume 48. [Google Scholar]
- Sharifi, M.A.; Farzaneh, S. Local ionospheric modeling using the localized global ionospheric map and terrestrial GPS. Acta Geophys. 2016, 64, 237.e252. [Google Scholar] [CrossRef]
- Nayak, K.; López-Urías, C.; Romero-Andrade, R.; Sharma, G.; Guzmán-Acevedo, G.M.; Trejo-Soto, M.E. Ionospheric Total Electron Content (TEC) Anomalies as Earthquake Precursors: Unveiling the Geophysical Connection Leading to the 2023 Moroccan 6.8 Mw Earthquake. Geosciences 2023, 13, 319. [Google Scholar] [CrossRef]
| Disclaimer/Publisher’s Note: The statements, opinions and data contained in all publications are solely those of the individual author(s) and contributor(s) and not of MDPI and/or the editor(s). MDPI and/or the editor(s) disclaim responsibility for any injury to people or property resulting from any ideas, methods, instructions or products referred to in the content. |
© 2024 by the authors. Licensee MDPI, Basel, Switzerland. This article is an open access article distributed under the terms and conditions of the Creative Commons Attribution (CC BY) license (https://creativecommons.org/licenses/by/4.0/).


 ,
, 


