
Managing and Utilizing Big Data in Atmospheric Monitoring Systems for Underground Coal Mines †


1
Department of Mining Engineering, University of Kentucky, Lexington, KY 40506, USA
2
Department of Electrical Engineering, Technical University of Crete, 73100 Chania, Greece
*
Author to whom correspondence should be addressed.
†
Presented at International Conference on Raw Materials and Circular Economy, Athens, Greece, 5–9 September 2021.
Mater. Proc. 2021, 5(1), 78; https://doi.org/10.3390/materproc2021005078
Published: 11 December 2021
(This article belongs to the Proceedings of International Conference on Raw Materials and Circular Economy)
Abstract
:Underground coal mining Atmospheric Monitoring Systems (AMS) have been implemented for real-time or near real-time monitoring and evaluation of the mine atmosphere and related parameters such as gas concentration (e.g., CH4, CO, O2), fan performance (e.g., power, speed), barometric pressure, ambient temperature, humidity, etc. Depending on the sampling frequency, AMS can collect and manage a tremendous amount of data, which mine operators typically consult for everyday operations as well as long-term planning and more effective management of ventilation systems. The raw data collected by AMS need considerable pre-processing and filtering before they can be used for analysis. This paper discusses different challenges related to filtering raw AMS data in order to identify and remove values due to sensor breakdowns, sensor calibration periods, transient values due to operational considerations, etc., as well as to homogenize time series for different variables. The statistical challenges involve the removal of faulty values and outliers (due to systematic problems) and transient effects, gap-filling (by means of interpolation methods), and homogenization (setting a common time reference and time step) of the respective time series. The objective is to derive representative and synchronous time series values that can subsequently be used to estimate summary statistics of AMS and to infer correlations or nonlinear dependence between different data streams. Identification and modeling of statistical dependencies can be further exploited to develop predictive equations based on time series models.
1. Introduction
In recent years, the monitoring of atmospheric conditions in underground coal mines has considerably improved due to technological advances in different areas such as machine learning, the internet of things (IoT), electronics, and data transmission, among others. As a result, Atmospheric Monitoring Systems (AMS) used in underground coal mines operations can collect and store big datasets; large mine operations can generate more than 100 GB of data annually [1]. Mine operators typically utilize these data to manage everyday operations and for more effective and efficient management of ventilation systems as well as for long-term planning [2,3]. In addition, the raw data regarding mine atmosphere and related parameters collected by AMS can be used to develop forecasting models for toxic and explosive gases in underground coal mines based on time series models. However, prior to conducting any analysis, the collected data need to be pre-processed, i.e., cleaned, filtered, and homogenized.
Real-world databases are generally inconsistent or incomplete. As a result, information may be missing and/or existing data may not be accurate, which directly affects the outcomes of forecasting models, including time series models [4]. Data pre-processing is a crucial technique that deals with such issues. Data pre-processing, also known as data cleaning, can be defined as a set of operations to detect and remove erroneous values and outliers, determine missing values, smooth noisy data, and adjust time series inconsistencies [5]. In other words, data cleaning is the process of transforming raw data collected and stored from different data collection systems (DCSs), in this particular case, atmospheric monitoring systems in underground coal mines, into datasets that can be used for planning, modeling, visualization, and decision-making [6,7].
There are many challenges concerning datasets collected and stored by AMS in underground coal mines, such as data gaps due to sensor malfunction or calibration. In addition, identifying and removing faulty values including outliers (due to systematic problems) is another critical matter that compromises measurement accuracy. Moreover, outlier detection helps identify malfunctioning sensors or unusual events [8]. Finally, data homogenization is challenging when dealing with time-series data, as it is crucial to guarantee that data points from different series share common date/time stamps. Figure 1 schematically presents a typical sequential procedure of data collection and pre-preprocessing [1].
The research presented in this paper discusses all the challenges related to AMS data collection and storage in the process of developing representative and synchronous time series values that can be used to estimate summary statistics of AMS and identify correlations (linear or nonlinear) between different data streams with the ultimate goal of developing forecasting models based on time series analysis.
2. Methane Gas Generation in Underground Coal Mines
Coalbed methane (CBM), also known as coal mine methane (CMM), is methane gas present in underground coal seams. It is produced due to the geological process of coalification, i.e., the decomposition of organic matter into coal [9]. CBM is mainly composed of methane gas (CH4), carbon dioxide (CO2), nitrogen (N2), butanes (C4H10), propane (C3H8), and ethane (C2H6) [10], with methane being the principal component as it covers approximately 80–90% of the total gas volume [11]. CMM refers mainly to methane released during coal mining activities when the coal seam is fractured. Thus, CMM and CBM can be defined as subsects of the methane gas found in coal seams. However, CMM refers exclusively to the methane gas present and released from mined coal seams, while CBM reflects the methane gas present in unminable coal seams [9,10].
The amount of CMM generated at a specific underground coal mine operation depends basically on three main parameters; operational variables such as the mining method and productivity of the coal mine, the gassiness of the coal seam, and its geological conditions (e.g., coal rank, coal seam fractures, and coal seam depth) [11,12]. Coal extraction releases more methane than was initially confined within the mined coal seam itself due to the fractures developed in the surrounding strata and the pressure drop caused during mining, which draws additional gas from the adjacent strata. That is particularly true in longwall mining which can reach high production rates, e.g., 20,000 and 30,000 tons of coal daily [11,13,14].
The large amount of methane released in underground coal mines is an essential concern for mine ventilation management in order to ensure worker health and safety as CH4 is highly explosive for concentrations ranging from 5% to 15% [15]. Excessive methane gas concentration accounts for more than 80% and almost 90% of the accidents and fatalities in the underground coal mining industry in the United States, respectively [16]. Dealing with coal mine methane involves understanding and identifying the critical parameters that influence methane emission and hazardous accumulations such as coal production, atmospheric pressure, humidity, air velocity, and fan performance [1,2,3].
3. Coal Mine Methane Forecasting Methods
Methane gas forecast techniques can be categorized mainly into three groups depending on the scientific method implemented. The first group consists of methods that are based on empirical data and expertise to forecast methane gas emissions. The second group includes numerical forecasting methods; it comprises methodologies that solve physical models represented mathematically by a set of equations. Finally, the third approach is based on collecting, pre-processing, processing, and analyzing raw data using statistical techniques, also known as the statistical approach [3,15,17].
Empirical and numerical methane forecasting methods are expensive, time-consuming, and limited to a specific location and mine. In addition, they are directly affected by the combination of natural and technical factors that influence methane gas behavior in each particular case, such as geological conditions of the surrounding rock and mined coal seams (e.g., fractures, amount of methane concentrated and emitted), technical specifications of the mining process (e.g., mining method, advance rate, mine depth, ventilation system).
In contrast to empirical and numerical methods, statistical forecasting techniques (such as time series models) are less expensive and faster. Most importantly, they can be easily generalized because they are based on analyzing and interpreting historical data rather than the physical processes and the relevant factors (mine operation, geological setting) that influence methane emissions [3].
4. Case Study
The atmospheric monitoring data were collected from an active underground longwall coal mine located in the eastern USA, renamed Mine A, due to confidentiality reasons. The dataset consists of methane concentration measurements collected by sensors at a number of exhaust shafts as well as daily production values (tons/day) that could be attributed to each shaft. Data records are available for several years. The work presented in this study is based on data from two shafts only (B and D). In addition, a python routine was developed to download meteorological data (i.e., barometric pressure, temperature, humidity, among others) from a public weather station in proximity to Mine A (Weather Underground (WU)) that provides real-time weather information online. Barometric pressure (BP) data were also provided by sensors available at the mine location. Table 1 summarizes the data used for this research and the measurement frequency for each parameter.
Mine A and WU data were populated into a custom relational database known as AMANDA, which stands for Atmospheric Monitoring Analysis and Database mAnagement. AMANDA has been designed explicitly for AMS data. It has many subsystems such as data analysis, validation and storage, data reporting, and visualization. For example, the two plots in Figure 2 illustrate a visualization of BP for a five-day interval and the corresponding variation of CH4 emissions for the same five-day interval. In addition, the AMANDA system can run several basic statistics on the imported data. These statistics allow the user to check for negative values or any obvious outlier values in the data streams. AMANDA can accommodate multiple projects as well as multiple data streams per project [1].
Once data were populated in the database, a number of tools were employed to disable (not delete) evidently erroneous values (such as negative methane concentration measurements or methane measurements that correspond to either faulty sensors or calibration periods). The “cleaned” data streams were then exported for specific time periods.
These data streams were imported into the MATLAB environment for further data pre-processing. Finally, different MATLAB commands (e.g., interp1 performing interpolation) were used to transform the methane gas and BP data streams to a common time stamp.
5. Results and Discussion
The BP values collected at the public weather station were compared to the values collected at the mine (Figure 3). The correlation between the two data streams was very high. For example, for the 30-day interval shown in Figure 3, the Pearson correlation was R = 0.99. Thus, it was decided to use the regional BP instead of BP mine data since the former data stream was of higher quality (i.e., fewer missing points).
Figure 4a presents a superposition of methane gas concentration, coal production, and BP for 180 days for shaft B. Figure 4b presents a similar plot but only for methane gas concentration and BP for a different 180-day interval for the same shaft. The latter figure indicates that there are still methane emissions even without production due to already mined-out areas and/or exposed pillar ribs of all the development entries and crosscuts.
Initially, the analysis concentrated on time periods where production was zero to analyze the effect of BP on methane emissions and develop a baseline. Then, several such time periods were identified, and the respective data streams were analyzed separately.
Figure 5 includes four plots (a to d) that correspond to a segment of 250 days of data collected from shaft B. Figure 5a shows a plot of raw data for methane gas concentration and BP. Figure 5b illustrates the application of the interpolation function so that the two data streams acquire a common reference timestamp. Each of the two plots in Figure 5b shows the raw data and the interpolated data. Figure 5c shows the daily median (of the data shown in Figure 5a) as a representative value for each data stream. The scatter plot in Figure 5d exhibits a strong correlation between methane gas concentration and BP with a linear correlation coefficient R = −0.77. The negative sign of the correlation indicates that when BP drops, methane concentration tends to increase.
Figure 6 shows the plot of the cross-correlation function between the barometric pressure and the methane gas concentration for this segment for various time lags (shown along the horizontal axis). The cross-correlation at zero lag is ~−0.77, in agreement with the value shown in the scatter plot of Figure 5d. Note that negative values of the cross-correlation between the two variables persist even for lags of several days. The presence of such correlations signals that the barometric pressure could be used to forecast the methane gas concentration (provided that the existence of such correlations is systematically observed between the two variables).
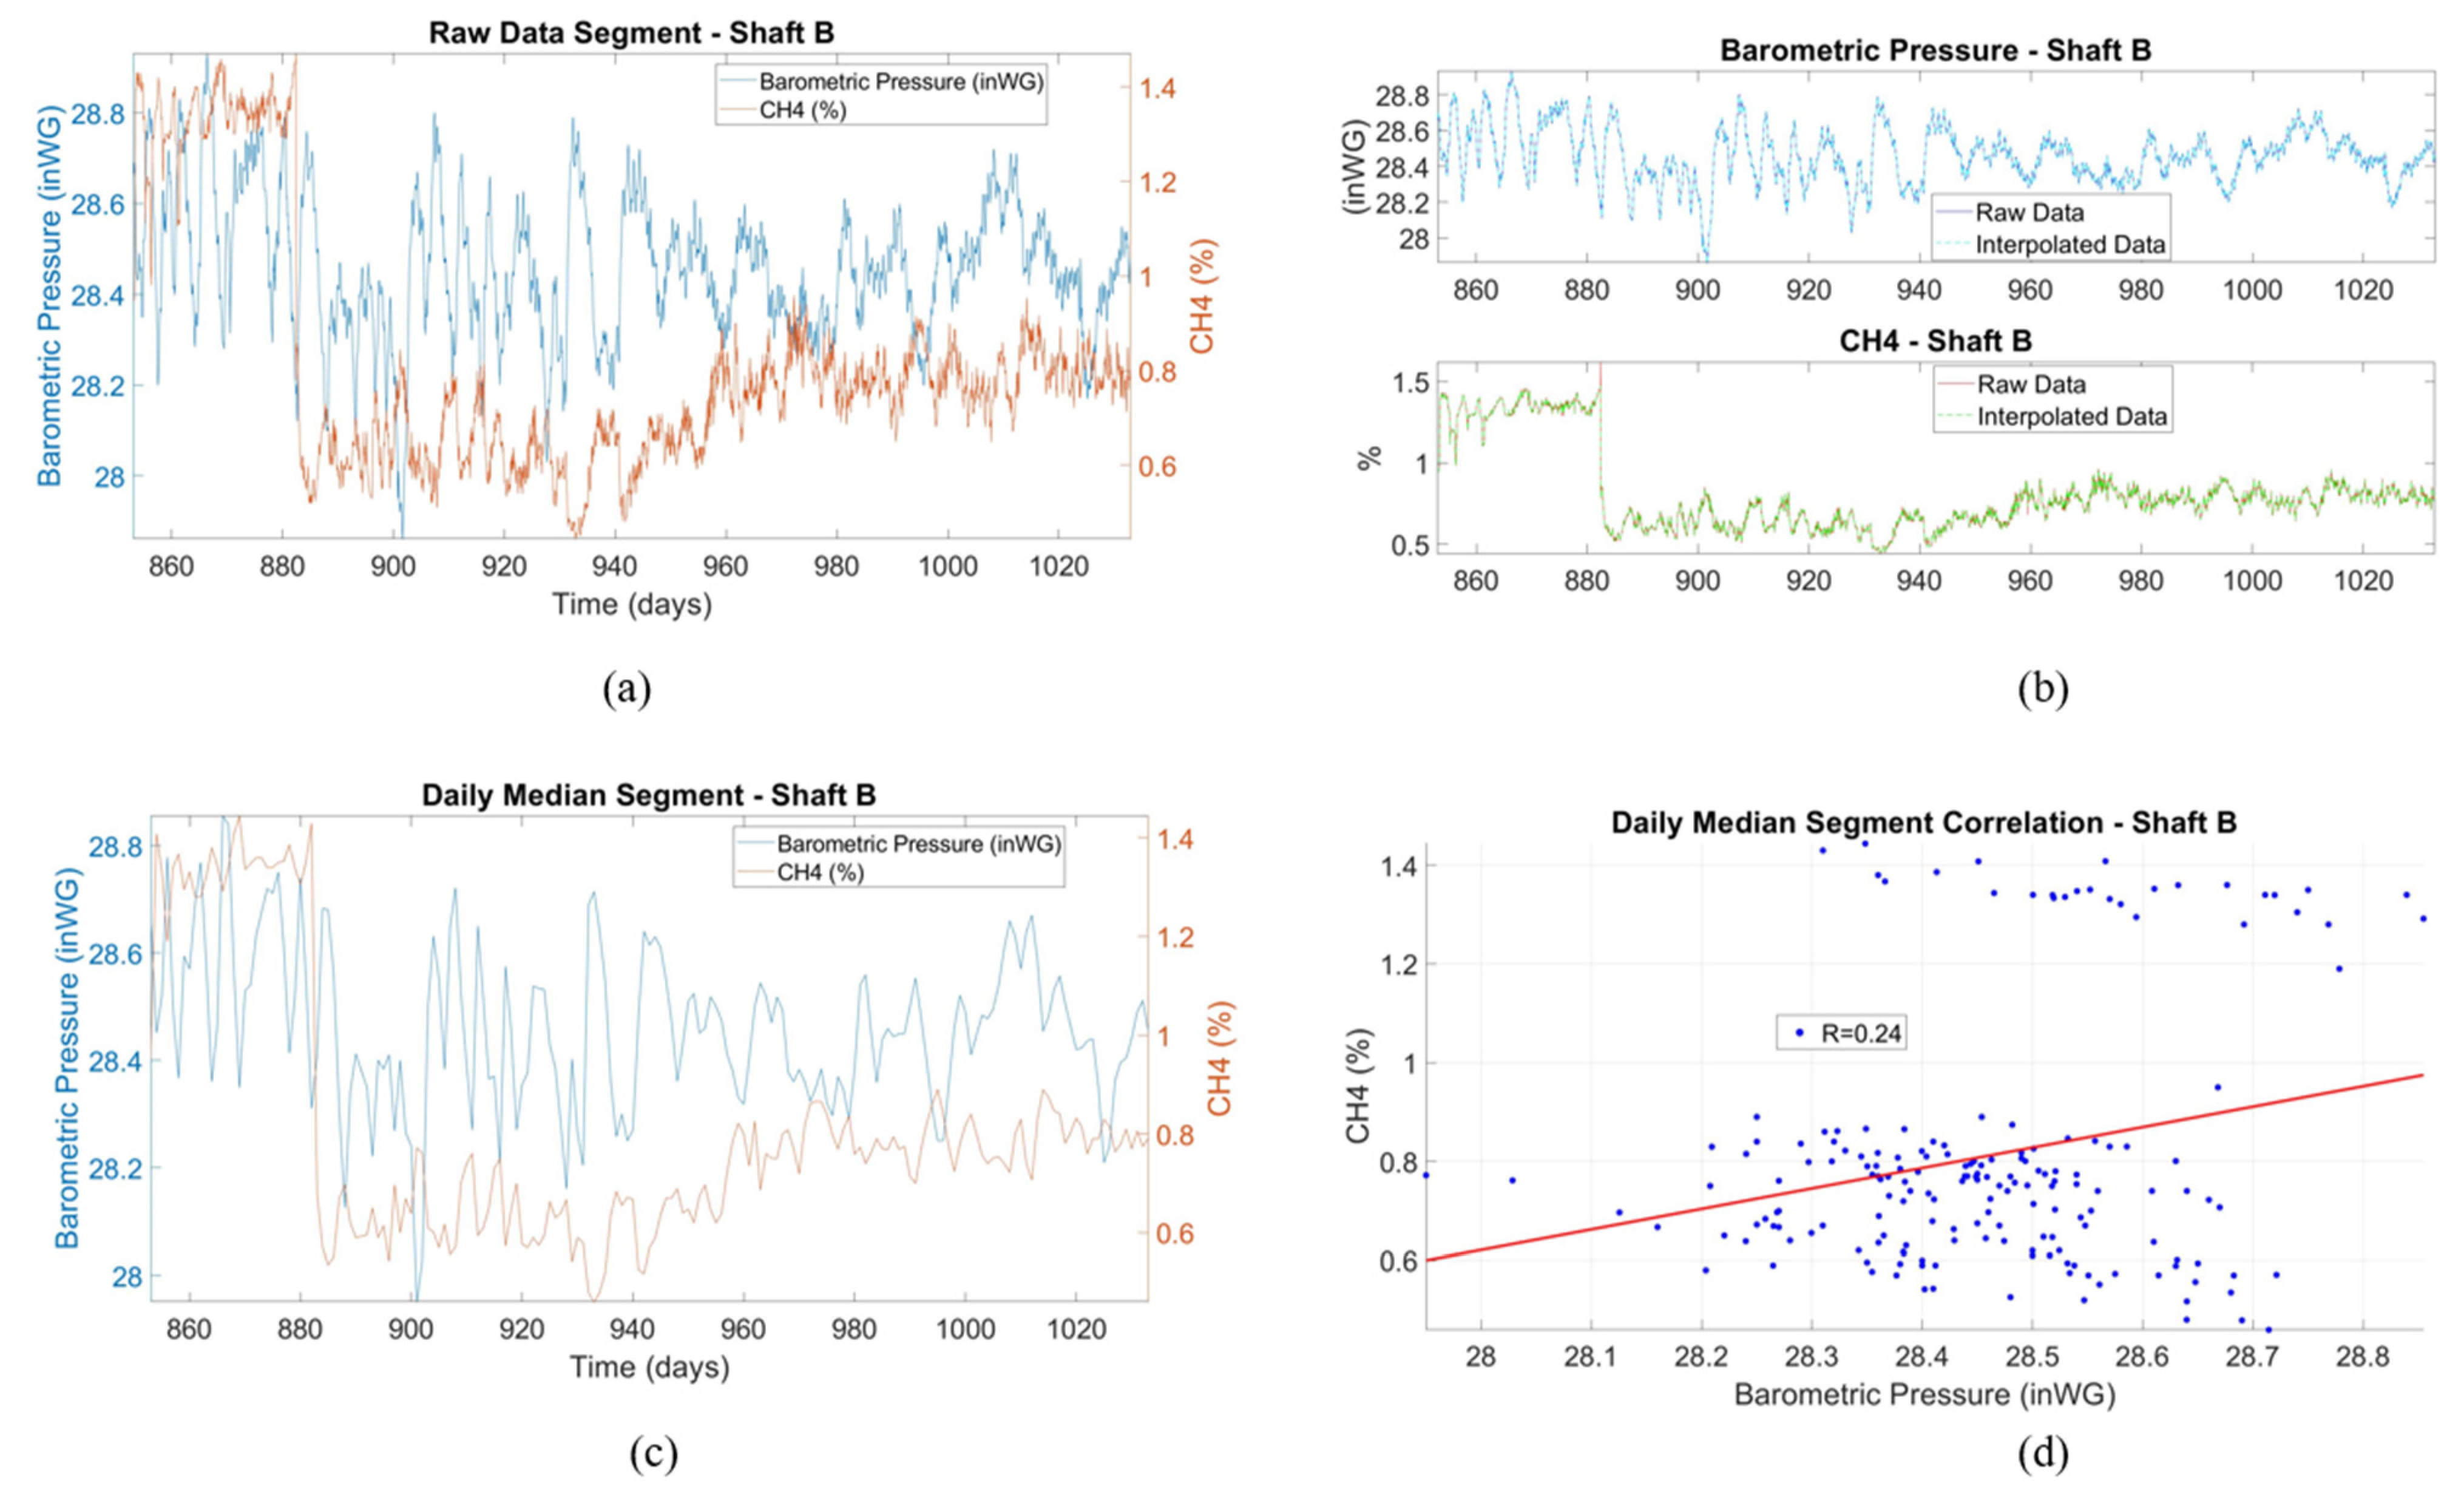
Figure 7 includes four plots (a–d) corresponding to a segment of 180 days of collected data from Shaft B. This is a different time segment than the one analyzed in Figure 5. Figure 7a shows a plot of the raw data for methane gas concentration and BP. Figure 7b illustrates the application of the interpolation function so that the two data streams acquire a common reference timestamp. Figure 7c shows the daily median (of the data shown in Figure 7a) as a representative value for each data stream. Note that in this case the scatter plot in Figure 7d presents a poor correlation between methane gas concentration and BP with R = 0.24.
This is due to the presence of two data clusters (Figure 7d) which is attributed to the sudden drop of methane values around day 880 (see Figure 7a) without a corresponding change in BP. It is highly likely that the drop in methane concentration is due to a change in mine operations, the introduction of which changed the baseline correlation between methane gas and BP. This behavior illustrates that the methane gas concentration does not depend solely on BP and that more advanced multivariate analysis methods should also be investigated. The sudden drop of gas concentration evidenced in Figure 7b may indicate a necessity to segment data streams based on discontinuity points where large drops or increases in gas concentrations occur. Another challenge is whether such “jumps” can be statistically modeled and forecasted. If each data cluster is analyzed separately, the negative correlation between BP and gas concentration is restored. However, the negative correlations are weak.
6. Summary and Conclusions
This paper discusses challenges related to Atmospheric Monitoring Systems data collection and storage facing the development of representative and synchronous time series models. The latter could be used to estimate summary statistics of AMS and identify correlations (linear or nonlinear) between different data streams with the ultimate goal of developing methane gas forecasting models based on time series analysis. The development and deployment of such tools can help to improve mine health and safety.
Preliminary results and analysis of the time-series data collected over five years from two shafts (B and D) of an active longwall mine in the eastern USA are presented. A notable negative correlation between barometric pressure and methane gas concentration has been identified. The presence of such correlations suggests that the barometric pressure could be used to forecast the methane gas concentration in underground coal mines. Furthermore, this research has shown that methane gas concentration does not depend exclusively on barometric pressure. Therefore, more advanced multivariate analysis methods should also be explored to determine potential factors and variables that are correlated (with negative or positive coefficients) with methane concentration, such as daily production and changes in mine operations.
The focus of future work will be to (a) collect data and develop import routines from the atmospheric monitoring system and meteorological stations as well as filter and homogenize such data from a second case study (Mine B), (b) develop and validate long-term relationship(s) between meteorological parameters and methane gas concentration (c) investigate quantitative measures of statistical dependence between methane concentration and mine operations.
Author Contributions
Supervision, Z.A.; Writing—original draft, J.D.; Writing—review & editing, Z.A., D.T.H., S.S. All authors have read and agreed to the published version of the manuscript.
Funding
This study was sponsored by the Alpha Foundation for the Improvement of Mine Safety and Health, Inc. (ALPHA FOUNDATION), Grant No. AFCTG20-103. The views, opinions, and recommendations expressed herein are solely those of the authors and do not imply any endorsement by the ALPHA FOUNDATION, its Directors, and staff.
Institutional Review Board Statement
Not applicable.
Informed Consent Statement
Not applicable.
Data Availability Statement
Not applicable as data is proprietary.
Conflicts of Interest
The authors declare no conflict of interest. The funders had no role in the design of the study, in the collection, analyses, or interpretation of data, in the writing of the manuscript, or in the decision to publish the results.
References
- Agioutantis, Z.; Luxbacher, K.; Karmis, M.; Schafrik, S. Development of an Atmospheric Data Management System for Underground Coal Mines. J. South. Afr. Inst. Min. Metall. 2014, 114, 1059–1063. [Google Scholar]
- Agioutantis, Z.; Luxbacher, K.; Dougherty, H.; Karmis, M. Development and Implementation of a Data Management Platform for Atmospheric Data in Underground Coal Mines. In Proceedings of the 15th North American Mine Ventilation Symposium, Blacksburg, VA, USA, 20–25 June 2015. [Google Scholar]
- Diaz, J.C.; Agioutantis, Z.; Schafrik, S.; Hristopulos, D.T. Towards Atmospheric Monitoring Data Analysis in Underground Coal Mines. In Proceedings of the 18th North American Mine Ventilation Symposium, Virtual, 12–17 June 2021. [Google Scholar]
- Verma, U. Data Cleaning and Preprocessing. Analytics Vidhya. Available online: https://medium.com/analytics-vidhya/data-cleaning-and-preprocessing (accessed on 20 March 2021).
- Baur, J.; Moreno-Villanueva, M.; Kötter, T.; Sindlinger, T.; Bürkle, A.; Berthold, M.R.; Junk, M. MARK-AGE Data Management: Cleaning, Exploration and Visualization of Data. Mech. Ageing Dev. 2015, 151, 38–44. [Google Scholar] [CrossRef] [PubMed]
- Buttrey, S.E.; Lyn, R.W. A Data Scientist’s Guide to Acquiring, Cleaning, and Managing Data in R; John Wiley & Sons, Incorporated: Hoboken, NJ, USA, 2017. [Google Scholar]
- Ranjan, K.; Gaurav, B.; Rajanarayan, P.; Debashisha, J. Review of Preprocessing Methods for Univariate Volatile Time-Series in Power System Applications. Electr. Power Syst. Res. 2021, 191, 106885. [Google Scholar] [CrossRef]
- Hongzhi, W.; Bah, M.; Hammad, M. Progress in Outlier Detection Techniques: A Survey. Inst. Electr. Electron. Eng. (IEEE) 2019, 7, 107964–108000. [Google Scholar]
- US EPA. Coalbed Methane Outreach Program. The United States Environmental Protection Agency (US EPA). 2020. Available online: https://www.epa.gov/cmop (accessed on 11 November 2021).
- Byrer, C.; Havryluk, I.; Uhrin, D. Coalbed Methane: A Miner’s Curse and a Valuable Resource. In Coal Bed Methane: From Prospect to the Pipeline; Thakur, P., Steve, S., Kashy, A., Eds.; Elsevier: Amsterdam, The Netherlands, 2015. [Google Scholar]
- Mahdevari, S. Coal Mine Methane: Control, Utilization, and Abatement. In Advances in Productive, Safe, and Responsible Coal Mining; Elsevier: Amsterdam, The Netherlands, 2019; pp. 179–198. [Google Scholar]
- Irving, W.; Tailakov, O. CH4 Emissions: Coal Mining and Handling. Good Practice Guidance and Uncertainty Management in National Greenhouse Gas Inventories. 1996. Available online: https://www.ipcc-nggip.iges.or.jp/public/gp/english/ (accessed on 11 November 2021).
- Karacan, C.Ö.; Ruiz, F.; Cote, M.; Phipps, S. Coal mine methane: A review of capture and utilization practices with benefits to mining safety and greenhouse gas reduction. Int. J. Coal Geol. 2011, 86, 121–156. [Google Scholar] [CrossRef]
- Bise, C.J. Modern American Coal Mining Methods and Applications; Christopher, J.B., Ed.; Society for Mining, Metallurgy & Exploration: Englewood, CO, USA, 2013. [Google Scholar]
- Kissell, F.N. Handbook for Methane Control in Mining; National Institute for Occupational Safety and Health (NIOSH): Cincinnati, OH, USA, 2006.
- The National Institute for Occupational Safety and Health (NIOSH). NIOSH Data and Statistics. 2020. Available online: https://wwwn.cdc.gov/NIOSH-Mining/MMWC/MineDisasters/Count?StartYear=1900&EndYear=2019&ShowGridlines=true&ShowGridlines=false&SelectedMineType=&SelectedCommodity=&SelectedAccidentType= (accessed on 28 March 2021).
- Dixon, D. A Statistical Analysis of Monitored Data for Methane Prediction. Ph.D. Thesis, The University of Nottingham, Nottingham, UK, 1992. [Google Scholar]
Figure 1.
Schematic of data collection and pre-processing sequence.
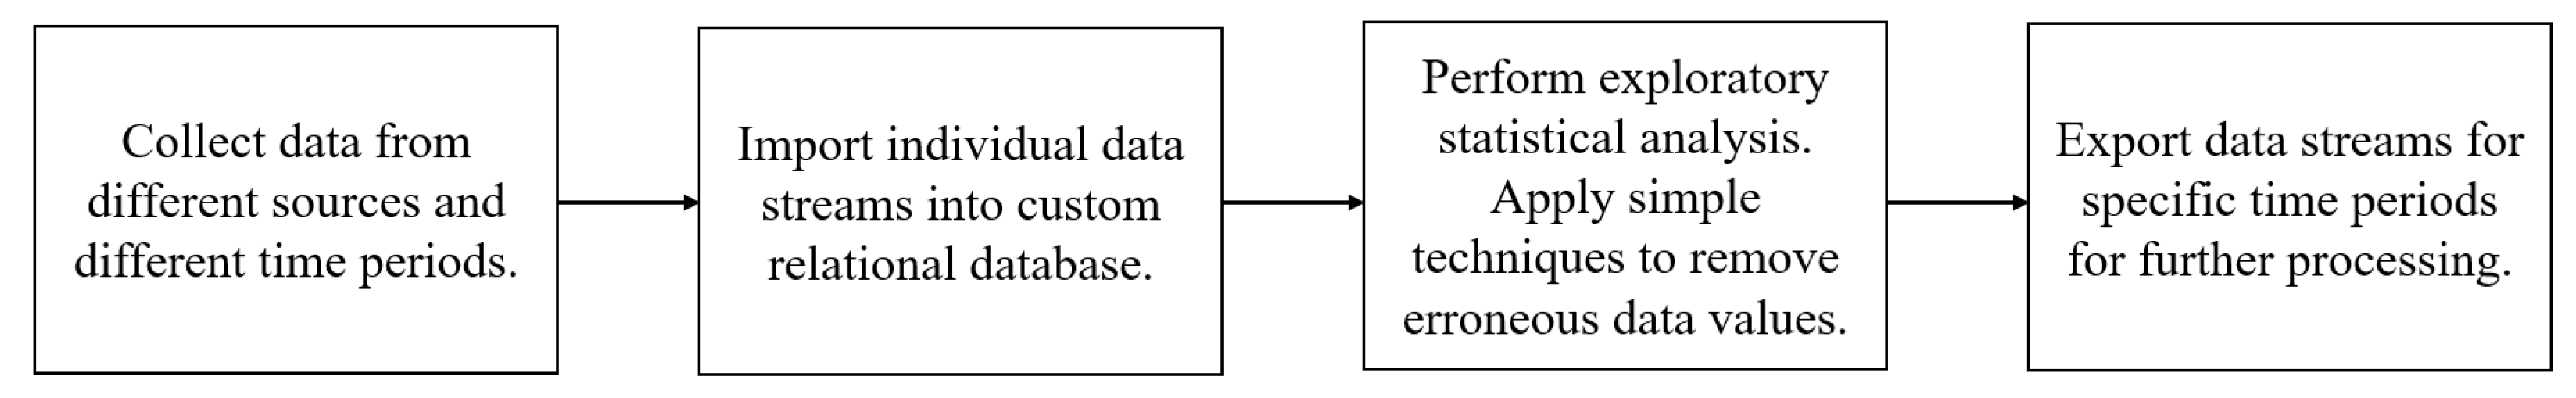
Figure 2.
Data visualization in AMANDA (a) BP for a five-day interval and (b) methane gas concentration for a five-day interval.
Figure 2.
Data visualization in AMANDA (a) BP for a five-day interval and (b) methane gas concentration for a five-day interval.
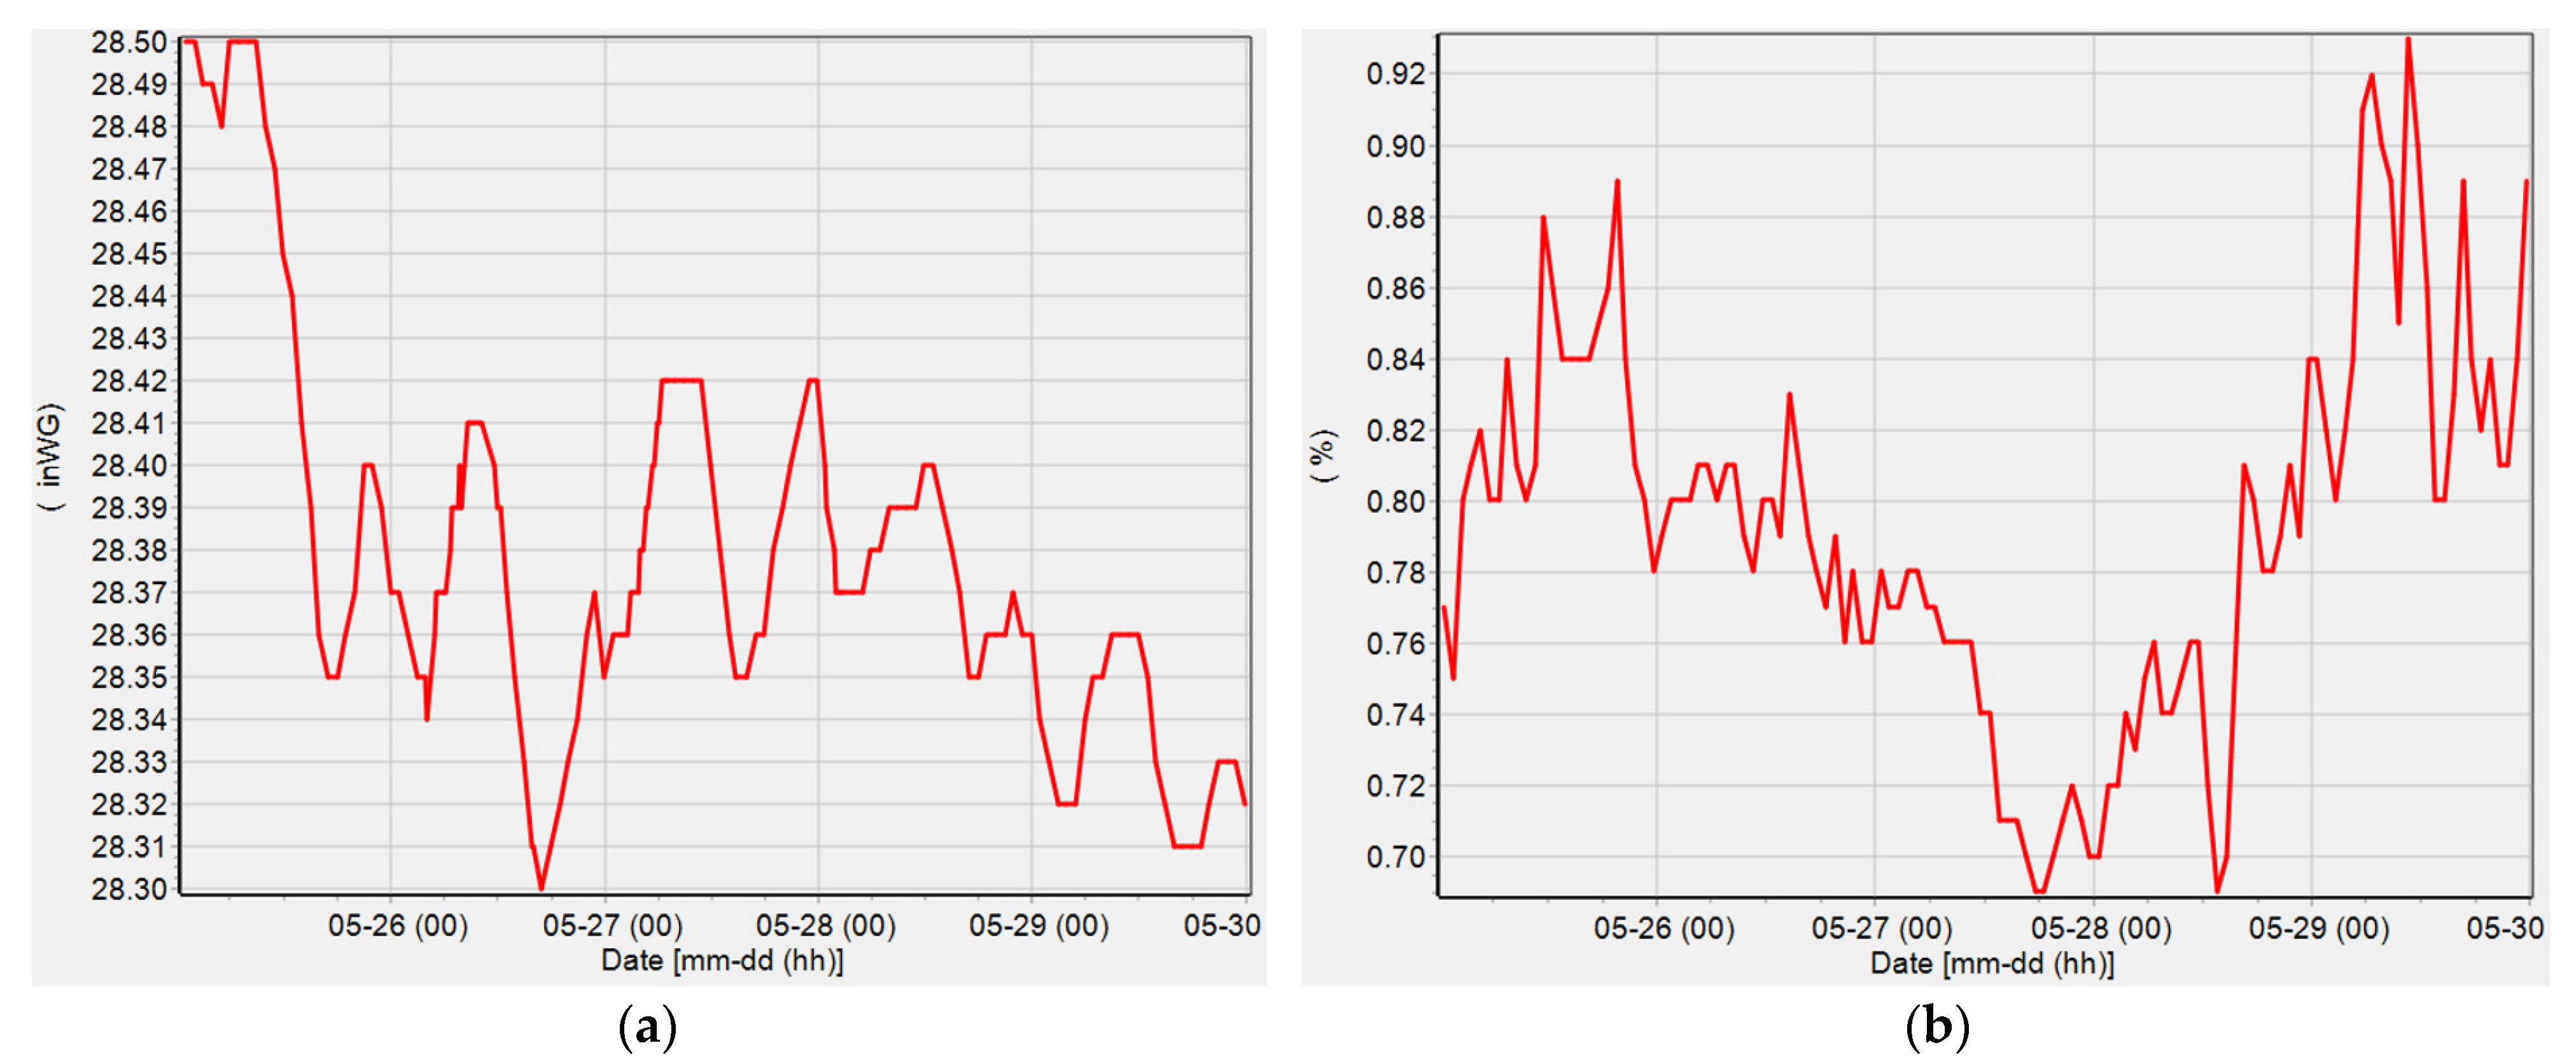
Figure 3.
Superposition of BP from the mine and regional stations for a period of 30 days.
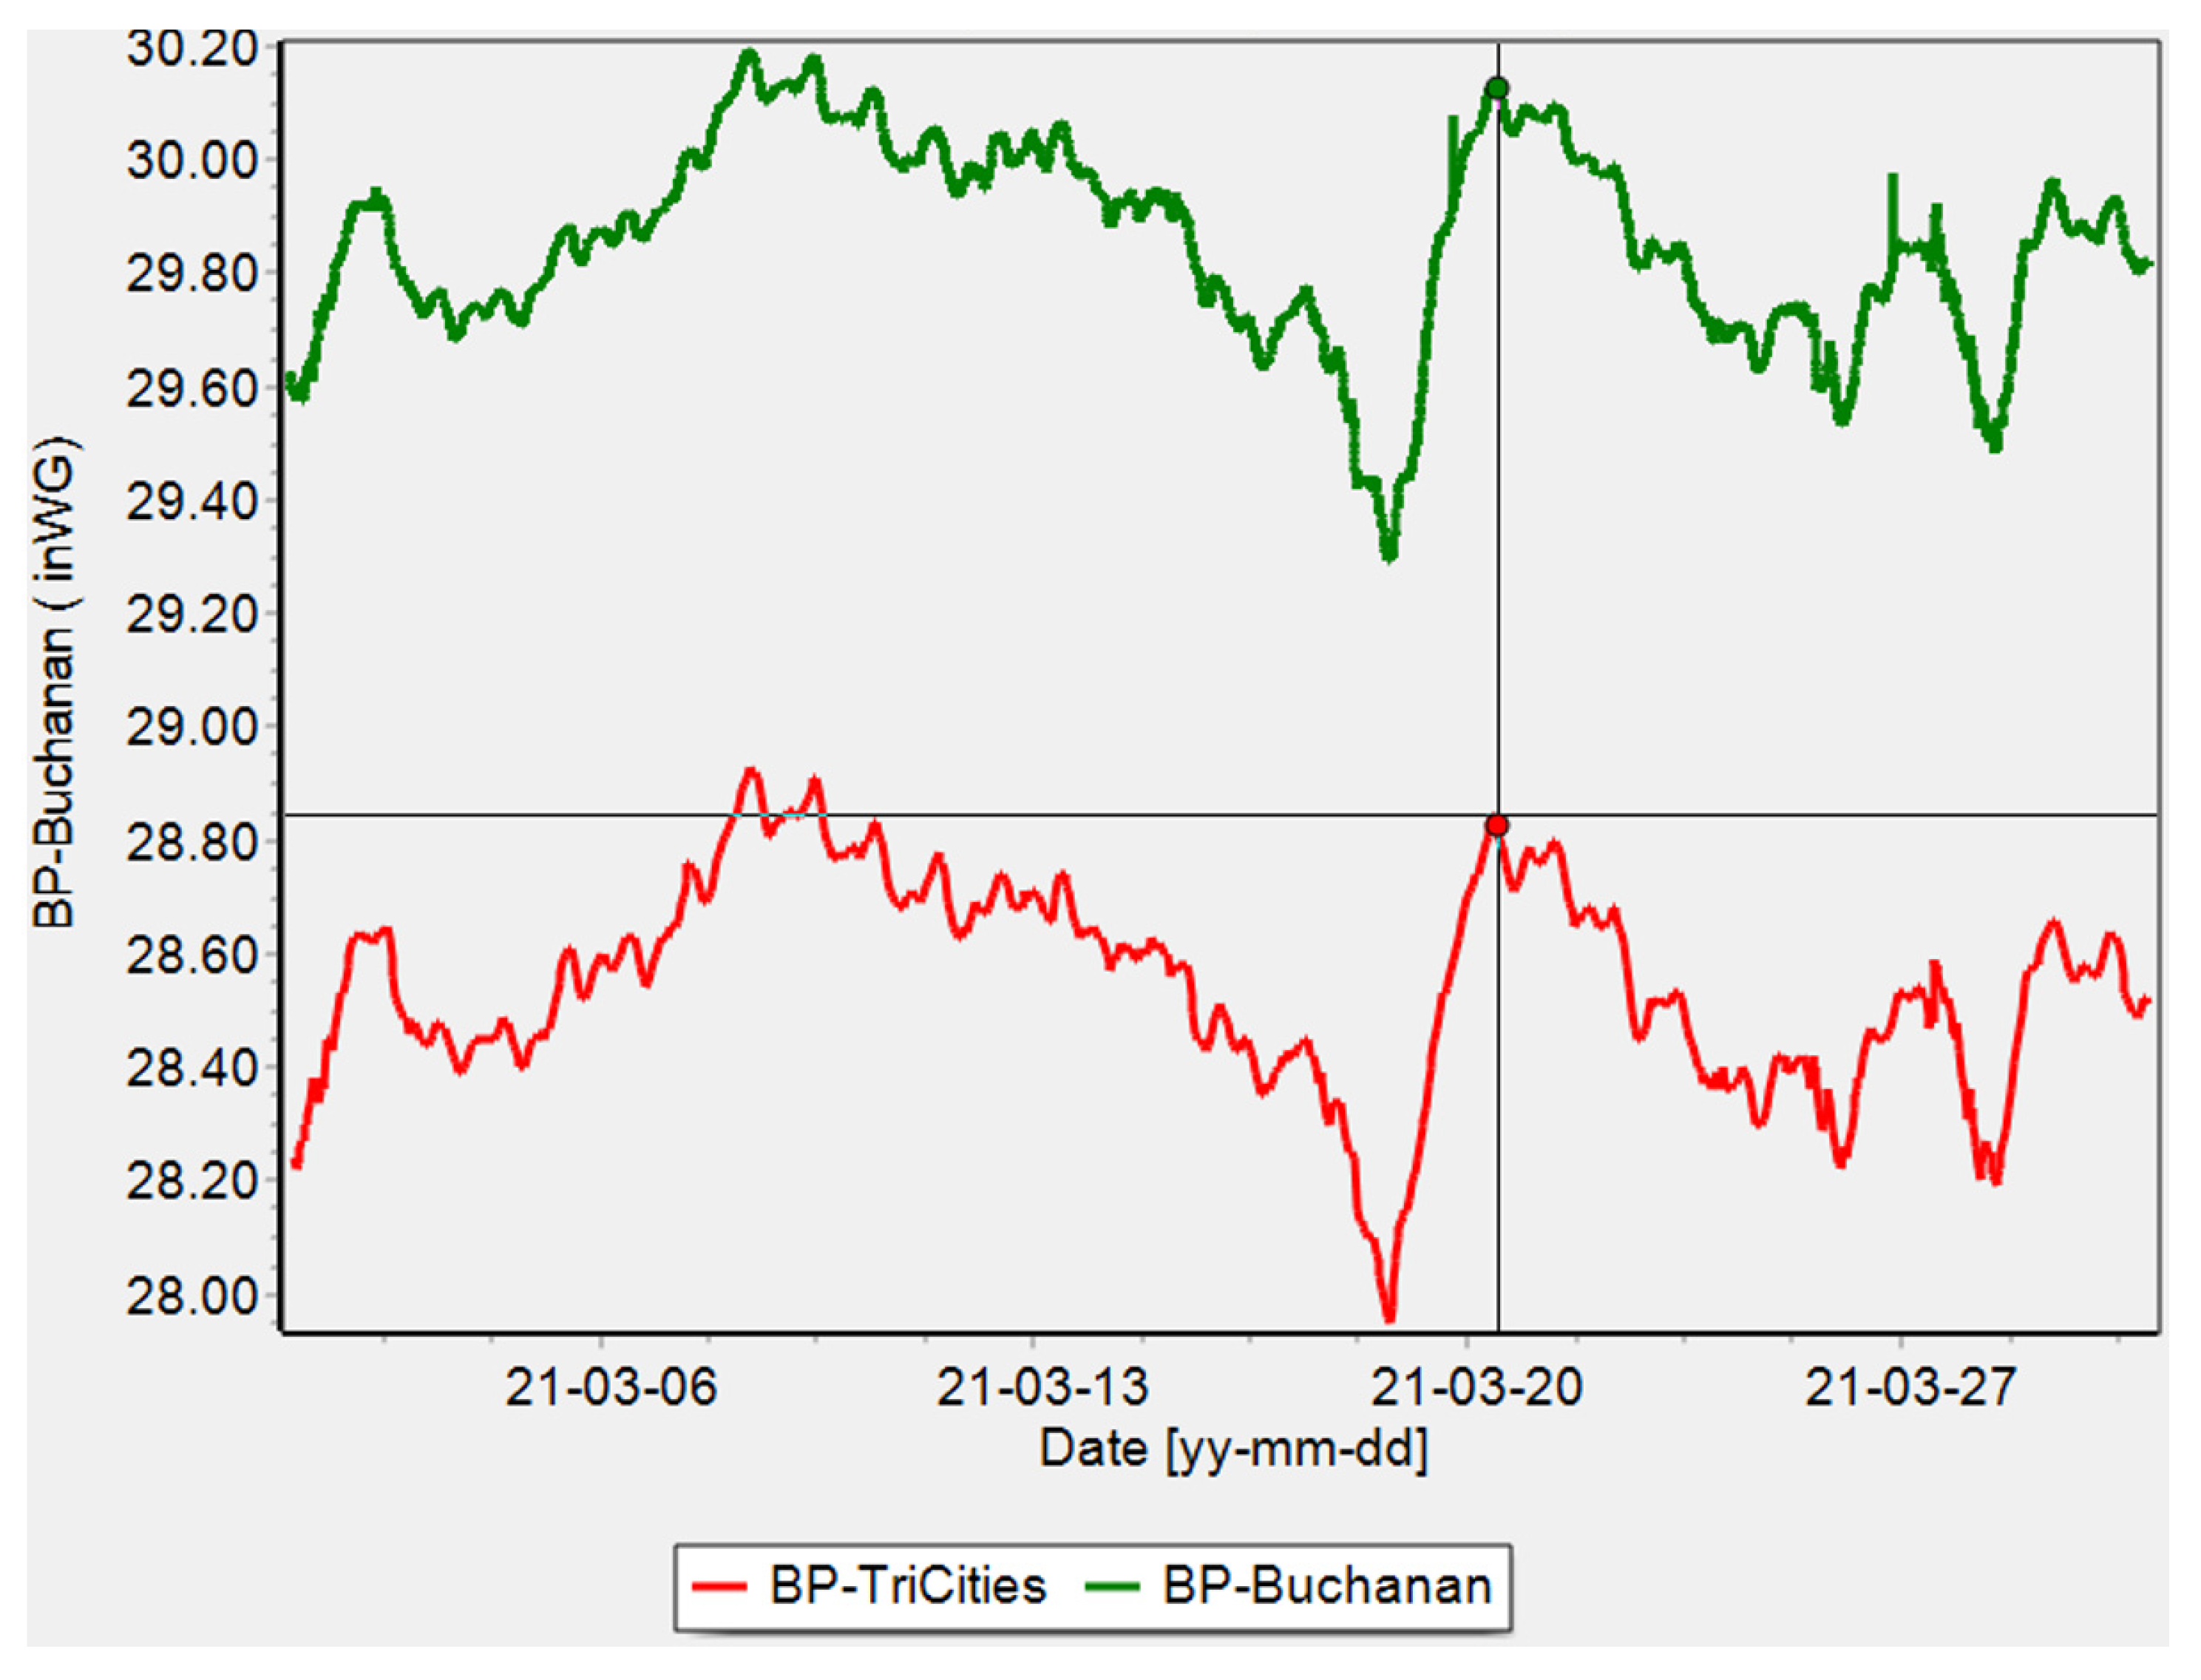
Figure 4.
Data visualization in AMANDA (a) Barometric pressure, methane concentration, and production for 180 days (b) Barometric pressure and methane concentration for 180 days.
Figure 4.
Data visualization in AMANDA (a) Barometric pressure, methane concentration, and production for 180 days (b) Barometric pressure and methane concentration for 180 days.
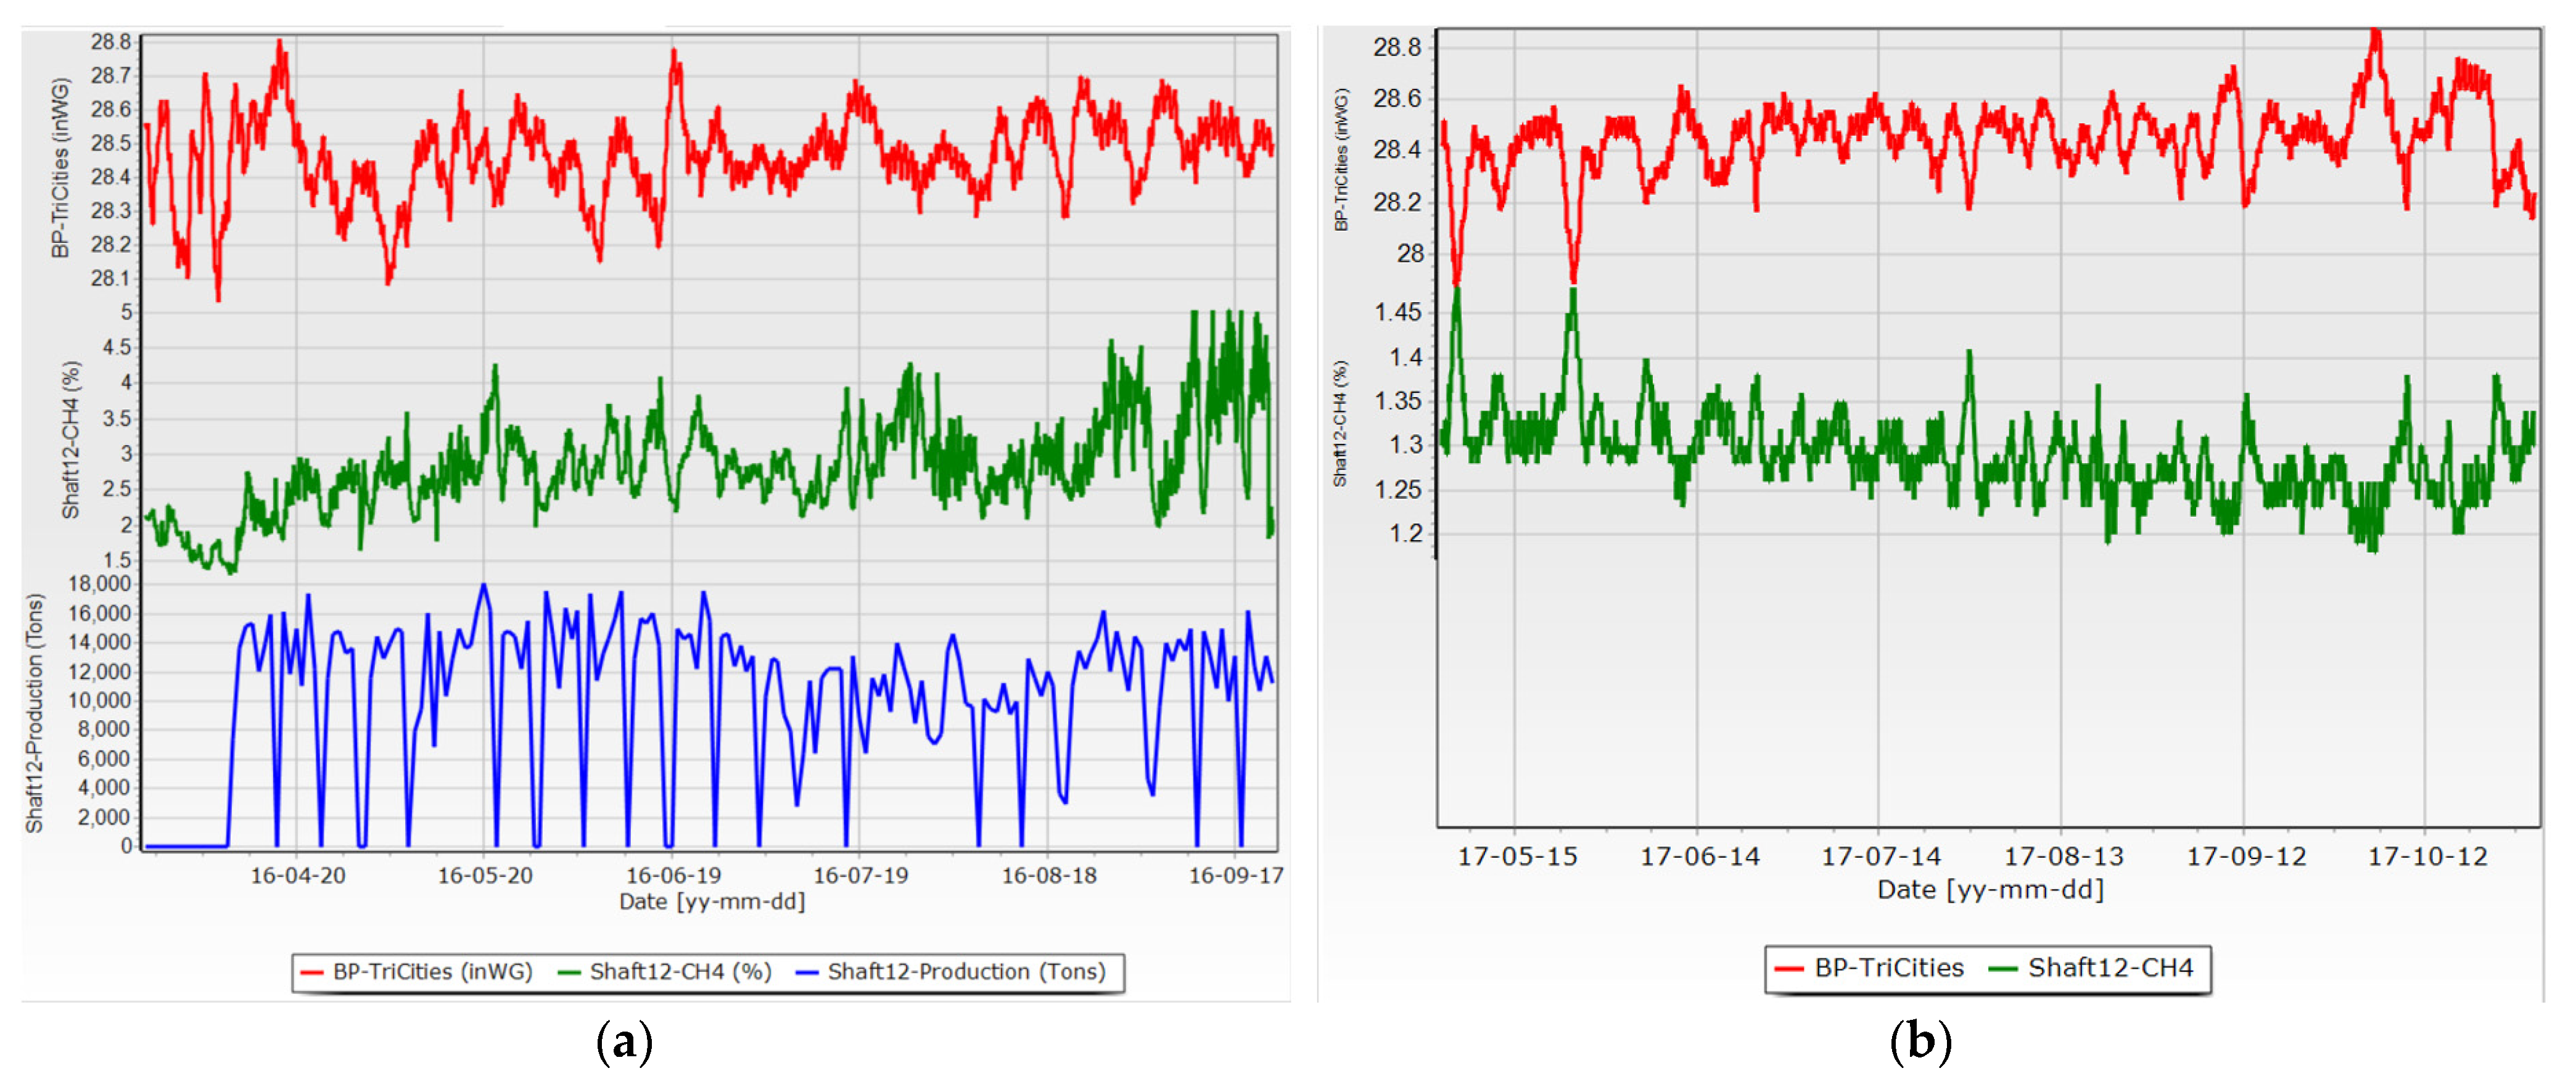
Figure 5.
(a) Raw data, (b) raw and interpolated data, (c) daily median data (d) correlation of daily median data for a specific data segment.
Figure 5.
(a) Raw data, (b) raw and interpolated data, (c) daily median data (d) correlation of daily median data for a specific data segment.
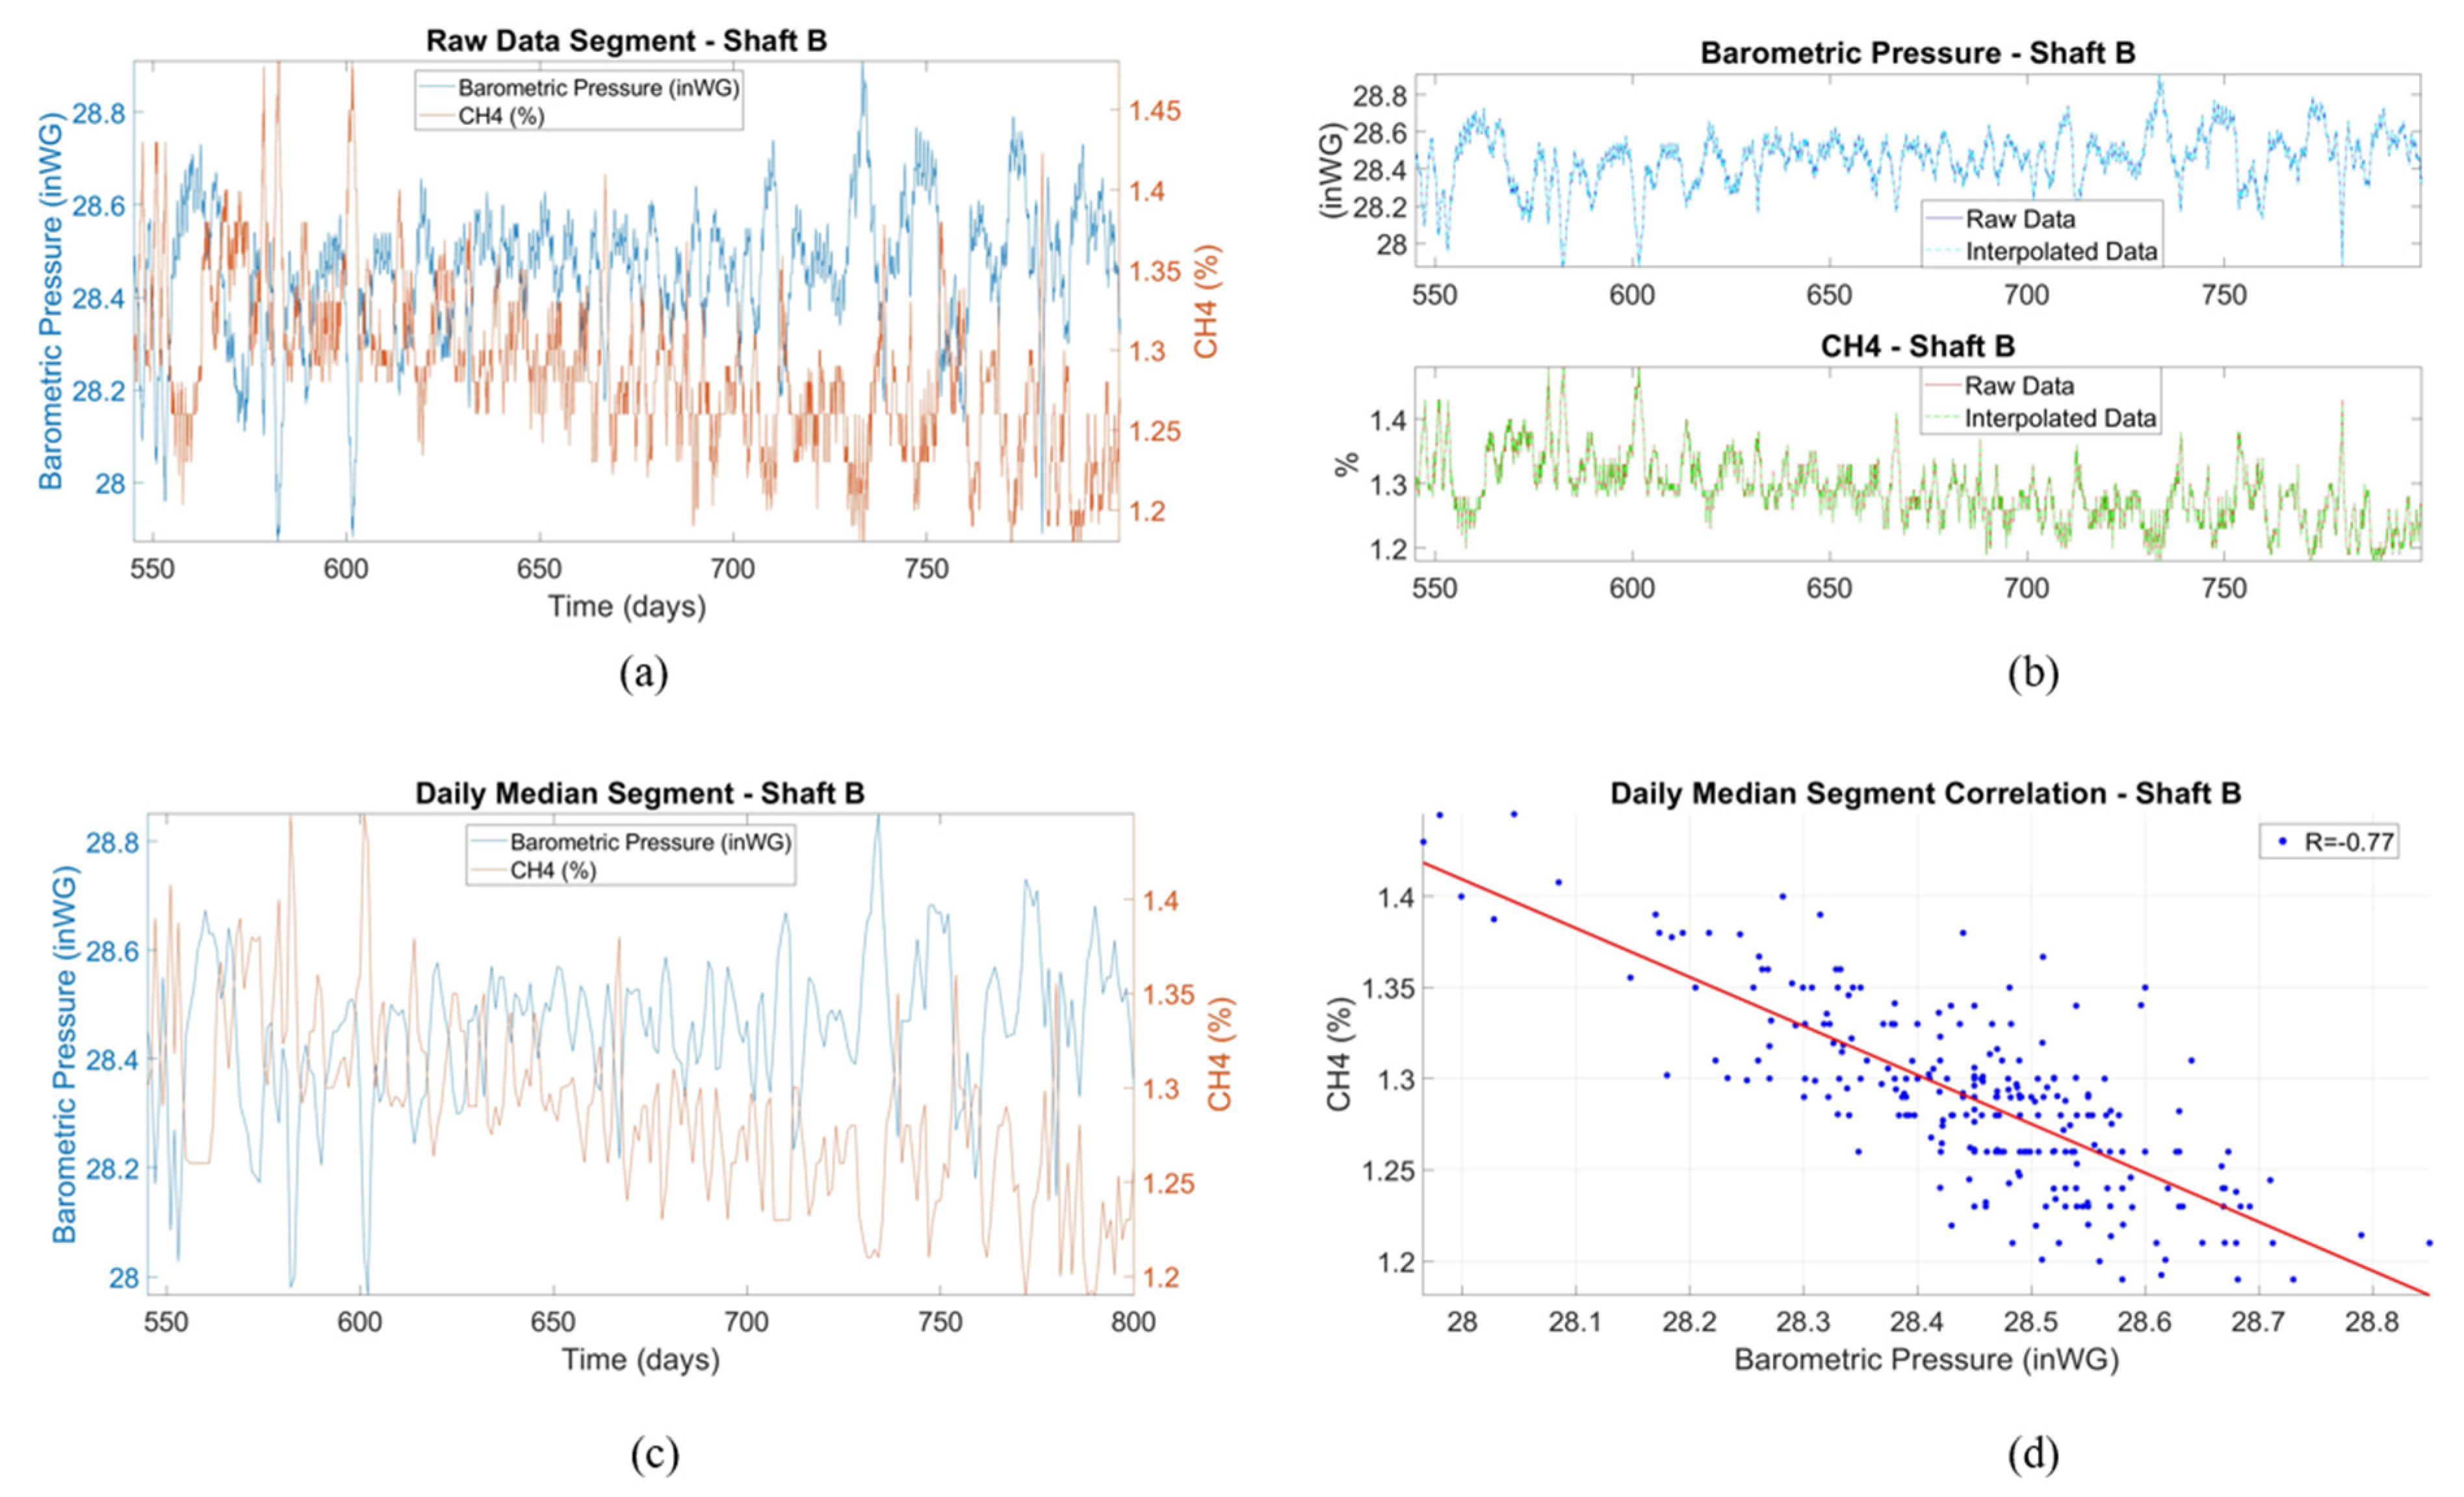
Figure 6.
The plot of the cross-correlation function between the barometric pressure and methane gas concentration. The horizontal axis represents the time lag between the two variables, and the vertical axis represents the cross-correlation values.
Figure 6.
The plot of the cross-correlation function between the barometric pressure and methane gas concentration. The horizontal axis represents the time lag between the two variables, and the vertical axis represents the cross-correlation values.
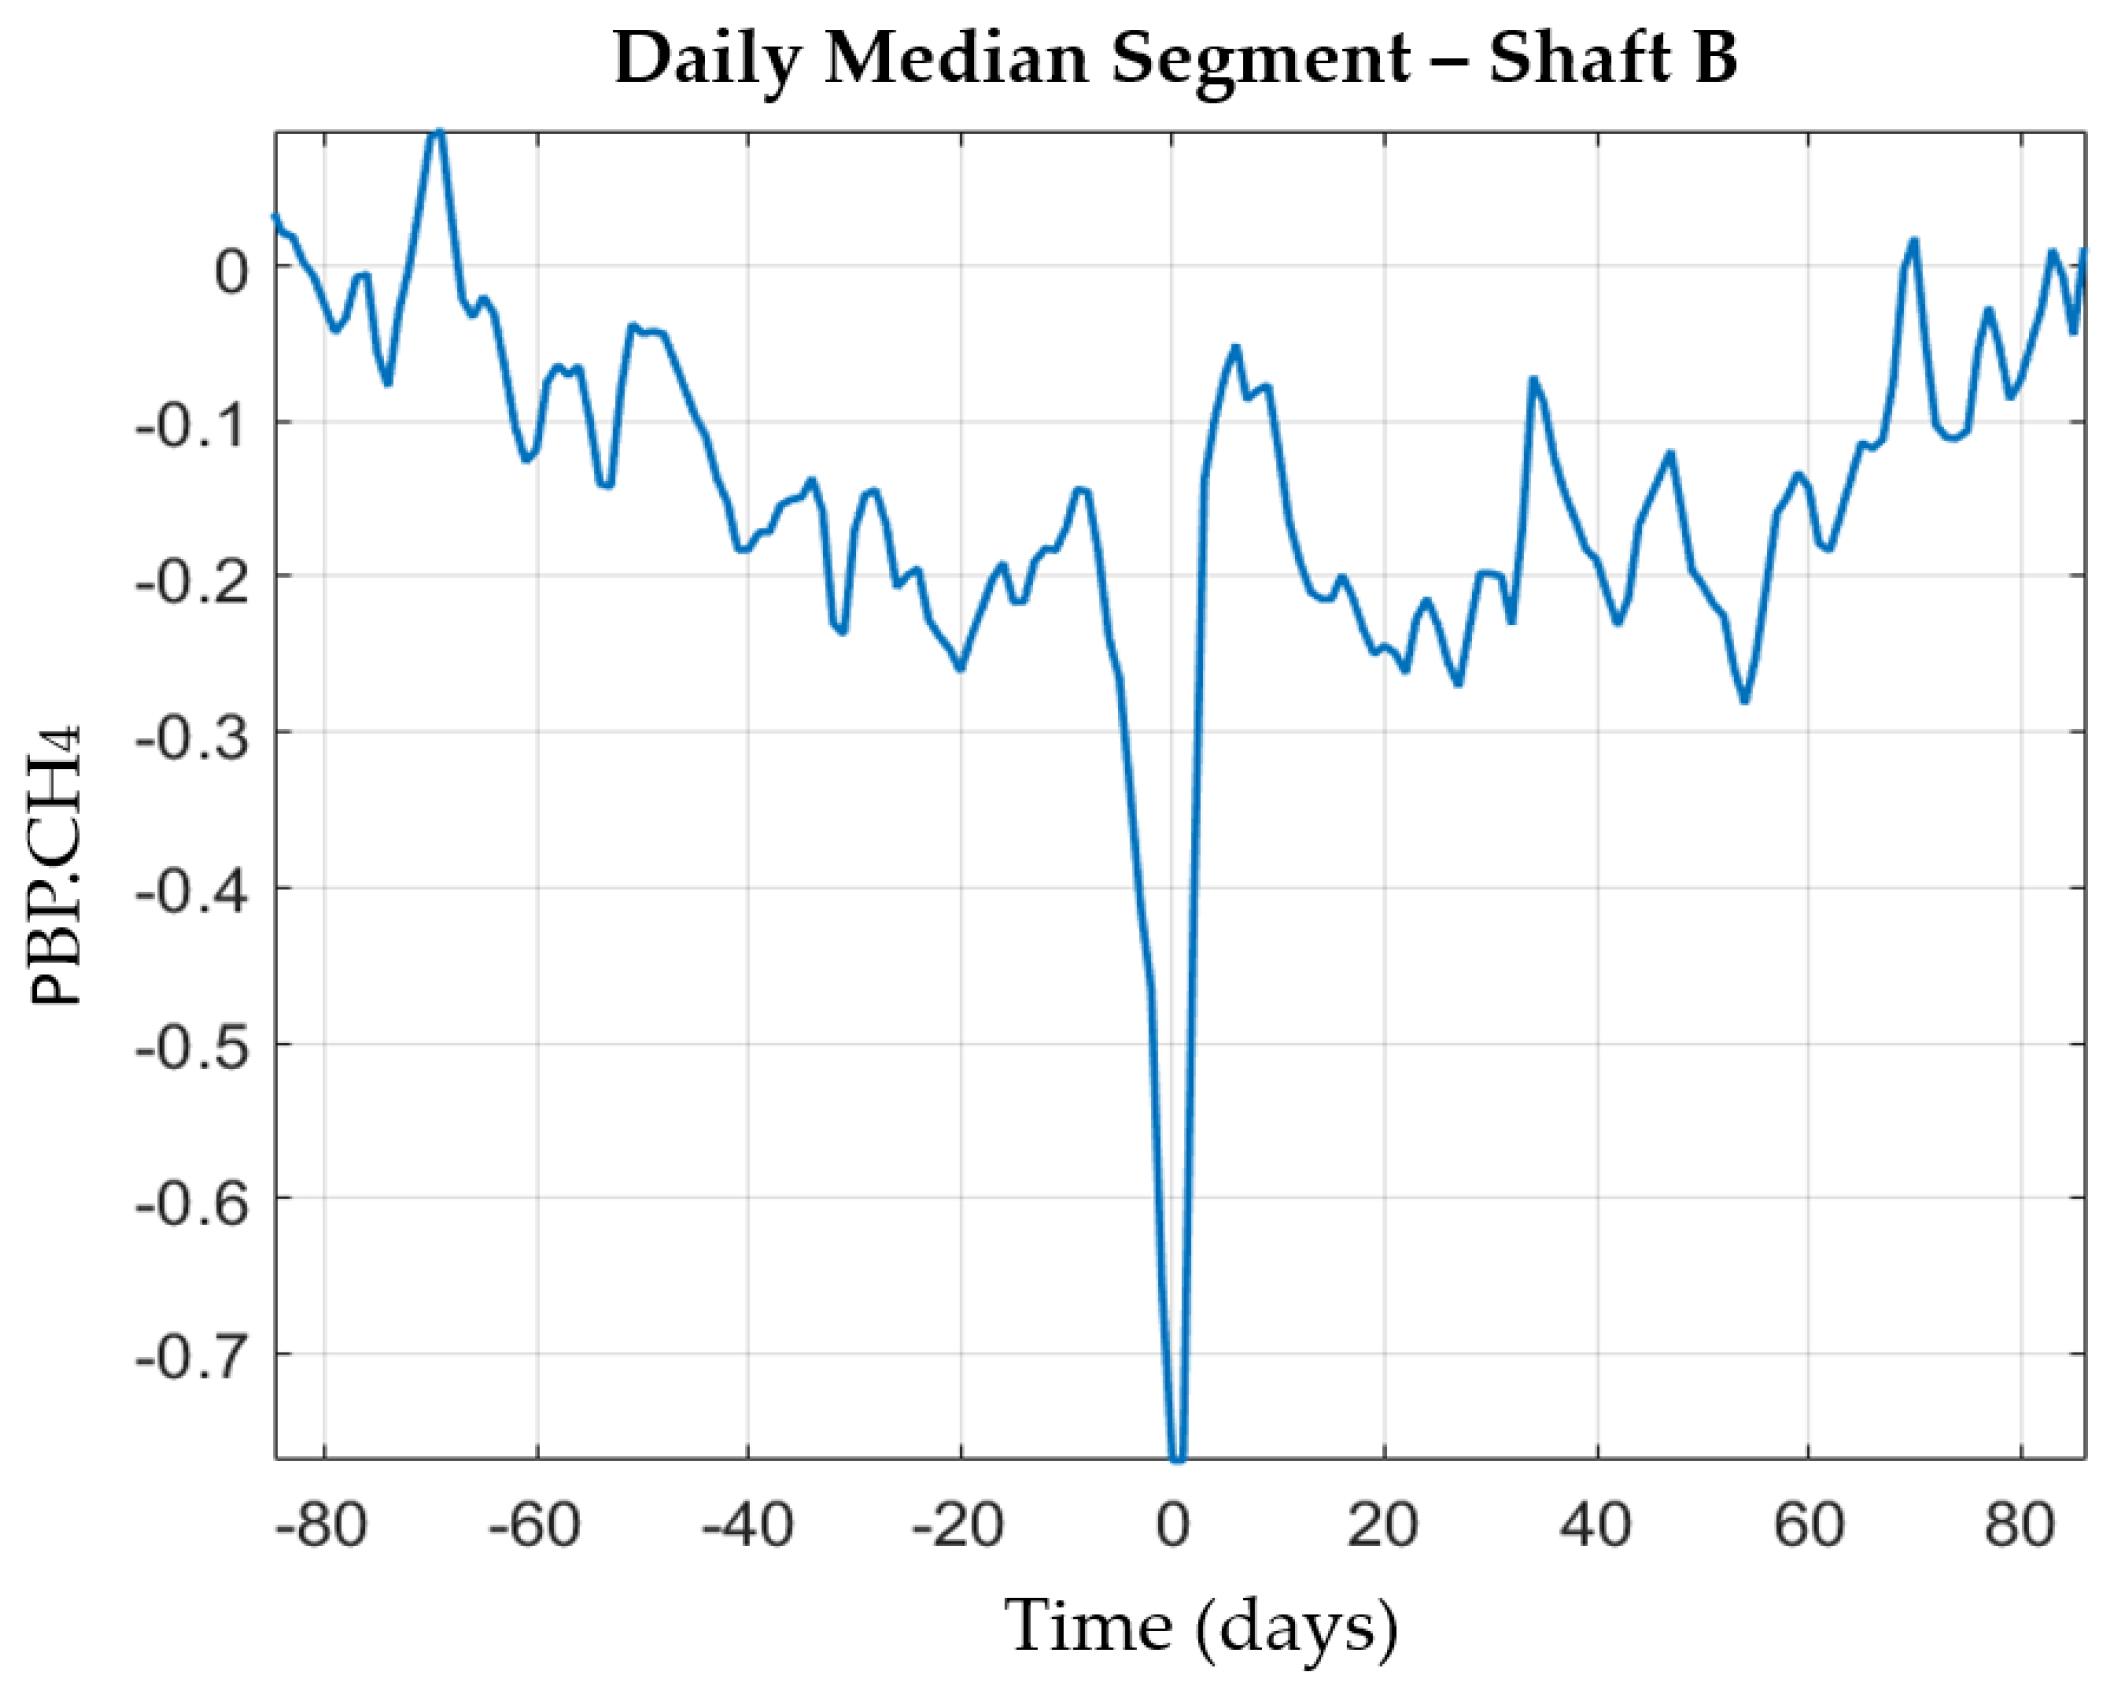
Figure 7.
(a) Raw data, (b) raw and interpolated data, (c) daily median data (d) correlation of daily median data for a specific data segment.
Figure 7.
(a) Raw data, (b) raw and interpolated data, (c) daily median data (d) correlation of daily median data for a specific data segment.

Table 1.
Description of collected data–Shafts B and D.
| Source | Parameter | Approx. Frequency | Approx. Data Points | Units |
|---|---|---|---|---|
| Shaft B | Coal production | Daily | 1800 | Tons |
| Methane concentration | Hourly | 50,000 | % | |
| Shaft D | Coal production | Daily | 1800 | Tons |
| Methane concentration | Hourly | 45,000 | % | |
| Nearest public weather station | Barometric pressure, temperature, etc. | Hourly | 81,000 | InWG |
| Mine weather station | Barometric pressure | Every 10 s | 3 mil/year | InWG |
Publisher’s Note: MDPI stays neutral with regard to jurisdictional claims in published maps and institutional affiliations. |
© 2021 by the authors. Licensee MDPI, Basel, Switzerland. This article is an open access article distributed under the terms and conditions of the Creative Commons Attribution (CC BY) license (https://creativecommons.org/licenses/by/4.0/).
Share and Cite
MDPI and ACS Style
Diaz, J.; Agioutantis, Z.; Hristopulos, D.T.; Schafrik, S. Managing and Utilizing Big Data in Atmospheric Monitoring Systems for Underground Coal Mines. Mater. Proc. 2021, 5, 78. https://doi.org/10.3390/materproc2021005078
AMA Style
Diaz J, Agioutantis Z, Hristopulos DT, Schafrik S. Managing and Utilizing Big Data in Atmospheric Monitoring Systems for Underground Coal Mines. Materials Proceedings. 2021; 5(1):78. https://doi.org/10.3390/materproc2021005078
Chicago/Turabian StyleDiaz, Juan, Zach Agioutantis, Dionissios T. Hristopulos, and Steven Schafrik. 2021. "Managing and Utilizing Big Data in Atmospheric Monitoring Systems for Underground Coal Mines" Materials Proceedings 5, no. 1: 78. https://doi.org/10.3390/materproc2021005078