
A Unified Approach to Describing Flow Dynamics in Geothermal Energy Production Systems †

1
School of Mining and Metallurgical Engineering, National Technical University of Athens, 157 73 Athens, Greece
2
Institute of Geoenergy, Foundation for Research and Technology, 731 00 Chania, Greece
*
Author to whom correspondence should be addressed.
†
Presented at the 2nd International Conference on Raw Materials and Circular Economy “RawMat2023”, Athens, Greece, 28 August–02 September 2023.
Mater. Proc. 2023, 15(1), 55; https://doi.org/10.3390/materproc2023015055
Published: 30 November 2023
Abstract
:Geothermal energy is typically produced by a collection of wells which drain a reservoir. Engineers’ experience and reservoir monitoring data are employed to properly determine the wells in operation and their production rate. However, identifying the optimal well configuration which contributes the most to the geothermal power produced at the system outlet is very complex since the extracted fluid’s energy is attenuated when traveling through the production wells and the surface network toward the delivery point. Undoubtedly, a reliable optimizer focusing on a unified system would greatly improve its management regarding both energy production and sustainability. In this work, a mathematical model is proposed, which fully describes flow in the joined production system, by coupling the reservoir, wellbore and ground pipeline network flow dynamics. The reservoir IPR (inflow performance relationship) curves are combined with the pipeline network’s hydraulic/thermal behavior, to estimate the geothermal fluid’s pressure, flow and temperature at the delivery point. Every design detail, such as the well geometry, subsurface heat loss and pressure/heat loss along the ground pipeline network, is accounted for. Subsequently, an optimizer identifies the choking that needs to be imposed at each wellhead, so that the geothermal fluids produced account for the minimum mass rate for a given heat load, thus contributing to the sustainability of the geothermal system. The model can be calibrated using history matching to further improve the estimation accuracy. Optimal conditions can be recalculated every time a change takes place in the subsurface system, the surface network or the production constraints.
1. Introduction
A geothermal system is characterized as a geological formation with specific characteristics, inside of which geothermal energy is stored. A typical geothermal system consists of three parts: a heat source inside the Earth, a geothermal reservoir and geothermal fluid that transfers the heat to the surface [1]. Enthalpy is the means to express the thermodynamic energy of the fluid due to its temperature and its dynamic state, i.e., its pressure. Typically, the production of geothermal energy is achieved using a number of production wells, which transfer high-enthalpy geothermal fluid to the surface.
Once the field is developed and production has begun, proper management of the whole system is crucial. Maintaining the production of enthalpy to the needed level while avoiding excessive draining of the geothermal fluid and of the heat source is a multidisciplinary procedure [2]. Engineers are called to handle this difficult task, often relying only on their experience, on monitoring production and geochemical data, on reservoir engineering and on reservoir simulation to decide the production and injection schemes on which wells will be operational and at which rates [3,4]. Fully understanding how the complete system operates and identifying the wells that contribute most to the production of geothermal energy is a complex procedure because of the interconnectivity of the reservoir compartments, the wells and the horizontal pipeline network through which the produced fluid travels to the delivery point.
Once the wells have been drilled and the surface network has been constructed, the only way to control the rate of geothermal fluid production is by modulating the wellhead chokes, which apply back pressure that varies between zero (i.e., a fully open well) and one (i.e., shut-in well) to the wellhead [4]. A reliable optimizer, able to accurately estimate the proper back pressure at each choke, would be greatly beneficial in estimating the optimum balance between producing the required enthalpy for the needed application and ensuring the sustainability of the geothermal system.
In this work, a complete mathematical model is set up, which fully describes the steady state flow dynamics of the three subsystems comprising a geothermal system: the reservoir, the wells and the horizontal surface pipeline network. For that task, the IPRs (inflow performance relationships) of the reservoirs are combined with the hydraulic and thermal behavior of the wells and of the horizontal pipeline network to accurately model the fluid pressure, mass and enthalpy flow from the reservoir to the delivery point at the surface.
To optimize geothermal energy production, an algorithm containing two loops has been developed. The inner loop solves the coupled system simulation, estimating the necessary mass flow rates that need to be drained from each reservoir for the system to operate under some specified choking pressure conditions at the wellheads. Subsequently, the outer loop optimizes the choking at each wellhead, so that the geothermal fluids produced account for the minimum mass rate for a given heat load, thus respecting the sustainability of the geothermal system as well.
2. Mathematical Model Design
A complete geothermal system consists of several subsystems: the reservoir(s), the wellbores and the horizontal pipeline network that connects the wellheads to the delivery point. A mathematical model (simulator) has been developed to describe the flow in the joined production system by coupling the flow dynamics of all three subsystems. The complete system combines the geothermal reservoirs’ IPR curves with the differential equations governing the hydraulic and thermal behavior of the wellbore and of the horizontal network submodels, in order to estimate the flow, pressure, temperature and enthalpy at the delivery point. It is noted that the wellbore and the horizontal network submodels were designed specifically for a low- to medium-enthalpy geothermal field; therefore, the geothermal fluid is assumed to be in the liquid water phase throughout the network. It is also considered that the system has been operational for a long period of time; thus, it is operating in a steady state. Solving the coupled equations provides the simulation results under the current operating conditions.
To optimize the production of enthalpy of the coupled geothermal system, with respect to the sustainability of the geothermal source, the chokes are tuned optimally so that the power needed is produced with the least amount of geothermal fluid drained from the reservoir. The developed system simulator is utilized to estimate the objective function that needs to be optimized. To simplify the optimization process, the coupled problem is split into three separate problems that are solved in a nested fashion. An inner loop estimates the well mass flow rates that solve the complete system problem for any given choke pressure (simulator), and an outer loop estimates the choke pressure values which minimize mass production with respect to a set enthalpy target (optimizer).
2.1. Reservoir Model
The reservoir potential can be described using the geothermal inflow performance relationship (GIPR) of the well, which relates the bottom-hole pressure to the well production rate. The inflow curves are specific to each well, vary with production time and depend on the properties of the geothermal fluid and of the reservoir’s rock formations [5]. The relationship between the pressure drawdown and mass flow can be expressed as [6]:
where is the flowing bottom-hole pressure at the well, is the well drainage boundary pressure, is the production mass flow rate and is the well productivity index.
2.2. Wellbore Model
The wellbore model acts as the link between the reservoir and the surface pipeline model, connecting them and allowing the transfer of flow information between them. In a production simulation, this model can estimate the pressure, temperature and mass flow of the single-phase geothermal fluid all along the wellbore up to the wellhead using the corresponding values at the bottom hole. Alternatively, the opposite procedure can be followed for an injection well simulation. The wellbore flow is governed by the principles of conservation of mass, momentum and energy [7]. The conservation of mass is stated in its differential form in Equation (2):
where is the well depth, is the geothermal fluid density, is the fluid velocity and is the specific enthalpy of the fluid, all defined at depth . The conservation of energy is derived from the first thermodynamic law:
where is the gravity constant and is the heat loss/gain due to the heat transfer from the pipe to the formation. Finally, the conservation of momentum derives from Newton’s second law and is given in Equation (4):
where is the pipe diameter and is the friction factor, which for the common case of turbulent flow can be derived from the Blasius equation [7]:
where is the dimensionless Reynolds number, given by , and is the geothermal fluid viscosity, at current conditions.
Equations (2)–(4) can be combined into the following system of differential equations:
which can be easily solved using a suitable numerical method for fluid velocity, pressure and enthalpy along the well length. In this specific application, Euler’s method was chosen.
2.3. Horizontal Surface Pipeline Network Model
The horizontal network model simulates the geothermal fluid flow and estimates the pressure drop and the heat loss along the surface pipelines. Again, the principles of conservation of mass, energy and momentum are exploited to set up the differential equations governing the steady state flow of the single-phase geothermal model through the network. To solve such a complex system, an “element-by-element” method was used, according to which each element (pipeline) is analyzed separately [8]. A surface network consists of elements and nodes (split into external and internal ones), where each element (pipe) is governed by a flow rate–pressure hydraulic relation and a flow rate–temperature thermal relation. Each node (wellhead/junction/delivery point) is governed by suitable relations accounting for the conservation of mass and energy. Eventually, the mathematical model forms a system of non-linear algebraic equations, which can be easily solved by means of the Newton–Raphson method.
More specifically, a network is governed by equations (to be described below) with the same number of unknowns: the flow rate at each element ( unknowns), pressure at each node (N unknowns) and temperature at the entry and at the exit of each element ( unknowns). To simplify the solution process, the network model is further decoupled into two separate subproblems, a hydraulic and a thermal one, which are solved alternatively until convergence. The workflow of the coupled model is presented in Figure 1.
2.3.1. Hydraulic Horizontal Network Model
The hydraulic model incorporates unknowns: the rate at each element (L unknowns) and pressure at each node ( unknowns). The model consists of equations: one pressure–flow rate equation for each element ( equations), one mass conservation equation for each internal node ( equations) and one boundary condition (flow rate/pressure) equation at each external node/wellhead ( equations).
For the steady state flow of liquid water through a cylindrical pipe, the pressure drop is caused by the friction from viscous flow and from the roughness of the pipe and by the height difference of the two sides of the pipe. The pressure–flow rate relation is expressed using the Darcy–Weisbach equation:
where and are the pressures at the pipe ends, is the pipe friction factor, is its length, is its diameter, is the density of the fluid and is the flow rate. The friction factor depends on the type of flow (laminar/turbulent), which is determined by the Reynolds number. For laminar flow, the friction factor is given by:
and for turbulent flow, it is obtained implicitly by solving:
where is the relative roughness of the pipe.
To further account for the effect of gravity, the term needs to be introduced to the left hand side of Equation (7).
Internal nodes must honor the conservation of mass, i.e., the mass of the fluid that exits an internal node is equal to the mass that enters it from all connected elements. Therefore:
where counts over all elements connected to internal node , depending on whether element j is contributing fluid to or removing fluid from the node, based on its connectivity, and is positive or negative based on the connectivity of the node with the element.
External nodes must honor the boundary conditions. If are the ones with a pressure boundary condition (i.e., a known pressure value ), are the ones with a known flow rate boundary condition and is the element connected to the external node , then:
2.3.2. Thermal Horizontal Network Model
The thermal model is solved to provide the temperature at the entry and at the exit of each element. The conservation of thermal momentum must be honored for each element ( equations), and the conservation of energy for each node, excluding the delivery point ( equations).
The thermal energy that escapes to the environment due to conduction can be expressed using the overall heat transfer coefficient . Indeed, the energy loss per time unit and per pipe length unit is equal to:
where is the inside area of a pipe, is the average temperature of the fluid inside the pipe and is the ambient temperature. The contained fluid heat load is given by:
where is the mass flow rate of the water, is the specific heat capacity of water and and are the temperatures at the pipe ends. Equating Equations (13) and (14), the heat loss in a pipe rate is obtained [9]:
which, when integrated, leads to algebraic Equation (16).
where
Boundary temperatures are imposed at the element ends ( or ) connected to each fixed external temperature node (i.e., the wellheads):
where is the external node and is the element that connects to said node.
At each internal node, various water rates, each at a specific temperature, are mixed as they arrive through the connected elements. The conservation of energy states that the temperature at which the fluid exits the internal node depends on the weighted average of the product of the mass (expressed by the flow rate) and of the entry or exit temperature from the node.
where is the heat that is transferred by the water that is flowing though element . is the set of elements that arrive at node whereas contains elements that depart from node . are the outlet temperatures of the elements in and are the inlet temperatures of the elements in , contributing to the departing heat load, respectively. Equations (16), (18) and (19) form a system of linear equations in the element end temperatures.
2.4. Combined System Model Simulator
To successfully achieve a complete simulation of the whole geothermal system, the three separate models must be synced with each other. Starting from some initial random mass flow values delivered by each well, the bottom-hole conditions are estimated by means of the GIPRs (geothermal inflow performance relationships). The bottom-hole pressure and temperature from each reservoir model are then forwarded to the wellbore models. Their solution outputs mass flow, pressure and temperature conditions at each wellhead. Subsequently, the wellhead flow rates and temperatures form the horizontal network model boundary conditions, along with the required delivery point pressure . Solving the horizontal network provides the wellhead pressures, which equilibrate the pipeline system.
The proper values of are the ones leading to a match between the estimated values of the wellhead pressure from the wellbore model and the ones estimated from the horizontal network model , thus establishing pressure continuity. This condition can be honored by minimizing the cost function in Equation (19).
The L-BFGS-B optimization algorithm was chosen, to take advantage of its box constraint handling capabilities, so that the values are constrained to positive values.
2.5. Geothermal System Optimizer
Proper management of the geothermal system requires the maximization of enthalpy production while ensuring the sustainability of the geothermal system. A reliable optimizer must achieve a balance between meeting the field operator’s power needs and minimizing the discharge rate to ensure sustainability by adjusting the back pressure that the chokes impose on the wells. To estimate the optimum solution to this problem, the cost function that needs to be minimized is introduced in Equation (20).
where is the mass flow rate at the delivery point. is the enthalpy produced by the system at the delivery point, as estimated by the system solver, for given values of choke pressure, and is the enthalpy requirement that the system needs to satisfy. Constant is used to turn the constrained optimization problem into an unconstrained one. The L-BFGS-B algorithm was utilized again and a value of 0 was used as a lower box constraint, to keep the choke pressures non-negative.
3. Case Study and Results
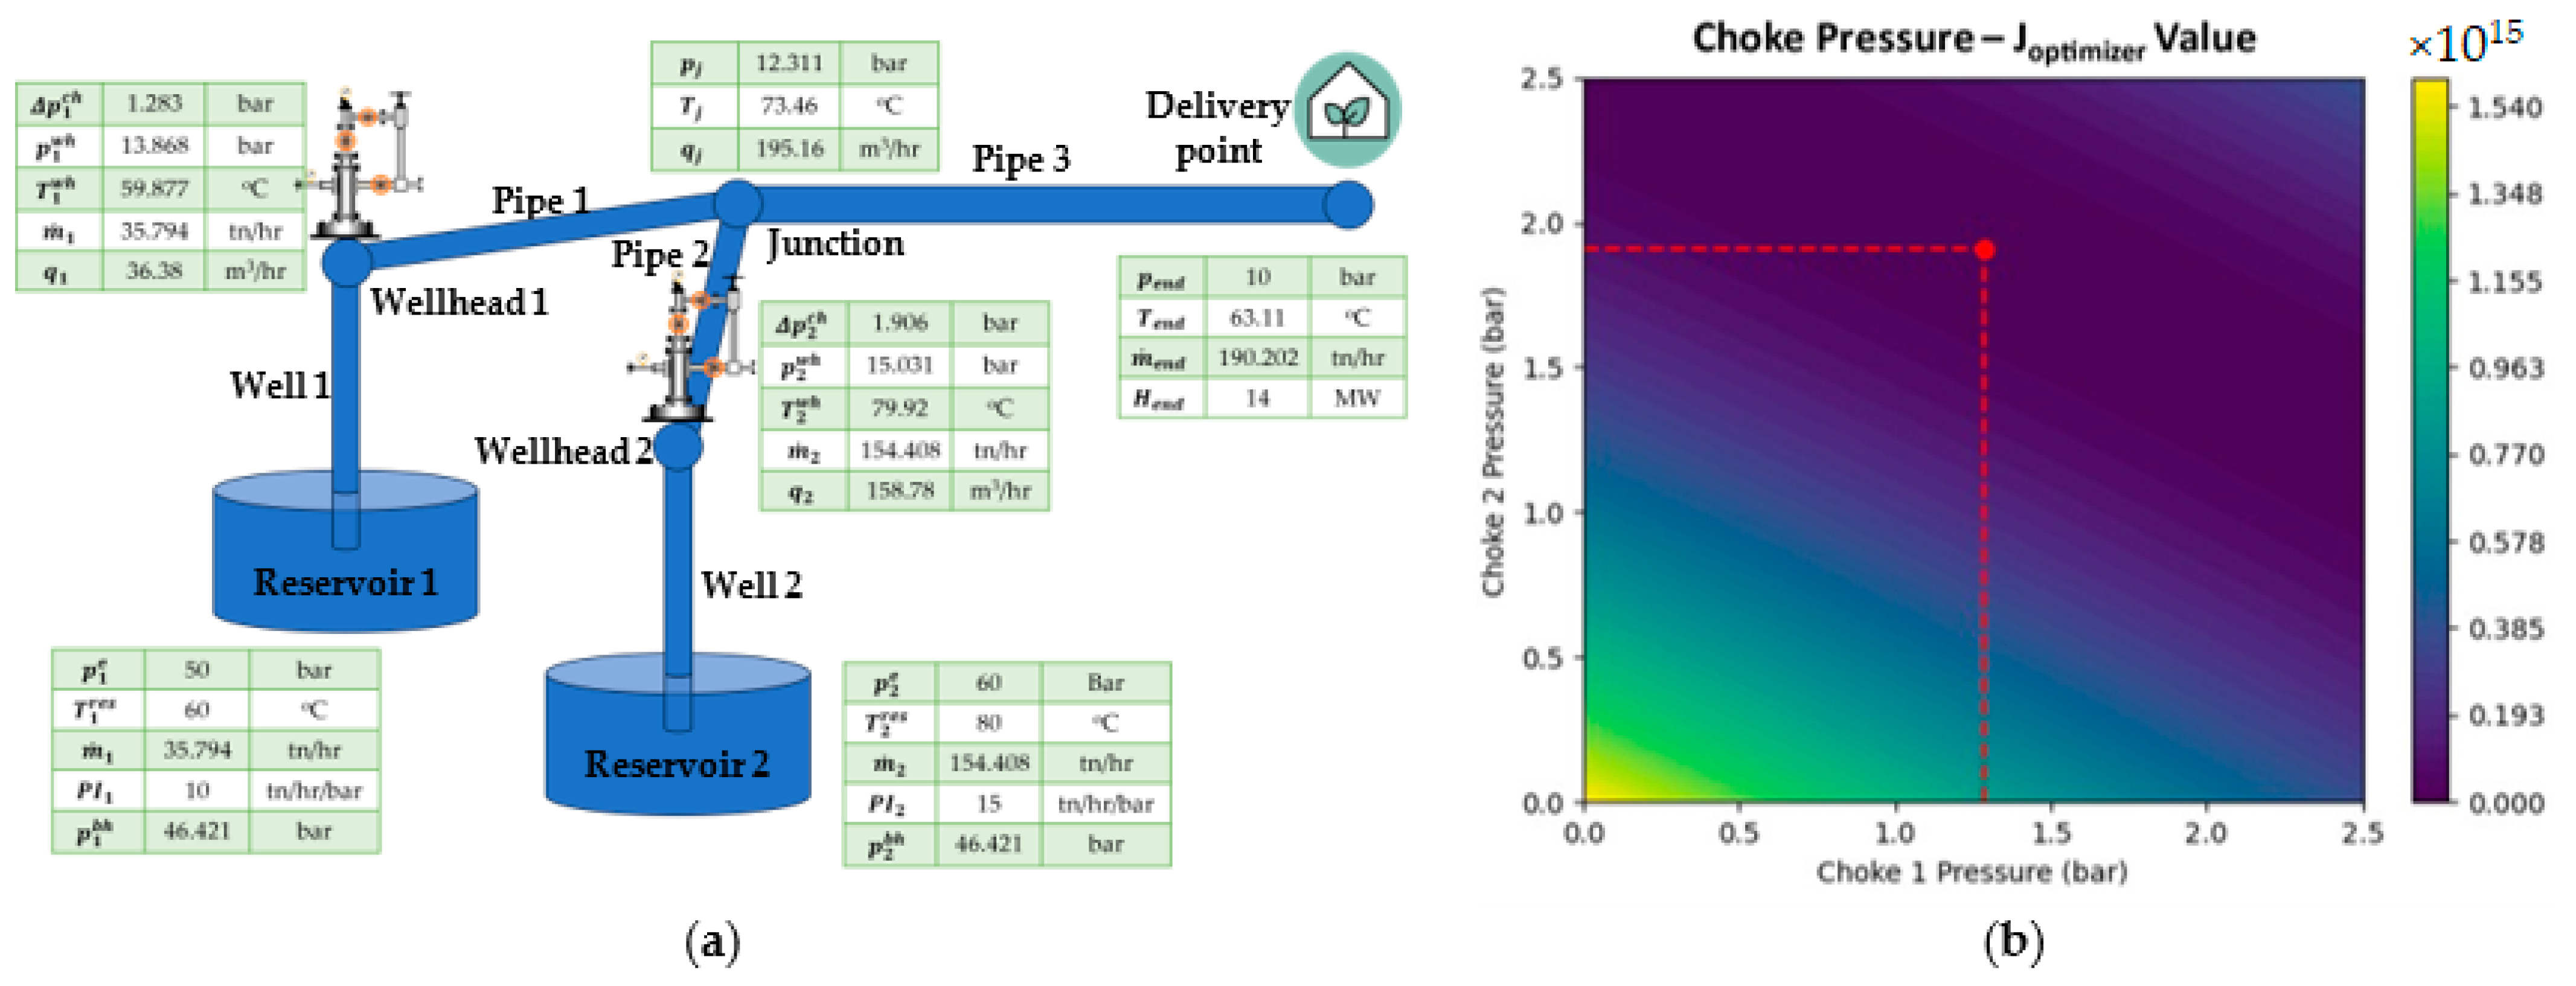
To demonstrate the effectiveness of the developed optimizer, the code was tested on an example geothermal field: two reservoirs, each with their own well and a simple horizontal network of two pipes collecting the produced geothermal fluids to a junction and finally forwarding it to the delivery point. At the delivery point, the pressure target was set at 10 bar and the enthalpy rate (i.e., power) requirement was set at 14 MW. The geometry and the parameters of the reservoir, the wells and the horizontal network, along with the initial estimations of the choke pressures and mass flow rates, are shown in detail in Table 1 and Table 2, respectively.
The results of the complete hydraulic and thermal analysis are shown in the annotations of Figure 2a. The estimated pressure and enthalpy values at the delivery point demonstrate that the algorithm was successful at simulating and tuning the complete system to meet the set targets of 10 bar and 14 MW. Furthermore, the pressure drop and heat loss across the whole system are consistent with the expected behavior. The bottom-hole pressures are dictated by the GIPRs, and the pressure drop from the bottom of the well to the wellhead is mainly caused by the effect of gravity and less by the friction inside the pipe. Along the horizontal network, the pressure drop is mainly derived from the effect of friction along the pipeline walls. The heat loss from the bottom of the reservoir to the wellheads is minor due to the small depth of the reservoirs, and, at the junction of the horizontal network, the mixing of fluids with different temperatures, along with the large length of the pipes causing the fluid to cool and transfer heat to the environment.
The optimizer was tasked to estimate the optimum operational point of the field, based on which the system produced the needed power with the least reservoir drainage. As can be seen in the colormap in Figure 2b, the enthalpy target could be met using various combinations of choke pressure values at the two wellheads, each leading to different flow rates at the delivery point, implying that there is a zone of feasible solutions to this optimization problem, but only one optimal fluid production rate. For this specific configuration, the problem is in fact convex, and the optimizer did manage to estimate the global minimum inside the feasible solutions zone.
4. Conclusions
Overall, a mathematical model to simulate a complete geothermal system and an optimizer capable of estimating the optimum operational point of the field, based on which the system produced the needed power with the least reservoir drainage, were successfully developed. The model of the system managed to combine the three separate geothermal subsystems: the reservoir, the wellbores and the horizontal surface pipeline network. The optimizer arrived at fully reasonable results and managed to accurately estimate the optimum combination of the chokes opening that minimized the fluid production rate, while meeting the enthalpy target, disregarding the rest of the multiple feasible solutions.
Further development of the optimization algorithm includes its potential tuning to anticipate alternative optimization objectives such as maximizing the enthalpy production of the geothermal field for a given flow rate and the switch to the SLSQP optimization algorithm to turn the minimization of the optimizer cost function into a constrained optimization problem.
Author Contributions
Conceptualization, S.L., S.P.F. and V.G.; methodology, S.L. and S.P.F.; software, S.L. and S.L.; validation, S.L., S.P.F. and V.G.; writing—original draft preparation, S.L.; writing—review and editing, S.L. and V.G.; visualization, S.L. All authors have read and agreed to the published version of the manuscript.
Funding
This research received no external funding.
Conflicts of Interest
The authors declare no conflict of interest.
References
- Watson, A. Geothermal Engineering: Fundamentals and Applications; Springer: New York, NY, USA, 2013. [Google Scholar] [CrossRef]
- Grant, M.A.; Bixley, P.F. Geothermal Reservoir Engineering, 2nd ed.; Academic Press: Burlington, MA, USA, 2011. [Google Scholar]
- Asy’ari, M.R.A.; Adityatama, D.W.; Purba, D. Geothermal Field Management: Various Cases from Top Geothermal Producer Countries. In Proceedings of the 48th Workshop on Geothermal Reservoir Engineering, SGP-TR-22, Stanford University, Stanford, CA, USA, 6–8 February 2023. [Google Scholar]
- Latin American Energy Organization; Inter-American Development Bank. Guide for Geothermal Field and Plant Operation and Maintenance; Latin American Energy Organization: Quito, Ecuador; Inter-American Development Bank: Quito, Ecuador, 1994. [Google Scholar]
- Aragón, A.; Moya, S.; Garcia-Gutierrez, A. Inflow performance relationships in geothermal and petroleum reservoir engineering: A review of the state of the art. Geothermics 2008, 37, 635–650. [Google Scholar] [CrossRef]
- Combs, J.; Garg, S.K. Discharge Capability And Geothermal Reservoir Assessment Using Data From Slim Holes. In Proceedings of the World Geothermal Congress 2000, Kyushu-Tohok, Japan, 28 May–10 June 2000. [Google Scholar]
- Gudmundsdottir, H.; Jonsson, M.; Pálsson, H. Coupling Wellbore Simulator with Reservoir Simulator. In Proceedings of the Thirty-Seventh Workshop on Geothermal Reservoir Engineering, SGP-TR-194, Stanford University, Stanford, CA, USA, 30 January–1 February 2012. [Google Scholar]
- Afshar, M. An Element by Element Algorithm for Pipe Network Analysis. Int. J. Eng. Sci. 2001, 12, 87–99. [Google Scholar]
- Petroleum Experts Limited. IPM PROSPER User Manual Version 12; Pertoleum Experts Limited: Edinburgh, Scotland, 2013. [Google Scholar]
Figure 1.
Flowchart of the circular solution of the coupled horizontal surface pipeline model.
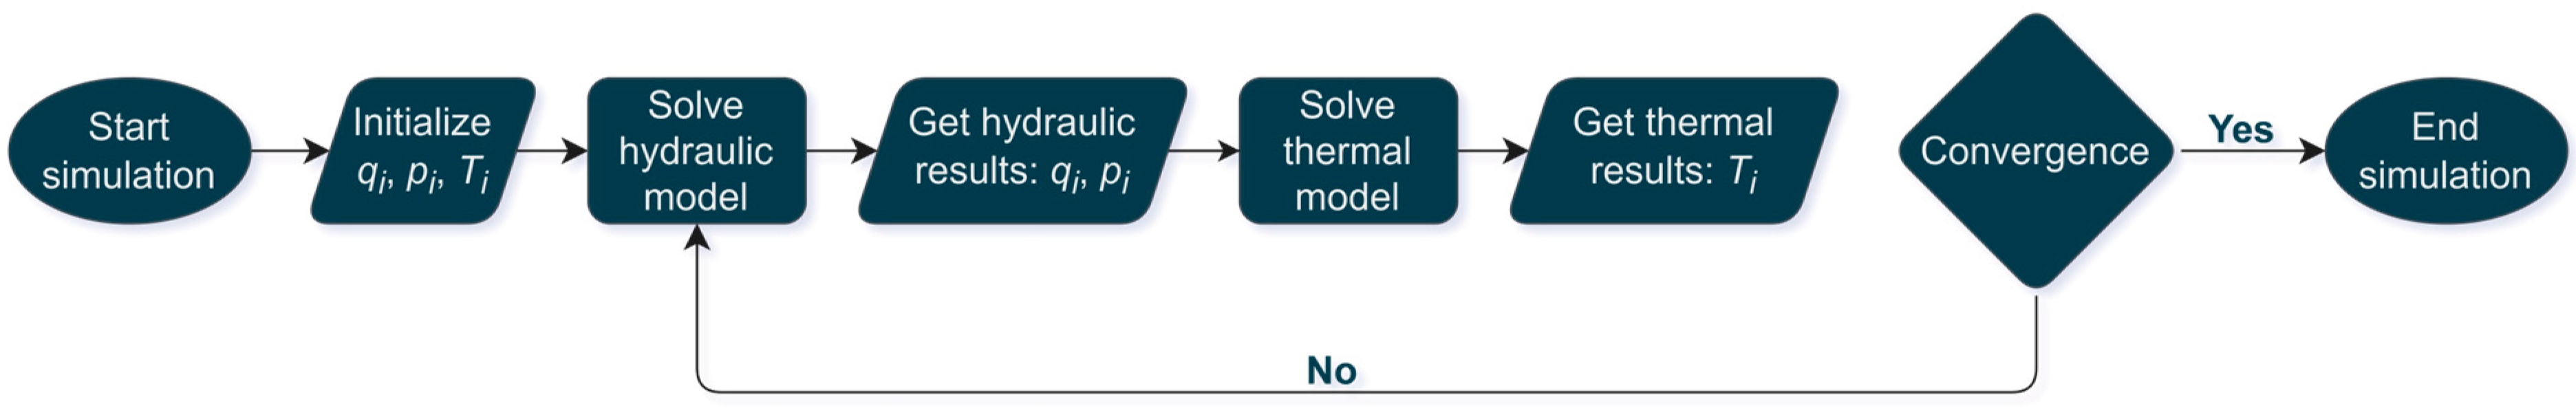
Figure 2.
(a) System optimization results; (b) diagram of possible combinations of choke pressures and the equivalent value of the optimizer cost function. The red pointer marks the optimum combination.
Figure 2.
(a) System optimization results; (b) diagram of possible combinations of choke pressures and the equivalent value of the optimizer cost function. The red pointer marks the optimum combination.

Table 1.
Reservoir and well parameters.
| Reservoirs | Parameters | Values | Units |
|---|---|---|---|
| Reservoir 1 | Boundary pressure | 50 | bar |
| Temperature | 60 | °C | |
| Depth | 320 | m | |
| Productivity index | 10 | (tn/h)/bar | |
| Wellbore diameter | 100 | mm | |
| Initial choke pressure | 0 | bar | |
| Initial mass flow estimate | 40 | tn/h | |
| Reservoir 2 | Boundary pressure | 60 | bar |
| Temperature | 80 | °C | |
| Depth | 300 | m | |
| Productivity index | 15 | (tn/h)/bar | |
| Wellbore diameter | 100 | mm | |
| Initial choke pressure | 0 | bar | |
| Initial mass flow estimate | 40 | tn/h |
Table 2.
Horizontal surface network parameters.
| Pipes | Parameters | Values | Units |
|---|---|---|---|
| Pipe 1 | Start coordinates (wellhead 1) | 0, 0, 0 | m |
| End coordinates (junction) | 1000, 0, 0 | m | |
| Diameter | 100 | mm | |
| Ambient temperature | 15 | °C | |
| Overall Thermal Coefficient | 1 | BTU/h/ft2/°F | |
| Roughness | 0.061 | mm | |
| Pipe 2 | Start coordinates (wellhead 2) | 1000, 100, 0 | m |
| End coordinates (junction) | 1000, 0, 0 | m | |
| Diameter | 100 | mm | |
| Ambient temperature | 15 | °C | |
| Overall Thermal Coefficient | 1 | BTU/h/ft2/°F | |
| Roughness | 0.061 | mm | |
| Pipe 3 | Start coordinates (junction) | 1000, 0, 0 | m |
| End coordinates (delivery point) | 3000, 100, 0 | m | |
| Diameter | 200 | mm | |
| Ambient temperature | 15 | °C | |
| Overall Thermal Coefficient | 1 | BTU/h/ft2/°F | |
| Roughness | 0.061 | mm |
Disclaimer/Publisher’s Note: The statements, opinions and data contained in all publications are solely those of the individual author(s) and contributor(s) and not of MDPI and/or the editor(s). MDPI and/or the editor(s) disclaim responsibility for any injury to people or property resulting from any ideas, methods, instructions or products referred to in the content. |
© 2023 by the authors. Licensee MDPI, Basel, Switzerland. This article is an open access article distributed under the terms and conditions of the Creative Commons Attribution (CC BY) license (https://creativecommons.org/licenses/by/4.0/).
Share and Cite
MDPI and ACS Style
Lempesis, S.; Fotias, S.P.; Gaganis, V. A Unified Approach to Describing Flow Dynamics in Geothermal Energy Production Systems. Mater. Proc. 2023, 15, 55. https://doi.org/10.3390/materproc2023015055
AMA Style
Lempesis S, Fotias SP, Gaganis V. A Unified Approach to Describing Flow Dynamics in Geothermal Energy Production Systems. Materials Proceedings. 2023; 15(1):55. https://doi.org/10.3390/materproc2023015055
Chicago/Turabian StyleLempesis, Stefanos, Sofianos Panagiotis Fotias, and Vassilis Gaganis. 2023. "A Unified Approach to Describing Flow Dynamics in Geothermal Energy Production Systems" Materials Proceedings 15, no. 1: 55. https://doi.org/10.3390/materproc2023015055