
Optimizing Geothermal Energy Extraction in CO2 Plume Geothermal Systems †


1
School of Mining and Metallurgical Engineering, National Technical University of Athens, 15773 Athens, Greece
2
Institute of Geoenergy, Foundation for Research and Technology, 73100 Chania, Greece
*
Author to whom correspondence should be addressed.
†
Presented at the 2nd International Conference on Raw Materials and Circular Economy “RawMat2023”, Athens, Greece, 28 August–02 September 2023.
Mater. Proc. 2023, 15(1), 52; https://doi.org/10.3390/materproc2023015052
Published: 24 November 2023
Abstract
:CPG (CO2 Plume Geothermal) has recently emerged as a promising technology to combine the extraction of geothermal energy with underground CO2 storage, thus achieving double positive results. The idea is to inject CO2 in its supercritical form to create a plume and replace the reservoir brine, which is continuously circulated to transfer heat from the reservoir to surface facilities. Apart from the positive aspects of this technology, including the reduced energy to inject and lift the working fluid as well as its enhanced mobility in the reservoir and reduced environmental footprint, there are also negative issues that must be handled by adequately studying the geological field/reservoir and appropriately designing the production system. In this work, we present a finite volume numerical simulation that can study a geothermal reservoir from its geological origin to the dynamic simulation of CO2 injection and estimate the geothermal energy extraction. It is shown that the system performance is strongly related to the selected schedule, and optimizing it in conjunction with the related cost is of the utmost importance for the Final Investment Decision to be taken and for the viability of such multipurpose projects under a sustainable future.
1. Introduction
Geothermal power plants utilize the temperature disparity between the Earth’s heated subsurface rock and the cooler surface to produce electricity. These systems convey thermal energy from beneath the ground to the surface using a working fluid, which subsequently undergoes a partial transformation of thermal energy to electricity within a power plant. The cooled working fluid is typically reinjected into a subsurface reservoir to establish hydraulic sustainability. Traditional geothermal energy technologies employ hot brine as the working fluid, and, as a result, power plants are often situated in regions with active tectonic or volcanic activity where the temperature gradient is exceptionally high [1]. Such fields are characterized as high enthalpy ones and are utilized for power generation. In Greece, for example, they are directly related to the well-known subduction of the African lithospheric plate beneath the Aegean microplate and the subsequent development of the South Aegean Active Volcanic Arc (SAAVA). High enthalpy geothermal fields in Greece appear in the Cyclades group of Islands to be relevant to the aforementioned arc volcanic activity (e.g., the “proven” Milos and Nisyros fields) and in the wider area surrounding Lesvos island (older location of the arc that currently moved southwards) [2], while within the same area, shallow-depth, low-temperature geothermal fields occur as well, e.g., that of SW Santorini Island, which is characterized as “probable” [3]. Nonetheless, such distinctive thermal resources are limited in terms of their size and location, prompting the need for innovative technologies to exploit the vast amount of thermal energy present in the Earth’s crust.
Enhanced Geothermal Systems (EGS) have been suggested as a means to expand access to geothermal resources by artificially constructing reservoirs in areas that lack suitable conditions [4]. These systems typically involve the injection of cold pressurized water for the hydraulic fracturing of a subsurface formation. The injected water receives heat and is pumped back to the surface. Carbon dioxide (CO2) has been proposed as an alternative working fluid due to its non-toxic, abundant, and non-flammability properties [5]. However, the challenges linked to using CO2 in EGS, such as its reduced density at reservoir conditions and environmental impact in the case of a leakage, necessitate further research and development. Addressing the risks associated with employing CO2 in EGS, CO2 Plume Geothermal (CPG) energy systems have been recently introduced and even developed [6,7,8]. These systems use CO2 as the primary subsurface working fluid in naturally permeable sedimentary basins or EGS, generating a large-scale CO2 plume. Furthermore, a buoyancy-driven thermosiphon can be established by exploiting CO2 density variations between the injection and production wells. By performing this, the requirement for expensive pumping, which is commonly associated with conventional hydrothermal setups, can be eliminated.
Sedimentary basins appropriate for CPG systems are found globally [9]. These basins often comprise aquifers with high salinity, rendering them unsuitable for drinking or industrial water resources. They may also encompass partially depleted oil and gas fields utilized for Enhanced Oil Recovery (EOR) operations [10]. In a CPG system, the buoyant CO2 must be contained by very low-permeability or fully impervious caprock beds that cover the permeable reservoir. Additionally, CPG systems can be integrated with CO2 capture and storage (CCS) sites [11,12,13], enabling the simultaneous generation of electricity and heat while sequestering CO2. This integration ensures reservoir stability by alleviating overpressurization in relation to standalone CCS operations, which could provoke human-induced seismicity and CO2 leakage. Moreover, a combined CPG–CCS system can boost the profitability of CCS, thus promoting global initiatives to combat climate change.
In this work, a deep, high-permeable, deep saline aquifer is selected for the development of the joint CPG–CCS system. The dynamics of injection involve two-dimensional variables. Namely, these include the mobility ratio and the gravity number. Via construction, the gravity number controls the strength of buoyancy (i.e., with or without buoyancy) and depends on petrophysical parameters. On the other hand, the mobility ratio depends on the CO2 and brine fluid properties as well as the capillary forces between the two fluids and the wettability of the rock. As such, it is understood that the success of the injection depends on the flow regime that the injection scenario falls into. Nevertheless, various analytical solutions, verified by numerical simulation, have been proposed to handle related issues such as cap rock uplift [14], plume pressure buildup [15], and flow regime analysis [16]. However, these solutions do not provide any information about the porous formation under inclination or under the action of thermal gradients, thus justifying the use of numerical modeling.
2. Model Description
The aquifer under consideration possesses distinctive characteristics. Situated at a depth of 3.5 km, it lacks hydraulic connectivity with adjacent formations both laterally and vertically, making it an isolated system with Neumann no-flow boundary conditions applied. Initially, it is slightly underpressurized with an average pressure of 3800 psi, which is slightly below what would be projected based on the water and rock formation gradient. Due to magmatic influences, the initial temperature is set at 500 °F. It exhibits a substantial inclination of 3 degrees, with an average thickness of 12.7 m and an areal extent reaching 80 square kilometers. To maintain simplicity in our analysis, we assumed the reservoir to be both homogeneous and isotropic in the xy plane. The elevated temperature within the aquifer exceeded what would be anticipated from a typical thermal gradient, suggesting an underlying magmatic influence. Thanks to its high and isotropic permeability, pressure is nearly uniformly distributed across all cells. Monitoring pressure within the aquifer ensures that the fracturing limit, which could result in unintended rock fractures, is not surpassed. Our calculations are based on the numerical solution of the mass, momentum, and energy differential equations governing fluid flow within the porous medium.
The selected aquifer for this simulation mirrors PVT properties, which are commonly found in the SAAVA area. The simulator utilized in this study [17] is a 3D black oil model that integrates fluid flow and heat transfer. Given our dual focus on CCS and geothermal engineering, technical units are consistently employed throughout the text, with conversion factors detailed in Table 1 to aid reader comprehension. The characteristics of the aquifer are presented in Table 2.
3. Schedule
Since CO2 is lighter than water even in its supercritical phase, the inclination of the system exhibited in Figure 1 can be effectively utilized. The proposed methodology involves extracting water from the bottom of the aquifer to create space for injecting CO2 at the top for two years (phase A). The density disparity between the two fluids generates a CO2 plume that expands rapidly within the upper layer, allowing it to reach deeper production wells. However, due to the aquifer inclination and the limited vertical permeability compared to the horizontal one (kz = 0.1 × kx), the migration of the CO2 plume experiences a slight deceleration. The Voidage Replacement Ratio (VRR), defined as the ratio between the volume of the injected fluid and the volume of the produced fluid, exhibits variations during the process due to the influence of the downhole temperature on the density of the injected fluid and the occurrence of CO2 breakthrough toward the latter stages. On average, the VRR maintains a value of 91%, resulting in a minor decrease in pressure.
Once a substantial amount of water has been produced and the simultaneous injection of CO2 has taken place, Wells 3 and 4, which were formerly used to withdraw brine, are closed to prevent the concurrent production of CO2 after CO2 breakthrough has occurred. Wells 1 and 2 continue operating as before (i.e., injecting CO2) but with an increased injection rate for another thirteen years (phase B) to model the arrival of additional emitters. This phase is characterized by a significant pressure buildup within the aquifer. It is crucial to monitor the maximum pressure to ensure it remains below the safe limit of the fracture pressure of the caprock. After the maximum quantity of CO2 has been securely stored, the CPG phase is initiated. Well 3 is converted into a production well, while Well 4 maintains its injection activity at a slightly higher rate than the production rate of Well 3. This adjustment is made to account for the presence of a relatively small-scale CO2 emitter, allowing for its safe storage throughout the CPG phase without risking uncontrolled pressure escalation. Consequently, a functional CPG system is set in motion, the sustainability of which is evaluated for the next ten years (phase C). The control scheme is expressed in detail in Table 3 and Table 4.
4. Discussion/Results
The simulations are conducted using the Reveal simulator, a software developed by Petroleum Experts (IPM) [17]. Throughout the simulations, the average pressure within the reservoir remains safely below the fracturing pressure. It is important to note that, in contrast to oil production, where maximizing profits often drives greedy optimization schedules, CCS is inherently unprofitable. Therefore, there is no necessity to adopt a greedy schedule that could push the aquifer’s pressure close to its fracture limit.
The most important result obtained is the total mass of CO2 sequestered, as depicted in Figure 2, and the geothermal power output that can be extracted from CO2 produced before it is recycled, as shown in Equation (1)
where , are the specific enthalpy of CO2 at the wellhead conditions in the production (Well_3) and injection (Well_4) wells, respectively, and is the mass flow rate.
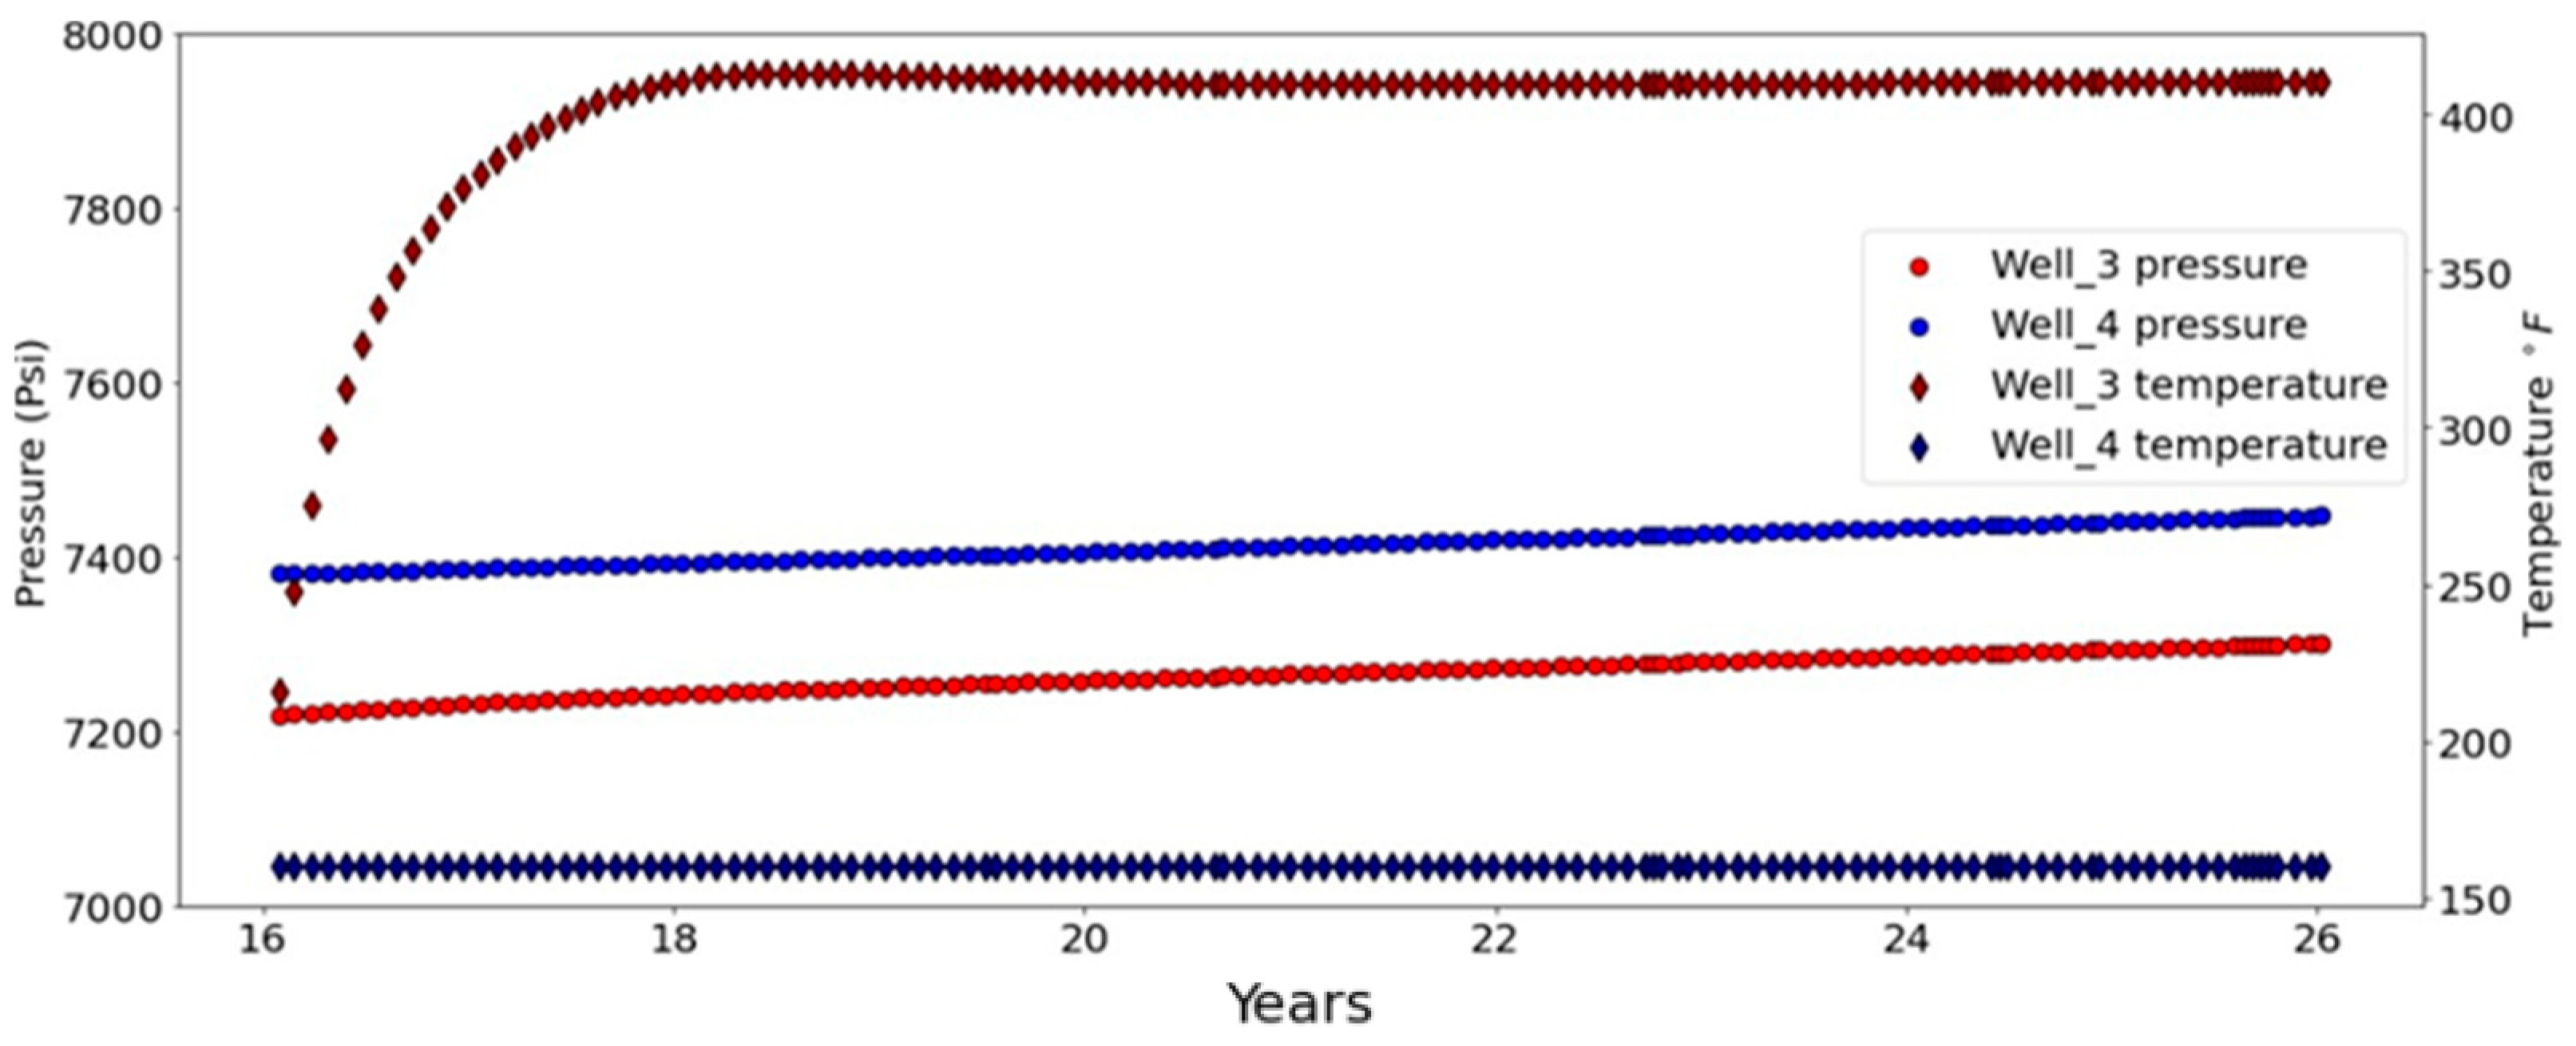
After 25 years of control, the total mass of CO2 that is sequestered within the reservoir is estimated at 36.3 MMtonnes. To calculate the power output, the produced CO2 mass rate is directly obtained from the simulator and equals = 6.58 Mtonnes/day. CoolProps [18] software was utilized to estimate CO2-specific enthalpy by inputting the temperature and pressure values, as shown in Figure 3. The average specific to the production well is calculated at 238.7 BTU/lbm and at the injection well at 138.6 BTU/lbm. Subsequently, power output can be calculated in a straightforward manner using Equation (1) and the mass flow rate from Table 4 after appropriate unit conversions. It is noteworthy that up to this point, Well_3 (producer) was an injection well for over a decade. Subsequently, the bottomhole temperature is initially only 160 °F and rapidly converges the desired range due to the rock heating it and hot fluids arriving at the bottomhole. The temperature observed during the later stages is considered representative of enthalpy calculations. Additionally, due to the ongoing injection of CO2 at a slightly higher rate than the production rate, the pressure gradually increases during phase 3. The average pressure value is employed as the representative for enthalpy estimation purposes.
High enthalpy wells can be considered almost isenthalpic, implying that fluid enthalpy remains constant along the well as long as CO2 remains in a supercritical state. The power output can be calculated straightforwardly and is determined to be E = 17.7 MW. To further increase the power output, the injection and production rates can be increased as needed. There is no need for global concern regarding the average pressure increase, as the fluid is injected and produced simultaneously at similar rates. Additionally, there is no local concern regarding pressure buildup due to the high and isotropic permeability of the reservoir. When considering the increasing recycling rates, the main consideration is the time it takes for the returned fluid to reach the reservoir’s temperature. Ideally, it is preferable for the fluid to reach the aquifer’s temperature before being produced, as the density of supercritical CO2 decreases when an increase in temperature and geothermal energy retrieval is maximized. However, even with the moderate flow rates simulated in this study, the temperature of the produced fluid ultimately converges to a value significantly lower than the temperature of the aquifer. Nevertheless, there are many control options to be exploited in order to optimize the production temperature, such as moving the wells further apart, utilizing deep saline aquifers with higher magmatic activity, or even halting the CPG for a few months in order for the fluid to reach the aquifer’s temperature, which actually cannot be considered a practical option for an industrial application.
5. Conclusions
In conclusion, the integration of the CPG–CCS joint system presents a groundbreaking approach that synergizes energy production with carbon-negative emissions. This study uniquely focused on a deep saline aquifer situated in a region characterized by pronounced subsurface magmatic activity. The outcomes unequivocally demonstrate the remarkable success in sequestering over 36 million tonnes of CO2 over a 25-year period. Additionally, the establishment of a geothermal system effectively harnesses the sequestered CO2 for energy generation. This innovative system offers multifaceted advantages. Firstly, it significantly contributes to carbon negativity by securely storing a substantial volume of CO2. Moreover, it facilitates energy extraction through geothermal means, augmenting the overall energy output. This unique amalgamation of carbon sequestration and geothermal energy underscores the potential for a system that not only yields surplus energy but also mitigates carbon emissions. These compelling findings underscore the feasibility, importance, and novelty of the CPG–CCS joint system, positioning it as a sustainable and impactful solution to address carbon emissions and fulfill our growing energy needs. Continued research and development in this realm hold immense promise for driving meaningful progress in the fight against climate change.
Author Contributions
Conceptualization, S.P.F., S.B. and V.G.; methodology, S.P.F.; software, S.P.F.; validation, S.P.F. and V.G.; writing—original draft preparation, S.P.F.; writing—review and editing, S.P.F., S.B. and V.G.; visualization, S.P.F. All authors have read and agreed to the published version of the manuscript.
Funding
This research received no external funding.
Institutional Review Board Statement
Not relevant.
Informed Consent Statement
Not applicable.
Data Availability Statement
All data supporting reported results have been included in the manuscript.
Conflicts of Interest
The authors declare no conflict of interest.
References
- DiPippo, R. Geothermal Power Plants: Principles, Applications, Case Studies and Environmental Impact; Butterworth-Heinemann: Oxford, UK, 2012. [Google Scholar]
- Fytikas, M. Updating of the geological and geothermal research on Milos island. Geothermics 1989, 18, 485–496. [Google Scholar] [CrossRef]
- Mendrinos, D.; Choropanitis, I.; Polyzou, O.; Karytsas, C. Exploring for geothermal resources in Greece. Geothermics 2010, 39, 124–137. [Google Scholar] [CrossRef]
- Breede, K.; Dzebisashvili, K.; Liu, X.; Falcone, G. A systematic review of enhanced (or engineered) geothermal systems: Past, present and future. Geotherm. Energy 2013, 1, 4. [Google Scholar] [CrossRef]
- Brown, D.W. A hot dry rock geothermal energy concept utilizing supercritical CO2 instead of water. In Proceedings of the Twenty-Fifth Workshop on Geothermal Reservoir Engineering, Stanford University, Stanford, CA, USA, 24–26 January 2000; pp. 233–238. [Google Scholar]
- Randolph, J.B.; Saar, M.O. Combining geothermal energy capture with geologic carbon dioxide sequestration. Geophys. Res. Lett. 2011, 38. [Google Scholar] [CrossRef]
- Randolph, J.B.; Saar, M.O. Coupling carbon dioxide sequestration with geothermal energy capture in naturally permeable, porous geologic formations: Implications for CO2 sequestration. Energy Procedia 2011, 4, 2206–2213. [Google Scholar] [CrossRef]
- Adams, B.M.; Kuehn, T.H.; Bielicki, J.M.; Randolph, J.B.; Saar, M.O. A comparison of electric power output of CO2 Plume Geothermal (CPG) and brine geothermal systems for varying reservoir conditions. Appl. Energy 2015, 140, 365–377. [Google Scholar] [CrossRef]
- Langenfeld, J.K.; Bielicki, J.M. Assessment of sites for CO2 storage and CO2 capture, utilization, and storage systems in geothermal reservoirs. Energy Procedia 2017, 114, 7009–7017. [Google Scholar] [CrossRef]
- Freifeld, B.; Zakim, S.; Pan, L.; Cutright, B.; Sheu, M.; Doughty, C.; Held, T. Geothermal energy production coupled with CCS: A field demonstration at the SECARB Cranfield Site, Cranfield, Mississippi, USA. Energy Procedia 2013, 37, 6595–6603. [Google Scholar] [CrossRef]
- Miranda-Barbosa, E.; Sigfússon, B.; Carlsson, J.; Tzimas, E. Advantages from combining CCS with geothermal energy. Energy Procedia 2017, 114, 6666–6676. [Google Scholar] [CrossRef]
- Global CCS Institute. Global CCS Institute 2022 Status Report. 2022. Available online: https://status22.globalccsinstitute.com/2022-status-report/introduction/ (accessed on 14 June 2023).
- Lau, H.C.; Ramakrishna, S.; Zhang, K.; Radhamani, A.V. The role of carbon capture and storage in the energy transition. Energy Fuels 2021, 35, 7364–7386. [Google Scholar] [CrossRef]
- Gravanis, E.; Sarris, E. A working model for estimating CO2-induced uplift of cap rocks under different flow regimes in CO2 sequestration. Geomech. Energy Environ. 2023, 33, 100433. [Google Scholar] [CrossRef]
- Sarris, E.; Gravanis, E. Flow regime analysis of the pressure build-up during CO2 injection in saturated porous rock formations. Energies 2019, 12, 2972. [Google Scholar] [CrossRef]
- Ernestos, S.; Elias, G.; Panos, P. Investigation of self-similar interface evolution in carbon dioxide sequestration in saline aquifers. Transp. Porous Media 2014, 103, 341–359. [Google Scholar] [CrossRef]
- Petroleum Experts. IPM Suite, Version 13, [Software]; PE Limited: Edinburgh, UK, 2022. Available online: https://www.petex.com/products (accessed on 14 June 2023).
- Bell, I.H.; Wronski, J.; Quoilin, S.; Lemort, V. Pure and Pseudo-pure Fluid Thermophysical Property Evaluation and the Open Source Thermophysical Property Library CoolProp. Ind. Eng. Chem. Res. 2014, 53, 2498–2508. [Google Scholar] [CrossRef] [PubMed]
Figure 1.
Aquifer inclination and well positions.
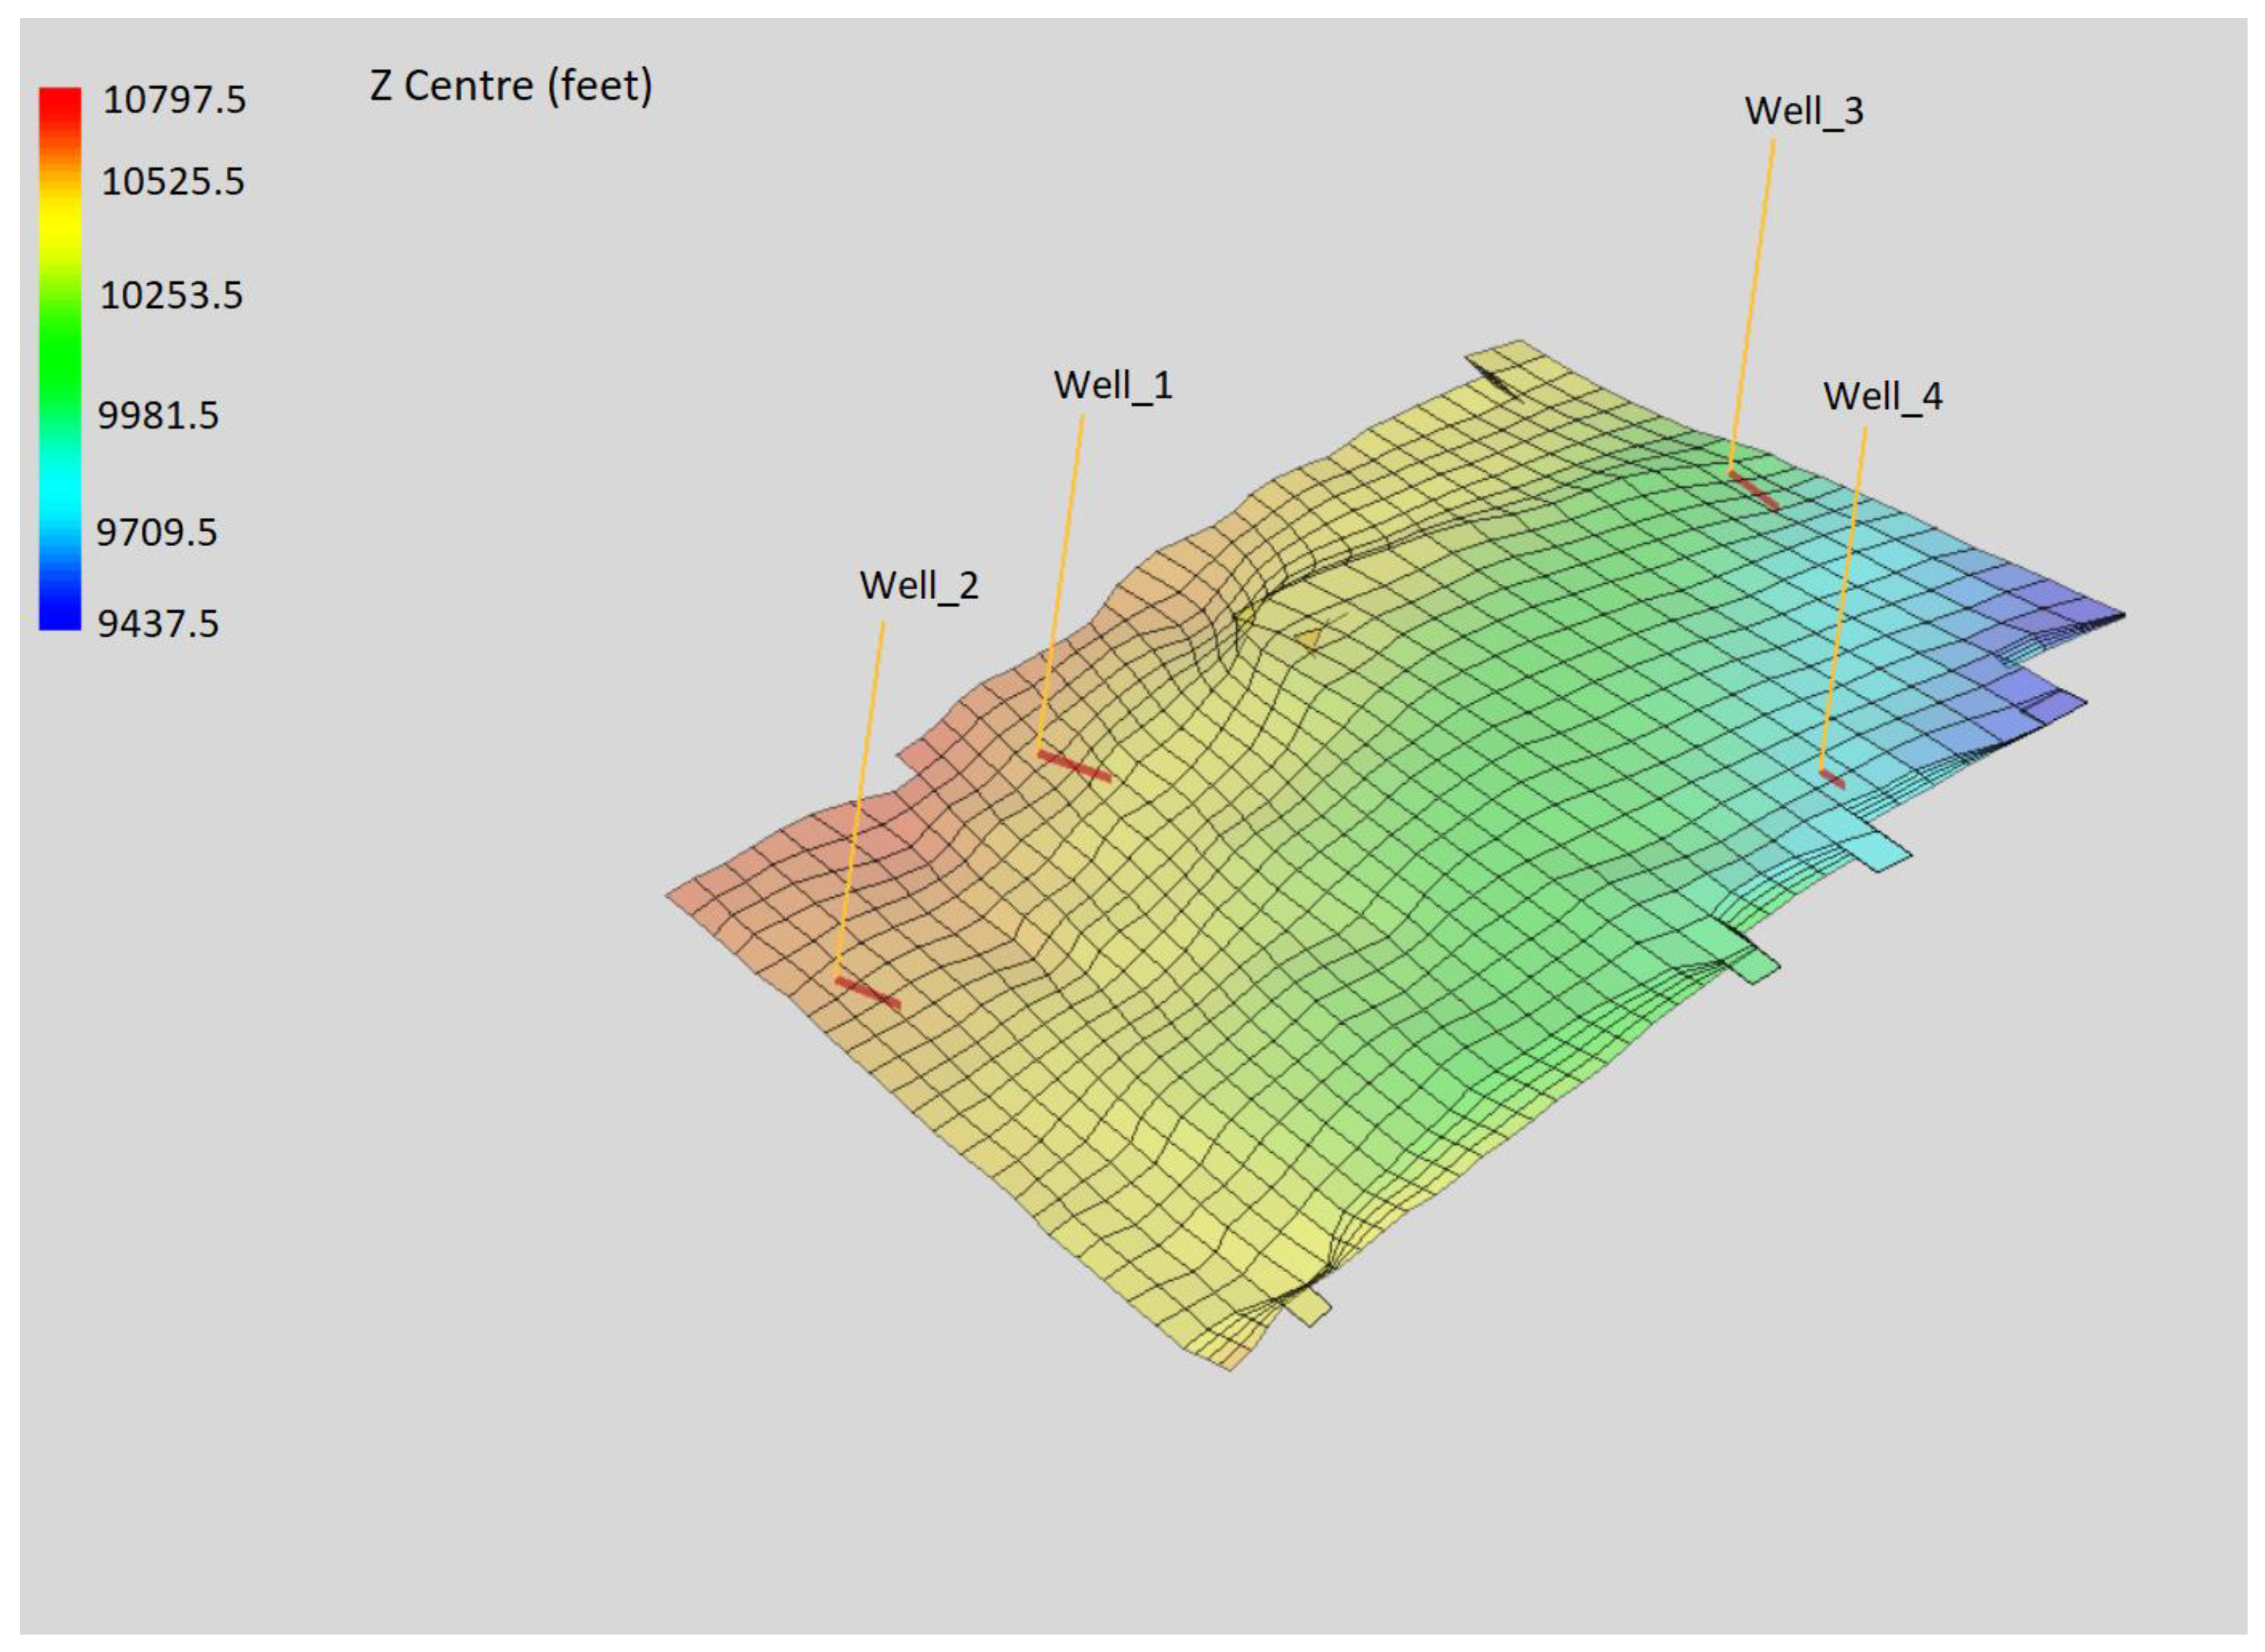
Figure 2.
Cumulative mass of CO2 sequestered in the aquifer (1010 lbm) vs. time (years). At phase A, 308 Mtonnes of CO2 are injected each year, and a percentage of them is produced after the breakthrough. At phase B, 2600 Mtonnes are injected and sequestered each year; therefore, the cumulative mass stored is much higher, represented by a considerable slope increase. Finally, in phase C, CPG is initiated where 2500 Mtonnes are injected and simultaneously 2400 Mtonnes are produced, resulting in a net sequestration rate of 100 Mtonnes per year.
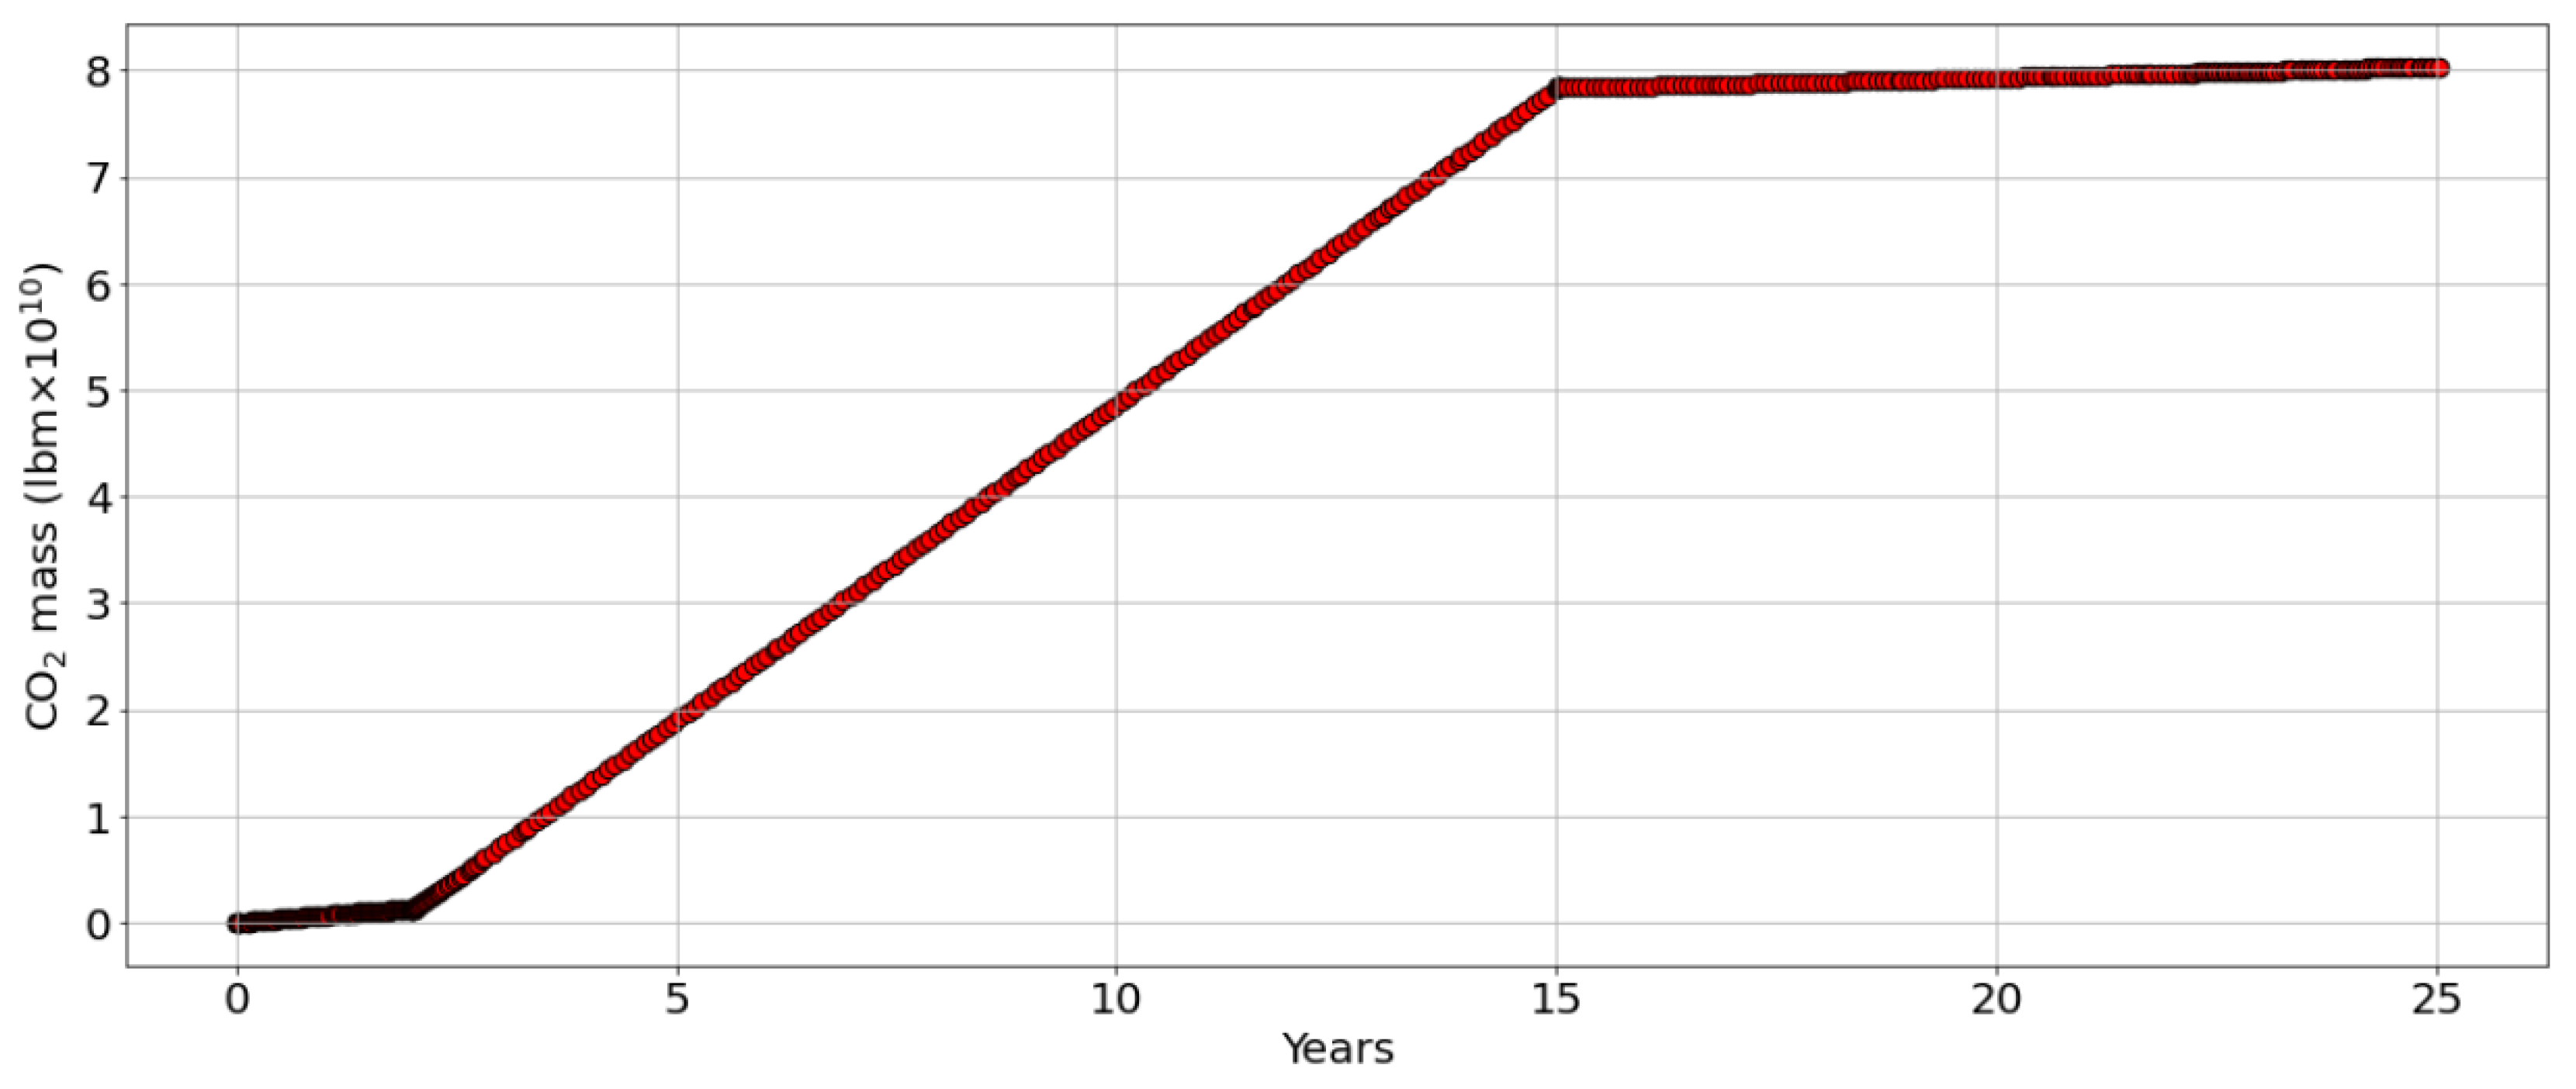
Figure 3.
Bottomhole pressures and temperatures for Well_3 and Well_4 during phase C.

Table 1.
Unit conversion.
| Property | Name | Symbol | SI Conversion |
|---|---|---|---|
| pressure | pounds per square inch | Psi | 6894.76 Pa |
| temperature | Fahrenheit | °F | (K − 273.15) · 9/5 |
| depth | feet | ft | 0.348 m |
| permeability | milliDarcy | mD | 10−15 m2 |
| CO2 volume | (standard) cubic feet | (s)cf | 0.028 m3 |
| liquid volume | stock tank barrel | STB | 0.16 m3 |
| mass | pounds | lbm | 0.45 kg |
| specific enthalpy | British thermal unit per pound mass | BTU/lbm | 2326 J/kg |
| mass flow rate | pound mass per minute | 0.0076 kg/s | |
| energy | British thermal unit | BTU | 1055 J |
| one thousand | M | ||
| one million | MM | ||
| one billion | MMM |
Table 2.
Aquifer characteristics.
| Parameter | Value | Units |
|---|---|---|
| Average Pressure (P) | 3800 | Psi |
| Temperature (T) | 500 | °F |
| Porosity (ϕ) | 0.2 | |
| Average depth (D) | 10, 180 | ft |
| Permeability (k) | 300 | mD |
| Bulk Volume (V) | 3.5 · 1011 | cf |
| Water in place | 1.1 · 1010 | STB |
| Thickness | 41.6 | ft |
Table 3.
Well schedule production (P) and injection (I) rate.
| Well | Phase A | Phase B | Phase C |
|---|---|---|---|
| Well_1 | (P) 5000 STB/day | - | - |
| Well_2 | (P) 5000 STB/day | - | - |
| Well_3 | (I) 8 MMscf/day | (I) 70 MMscf/day | (P) 125 MMscf/day |
| Well_4 | (I) 8 MMscf/day | (I) 70 MMscf/day | (I) 130 MMscf/day |
Table 4.
Well schedule production (P) and injection (I) mass rate.
| Well | Phase A | Phase B | Phase C |
|---|---|---|---|
| Well_1 | (P) 290 Mtonnes/year | - | - |
| Well_2 | (P) 290 Mtonnes/year | - | - |
| Well_3 | (I) 154 Mtonnes/year | (I) 1.3 MMtonnes/year | (P) 2.4 MMtonnes/year |
| Well_4 | (I) 154 Mtonnes/year | (I) 1.3 MMtonnes/year | (I) 2.5 MMtonnes/year |
Notes: (P) denotes the production rate, (I) denotes the injection rate. Well_1 and Well_2 are dedicated to production. Well_3 is dedicated to injection in phases A and B and switches to production in phase C. Well_4 is dedicated to injection in all phases.
Disclaimer/Publisher’s Note: The statements, opinions and data contained in all publications are solely those of the individual author(s) and contributor(s) and not of MDPI and/or the editor(s). MDPI and/or the editor(s) disclaim responsibility for any injury to people or property resulting from any ideas, methods, instructions or products referred to in the content. |
© 2023 by the authors. Licensee MDPI, Basel, Switzerland. This article is an open access article distributed under the terms and conditions of the Creative Commons Attribution (CC BY) license (https://creativecommons.org/licenses/by/4.0/).
Share and Cite
MDPI and ACS Style
Fotias, S.P.; Bellas, S.; Gaganis, V. Optimizing Geothermal Energy Extraction in CO2 Plume Geothermal Systems. Mater. Proc. 2023, 15, 52. https://doi.org/10.3390/materproc2023015052
AMA Style
Fotias SP, Bellas S, Gaganis V. Optimizing Geothermal Energy Extraction in CO2 Plume Geothermal Systems. Materials Proceedings. 2023; 15(1):52. https://doi.org/10.3390/materproc2023015052
Chicago/Turabian StyleFotias, Sofianos Panagiotis, Spyridon Bellas, and Vassilis Gaganis. 2023. "Optimizing Geothermal Energy Extraction in CO2 Plume Geothermal Systems" Materials Proceedings 15, no. 1: 52. https://doi.org/10.3390/materproc2023015052