
Raman Spectroscopy and Oncology: Multivariate Statistics Methods for Cancer Grading †


CNR-IBF, Consiglio Nazionale delle Ricerche, Istituto di Biofisica, via Moruzzi, 1, 56124 Pisa, Italy
*
Author to whom correspondence should be addressed.
†
Presented at the 16th International Workshop on Advanced Infrared Technology & Applications, 26–28 October 2021; Available online: https://aita2021.sciforum.net/ .
Eng. Proc. 2021, 8(1), 12; https://doi.org/10.3390/engproc2021008012
Published: 22 November 2021
(This article belongs to the Proceedings of The 16th International Workshop on Advanced Infrared Technology & Applications)
Abstract
:Over the last decade, Raman spectroscopy was demonstrated as a label-free and destructive optical spectroscopy that was able to improve diagnostic accuracy in cancer diagnosis. This ability is principally based on the great amount of biochemical information produced by the Raman scattering while investigating biological tissues. However, to achieve the relevant clinical requirements, the spectroscopic analysis and its ability to grade cancer tissues require sophisticated multivariate statistics. In this paper, we critically review multivariate statistics methods analyzed in light of their ability to process datasets generated by Raman spectroscopy in chondrogenic tumors, where distinguishing between enchondroma and the first grade of malignancy is a critical problem for pathologists.
1. Introduction
Raman spectroscopy (RS) is a noninvasive optical method for grading cancer tissues [1]. RS exploits the inelastic scattering of light with tissues, which Raman signals correlate with the molecular vibrations of biomolecules belonging to the tissues under investigation. The positions and relative magnitudes of the spectral peaks correspond to the vibrational energies associated with specific chemical bonds. Based on such scattering processes, RS is capable of detecting molecular and/or biochemical changes linked with the progression and pathology of diseases.
RS analyses of cancer tissues generate a great number of datasets where the pathologists must discriminate between tissues, their degrees of malignancy, and between biocomponents inside any tissues, such as cells, the extracellular matrix (ECM), and others. This differentiation must rely on RS signals that include single spectra (Figure 1a) or images (Figure 1b). Therefore, a multivariate analysis based on sophisticated statistical methods is mandatory when grading the tissues and performing a diagnosis with the highest accuracy.
The RS analysis performed on chondrosarcoma, a cartilaginous cancer most frequently found among primary bone tumors, revealed that distinguishing between the benign cancers (enchondroma) and grade I of chondrosarcoma (CS GI) is rather difficult as the two levels of tissues overlap due to their common biochemical components; this is commonly experienced by pathologists. Different from standard procedures, however, is the application of machine learning methods to a multivariate analysis, which can improve the grading of the enchondroma form CS GI. In this paper, we present results on the best practice for improving a multivariate analysis with ML algorithms. The approach is designed to be strictly applied to any type of cancer investigated with vibrational spectroscopy.
2. Multivariate Analysis for Grading Chondrosarcoma
An RS analysis was carried out with a Raman imaging microscope from Thermo Fisher (DXR2) on 10 patients under clinical treatments from the Azienda Ospedaliera Universtaria Pisa, Pisa University, Italy. The spectra corresponded to four different chondrosarcoma grades for the ten patients under investigation, as shown in Figure 1. An example of the imaging is displayed in Figure 2.
A Principal Componenta Analysis (PCA) and Linear Discriminant Analysis (LDA) were the first two methods used to differentiate between tissues, and between cells and the extracellular matrix (ECM). A PCA (unsupervised method) consists of the projection of features into an hyperplane with most of the data variance (approximately 95%) and its orthogonal complement. An LDA (supervised method) is used to find the feature subspace that optimizes the separability of the analyzed cartilaginous tissues. When applied to 400–1800 cm−1 spectra, the sequence PCA+LDA accomplished the best diagnosis performances, based exclusively on RS signals, reproducing the same diagnosis made by pathologists. A question arises from these excellent and encouraging results: By selecting the ranges of the spectrum only around significant peaks, is it possible to improve these results?
The relevant peaks in Figure 1A can be summarized by the following Raman bands (cm−1): 540 (Cysteine); 728 (proline); 737 (thymine DNA); 830 (proline); 1003 (phenylalanine); 1065 (proline); 1206 (difference in collagen content); 1226 (Amide III); 1380 (Glycosaminoglycans); and 1450 (CH2 bending mode in malignant tissues).
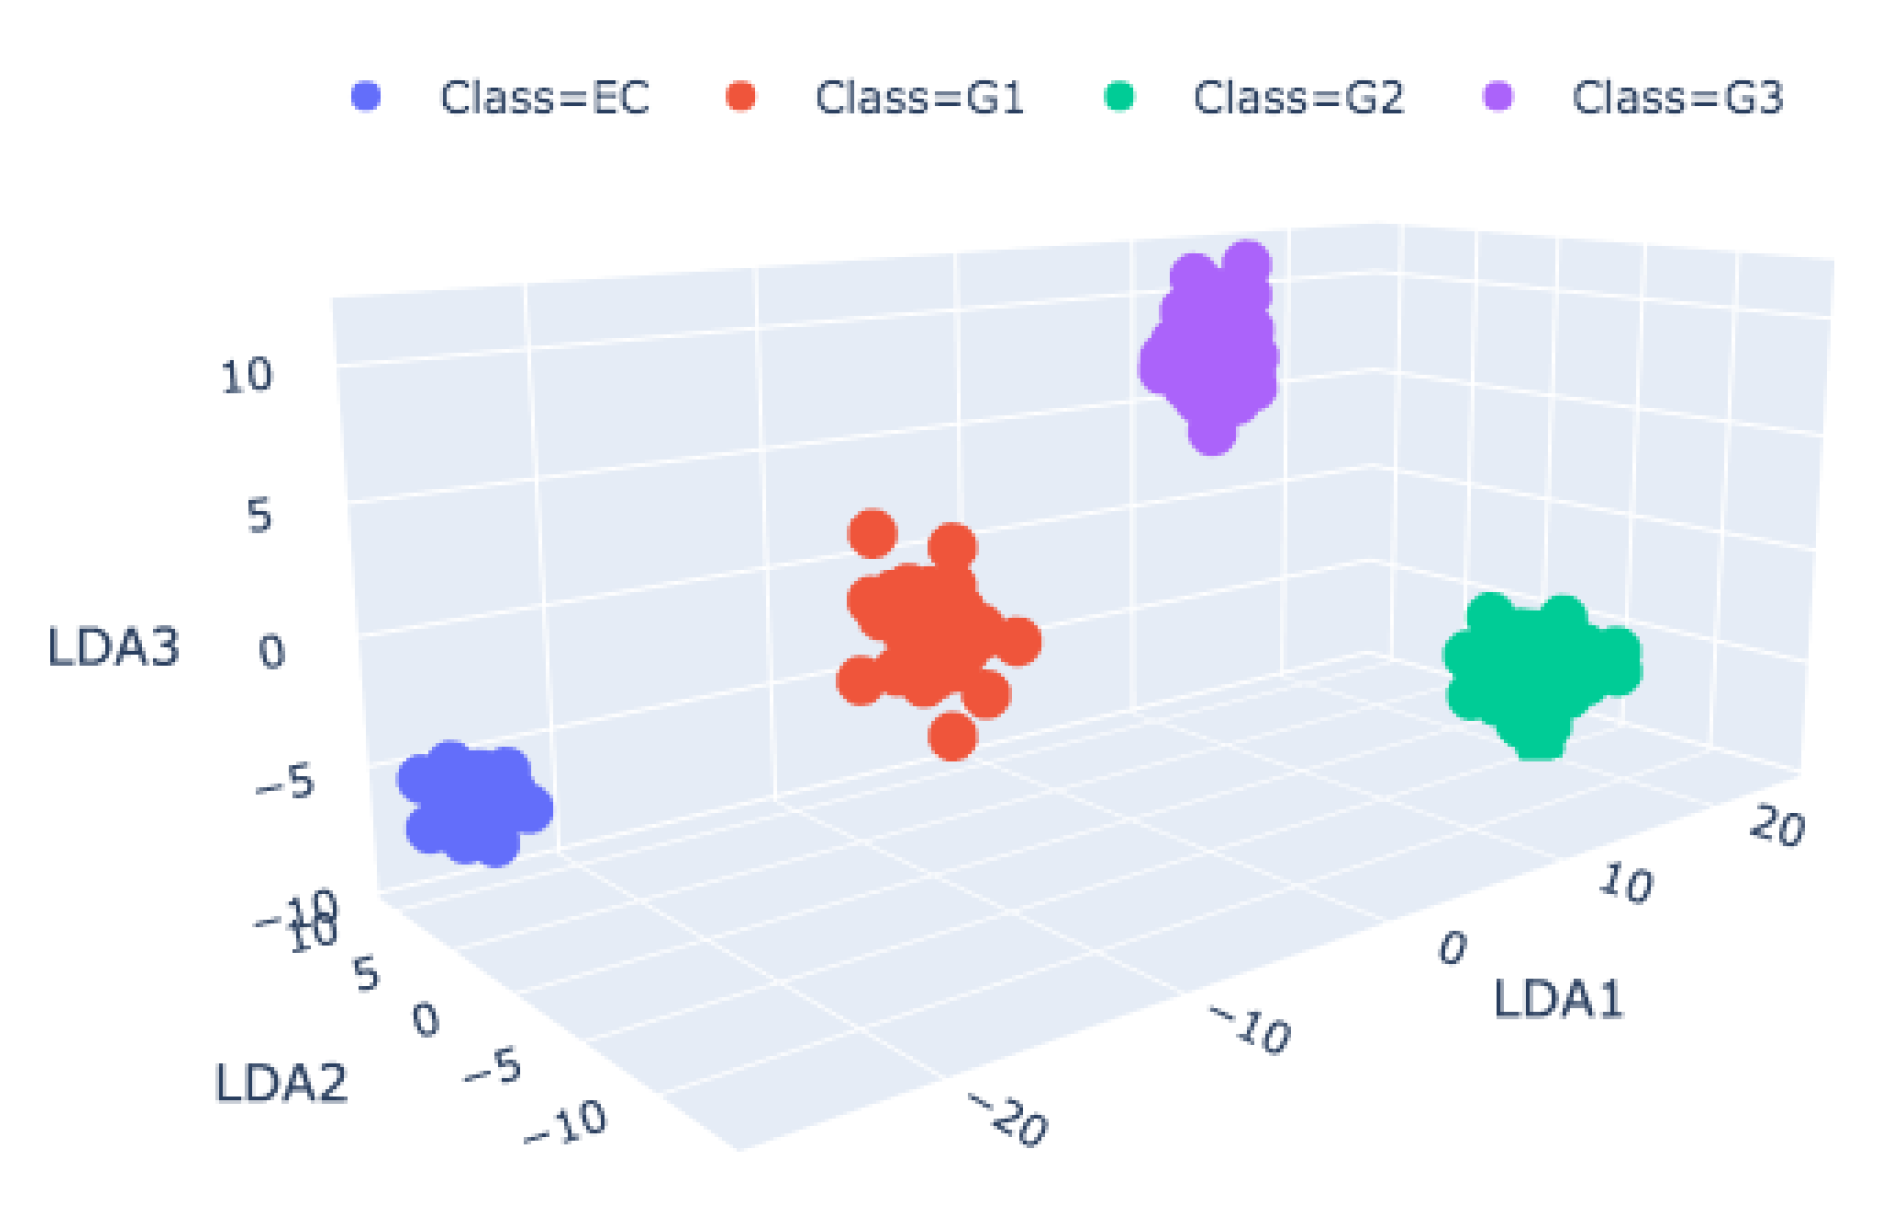
The application of PCA on the entire Raman spectrum is shown in Figure 3. There were two classes of malignancy, EC−CS GI and CS GII−CS GIII, indicating a remarkable sign inversion between the two groups. However, although PCA demonstrated a high ability to distinguish the degree of diversity between the tissue typologies, LDA was the statistical tool that had the full capability to perform a classification and diagnosis of tissues. The LDA algorithm was tested with a leave-one-patient-out, cross-validation procedure on a 40 (spectra) × 5 (PCs) matrix that resulted from the score of 40 samples for the first 5 PCs. Therefore, the data were grouped for any one of the four malignancy-grade groups. Here, we summarized the results of the LDA test, which indicated that the spectra were grouped, with EC and CS GI close to each other and a greater differentiation with CS GII and CS GIII [1]. After such promising results, we were confident that we could improve the results by focusing our attention on the critical differentiation of EC-CS GI. For example, we can improve the multivariate analysis by selecting range of spectra around relevant bands and appropriate around them. The results are discussed in Section 3.
3. Reduce the Spectra Range; Reduce the Chemical Space?
RS analysis demonstrated the capability to reproduce the results commonly observed by pathologists when struggling with the classification and progression of the first degrees of CS, in particular, EC and CS GI. However, RS analysis provides the possibility of managing spectra to improve such a grading problem. This basic improvement relies on the possibility of selecting the relevant ranges around the most prominent Raman bands. One way to rapidly address peaks of interest derives from the use of PCA. Within this work we separated the entire data matrix into small submatrices for each specific band and applied the principal components to each of them. Therefore, the relevant peaks were saved, i.e., those with the highest distances between each class, while the rest were discarded, providing a lightened dataset.
By selecting the peaks denoting proline, a major amino acid constituent of collagen, whose degradation witnesses CS progression, and 1123 cm−1 and 1450 cm−1 peaks (C-N, protein assignment, and Methylene, respectively) that are present only in EC and CS GI, we obtain an interesting differentiation between the malignancy degrees, as reported in Figure 3.
Currently, one limitation of our study is the narrow number of patients, which frames our study as a pilot study. However, the supervised method based on PCA+LDA algorithms is highly scalable and can not only be applied to larger datasets, but also to any type of cancer tissue. Our main interest is to replicate this study for melanoma. Skin cancer is one of the most common cancers in humans and its incidence is increasing dramatically [2,3]. Diagnosing malignant skin tumors is difficult as many common benign skin lesions visually resemble them, e.g., pigmented nevi and seborrheic keratosis. Currently, trained dermatologists clinically diagnose melanoma correctly in 63%–75% of cases. We are confident that we can improve these results using of our multivariate analysis.
Author Contributions
M.D. and F.N. conceptualized and developed the methodology in this study. All authors have read and agreed to the published version of the manuscript.
Funding
This research was funded by Regione Toscana, grant number Bando Salute 2018 DD 8245 del 26 May 2020.
Institutional Review Board Statement
The study was approved by the local Ethical Committee Comitato Etico Regionale per la Sperimentazione Clinica della Regione Toscana, Sezione AREA VASTA NORD OVEST (protocol number 14249).
Informed Consent Statement
An informed consent was collected from all patients. For study participants under the age of 18 years, a specific informed consent from a parent was acquired (mod. C2; protocol number 14249). All the experiments were carried out in accordance with Good Clinical Practice (GCP) and within the ethical principles of the Declaration of Helsinki.
Data Availability Statement
Requests for data sets generated during the present study, as well as both raw and processed data, can be made directly to M.D.
Acknowledgments
The authors thank the grant, TELEMO (An innovative TELEmedicine system for the early screening of Melanoma in Overall Population) funded by Regione Toscana Bando Salute 2018.
Conflicts of Interest
Authors declare no conflict of interest.
References
- D’Acunto, M.; Gaeta, R.; Capanna, R.; Franchi, A. Contribution of Raman Spectroscopy to Diagnosis and Grading of Chondrogenic Tumors. Sci. Rep. 2020, 10, 2155. [Google Scholar] [CrossRef] [PubMed]
- Lui, H.; Zhao, J.; McLean, D.; Zeng, H. Real-Time Spectroscopy for In Vivo Skin Cancer Diagnosis. Cancer Res. 2012, 72, 2491–2500. [Google Scholar] [CrossRef] [PubMed] [Green Version]
- Davis, L.E.; Shalin, S.C.; Tackett, A.J. Current state of melanoma diagnosis and treatment. Cancer Biol. Ther. 2019, 20, 1366–1379. [Google Scholar] [CrossRef] [PubMed] [Green Version]
Figure 1.
(a) Average Raman spectra of 10 patients under investigation: EC, black line; CS GI, red line; Grade II chondrosarcoma, CS GII, blue line; Grade II chondrosarcoma, CS GIII, green line, respectively. The arrows and the correspondent Raman shift value mark the most significant bands. (b) Example of RS imaging (right); the Raman hyperspectral image of the correspondent microscopy image (middle). Adapted from [1].
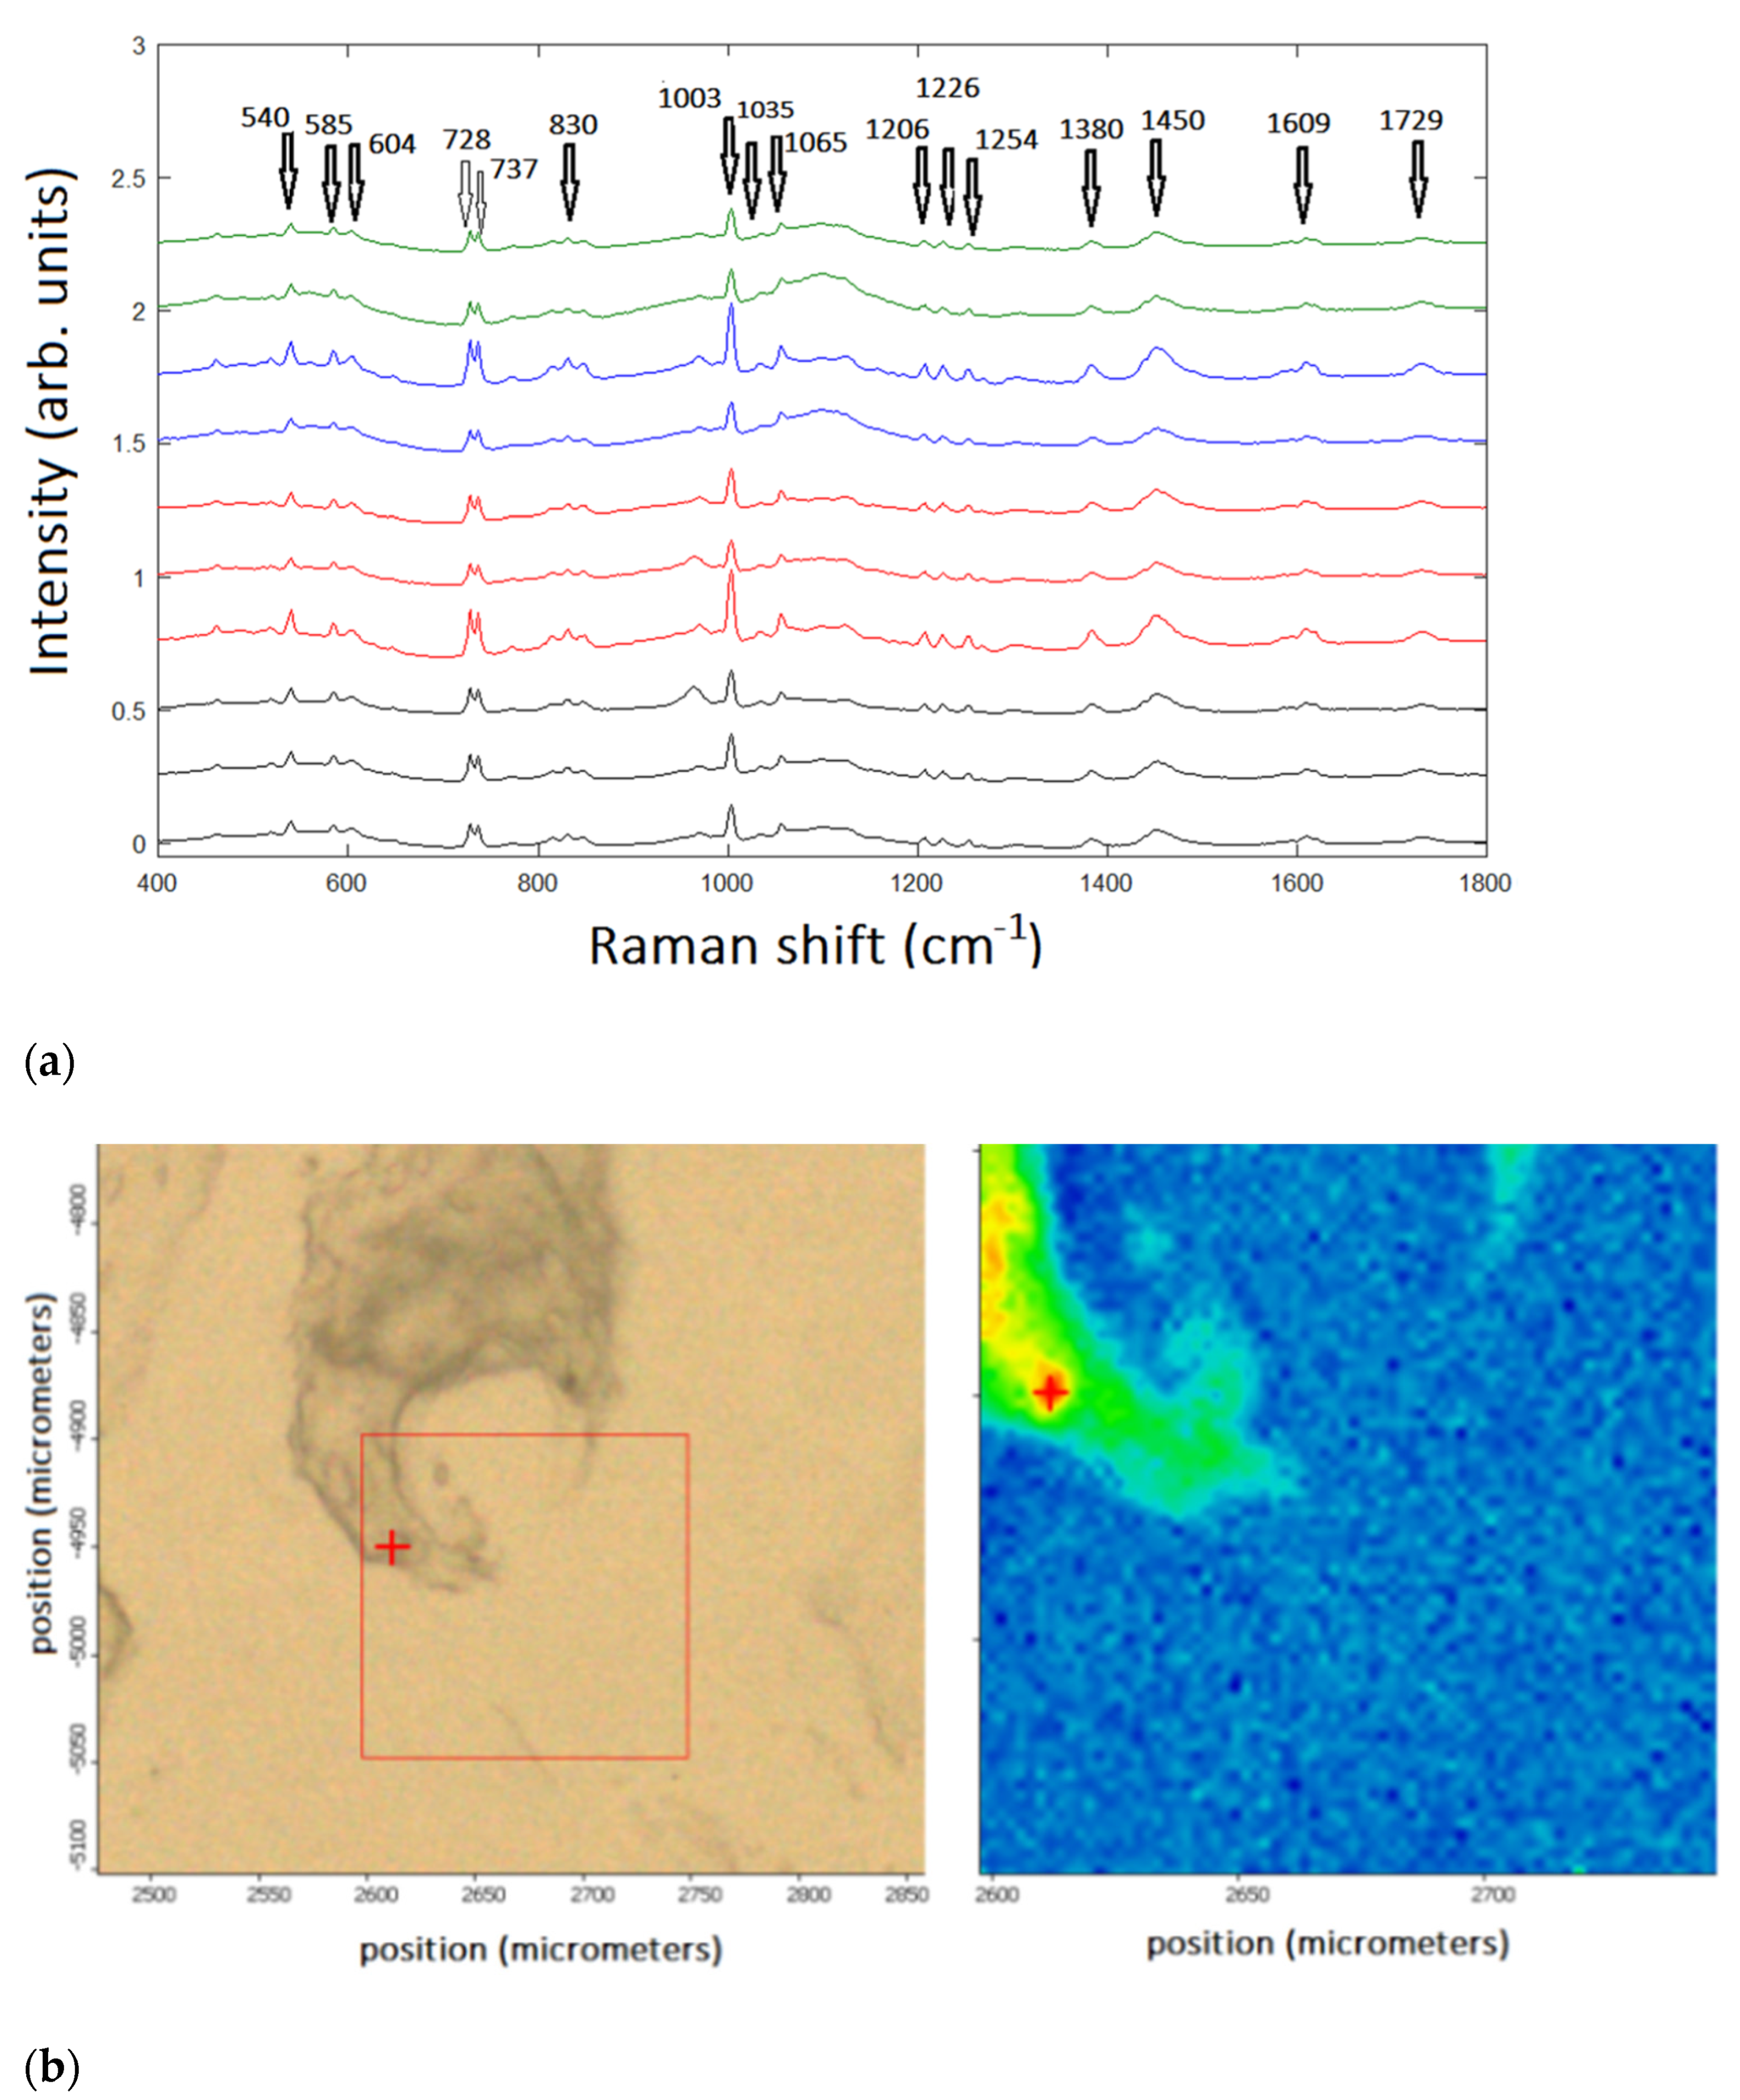
Figure 2.
Loading plots of PC1 for the various CS grades: EC, black line; CS GI, red line; Cs GII, blue line; CS GIII, green line.
Figure 2.
Loading plots of PC1 for the various CS grades: EC, black line; CS GI, red line; Cs GII, blue line; CS GIII, green line.

Figure 3.
3D representation of LDA component for the four CS malignancy groups.
Publisher’s Note: MDPI stays neutral with regard to jurisdictional claims in published maps and institutional affiliations. |
© 2021 by the authors. Licensee MDPI, Basel, Switzerland. This article is an open access article distributed under the terms and conditions of the Creative Commons Attribution (CC BY) license (https://creativecommons.org/licenses/by/4.0/).
Share and Cite
MDPI and ACS Style
Niccoli, F.; D’Acunto, M. Raman Spectroscopy and Oncology: Multivariate Statistics Methods for Cancer Grading. Eng. Proc. 2021, 8, 12. https://doi.org/10.3390/engproc2021008012
AMA Style
Niccoli F, D’Acunto M. Raman Spectroscopy and Oncology: Multivariate Statistics Methods for Cancer Grading. Engineering Proceedings. 2021; 8(1):12. https://doi.org/10.3390/engproc2021008012
Chicago/Turabian StyleNiccoli, Francesco, and Mario D’Acunto. 2021. "Raman Spectroscopy and Oncology: Multivariate Statistics Methods for Cancer Grading" Engineering Proceedings 8, no. 1: 12. https://doi.org/10.3390/engproc2021008012