Article

Population Fluctuations of the Deer Mouse (Peromyscus maniculatus) in Old-Field and Bunchgrass–Sagebrush Habitats: The Role of Agricultural Setting and Optimum Habitat

by
Thomas P. Sullivan
1,* and
Druscilla S. Sullivan
2
1
Food and Environment Program, Faculty of Land and Food Systems, The University of British Columbia, 2357 Main Mall, Vancouver, BC V6T 1Z4, Canada
2
Applied Mammal Research Institute, 11010 Mitchell Avenue, Summerland, BC V0H 1Z8, Canada
*
Author to whom correspondence should be addressed.
Ecologies 2023, 4(2), 406-425; https://doi.org/10.3390/ecologies4020026
Submission received: 21 April 2023 / Revised: 9 June 2023 / Accepted: 10 June 2023 / Published: 17 June 2023
(This article belongs to the Special Issue Feature Papers of Ecologies 2023)

Abstract

:
In semiarid regions, the deer mouse (Peromyscus maniculatus) is a major small mammal species occupying perennial grassland habitats that include old-fields, native bunchgrass–sagebrush, and some agricultural settings. We investigated population changes in deer mouse populations in perennial grasslands, both natural and old-field, from 1982 to 2003 in southern British Columbia, Canada. Hypotheses (H) predicted that P. maniculatus populations will have (H1) multiannual fluctuations in abundance driven by population increases from extended breeding in summer and winter; (H2) relaxed spring reorganization events in some years leading to higher overall recruitment and survival; and (H3) interspecific competition with montane voles that causes deer mice to be lower in density when voles are higher. P. maniculatus populations in old-field and grass–sagebrush sites had clearly defined periods of high “peak” mean numbers (32–52/ha) and other times of low mean numbers (20–22/ha). Based on mean annual peak density in autumn, deer mouse populations exhibited fluctuations of 3–4 years in both habitats, but this pattern was not always present. The greater numbers of P. maniculatus in high than low years was directly related to population increases from extended breeding seasons and an increased number of lactating females, thereby supporting H1. Spring breeding season declines occurred but were similar or less in high than low years of mean abundance and were relaxed in comparison to forest populations of deer mice in other studies. Thus, H2 was supported for recruitment with high numbers of young-of-the-year breeding and total number of juvenile recruits but for survival was equivocal. Total summer survival was consistently higher in high than low population years but juvenile productivity in all years was poor. Mean abundance of P. maniculatus and M. montanus in old-field sites were highly correlated, and hence H3 was not supported. This latter result is the first, to our knowledge, of P. maniculatus coexisting in a similar pattern of population fluctuations with a Microtus species in a mainland grassland habitat. Higher than average precipitation in the year preceding a peak population of deer mice may have enhanced herbaceous vegetation and contributed to population increases in both habitats. We conclude that the old-field habitat associated with this agricultural setting provides optimum habitat for P. maniculatus and facilitates multiannual population fluctuations in this species.

1. Introduction

The ecological zones of semiarid intermontane grasslands and shrub-steppe rangelands extend from the northwestern United States (US) into southern British Columbia (BC), Canada, and constitute a major part of the interior Pacific Northwest of North America (PNW). In the semiarid Okanagan and Similkameen valleys of southern BC, perennial grassland habitats are often a mixture of native bluebunch wheatgrass (Agropyron spicatum), Idaho fescue (Festuca idahoensis), rough fescue (F. scabrella), needle and thread grass (Hesperostipa comata), and big sagebrush (Artemisia tridentata). There is less than 10% of the semiarid intermontane grassland in the PNW that has not suffered some degree of habitat loss owing to agricultural (including cattle grazing), urban, and recreational developments [1,2,3].
However, there are many abandoned croplands such as forage fields and orchards that are in various states of recovery after abandonment and these habitats constitute “old-fields”; often situated within or near active agricultural settings. Old-field and native bunchgrass–sagebrush habitats had the highest mean species richness and diversity in terrestrial small mammals within a mosaic of various tree fruit orchards, vineyards, hedgerows, riparian zones, and ponderosa pine (Pinus ponderosa) forest in the southern Okanagan Valley of BC [4]. Thus, within these landscapes of agricultural settings, we suggest that old-fields and bunchgrass–sagebrush may be optimum habitats for at least some species of small mammals.
The deer mouse (Peromyscus maniculatus) is a major small mammal species that occurs in a wide variety of forest, shrub, and grassland habitats [5,6,7]. In semiarid regions, this species occupies perennial grassland habitats that include old-fields, native bunchgrass–sagebrush, ponderosa pine (Pinus ponderosa) forest, and tree fruit orchards [3,4,8]. In grassland and sagebrush habitats P. maniculatus feed on a wide range of plant and plant products including grass seeds, arthropods, and occasionally berries when shrubs are present [3,9,10,11].
The white-footed mouse (P. leucopus) is sympatric with P. maniculatus occupying deciduous hardwood forests, shrubby fields, hedgerows, and croplands in the midwestern and northeastern US [12]. In general, Peromyscus populations show a seasonal change in abundance with low breeding densities in spring and moderate densities through the fall and winter with similar patterns of abundance from year to year [13,14,15,16,17,18]. A long-term (26-year) trapping program of P. maniculatus in coniferous forest of southern BC showed dramatic declines in numbers overwinter with moderate density ranges of mice per ha as high as 8 to 13 in autumn and as low as 2 to 3 in the following spring [19]. This pattern of low annual variation in population density was similar to those of long-term (17-year) studies in the Yukon (10–15/ha) and southern Alberta (5–15/ha), Canada [20,21]. These generally low densities and occasional short-term extirpations reported for forest populations of P. maniculatus were caused by breeding season declines leading to poorer survival in summer than winter [19]. In addition, very few (5% to 12%) of young-of-the-year mice bred and 69% of adult females were lactating with 51% having just one litter. Young deer mice not breeding in their first year was also recorded in other northern and alpine environments [21,22,23]. A long-term decline in P. maniculatus to very low numbers < 5 mice/ha over a 20-year period was reported in the Yukon [24,25]. Thus, at least in these forest ecosystems, habitat quality seems to be marginal most of the time for P. maniculatus and constrains their productivity.
The consistent annual abundance patterns of P. maniculatus suggest that multiannual population changes are rare. However, some Peromyscus populations do seem to have multiannual or irregular fluctuations in abundance associated with large crops of coniferous seed or deciduous mast in forested ecosystems [19,26,27,28,29,30,31,32,33]. Increased survival in the winter after a substantial seed or mast crop and enhanced reproduction in the following summer seem to be the variables driving population increases in these Peromyscus populations. In all of these studies, there was one or more years of irruptive populations presumably owing to the substantial surplus in natural foods. Temporary irruptions of P. leucopus populations in woodlots were discussed in [34]. In terms of multiannual fluctuations, spectral analysis of long-term population data showed P. maniculatus to have periodicities of 3.5 years in perennial grassland in Kansas [35], 5.0 years in coniferous forest in BC [19], and 3 to 4 years on Santa Barbara Island in California [36].
Thus, we ask if optimum habitat in perennial grasslands, both natural and old-field, may provide conditions to generate multiannual population fluctuations via extended breeding seasons and enhanced reproduction of adults and young-of-the-year. In habitats with extended breeding seasons, multiple sampling periods are essential to capture the relevant seasonal changes in reproduction, abundance, and socially induced territorial spring reorganization [37]. A reorganization event within populations of P. maniculatus at the start of some breeding seasons seems to be based on juvenile mice being forced out of a given habitat by competitive interactions with aggressive adult mice [38,39,40].
Peromyscus commonly occur with Microtus in old-fields and other perennial grassland habitats [3,41,42,43,44]. Authors of [5] originally noted that Peromyscus are usually secondary to Microtus in perennial grasslands of north temperate and boreal ecological zones. In at least some situations, voles are competitively dominant to deer mice and may exclude them from perennial grassland sites that would appear to be optimal habitat for P. maniculatus [41,45,46,47,48,49,50]. However, in forested study areas, the meadow vole (M. pennsylvanicus) and red-backed vole (Clethrionomys) seemed to have no effect on abundance of deer mice [23,51,52]. Long-term monitoring of population changes of montane voles (M. montanus) in old-fields indicated occasional multiannual fluctuations of 3–4 years with breeding occurring in both summer and winter [53]. P. maniculatus also occurred in these grassland sites and there may be competitive interactions between these two species.
We report on a 17-year data set (1982–2003), with multiple sampling periods each summer and winter, of changes in abundance and demography of P. maniculatus in old-field grassland and bunchgrass–sagebrush habitats in southern BC. Our objective was to provide a description of demographic changes and evaluate three separate hypotheses (H) that may explain those changes: (H1) deer mouse populations will have multiannual fluctuations in abundance driven by population increases from an extended breeding season in summer and winter; (H2) if optimum habitat, spring reorganization events will be relaxed in some years leading to higher overall recruitment and survival; and (H3) interspecific competition between deer mice and montane voles will cause deer mice to be lower in density when voles are higher. A third objective was to compare abundance and demography of deer mice in remnant natural bunchgrass–sagebrush habitat with those in perennial old-field grasslands during 9 of the 13 years when there were adequate data.

2. Materials and Methods
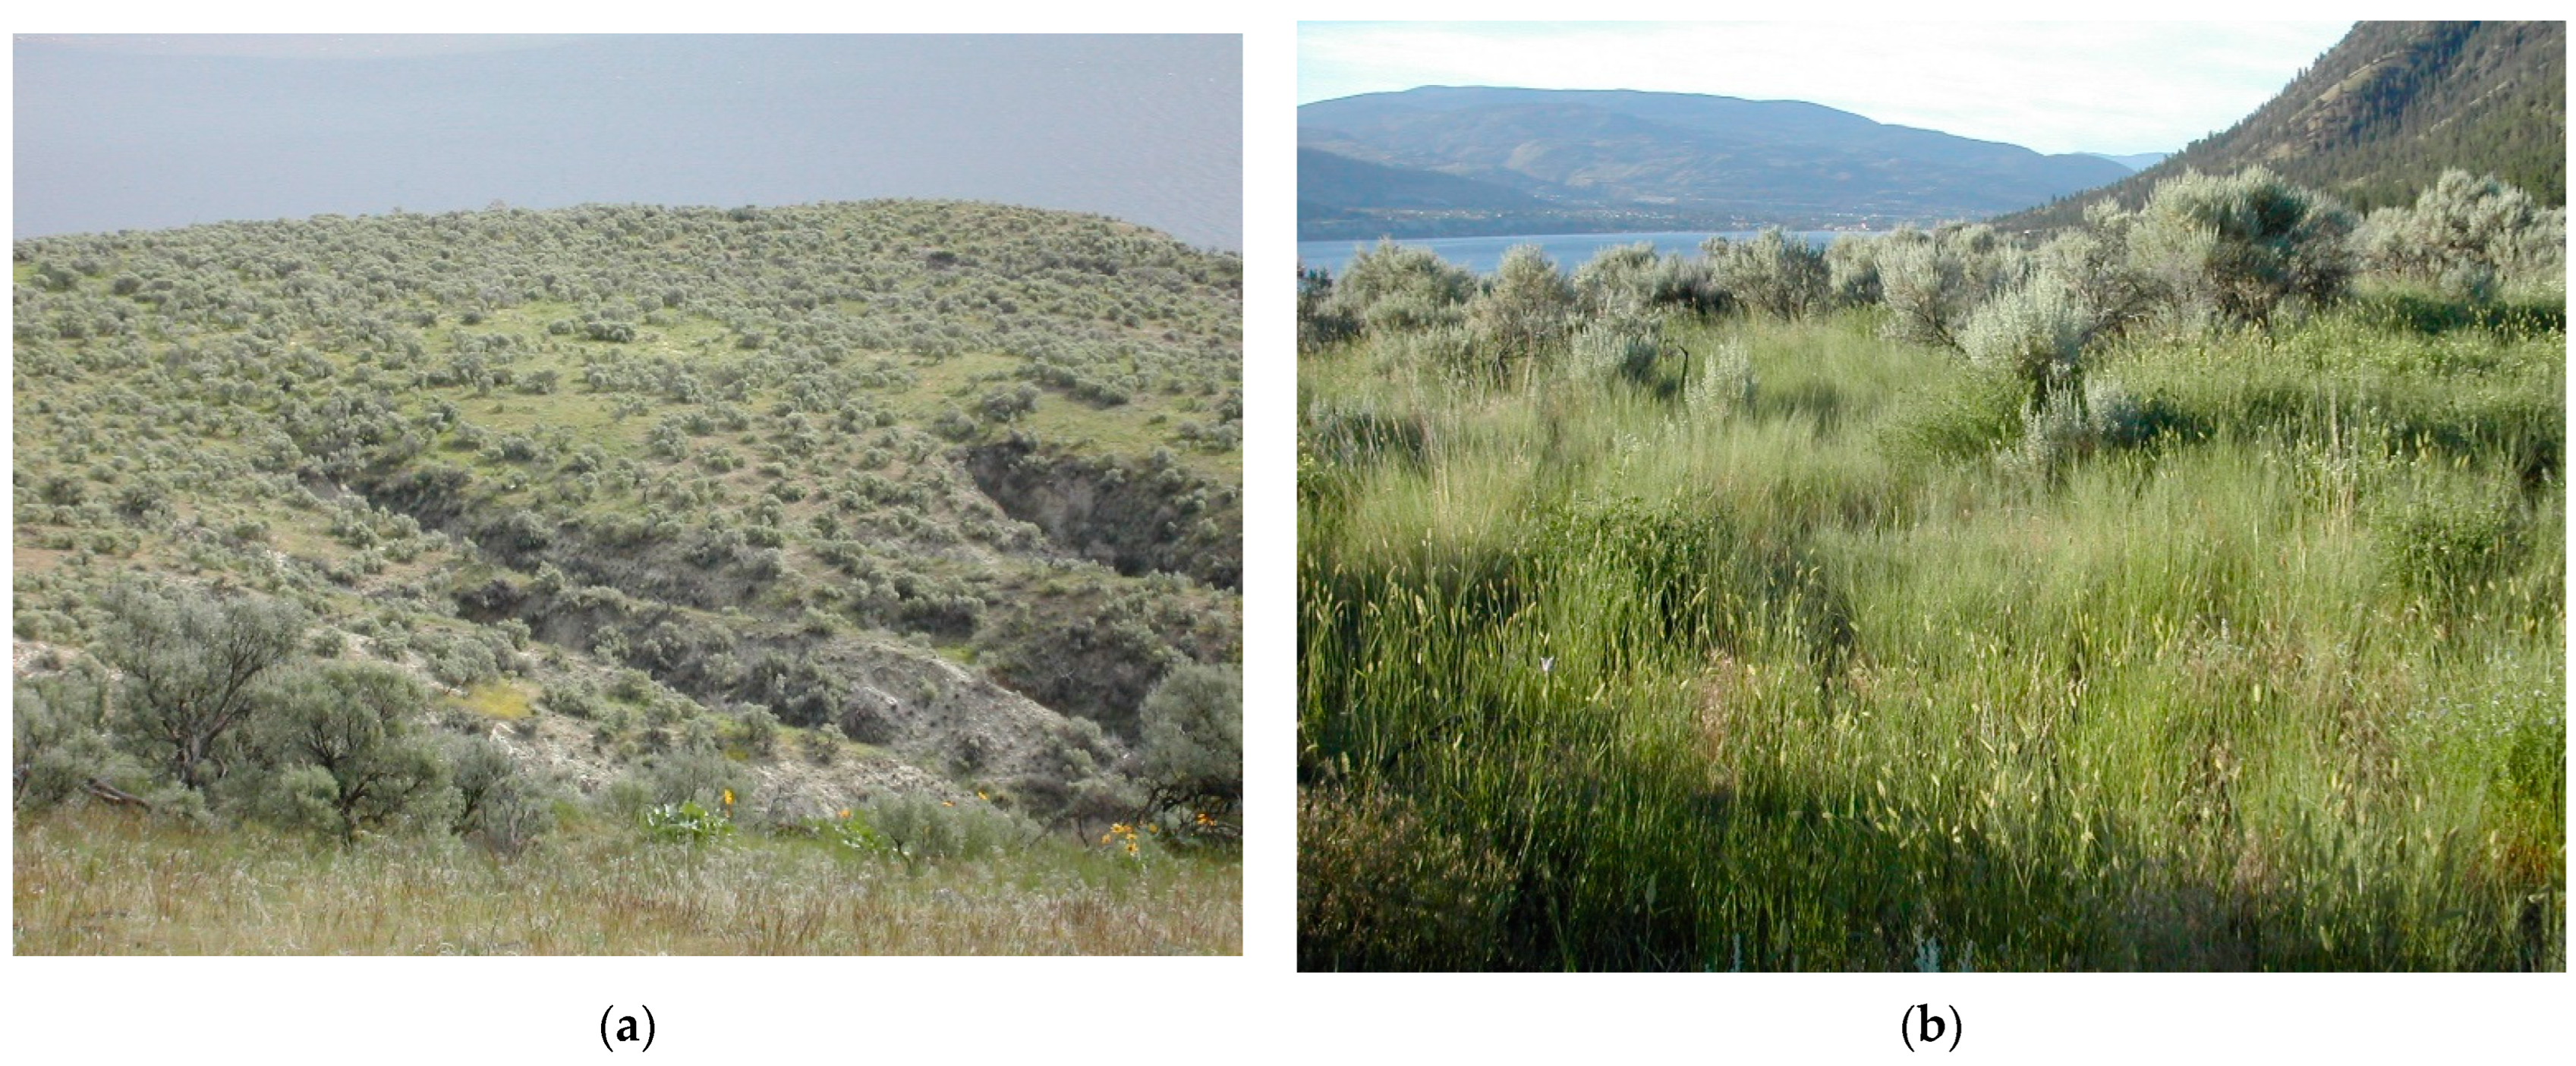
2.1. Study Area

Our study was located in the Okanagan Valley near Summerland BC (49°34′ N; 119°40′ W) in perennial old-field grasslands and bunchgrass–sagebrush habitats at an elevation range of 400–464 m and similar soil profiles. These sites were within a 400 ha mosaic of tree fruit orchards, vineyards, big sagebrush, rabbit brush (Chrysothamnus nauseosus), bluebunch wheatgrass, balsamroot (Balsamorhiza sagittata), and ponderosa pine forest (Figure 1). All study sites were located in the Bunchgrass biogeoclimatic zone [54]. The climate is characterized by warm to hot–dry summers and moderately cold winters with little snowfall. June and November are the wettest months with the driest months in September and October. The range between high and low mean monthly temperatures is 23–27 °C with mean (± SE) annual precipitation of 339.7 ± 14.0 mm during the 1980 to 2003 period. Summer drought is the primary factor promoting the development of graminoid vegetation [54]. The old-fields were perennial hay fields abandoned about 25 years ago prior to the start of our trapping (Figure 2). Vegetation was dominated by several forage and other introduced grass and forb species. These sites were each 2–3 ha in area.
Starting in June 1982, we set up trapping grids in 2 or 3 replicate old-field sites to investigate the dynamics of P. maniculatus populations. The sites were separated by a mean (±SE) distance of 0.48 ± 0.17 km (range of 0.15–1.20 km) and there were few movements of mice among sites. At the same time, a single trapping grid was installed in a native bunchgrass–sagebrush (hereafter “grass–sagebrush”) site with two additional grids added through time (Figure 3a,b). These sites were natural habitats that were relatively undisturbed, except for some grazing by feral horses. Vegetation in the grass–sagebrush sites had a similar species composition to that of the old-fields with the addition of six-week fescue (Vulpia octoflora), common yarrow (Achillea millefolium), and Saskatoon berry (Amelanchier alnifolia). These replicate sites were each 5–6 ha in area and were spatially segregated (0.20–0.62 km apart) to enhance statistical and biological independence [55]. Again, there were few movements of mice among sites.

2.2. Deer Mouse Populations

In the old-field sites, deer mouse populations were live-trapped at 3- to 4-week intervals annually during summer (March to October) and at 4- to 8-week intervals during winter (November to February) from 1982 to 1987 and 1993 to 2003. Sampling was not carried out during winter 1986–1987, summer 1995, winter 1995–1996, summer 1998, and winters 1998–1999, 1999–2000, and 2000–2001. In the native grass–sagebrush sites, deer mouse populations were live-trapped from 1982 to 1986, 1997, and 1999 to 2003 on the same schedule as the old-field sites.
A trapping grid (1 ha) had 49 (7 × 7) trap stations at 14.3 m intervals with one Longworth live-trap permanently located at each station; additional live-traps were added during high populations. Traps were supplied with whole oats and carrot, cotton as bedding, and plywood covers. In winter, snow conditions necessitated the use of trap chimneys [56]. The trapping regime and processing of animals followed that of [53,57]. All handling of animals followed guidelines approved by the American Society of Mammalogists [58] and the Animal Care Committee, University of British Columbia. Seasons were defined as summer (March to October) when most breeding mice were captured and winter (November to February) when few breeding mice were captured. Thus, there were 13 summer and 11 winter periods in the old-field sites and 9 summers and 7 winters in the grass–sagebrush sites that each had at least three trapping sessions.

2.3. Population Data Analyses

Abundance estimates of deer mice were derived from the Jolly–Seber (J–S) stochastic model for open populations with small sample size corrections [59,60]. We calculated the effective trapped area (ETA) for P. maniculatus on each grid based on mean maximum distance moved (MMDM) as a boundary strip method [61]. Estimates of population size were converted to a density estimate by dividing population estimates for each trapping period by the overall mean (±SE) ETA (ha), which was 1.37 (±0.04) in the old-field sites and 1.34 (±0.04) in the grass–sagebrush sites. We consider this estimate to be a “density index” [61]. Jolly trappability was calculated according to [62].
Reproduction and survival measurements followed those of [33,53,57].

2.4. Statistical Analyses

Mean values and 95% confidence intervals were calculated for all demographic parameters to compare high and low years for P. maniculatus populations for 13 of 21 years in the old-field sites and for 9 of 21 years in grass–sagebrush sites from 1982 to 2003. Linear regression analysis was used to determine the influence of mean annual abundance and peak abundance of montane voles on comparable estimates for deer mice in the old-field sites during the 13 years when there were adequate data. Similarly, this regression analysis compared mean annual abundance of deer mice in old-field and grass–sagebrush sites for the 9 years when there were adequate data. In all analyses, the level of significance was at p = 0.05 [63].

3. Results

We conducted 157 trapping periods (40,670 trap nights) and 106 trapping periods (19,404 trap nights) on sampling grids in the old-field and grass–sagebrush sites, respectively, from June 1982 to March 2003. The total number of individual P. maniculatus captured was 3232. Other small mammal species regularly captured were montane voles and western harvest mice (Reithrodontomys megalotus). Occasional captures included northwestern chipmunks (Neotamias amoenus), long-tailed voles (M. longicaudus), Great Basin pocket mice (Perognathus parvus), and vagrant shrews (Sorex vagrans). Overall mean (±SE) J–S trappability (likelihood of capture on any given trap-night) estimate of P. maniculatus was 61.7% ± 3.1 in the old-field and 63.4% ± 4.8 in the grass–sagebrush sites.

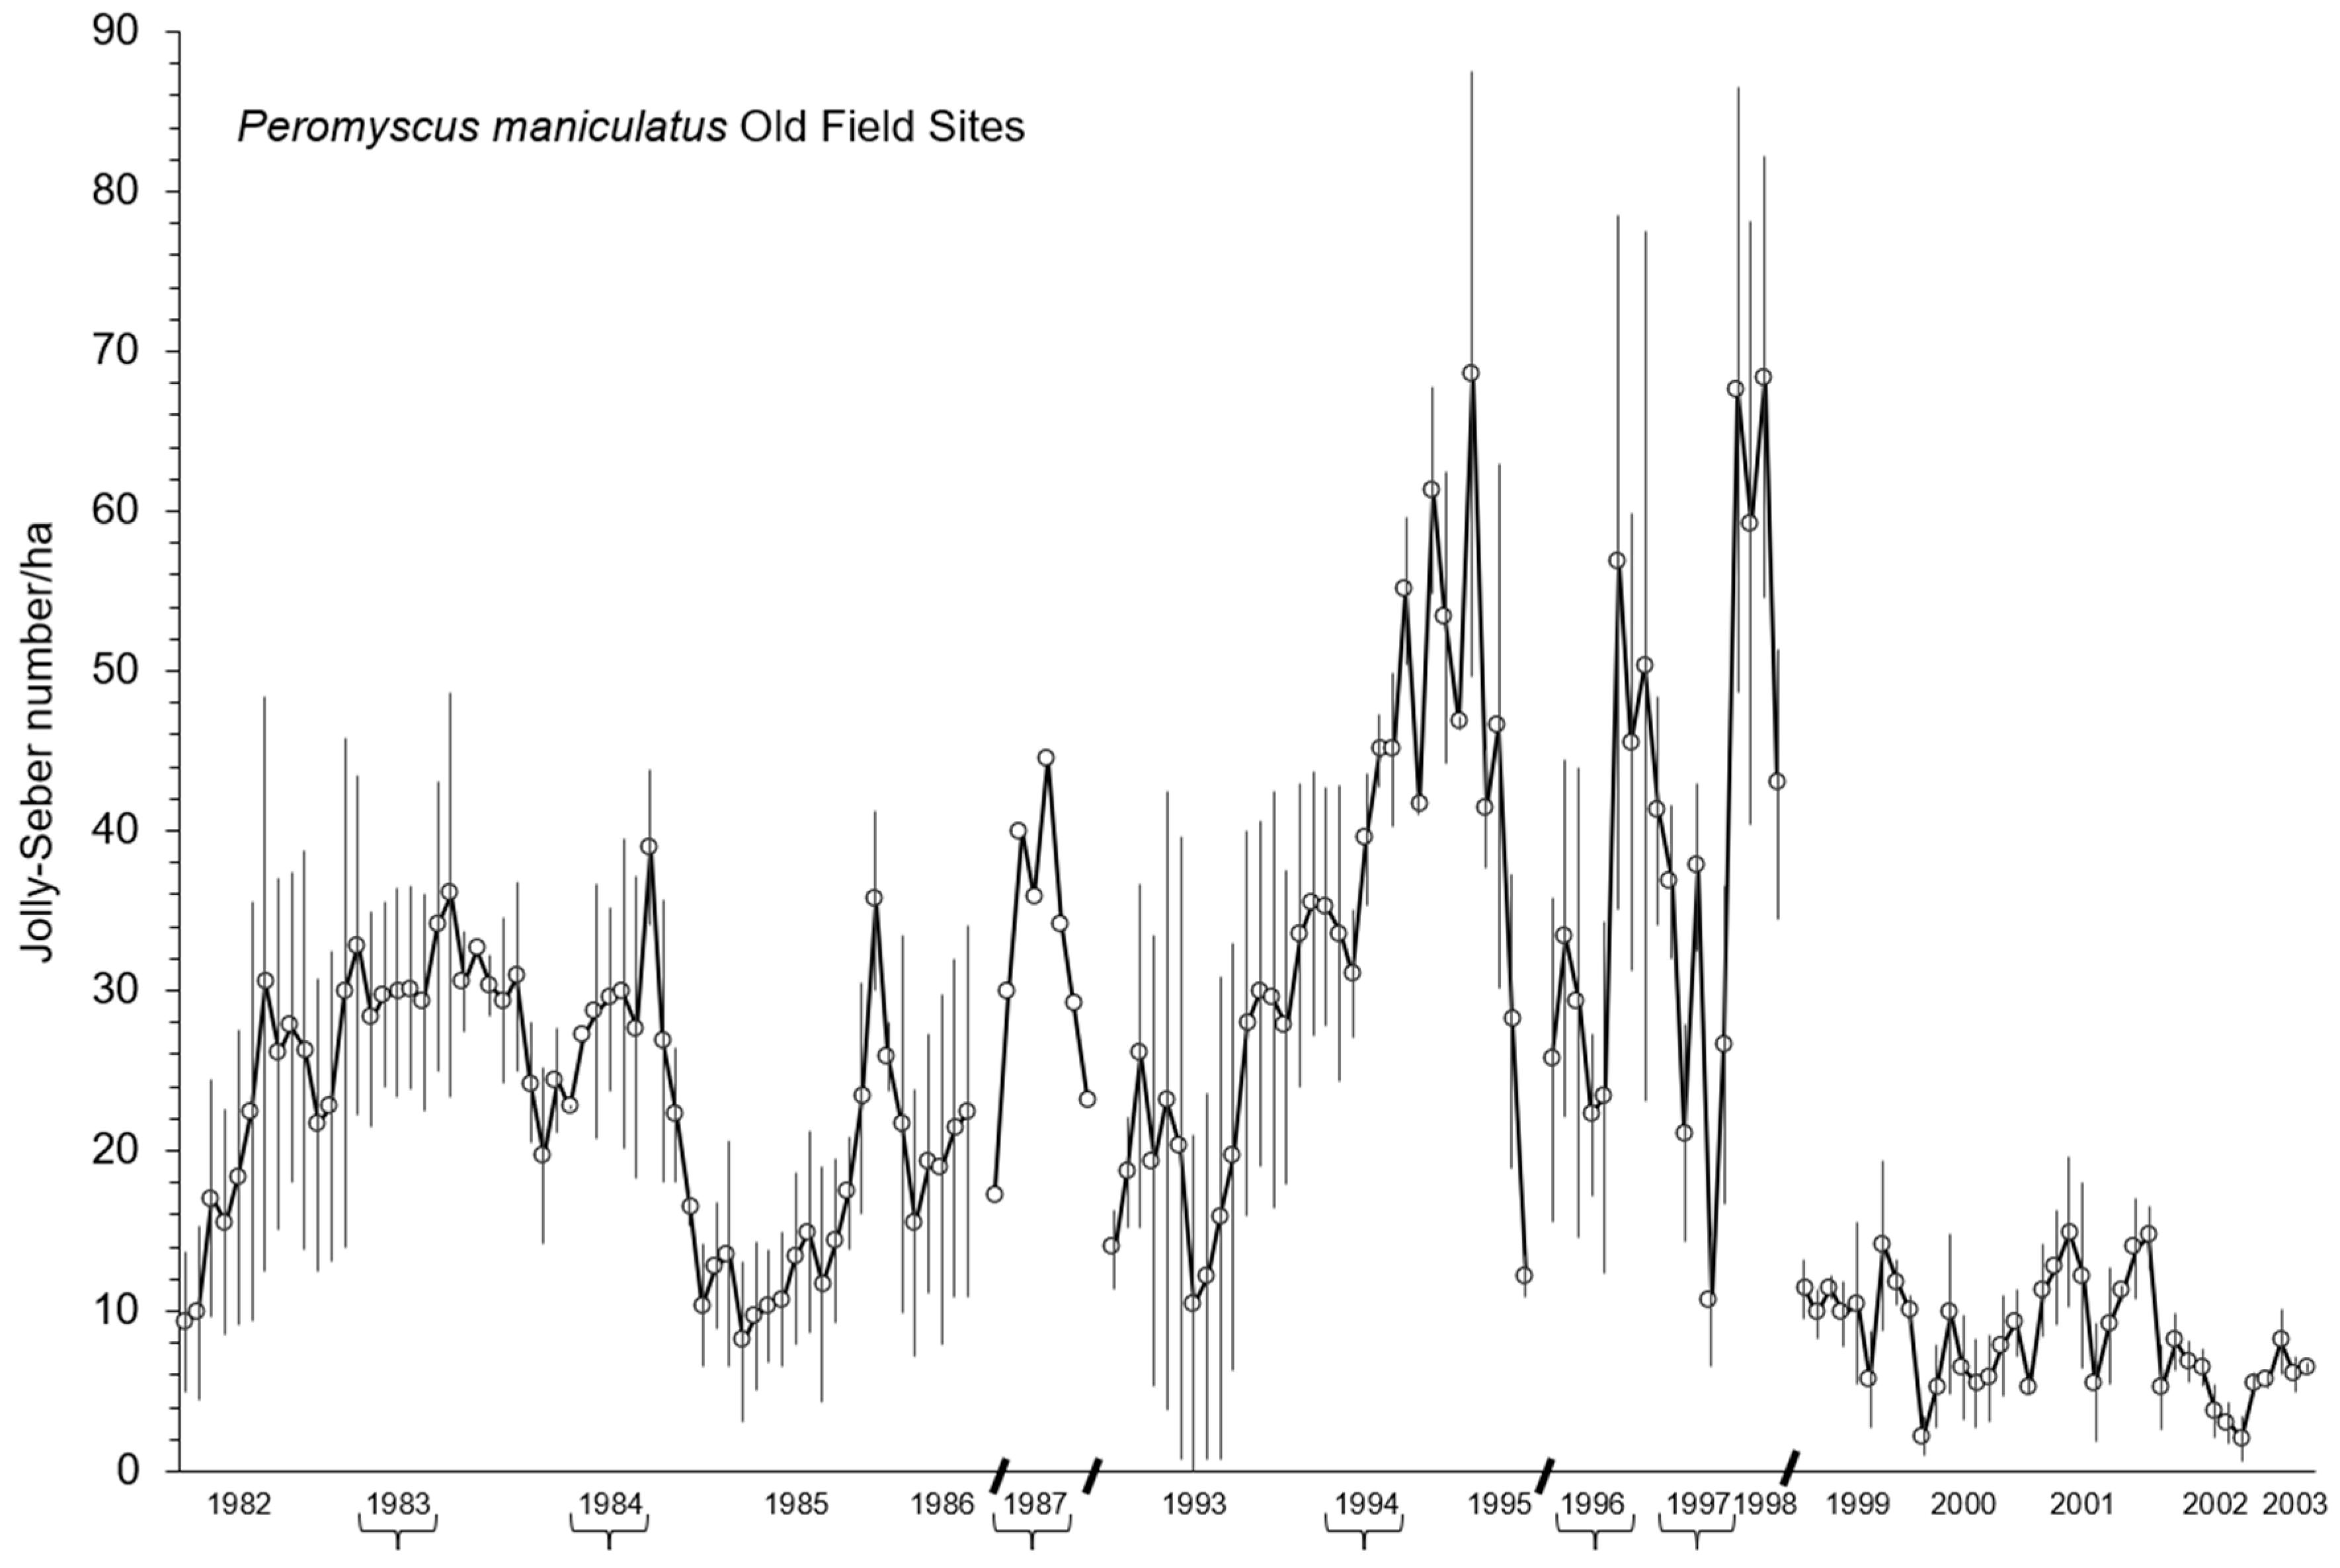
3.1. Population Changes in Old-Field Sites

In terms of identifiable phases of multiannual population fluctuations of P. maniculatus in the old-field sites, when data were available for annual peak numbers for autumn-early winter (e.g., September–December) for 13 of 21 years, there were 6 years (1983, 1984, 1987, 1994, 1996, and 1997) of high “peak” numbers and 7 years (1982, 1985, 1993, and 1999–2002) of “low” numbers (Figure 4). Deer mice reached estimated mean (± SE) peak numbers per ha of 52.1 ± 5.8 animals in high years and 19.9 ± 4.5 in low years (Table 1). Mean (±SE) annual abundance per ha was 33.9 ± 2.6 in high years and 12.8 ± 2.3 in low years, declining to lowest abundance of 18.3 ± 2.8 and 6.7 ± 1.1 in high and low years, respectively (Table 1). All of these estimates had nonoverlapping 95% CIs that indicated a significant difference in mean abundance of P. maniculatus between periods of high and low numbers.
Deer mouse mean numbers increased or remained similar from fall (e.g., end of breeding season) to the next spring in only 3 of 13 overwinter periods (1993–1994, 1997–1998, and 2002–2003); otherwise, there were dramatic overwinter declines in all other years (Figure 4). In 9 of 13 breeding seasons, mean abundance in early spring declined by an overall 18.2 ± 4.7% ranging from 16.7 ± 6.0% in the low years to 20.5 ± 8.3% in the high years (Table 1). In 12 breeding seasons, mean abundance in midsummer (July–August) declined by an overall 25.7 ± 5.3%, ranging from 13.7 ± 4.4% in the high years to 34.3 ± 7.0% in the low years (Table 1).

3.2. Population Changes in Grass–Sagebrush Sites

Where data were available in the grass–sagebrush sites, there were the same “peak” years in 1983, 1984, and 1997 and the same six “low” years in 1982, 1985, 1999, 2000, 2001, and 2002 (Figure 5). P. maniculatus reached estimated mean (± SE) peak numbers per ha of 32.0 ± 2.3 animals in high years and 21.7 ± 3.9 in low years (Table 2). Mean (± SE) annual abundance per ha was 22.8 ± 0.5 in high years and 10.8 ± 1.7 in low years, declining to lowest abundance of 10.3 ± 3.3 and 4.4 ± 1.5 in high and low years, respectively (Table 2). The mean annual abundance of P. maniculatus had nonoverlapping 95% CIs, thereby indicating a significant difference between periods of high and low numbers.
In the grass–sagebrush sites, deer mouse numbers declined from fall (e.g., end of breeding season) to the next spring in all four winters 1982–1983 to 1985–1986. However, mean abundance then remained similar or increased in the four overwinter periods 1999–2000 to 2002–2003 (Figure 5). In 5 of 9 breeding seasons, mean (±SE) abundance in early spring declined by an overall 11.1 ± 4.2% ranging from 13.7 ± 5.0% in the low years to 2.3 ± 2.3% in the high years (Table 2). In 9 breeding seasons, mean (±SE) abundance in midsummer (July–August) declined by an overall 48.2 ± 9.0% ranging from 33.4 ± 9.7% in the high years to 55.5 ± 12.0% in the low years (Table 2).
Although spectral analysis was not possible with the interrupted timeseries of population numbers, evaluation of observed changes in mean annual abundance suggested a 3- to 4-year cyclic fluctuation of deer mice in these perennial grassland sites (Figure 6). Mean annual abundance of P. maniculatus in old-field and grass-sagebrush sites were positively and significantly correlated (linear regression; R2 = 0.59; p = 0.02).

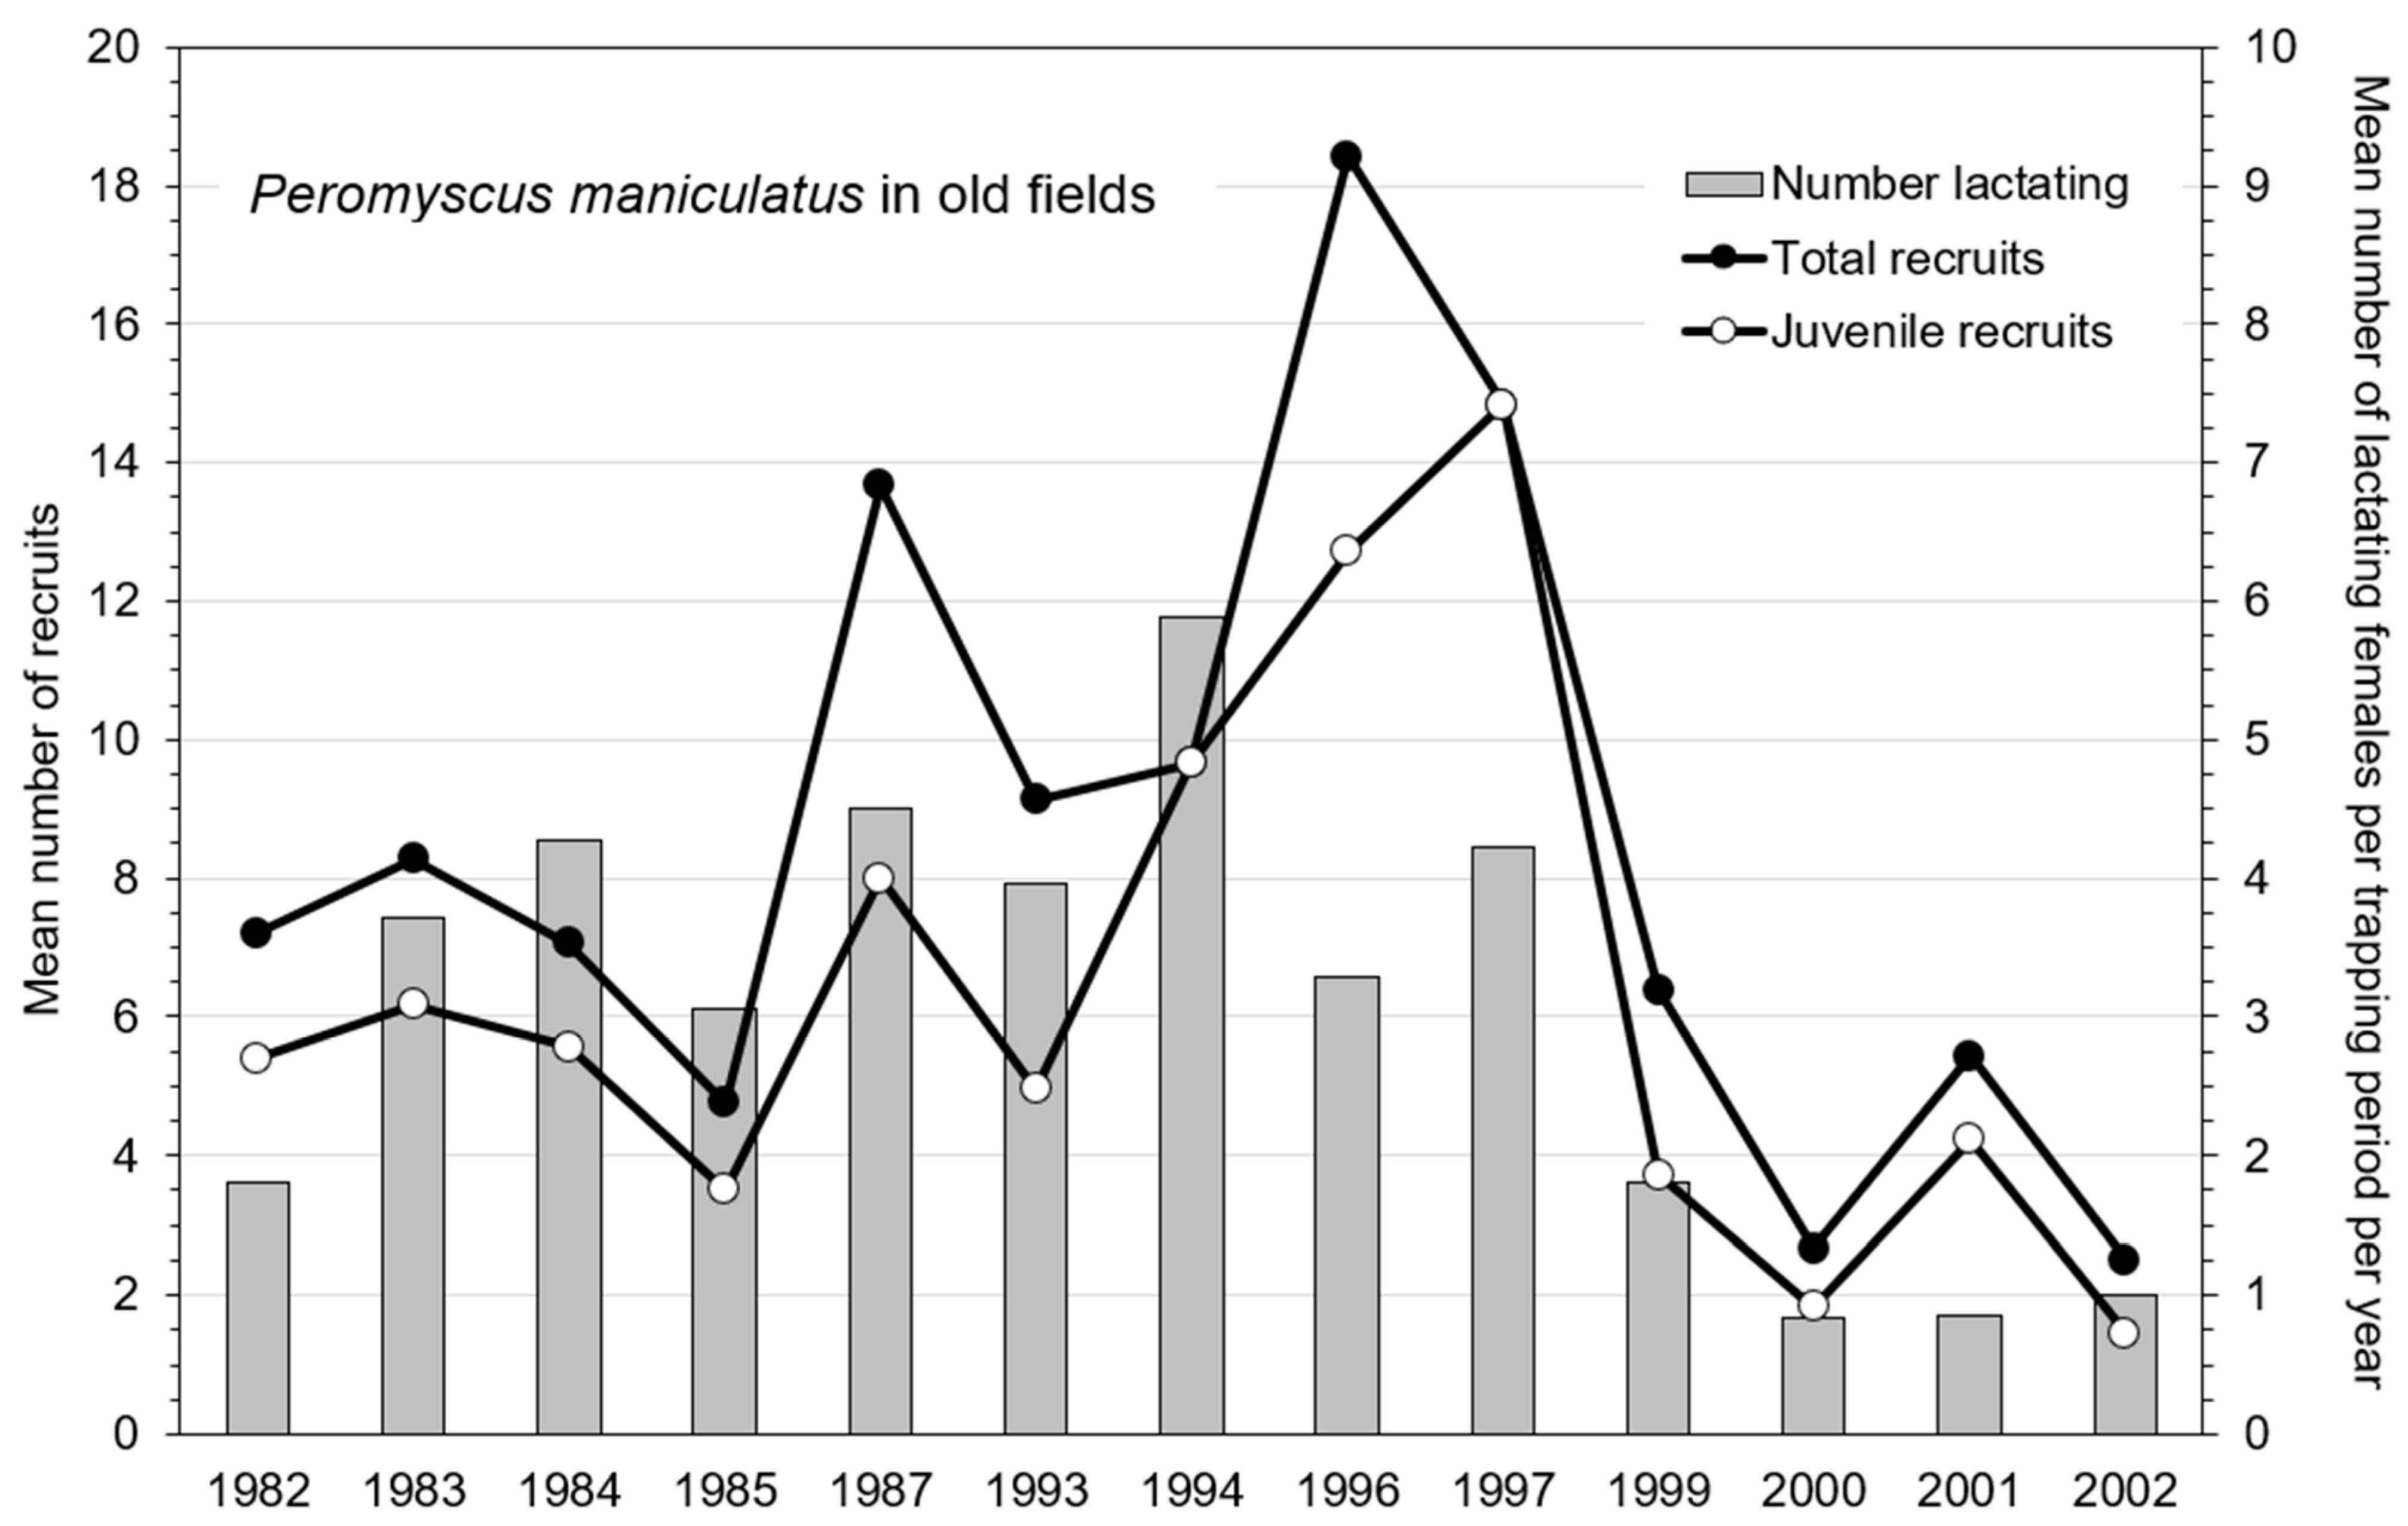
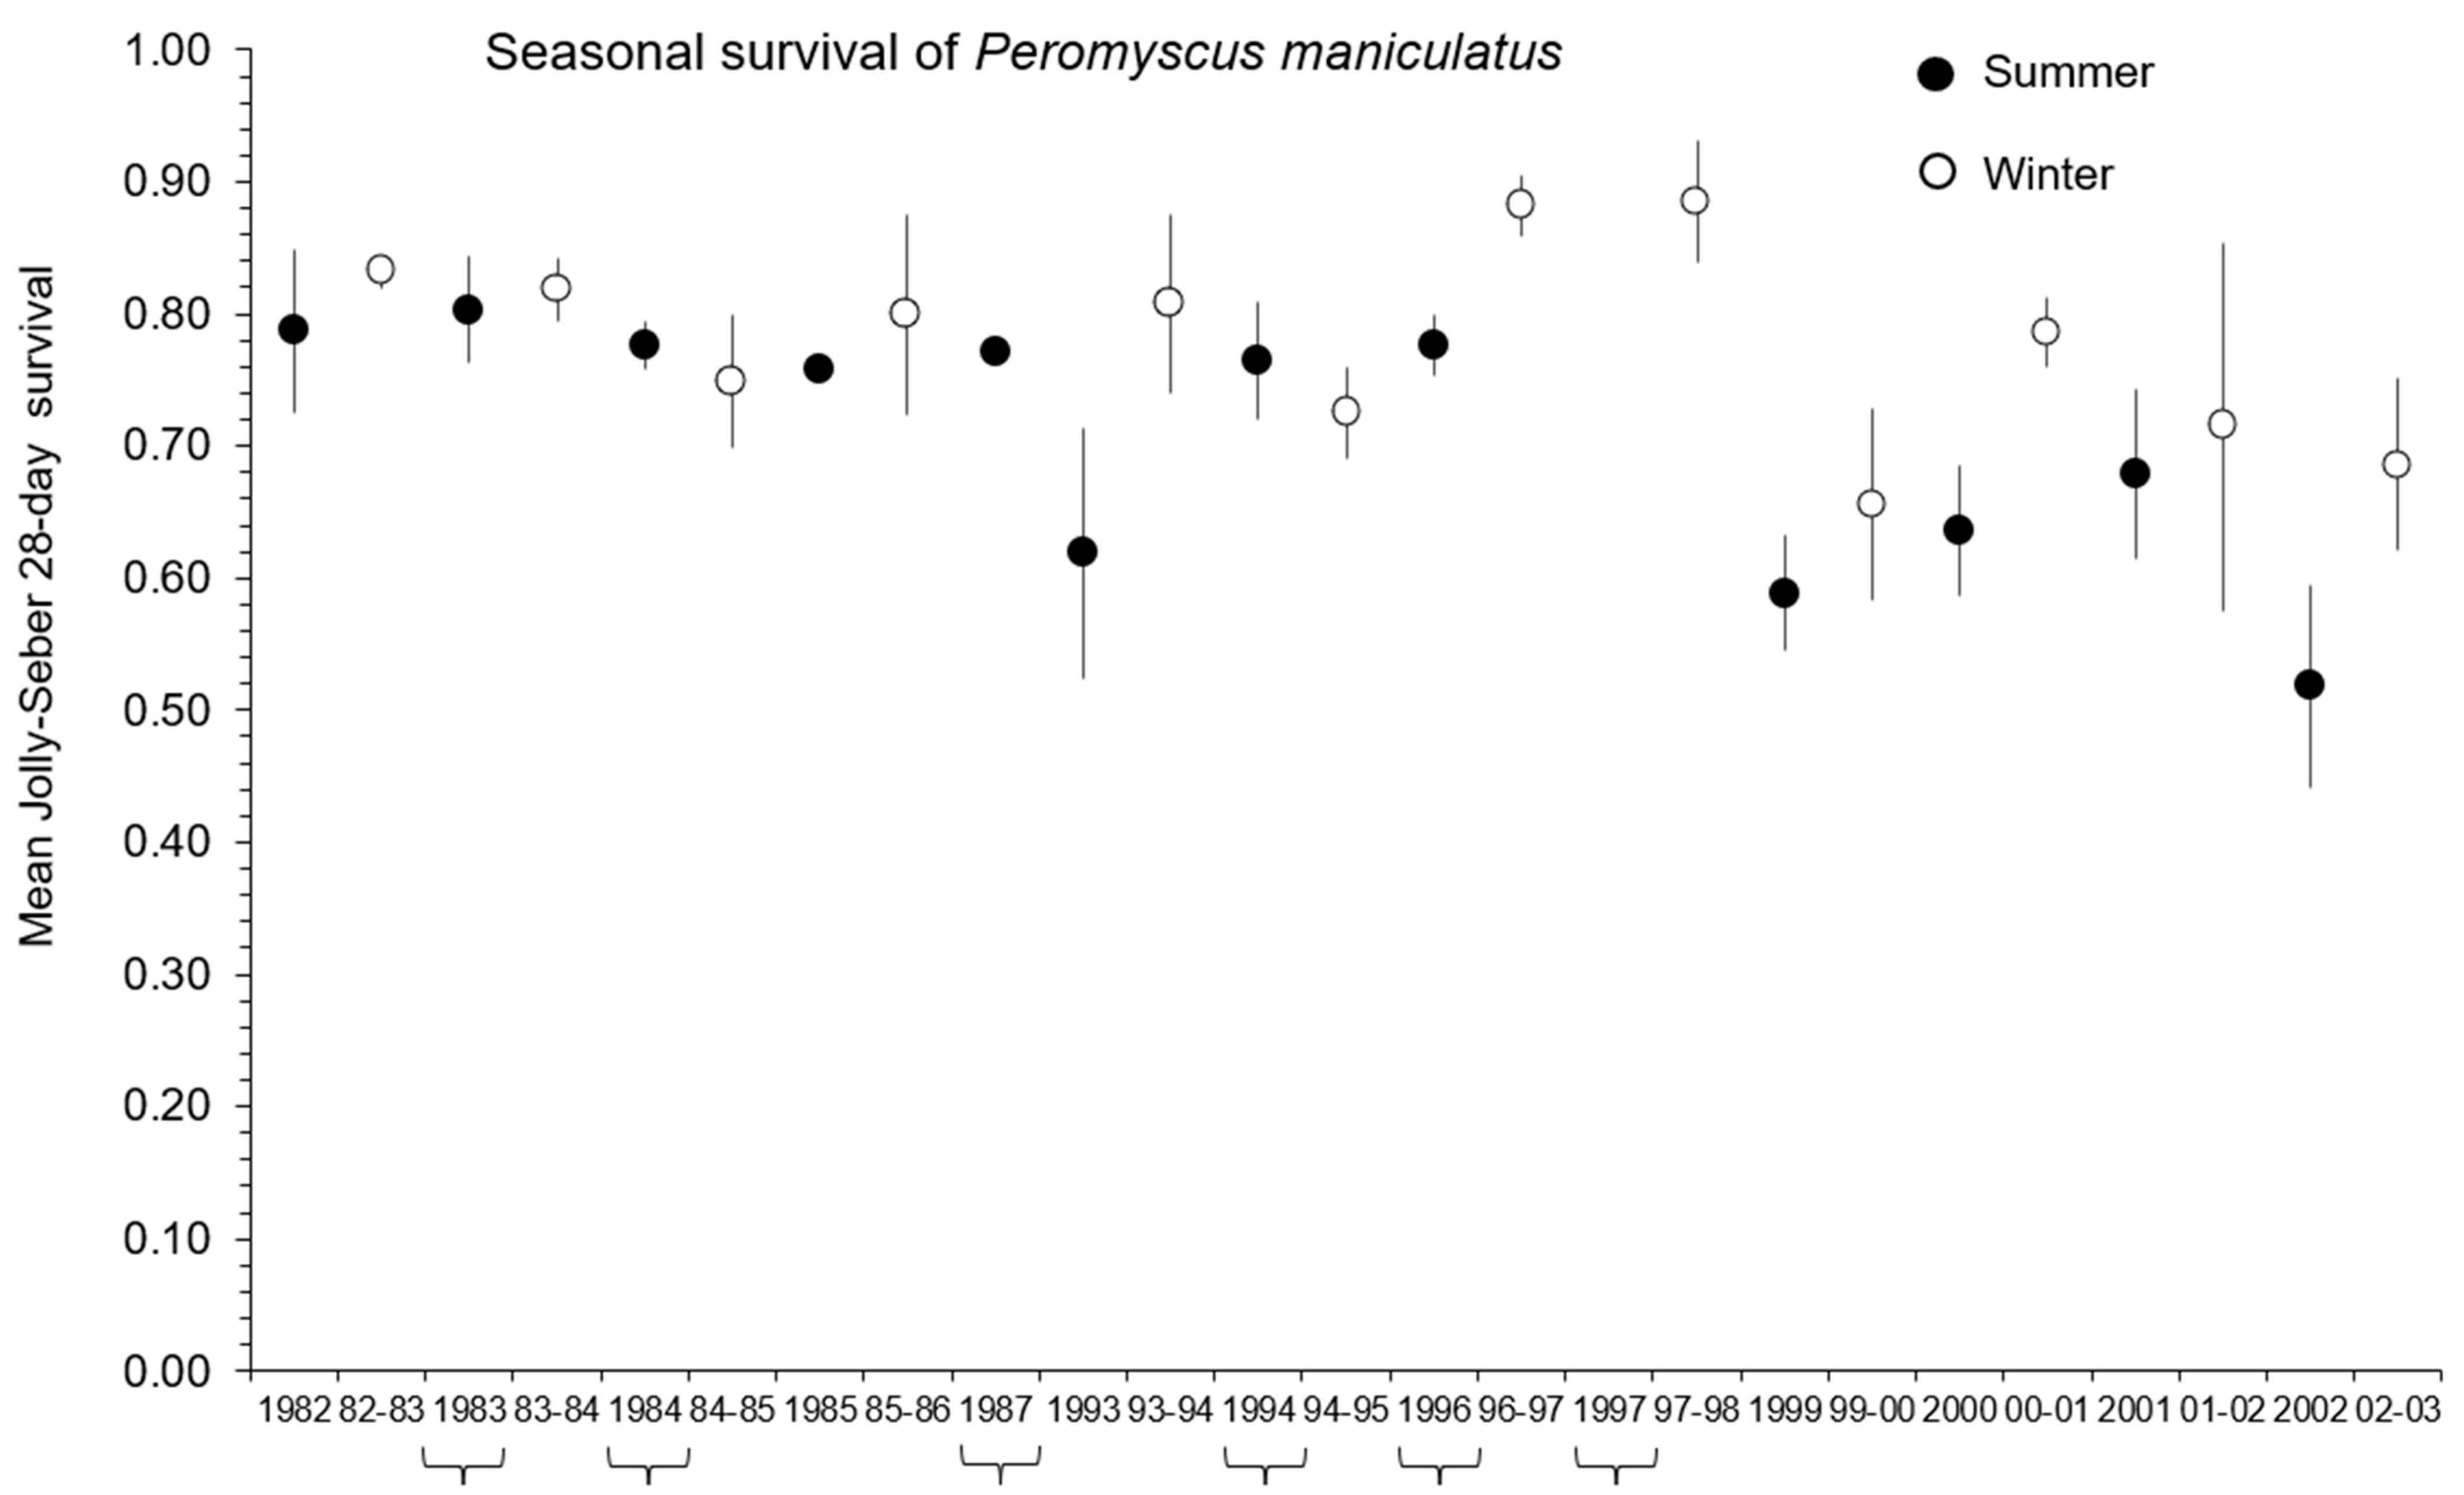
3.3. Demographic Responses in Old-Field Sites

Length of breeding season, mean number of lactating females (successful pregnancies), and mean number of recruits per trapping period per year provided a measure of reproductive performance of P. maniculatus (Table 1). Mean length of breeding season was similar between low and high years ranging from 23 to 25.5 weeks. In the years where we had complete overwinter samples, breeding began in January or February in 6 of 7 years (e.g., 1983, 1984, 1994, 1995, 1997, and 1998). In general, breeding declined somewhat in July and August, often to cessation by September. Overall, of 27 deer mouse populations (grids), breeding in midsummer declined in 7 of 9 (77.7%) and 11 of 18 (61.1%) in high and low years, respectively (Table 1).
Mean (±SE) number of lactating females per trapping period per year in the high years was 2.3 times higher (4.3 ± 0.4) (nonoverlapping 95% CIs) than in the low years (1.9 ± 0.5) (Table 1; Figure 7). Mean numbers of total and juvenile recruits of deer mice per trapping period per year were 2.1 to 2.2 times greater in high than in low years (Table 1; Figure 7). However, the mean (±SE) index of early juvenile productivity (surviving young per female) was similar in high (2.29 ± 0.29) and low (2.66 ± 0.25) years (Table 1; Figure 8). Mean percentages of young-of-the-year deer mice remaining on the grids and breeding in their first summer ranged from 41.0% (high years) to 59.0% (low years) for males (Table 1). These measurements for females were 14.0% (high years) and 29.0% (low years).
Mean (±SE) monthly Jolly–Seber summer survival was consistently higher (12%) in high (0.78 ± 0.01) than low (0.66 ± 0.03) years with nonoverlapping 95% CIs (Table 1). Mean (±SE) monthly J–S winter survival also tended to be higher in high (0.81 ± 0.03) than low (0.75 ± 0.03) years but was not statistically different (Figure 9; Table 1). Mean (±95% CIs) overall survival rates were 0.71 (0.65–0.77) for summer (n = 12) and 0.78 (0.73–0.83) for winter (n = 12).

3.4. Demographic Responses in Grass–Sagebrush Sites

Mean length of breeding season was similar in grass–sagebrush sites as in old-field sites. Breeding began in January or February in all five years where we had complete overwinter samples. Overall, of 19 deer mouse populations (grids), breeding in July–August declined to cessation in 0 of 5 (0%) high years and 12 of 14 (85.7%) low years but appeared again in September and October in some years (Table 2).
Mean (±SE) number of lactating females per trapping period per year in the high years was 2.5 times higher (3.5 ± 0.3) (nonoverlapping 95% CIs) than in the low years (1.4 ± 0.3) (Table 2). Mean numbers of total and juvenile recruits of deer mice were 2.8 to 2.9 times greater, respectively, in high than in low years. However, the mean (±SE) index of early juvenile productivity was more similar in high (1.31 ± 0.17) than low (0.95 ± 0.27) years (Table 2). Mean percentages of young-of-the-year deer mice remaining on the grids and breeding in their first summer ranged from 72.0% (high years) to 55.0% (low years) for males (Table 2). These measurements for females were 10.0% (high years) and 29.0% (low years).
Mean (±SE) monthly Jolly–Seber summer survival was consistently higher (11%) in high (0.80 ± 0.02) than low (0.69 ± 0.05) years (Table 2; Figure 9). Mean (±SE) monthly J–S winter survival was similar in high (0.82 ± 0.07) and low (0.84 ± 0.02) years (Table 2). Mean (± 95% CIs) overall survival rates were 0.73 (0.64–0.81) for summer (n = 9) and 0.83 (0.78–0.88) for winter (n = 8).

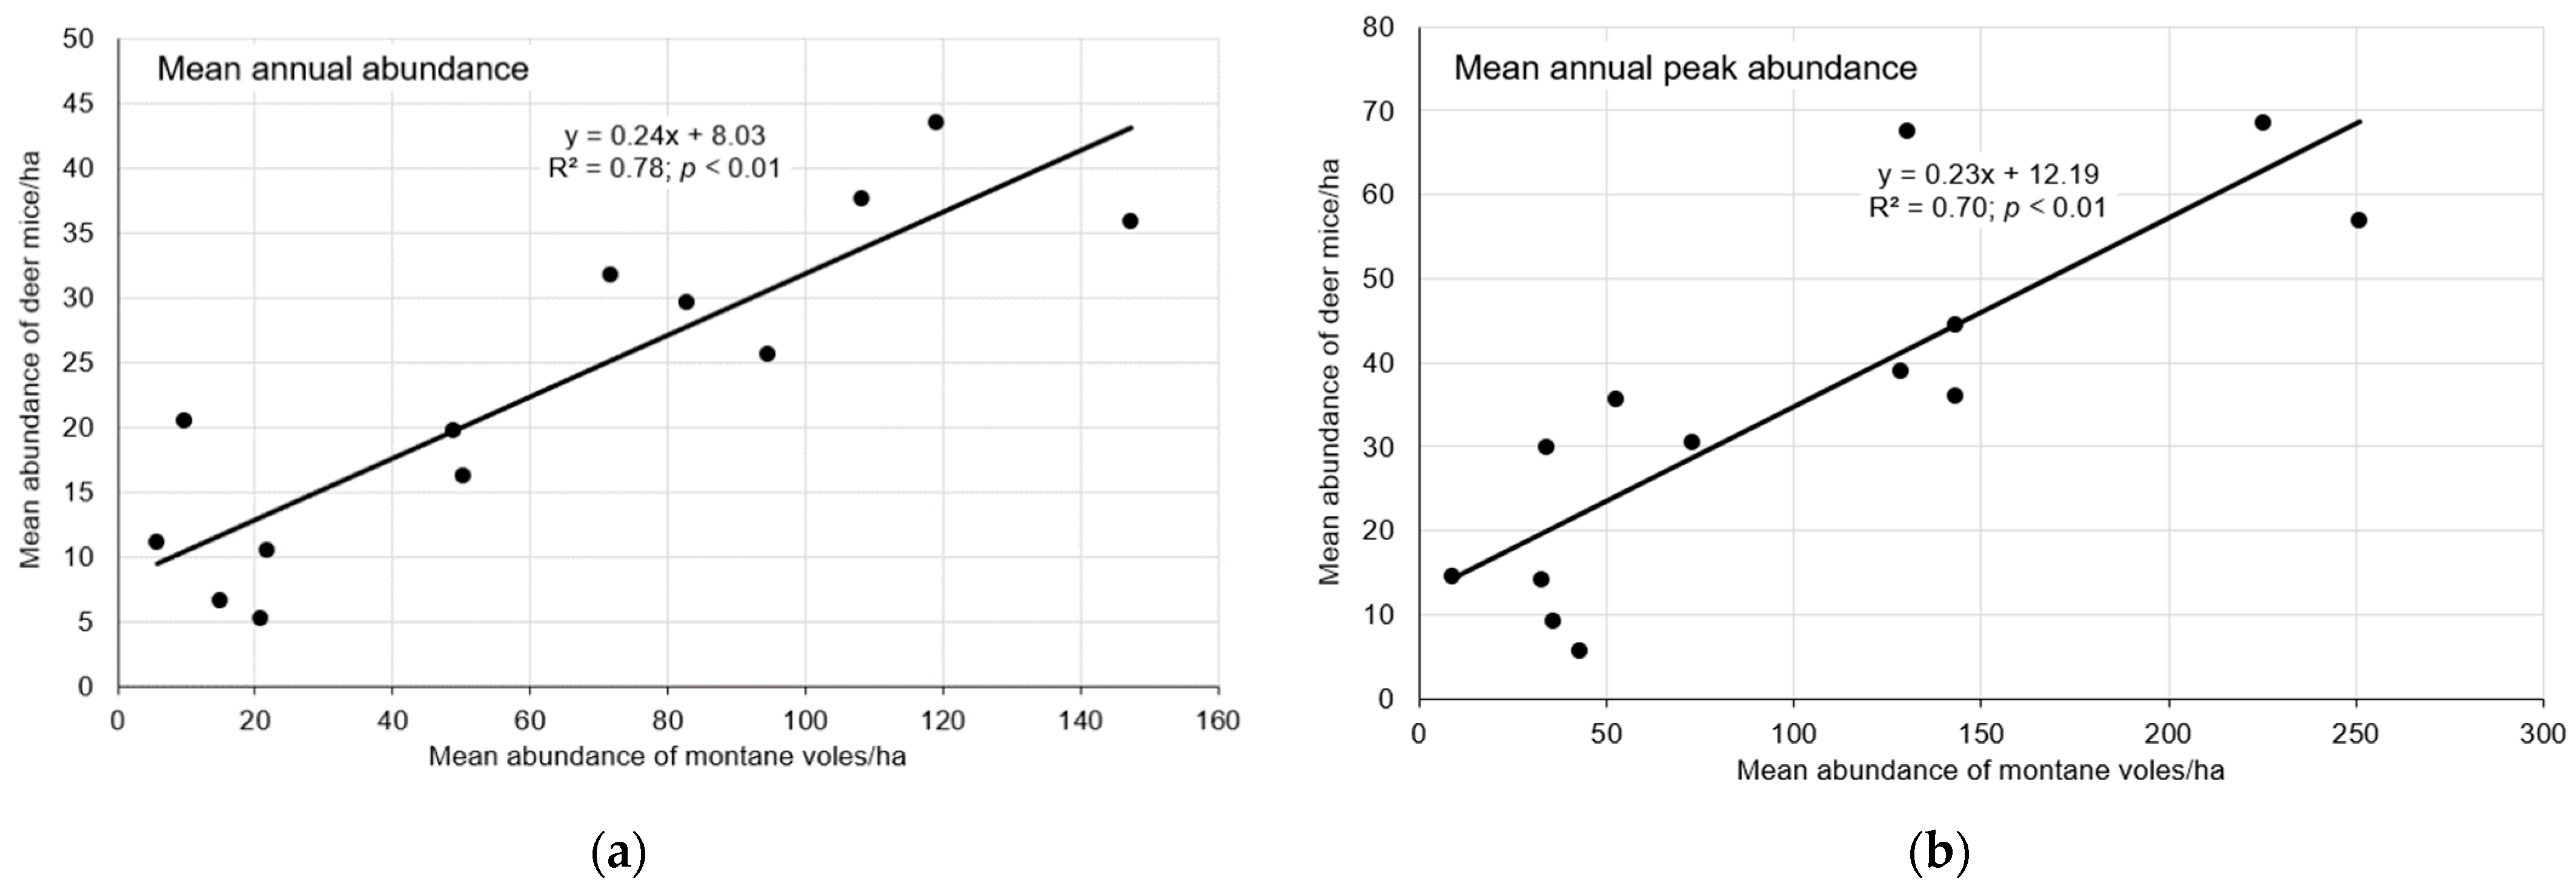
3.5. Association with Montane Voles

Mean annual abundance and mean peak abundance of P. maniculatus were positively and significantly correlated (linear regression; R2 = 0.78; p < 0.01 and R2 = 0.70; p < 0.01, respectively) with the same metrics for M. montanus (Figure 10a,b).

4. Discussion

4.1. Multiannual Population Changes

P. maniculatus populations in old-field and grass–sagebrush sites had clearly defined periods of high “peak” mean numbers (32–52/ha) and other times of low mean numbers (20–22/ha) in an intensive long-term trapping program over 21 years. Mean annual numbers per ha were as high as 34 mice in high years and as low as 7 mice in low years. Based on mean annual peak density in autumn, deer mouse populations exhibited fluctuations of 3–4 years in both old-field and grass–sage habitats, but this pattern was not always present. The greater numbers of P. maniculatus in high than low years was directly related to population increases from extended breeding seasons over both summer and winter and an increased number of lactating females. Thus, H1 that deer mouse populations will have multiannual fluctuations in abundance driven by population increases from an extended breeding season was supported.
Peak populations in our study reached 36–44 deer mice/ha in old-field sites in 1983, 1984, and 1987 with low numbers of 8–10/ha. In 1994, 1996, and 1997, peak numbers were 57–68 deer mice/ha and low numbers were 10–11 mice/ha. Overall, these fluctuations seemed to occur at 3–4 year intervals. Differences between high and low density ranged from about four- to seven-fold, which is near or within the five-fold difference between peak and low numbers characteristic of cycles [64]. Multiannual or irregular population fluctuations of P. maniculatus have been reported in forested sites with large crops of coniferous seed or deciduous mast [19,30,31,32,33,34]. However, in relatively long-term studies in perennial grassland and low herb–shrub sites without natural food supplementation, P. maniculatus had 3–4 year population fluctuations with peak numbers reaching 350/ha on Santa Barbara Island in California and 33/ha in Kansas [35,36]. Suggested explanations for increases in abundance in these population fluctuations of deer mice were winter rainfall, and consequent vegetative growth [36], and the overwhelming influence of fluctuations in abundance of the numerically dominant prairie vole (M. ochrogaster) [35].
Historically, irruptions of deer mice have been rare in those sites without natural food supplementation [65]. Irruptive events (autumn peak densities up to 44–52 mice/ha) were reported near a newly logged site in coastal coniferous forest and a 10-year-old clearcut in spruce–subalpine fir forest in northern BC [66,67]. Most other studies of changes in abundance of Peromyscus across North America have reported a similar pattern of density from year to year with only very occasional irruptions [15,16,17,18,65].

4.2. Spring and Summer Reorganization Events

A spring decline in numbers of deer mice occurred in 9 of 13 and 5 of 9 breeding seasons in the old-field and grass–sagebrush sites, respectively. However, the decline in mean abundance was comparable (16.7–20.5%) in the old-field sites and substantially less in the high (2.3%) than low (13.2%) years in the grass–sagebrush sites. Thus, H2—if the old-field is optimum habitat, then spring reorganization events would be relaxed in some years leading to higher overall recruitment and survival—was supported for recruitment, with high numbers of young-of-the-year breeding and total number of juvenile recruits, but not for survival. Proportion of young-of-the-year breeding was 1.4 and 2.1 times higher in low than high years for males and females, respectively. Overall, there were 2.3 times as many male as female young-of-the-year breeding. These values were 7.3 (males) and 2.8 (females) times higher than those recorded in coniferous forest for deer mice [19]. In terms of total survival, early juvenile productivity was low in both habitats in high and low years. In addition, mean monthly summer survival was 11–12% higher in high (0.78–0.80) than low (0.66–0.69) years in the two habitats. This difference in survival was similar to mean summer survival (0.67) reported for P. maniculatus in old-growth coniferous forest where mean abundance ranged from 2–13 mice/ha over a 26-year period [19].
Breeding season declines (i.e., spring reorganization) may arise from social strife among adult and juvenile mice that could lead to physiological changes that affect reproduction and survival of juveniles [40,68,69]. There may also be dispersal of juvenile mice into suboptimal habitat in their first year of life, owing to negative social interactions with adult mice [22,38,39,40,70]. We have no observations of a potential relaxation of agonistic interactions among adult and juvenile deer mice during these spring reorganization events. However, temporary breeding season declines in abundance of P. maniculatus in our perennial grassland sites resulted in an overall loss of 11–18% of mice compared with 51% loss in coniferous forest habitat [19].
The midsummer (July–August) decline in breeding and usual cessation by September in most years occurred in 61% of populations in low years and 78% in high years in the old-field habitat. This summer decline did not happen in high years but did (86% of populations) in low years in the grass–sagebrush habitat. However, the decline in mean abundance during the lull in summer breeding was 34% in low years and 14% in high years in the old-field. There is a reasonably well-documented lull in breeding in midsummer in Peromyscus populations [71,72], with both climate (hot or dry weather in summer) and high population density as possible causes [34]. Thus, the postulated relationship of midsummer cessation of breeding in peak populations of deer mice leading to major declines in density advocated by [34,36] seemed to not apply to our populations. In 5 of 6 high-population years, deer mouse populations continued increasing into November–December before declining overwinter to lower spring densities.

4.3. Association with Montane Voles

Our H3 predicted that interspecific competition between deer mice and montane voles will cause deer mice to be at a lower density when voles are higher. Contrary to this prediction, mean abundance of both species were highly correlated throughout the study period, and hence H3 was not supported. This result is the first, to our knowledge, of P. maniculatus coexisting, at these densities, with a Microtus species in a mainland grassland habitat. Our old-field and grass–sagebrush sites had the highest crown volume indices of herbaceous plant species, of which 80.0% and 60.7% were composed of grass species, respectively, among the agrarian and natural habitats at the Research Station [4]. Thus, we suggest that our old-field sites, in particular, are a rich optimum habitat able to support both rodent species. Montane vole populations followed the same pattern of changes in abundance as deer mice but at much higher densities ranging from 10/ha to 250/ha and with concurrent multiannual fluctuations of 3–4 years over the 21-year period [53]. As noted in the scientific literature, at least in perennial grasslands, Microtus voles are competitively dominant to deer mice and may exclude them from grassland sites that would appear to be optimal habitat for P. maniculatus [35,41,45,46,47,50]. This premise does not necessarily hold in forest ecosystems where the meadow vole and Clethrionomys spp. seemed to have no effect on abundance of deer mice [23,51,52], nor on some islands where deer mice coexisted with both vole species [73,74].
An alternative explanation may be the “fence effect” whereby dispersal of animals is prevented, such as on islands or in enclosures [57,75,76]. Dispersal possibilities for montane voles may have been limited by the location of our old-field sites within the mosaic of managed and natural habitats, which may have simulated a “fence effect”. However, both deer mice and montane voles occurred within tree fruit orchards, field edges, and hedgerows bordering orchards and vineyards where there was sufficient cover of herbaceous vegetation [49,77]. In addition, deer mice clearly occupied the grass–sagebrush sites with a pattern of population change following that of the old-field sites. Domination of semiarid grasslands by P. maniculatus has been reported across much of the Pacific Northwest of North America [3,78,79,80]. Populations of montane voles also inhabited the grass–sagebrush sites but at relatively low levels of abundance (5–15/ha) and declined occasionally to extirpation during low years (unpublished data). Not surprisingly, montane voles selected habitats with higher herbaceous cover and lower shrub cover in other semiarid grasslands [81,82]. Thus, we could not measure potential interactions between the two species in our grass–sagebrush sites.
Various microtine species seem to inhabit similar habitats without obvious evidence of competitive interactions. Examples include the heather vole (Phenacomys intermedius), which seemed to coexist with the long-tailed vole and meadow vole in similar habitats [83,84]. Similarly, the group of Microtus species in the Yukon have few direct interactions of a competitive nature and seem to persist despite different habitat requirements and possibly variable food preferences [25]. However, these latter examples include vole species at consistently low abundance compared with our populations of montane voles and deer mice fluctuating through low and high years of a few to several hundred animals per ha. To this end, a 20-year study in the eastern deciduous forests of North America concluded that intra- and interspecific competitive interactions between deer mice and voles were the basis of their population dynamics [18]. For example, dramatic population fluctuations in numbers of M. ochrogaster were considered a driving force in determining the 3–4 year fluctuation of P. maniculatus in Kansas old-fields [35].
Another possibility is that resource competition for food may be less important in these semiarid grassland habitats with concurrent high populations of these two species. If deer mice are primarily insectivorous and granivorous [9,85] and montane voles herbivorous [86] in these sites, then this would allow their coexistence at high numbers. Unfortunately, we do not have any data on food availability or consumption by either species in our habitats.

4.4. Role of Agricultural Setting and Optimum Habitat

We suggest that these two habitats, particularly the old-field, provide optimum conditions for deer mice at least within this agricultural setting with relatively moderate overwinter temperatures and low snowfall within the broad distributional range of P. maniculatus. Although not monitored in this study, there was consistent availability of water, fertilizer, and other plant growth media in adjacent managed habitats near our old-fields. As discussed in [87], there may be spillover of increased nutrient input and herbicide residues near the edge of agricultural fields that could affect plant production both positively and negatively in adjacent natural habitats.
The dramatic decline in abundance of deer mice in both habitats during low years and particularly in 1999–2003 suggested a link to possible drought conditions from warm dry weather in those years. Precipitation levels are highly correlated to net primary productivity in arid and semiarid systems [88,89]. In addition, small mammal abundance also increases as precipitation increases with consequent enhancement of plant productivity, but lagging up to a season behind [35,90,91]. The deer mouse, in particular, seems to decrease in abundance with a relatively small reduction in mean precipitation and may decline over time in perennial grasslands [92]. The relationship between rainfall and population peaks of P. maniculatus on Santa Barbara Island was very strong [36]. Examination of annual precipitation levels for the period 1980 to 2003 had a mean (±SE) of 339.7 ± 14.0 mm (Penticton, BC, Canada, from Environment Canada records). The years prior to peak populations of deer mice and their respective mean annual precipitation amounts (mm) were 1982 (397.8; +17.1%), 1983 (469.5; +38.2%), 1986 (333.2; −2.0%), 1993 (402.3; +18.4%), 1995 (449.7; +32.4%), and 1996 (413.5; +21.7%). Thus, in 5 of 6 cases, the mean (±SE) annual precipitation in the pre-peak years was 426.6 ± 14.1 mm, which was 86.9 ± 14.1 mm (25.6%) above the 24-year average.
For the low population years: 1985, 1993, and 1995, the mean (±SE) annual precipitation preceding these years was 313.0 ± 2.2 mm (−7.9%) of the 24-year average. Over the low population years of 1999–2003, starting in 1998, annual precipitation was 14.2% lower than the annual average, with 2002 at 197.3 mm (−41.9%) the lowest annual precipitation in 24 years. Thus, it is possible that these changes in precipitation and potential primary production of herbaceous vegetation may be driving the multiannual fluctuations of P. maniculatus in our old-field and grass–sagebrush habitats. The trigger may be climate change and the consequent highly variable precipitation regimes that are now affecting all ecosystems [91,93].

5. Conclusions

P. maniculatus populations in old-field and grass–sagebrush sites had clearly defined periods of high “peak” mean numbers (32–52/ha) and other times of low mean numbers (20–22/ha) in an intensive long-term trapping program over 21 years. These fluctuations occurred at 3–4 year intervals but were not always present. Greater numbers of P. maniculatus in high than low years was directly related to population increases from extended breeding seasons and number of lactating females, and hence H1 was supported. Spring breeding season declines occurred but were similar or less in high than low years of mean abundance and were relaxed in comparison to forest populations of deer mice in other studies. Thus, H2 was supported for recruitment with high numbers of young-of-the-year breeding and total number of juvenile recruits, particularly males, but for survival was equivocal. Total summer survival was consistently higher in high than low population years but the index of juvenile productivity in all years was poor. Spring declines were presumably caused by density-related social inhibition and summer declines in breeding and abundance may have been caused by dry conditions or social inhibition. Mean abundance patterns of P. maniculatus and M. montanus in old-field sites were highly correlated throughout the study period, and hence H3 was not supported. This latter result is the first, to our knowledge, of P. maniculatus coexisting in a similar pattern of population fluctuations with a Microtus species in a mainland grassland habitat. Population changes in both habitats were similar with an indication that higher than average precipitation in the year preceding a peak population of deer mice may have enhanced primary productivity of herbaceous vegetation and contributed to population increases. Old-field habitat, and secondarily bunchgrass–sagebrush habitat, associated with this agricultural setting, provides the optimum habitat for P. maniculatus and facilitates multiannual population fluctuations in this species.

Author Contributions

Conceptualization, T.P.S. and D.S.S.; methodology, T.P.S.; formal analysis, T.P.S.; investigation, T.P.S. and D.S.S.; resources, T.P.S.; writing, original draft, T.P.S. and D.S.S.; review and editing, D.S.S. All authors have read and agreed to the published version of the manuscript.

Funding

This research was funded by the Natural Sciences and Engineering Research Council of Canada; Research Branch of Agriculture Canada, Silviculture Branch; British Columbia Ministry of Forests, Victoria, British Columbia; the Canada–British Columbia Partnership Agreement on Forest Resource Development (FRDA II); Forest Renewal BC; and the Applied Mammal Research Institute.

Institutional Review Board Statement

Not applicable.

Informed Consent Statement

Not applicable.

Data Availability Statement

Not applicable.

Acknowledgments

We thank the Pacific Agri-Food Research Centre, Agriculture and Agri-Food Canada, for the use of study areas and logistical support. We greatly appreciate the assistance of H. Sullivanand several other technical staff for help with the fieldwork.

Conflicts of Interest

The authors declare no conflict of interest. The funders had no role in the design of the study; in the collection, analyses, or interpretation of data; in the writing of the manuscript, or in the decision to publish the results.

References

  1. Harper, W.L.; Lea, E.C.; Maxwell, R.E. Biodiversity Inventory in the South Okanagan. In Our Living Legacy: Proceedings of a Symposium on Biological Diversity; Fenger, M.A., Miller, E.H., Johnson, J.A., Williams, E.J.R., Eds.; Royal British Columbia Museum: Victoria, BC, Canada, 1993. [Google Scholar]
  2. Fleischner, T.L. Ecological costs of livestock grazing in western North America. Conserv. Biol. 1994, 8, 629–644. [Google Scholar] [CrossRef] [Green Version]
  3. Pearson, D.E.; Ortega, Y.K.; McKelvey, K.S.; Ruggiero, L.F. Small mammal communities and habitat selection in northern Rocky Mountain bunchgrass: Implications for exotic plant invasions. Northwest Sci. 2001, 75, 107–117. [Google Scholar]
  4. Sullivan, T.P.; Sullivan, D.S. Plant and small mammal diversity in orchard versus non-crop habitats. Agri. Ecosyst. Environ. 2006, 116, 235–243. [Google Scholar] [CrossRef]
  5. Baker, R.H. Habitats and distribution. In Biology of Peromyscus (Rodentia); King, J.A., Ed.; Special Publication No. 2; The American Society of Mammalogists: Stillwater, OK, USA, 1968; pp. 98–126. [Google Scholar]
  6. Banfield, A.W.F. The Mammals of Canada; University of Toronto Press: Toronto, ON, Canada, 1974. [Google Scholar]
  7. Naughton, D. The Natural History of Canadian Mammals; University of Toronto Press: Toronto, ON, Canada, 2012. [Google Scholar]
  8. Nagorsen, D.W. Rodents and Lagomorphs of British Columbia; Royal BC Museum Handbook: Victoria, BC, Canada, 2005. [Google Scholar]
  9. Sieg, C.H.; Uresk, D.W.; Hansen, R.M. Seasonal diets of deer mice on bentonite mine spoils and sagebrush grasslands in Southeastern Montana. Northwest Sci. 1986, 60, 81–89. [Google Scholar]
  10. Bellocq, M.I.; Smith, S.M. Arthropods preferred as food by Sorex cinereus (masked shrew) and Peromyscus maniculatus (deer mouse): An experimental approach. Mammalia 1994, 53, 391–396. [Google Scholar] [CrossRef]
  11. Vickery, W.; Daoust, J.L.; El Wartiti, A.; Peletier, J. The effect of energy and protein content on food choice by deer mice Peromyscus maniculatus (Rodentia). Anim. Behav. 1994, 47, 55–64. [Google Scholar] [CrossRef] [Green Version]
  12. Lackey, J.A.; Huckaby, D.G.; Ormiston, B.G. Peromyscus leucopus. Mamm. Species 1985, 247, 1–10. [Google Scholar]
  13. Terman, C.R. Population dynamics. In Biology of Peromyscus (Rodentia); King, J.A., Ed.; Special Publication No. 2; The American Society of Mammalogists: Stillwater, OK, USA, 1968; pp. 412–450. [Google Scholar]
  14. Petticrew, B.G.; Sadleir, R.M.F.S. The ecology of the deer mouse Peromyscus maniculatus in a coastal coniferous forest. I. Population dynamics. Can. J. Zool. 1974, 52, 107–118. [Google Scholar] [CrossRef]
  15. Grant, P.R. An 11-year study of small mammal populations at Mont St. Hilaire, Quebec. Can. J. Zool. 1976, 54, 2156–2173. [Google Scholar] [CrossRef]
  16. Fryxell, J.M.; Falls, J.B.; Falls, E.A.; Brooks, R.J. Long-term dynamics of small-mammal populations in Ontario. Ecology 1998, 79, 213–225. [Google Scholar] [CrossRef]
  17. Lewellyn, T.H.; Vessey, S.H. The effect of density dependence and weather on population size of a polyvoltine species. Ecol. Monogr. 1998, 68, 571–594. [Google Scholar] [CrossRef]
  18. Merritt, J.F.; Lima, M.; Bozinovc, F. Seasonal regulation in fluctuating small mammal populations: Feedback structure and climate. Oikos 2001, 94, 505–514. [Google Scholar] [CrossRef]
  19. Sullivan, T.P.; Sullivan, D.S.; Boonstra, R.; Krebs, C.J.; Vyse, A. Population regulation in the deer mouse (Peromyscus maniculatus) in old-growth coniferous forests of southern British Columbia: Insights from a long-term study. Mam. Res. 2023, 68, 37–51. [Google Scholar] [CrossRef]
  20. Gilbert, B.S.; Krebs, C.J. Population dynamics of Clethrionomys and Peromyscus in southwestern Yukon 1973–1989. Holarctic. Ecol 1991, 14, 250–259. [Google Scholar] [CrossRef]
  21. Millar., J.S.; McAdam, A.G. Life on the edge: The demography of short-season populations of deer mice. Oikos 2001, 93, 69–76. [Google Scholar] [CrossRef]
  22. Van Horne, B. Niches of adult and juvenile deer mice (Peromyscus maniculatus) in seral stages of coniferous forest. Ecology 1982, 63, 992–1003. [Google Scholar] [CrossRef]
  23. Gilbert, B.S.; Krebs, C.J. Competition between Peromyscus maniculatus and other small rodents in the boreal forest of the southern Yukon Territory. Acta Zool. Fenn. 1984, 172, 51–56. [Google Scholar]
  24. Krebs, C.J.; Boonstra, R.; Kenney, A.J.; Gilbert, B.S. Hares and small rodent cycles: A 45-year perspective on predator-prey dynamics in the Yukon boreal forest. Aust. Zool. 2018, 39, 724–732. [Google Scholar] [CrossRef]
  25. Krebs, C.J.; Boonstra, R.; Gilbert, B.S.; Kenney, A.J.; Boutin, S. Impact of climate change on the small mammal community of the Yukon boreal forest. Integr. Zool. 2019, 14, 528–541. [Google Scholar] [CrossRef]
  26. Gashwiler, J.S. Tree seed abundance vs. deer mouse populations in Douglas-Fir clearcuts. In Division of Forest-Wildlife Management; Society of American Foresters: Detroit, MI, USA, 1965; pp. 219–222. [Google Scholar]
  27. Gashwiler, J.S. Deer mouse reproduction and its relationship to the tree seed crop. Amer. Midl. Nat. 1979, 102, 95–104. [Google Scholar] [CrossRef]
  28. Wolff, J.O. Population fluctuations of mast-eating rodents are correlated with acorn production. J. Mammal. 1996, 77, 850–856. [Google Scholar] [CrossRef] [Green Version]
  29. McCracken, K.E.; Witham, J.W.; Hunter, M.L., Jr. Relationships between seed fall of three tree species and Peromyscus leucopus and Clethriononmys gapperi during 10 years in an oak-pine forest. J. Mammal. 1999, 80, 1288–1296. [Google Scholar] [CrossRef]
  30. Elias, S.P.; Witham, J.W.; Hunter, M.L. Peromyscus leucopus abundance and acorn mast: Population fluctuation patterns over 20 years. J. Mammal. 2004, 85, 743–747. [Google Scholar] [CrossRef] [Green Version]
  31. Falls, J.B.; Falls, E.A.; Fryxell, J.M. Fluctuations of deer mice in Ontario in relation to seed crops. Ecol. Monogr. 2007, 77, 19–32. [Google Scholar] [CrossRef]
  32. Lobo, N.; Millar, J.S. Indirect and mitigated effects of pulsed resources on the population dynamics of a northern rodent. J. Animal Ecol. 2013, 82, 814–825. [Google Scholar] [CrossRef] [PubMed]
  33. Sullivan, T.P.; Sullivan, D.S. Long-term demographic changes in deer mouse (Peromyscus maniculatus) populations in a forested landscape with cumulative clearcutting. For. Ecol. Manag 2022, 517, 120255. [Google Scholar] [CrossRef]
  34. Vessey, S.H. Long-term population trends in white-footed mice and the impact of supplemental food and shelter. Am. Zool. 1987, 27, 879–890. [Google Scholar] [CrossRef]
  35. Brady, M.J.; Slade, N.A. Long-term dynamics of a grassland rodent community. J. Mammal. 2004, 85, 552–561. [Google Scholar] [CrossRef]
  36. Drost, C.A.; Fellers, G.M. Density cycles in an island population of deer mice, Peromyscus maniculatus. Oikos 1991, 60, 351–364. [Google Scholar] [CrossRef]
  37. Boonstra, R.; Krebs, C.J. Population dynamics of red-backed voles (Myodes) in North America. Oecologia 2012, 168, 601–620. [Google Scholar] [CrossRef]
  38. Sadleir, R.M.F.S. The relationship between agonistic behaviour and population changes in the deer mouse Peromyscus maniculatus (Wagner). J. Animal. Ecol 1965, 34, 331–352. [Google Scholar] [CrossRef]
  39. Fairbairn, D.J. The spring decline in deer mice: Death or dispersal? Can. J. Zool. 1977, 55, 84–92. [Google Scholar] [CrossRef]
  40. Galindo, C.; Krebs, C.J. Population regulation in deer mice: The role of females. J. Animal. Ecol. 1987, 56, 11–23. [Google Scholar] [CrossRef]
  41. Redfield, J.A.; Krebs, C.J.; Taitt, M.J. Competition between Peromyscus maniculatus and Microtus townsendii in grasslands of coastal British Columbia. J. Animal. Ecol. 1977, 46, 607–616. [Google Scholar] [CrossRef] [Green Version]
  42. Dueser, R.D.; Wilson, M.L.; Rose, R.K. Attributes of dispersing meadow voles in open-grid populations. Acta Theriol. 1981, 26, 139–162. [Google Scholar] [CrossRef] [Green Version]
  43. Schweiger, E.W.; Diffendorfer, J.E.; Holt, R.D.; Pierotti, R.; Gaines, M.S. The interaction of habitat fragmentation, plant, and small mammal succession in an old field. Ecol. Monogr. 2000, 70, 383–400. [Google Scholar] [CrossRef]
  44. Manson, R.H.; Ostfeld, R.S.; Canham, C.D. Long-term effects of rodent herbivores on tree invasion dynamics along forest-field edges. Ecology 2001, 82, 3320–3329. [Google Scholar]
  45. Grant, P.R. Experimental studies of competitive interaction in a two species system. III. Microtus and Peromyscus species in enclosures. J. Anim. Ecol. 1971, 40, 323–350. [Google Scholar] [CrossRef]
  46. Abramsky, Z.; Dyer, M.I.; Harrison, P.D. Competition among small mammals in experimentally perturbed areas of shortgrass prairie. Ecology 1979, 60, 530–536. [Google Scholar] [CrossRef]
  47. Hallett, J.G.; O’Connell, M.A.; Honeycutt, R.L. Competition and habitat selection: Test of a theory using small mammals. Oikos 1983, 40, 175–181. [Google Scholar] [CrossRef]
  48. Swihart, R.K.; Slade, N.K. Long-term dynamics of an early successional small mammal community. Am. Midl. Nat. 1990, 123, 372–382. [Google Scholar] [CrossRef]
  49. Sullivan, T.P.; Sullivan, D.S.; Hogue, E.J.; Lautenschlager, R.A.; Wagner, R.G. Population dynamics of small mammals in relation to vegetation management in orchard agroecosystems: Compensatory responses in abundance and biomass. Crop Prot. 1998, 17, 1–11. [Google Scholar] [CrossRef]
  50. Manson, R.H.; Ostfeld, R.S.; Canham, C.D. Responses of a small mammal community to heterogeneity along forest-old-field edges. Landsc. Ecol. 1999, 14, 355–367. [Google Scholar] [CrossRef]
  51. Galindo, C.; Krebs, C.J. Habitat use and abundance of deer mice: Interactions with meadow voles and red-backed voles. Can. J. Zool. 1985, 63, 1870–1879. [Google Scholar] [CrossRef]
  52. Wolff, J.O.; Dueser, R.D. Noncompetitive coexistence between Peromyscus species and Clethrionomys gapperi. Can. Field Nat. 1986, 100, 186–191. [Google Scholar]
  53. Sullivan, T.P.; Sullivan, D.S.; Boonstra, R.; Krebs, C.J. Population changes and limitation in the montane vole (Microtus montanus) in perennial old-field grasslands: Insights from a long-term study. J. Mammal. 2021, 102, 404–415. [Google Scholar] [CrossRef]
  54. Meidinger, D.; Pojar, J. Ecosystems of British Columbia; Special Report Series No 6; Research Branch Ministry of Forests: Victoria, BC, Canada, 1991.
  55. Hurlbert, S.H. Pseudoreplication and the design of ecological field experiments. Ecol. Monogr. 1984, 54, 187–211. [Google Scholar] [CrossRef] [Green Version]
  56. Merritt, J.F.; Merritt, J.M. Seasonal home ranges and activity of small mammals of a Colorado subalpine forest. Acta Theriol. 1978, 23, 195–202. [Google Scholar] [CrossRef] [Green Version]
  57. Krebs, C.J.; Keller, B.L.; Tamarin, R.H. Microtus population biology: Demographic changes in fluctuating populations of M. ochrogaster and M. pennsylvanicus in southern Indiana. Ecology 1969, 50, 587–607. [Google Scholar] [CrossRef] [Green Version]
  58. Sikes, R.S.; Gannon, W.L. The Animal Care and Use Committee of the American Society of Mammalogists. Guidelines of the American Society of Mammalogists for the use of wild mammals in research. J. Mammal. 2016, 97, 663–688. [Google Scholar] [CrossRef]
  59. Seber, G.A.F. The Estimation of Animal Abundance and Related Parameters, 2nd ed.; Charles Griffin and Co. Ltd.: London, UK, 1982. [Google Scholar]
  60. Krebs, C.J. Ecological Methodology; Addison Wesley Longman, Inc.: Menlo Park, CA, USA, 1999. [Google Scholar]
  61. Krebs, C.J.; Boonstra, R.; Gilbert, S.; Reid, D.; Kenney, A.J.; Hofer, E.J. Density estimation for small mammals from livetrapping grids: Rodents in northern Canada. J. Mammal. 2011, 92, 974–981. [Google Scholar] [CrossRef] [Green Version]
  62. Krebs, C.J.; Boonstra, R. Trappability estimates for mark-recapture data. Can. J. Zool. 1984, 62, 2440–2444. [Google Scholar] [CrossRef]
  63. Zar, J.H. Biostatistical Analysis; Prentice-Hall, Inc.: Englewood Cliffs, NJ, USA, 1999; 663p. [Google Scholar]
  64. Taitt, M.J.; Krebs, C.J. Population dynamics and cycles. In Biology of New World Microtus; Tamarin, R.H., Ed.; Special Publication No. 8; The American Society of Mammalogists: Stillwater, OK, USA, 1985; pp. 567–620. [Google Scholar]
  65. Terman, C.R. Population fluctuations of Peromyscus maniculatus and other small mammals as revealed by the North American census of small mammals. Am. Midl. Nat. 1966, 76, 419–426. [Google Scholar] [CrossRef]
  66. Sullivan, T.P.; Krebs, C.J. An irruption of deer mice after logging of coastal coniferous forest. Can. J. For. Res. 1981, 11, 586–592. [Google Scholar] [CrossRef]
  67. Sullivan, T.P.; Lautenschlager, R.A.; Wagner, R.G. Clear-cutting and burning of northern spruce-fir forests: Implications for small mammal communities. J. Appl. Ecol. 1999, 36, 327–344. [Google Scholar] [CrossRef]
  68. Boonstra, R. Effect of adult Townsend voles on survival of young. Ecology 1978, 59, 242–248. [Google Scholar] [CrossRef]
  69. Boonstra, R. Demography of Microtus pennsylvanicus in southern Ontario: Enumeration versus Jolly-Seber compared. Can. J. Zool. 1985, 63, 1174–1180. [Google Scholar] [CrossRef]
  70. Krebs, C.J.; Boonstra, R. Demography of the spring decline in populations of the vole Microtus townsendii. J. Anim. Ecol. 1978, 47, 1007–1015. [Google Scholar] [CrossRef] [Green Version]
  71. Rintamaa, D.L.; Mazur, P.A.; Vessey, S.H. Reproduction during two annual cycles in a population of Peromyscus leucopus noveboracensis. J. Mammal. 1976, 57, 593–595. [Google Scholar] [CrossRef]
  72. Wolff, J.O. Comparative population ecology of Peromyscus leucopus and Peromyscus maniculatus. Can. J. Zool. 1985, 63, 1548–1555. [Google Scholar] [CrossRef]
  73. Crowell, K.L. Islands—Insight or artifact? Population dynamics of habitat utilization in insular rodents. Oikos 1983, 41, 442–454. [Google Scholar] [CrossRef]
  74. Dueser, R.D.; Porter, J.H. Habitat use by insular small mammals: Relative effects of competition and habitat structure. Ecology 1986, 67, 195–201. [Google Scholar] [CrossRef]
  75. Sullivan, T.P. Demography and dispersal in island and mainland populations of the deer mouse, Peromyscus maniculatus. Ecology 1977, 58, 964–978. [Google Scholar] [CrossRef]
  76. Tamarin, R.H.; Reich, L.M.; Moyer, C.A. Meadow vole cycles within fences. Can. J. Zool. 1984, 62, 1796–1804. [Google Scholar] [CrossRef]
  77. Sullivan, T.P.; Sullivan, D.S.; Thistlewood, H.M. Abundance and diversity of small mammals in response to various linear habitats in semi-arid agricultural landscapes. J. Arid Environ. 2012, 83, 54–61. [Google Scholar] [CrossRef]
  78. Grant, W.E.; Birney, E.C.; French, N.R.; Swift, D.M. Structure and reproductivity of grassland small mammal communities related to grazing-induced changes in vegetative cover. J. Mammal. 1982, 63, 248–260. [Google Scholar] [CrossRef]
  79. MacCracken, J.G.; Uresk, D.W.; Hansen, R.M. Rodent-vegetation relationships in southeastern Montana. Northwest Sci. 1985, 59, 272–278. [Google Scholar]
  80. Hales, G.S. Small Mammal Communities in Two Grassland Ecosystems in British Columbia, Canada. Master’s Thesis, Thompson Rivers University, Kamloops, BC, Canada, 2011. [Google Scholar]
  81. Randall, J.A.; Johnson, R.E. Population densities and habitat occupancy by Microtus longicaudus and M. montanus. J. Mammal. 1979, 60, 217–219. [Google Scholar] [CrossRef]
  82. Belk, M.C.; Smith, H.D.; Lawson, J. Use and partitioning of montane habitat by small mammals. J. Mammal. 1988, 69, 688–695. [Google Scholar] [CrossRef]
  83. Millar, J.S.; Innes, G.L.; Loewen, V.A. Habitat use by non-hibernating small mammals of the Kananaskis Valley, Alberta. Can. Field-Nat. 1985, 99, 196–204. [Google Scholar]
  84. Sullivan, T.P.; Sullivan, D.S. Population dynamics of the heather vole (Phenacomys intermedius) in commercial forest landscapes of south-central British Columbia. Canada. J. Mammal. 2021, 102, 1186–1201. [Google Scholar] [CrossRef]
  85. Pearson, D.E.; McKelvey, K.S.; Ruggiero, L.F. Non-target effects of an introduced biological control agent on deer mouse ecology. Oecologia 2000, 122, 121–128. [Google Scholar] [CrossRef] [PubMed]
  86. Sera, W.E.; Early, C.N. Microtus montanus. Mamm. Species 2003, 716, 1–10. [Google Scholar] [CrossRef]
  87. Kothe, S.; Bakanov, N.; Bruhl, C.A.; Gemeinholzer, B.; Hörren, T.; Mühlethaler, R.; Sorg, M.; Sumser, H.; Swenson, S.J.; Lehmann, G.U. Negative spill-over effects of agricultural practices on plant species conservation in nature reserves. Ecol. Indic. 2023, 149, 110170. [Google Scholar] [CrossRef]
  88. Sala, O.E.; Parton, W.J.; Joyce, L.A.; Lauenroth, W.K. Primary production of the central grasslands region of the United States. Ecology 1988, 69, 40–45. [Google Scholar] [CrossRef]
  89. Lauenroth, W.K.; Sala, O.E. Long-term forage production of North American shortgrass steppe. Ecol. Appl. 1992, 2, 397–403. [Google Scholar] [CrossRef] [PubMed] [Green Version]
  90. Shenbrot, G.; Krasnov, B.; Burdelov, S. Long-term study of population dynamics and habitat selection of rodents in the Negev Desert. J. Mammal. 2010, 91, 776–786. [Google Scholar] [CrossRef] [Green Version]
  91. Thibault, K.M.; Ernest, S.K.M.; White, E.P.; Brown, J.H.; Goheen, J.R. Long-term insights into the influence of precipitation on community dynamics in desert rodents. J. Mammal. 2010, 91, 787–797. [Google Scholar] [CrossRef] [Green Version]
  92. Reed, A.W.; Kaufman, G.A.; Sandercock, B.K. Demographic response of a grassland rodent to environmental variability. J. Mammal. 2007, 88, 982–988. [Google Scholar] [CrossRef]
  93. IPCC. IPCC Fifth Assessment Report: Climate Change 2013: The Physical Science Basis. In 2014, Contribution of Working Group I to the Fifth Assessment Report of the Intergovernmental Panel on Climate Change; Cambridge University Press: Cambridge, UK, 2013. [Google Scholar] [CrossRef] [Green Version]
Figure 1. Photograph of the mosaic of old-field sites (black closed circles), natural bunchgrass–sagebrush sites (white open circles), tree fruit orchards, vineyards, and ponderosa pine forest habitats at the Summerland Research Station, southern British Columbia, Canada.
Ecologies 04 00026 g001
Figure 2. Photograph of perennial grassland (old-field site) with a mixture of forage and forb species at the Summerland Research Station, southern British Columbia, Canada.
Ecologies 04 00026 g002
Figure 3. Photographs of natural bunchgrass–sagebrush sites (a,b) with a mixture of bunchgrass and forb species at the Summerland Research Station, southern British Columbia, Canada.
Ecologies 04 00026 g003
Figure 4. Mean (n = 2 or 3 replicate sites ± SE) number of Peromyscus maniculatus per ha as an index based on Jolly–Seber population estimates and effective trapped area, 1982 to 2003, in perennial grasslands (old-field sites) in southern British Columbia, Canada. Data points indicate individual trapping weeks in summer (March to October) and winter (November to February) periods. Years of “high” abundance are indicated along x-axis. Diagonal marker indicates years and periods when we did not sample populations.
Ecologies 04 00026 g004
Figure 5. Mean (n = 1 or 3 replicate sites ± SE) number of Peromyscus maniculatus per ha as an index based on Jolly–Seber population estimates and effective trapped area, 1982 to 2003, in perennial grasslands (grass–sagebrush sites) in southern British Columbia, Canada. Data points indicate individual trapping weeks in summer (March to October) and winter (November to February) periods. Years of “high” abundance are indicated along x-axis. Diagonal marker indicates years and periods when we did not sample populations.
Ecologies 04 00026 g005
Figure 6. Mean (n = 1, 2, or 3 replicate sites ± 95% CIs) annual number of Peromyscus maniculatus per ha as an index based on Jolly–Seber population estimates and effective trapped area, 1982 to 2003, in perennial grasslands (old-field and grass–sagebrush sites) in southern British Columbia, Canada. Years of “high” abundance are indicated along x-axis. Diagonal marker indicates years and periods when we did not sample populations.
Ecologies 04 00026 g006
Figure 7. Mean number of total and juvenile recruits and number lactating females (successful pregnancies) for Peromyscus maniculatus 1982 to 2003, in perennial grasslands (old-field sites) of southern British Columbia, Canada.
Ecologies 04 00026 g007
Figure 8. Mean index of early juvenile productivity (± SE) (number of juveniles/lactating female) for Peromyscus maniculatus, 1982 to 2003, in perennial grasslands (old-field sites) of southern British Columbia, Canada. Years of “high” abundance are indicated along x-axis.
Ecologies 04 00026 g008
Figure 9. Mean Jolly–Seber total survival estimates (± SE) for live-trapped populations of Peromyscus maniculatus in seasonal summer and winter periods each year, 1982 to 2003, in perennial grasslands (old-field sites) of southern British Columbia, Canada. Years of “high” abundance are indicated along x-axis.
Ecologies 04 00026 g009
Figure 10. Linear regression analysis of (a) mean annual abundance and (b) mean peak abundance of Peromyscus maniculatus regressed on Microtus montanus 1982 to 2003 in perennial grasslands (old-field sites) of southern British Columbia, Canada.
Ecologies 04 00026 g010
Table 1. Mean (n = 2 or 3 replicate sites) ± SE estimates of population and demographic responses of P. maniculatus over 13 of 21 years in perennial grasslands (old-field) in southern British Columbia, Canada. High years were 1983, 1984, 1987, 1994, 1996, and 1997; low years were 1982, 1985, 1993, and 1999–2002. Breeding cessation midsummer (July–August) are number of populations (grids). Recruits and lactating females are number per trapping period per year. Sample size in parentheses. J–S = Jolly–Seber.
ParameterHigh Years (6)Low Years (7)Overall (13)
Annual peak abundance/ha *52.1 ± 5.819.9 ± 4.534.8 ± 5.8
Annual abundance/ha *33.9 ± 2.612.8 ± 2.322.6 ± 3.5
Annual low abundance/ha *18.3 ± 2.86.7 ± 1.112.0 ± 2.2
Mean abundance
Spring season decline (%)20.5 ± 8.3 (5)16.7 ± 6.0 (8)18.2 ± 4.7 (13)
Summer decline (%)13.7± 4.4 (5)34.3 ± 7.0 (7)25.7 ± 5.3 (12)
Breeding cessation midsummer (%)77.7 (9)61.1 (18)66.7 (27)
Breeding season (weeks)25.5 ± 0.5 (4)23.0 ± 2.0 (6)24.0 ± 1.3 (10)
Number of lactating females *4.3 ± 0.41.9 ± 0.53.0 ± 0.4
Total recruits12.0 ± 2.15.6 ± 0.98.5 ± 1.4
Juvenile recruits8.0 ± 1.53.6 ± 0.55.6 ± 0.9
Index of juvenile productivity2.29 ± 0.292.66 ± 0.252.49 ± 0.19
Proportion of young-of-year breeding
Males0.41 ± 0.070.59 ± 0.060.51 ± 0.05
Females0.14 ± 0.020.29 ± 0.040.22 ± 0.03
Summer J–S survival * (rate per 28 days)0.78 ± 0.010.66 ± 0.030.71 ± 0.03
Winter J–S survival (rate per 28 days)0.81 ± 0.030.75 ± 0.030.78 ± 0.02
Number of yearsn = 6n = 7n = 13
* Nonoverlapping 95% CIs between high and low years.
Table 2. Mean (n = 1 or 3 replicate sites) ± SE estimates of population and demographic responses of P. maniculatus over 9 of 21 years in perennial grasslands (grass–sagebrush) in southern British Columbia, Canada. High years were 1983, 1984, and 1997; low years were 1982, 1985, and 1999–2002. Breeding cessation midsummer (July–August) are number of populations (grids). Recruits and lactating females are number per trapping period per year. Sample size in parentheses. J–S = Jolly–Seber.
ParameterHigh Years (3)Low Years (6)Overall (9)
Annual peak abundance/ha32.0 ± 2.321.7 ± 3.925.2 ± 3.1
Annual abundance/ha *22.8 ± 0.510.8 ± 1.714.8 ± 2.3
Annual low abundance/ha10.3 ± 3.34.4 ± 1.56.4 ± 1.7
Mean abundance
Spring season decline (%)2.3 ± 2.3 (2)13.2 ± 5.0 (7)11.1 ± 4.2 (9)
Summer decline (%)33.4± 9.7 (3)55.5 ± 12.0 (6)48.2 ± 9.0 (9)
Breeding cessation midsummer (%)0.0 (5)85.7 (14)63.2 (19)
Breeding season (weeks)25.5 ± 0.5 (4)23.0 ± 2.0 (6)24.0 ± 1.3 (10)
Number of lactating females *3.5 ± 0.31.4 ± 0.32.1 ± 0.4
Total recruits8.2 ± 2.32.9 ± 0.34.7 ± 1.1
Juvenile recruits5.6 ± 1.21.9 ± 0.33.2 ± 0.7
Index of juvenile productivity1.31 ± 0.170.95 ± 0.271.07 ± 0.19
Proportion of young-of-year breeding
Males0.72 ± 0.130.55 ± 0.120.61 ± 0.09
Females0.10 ± 0.050.29 ± 0.080.23 ± 0.06
Summer J–S survival (rate per 28 days)0.80 ± 0.020.69 ± 0.050.73 ± 0.04
Winter J–S survival (rate per 28 days)0.82 ± 0.070.84 ± 0.020.83 ± 0.02
Number of yearsn = 3n = 6n = 9
* Nonoverlapping 95% CIs between high and low years.
Disclaimer/Publisher’s Note: The statements, opinions and data contained in all publications are solely those of the individual author(s) and contributor(s) and not of MDPI and/or the editor(s). MDPI and/or the editor(s) disclaim responsibility for any injury to people or property resulting from any ideas, methods, instructions or products referred to in the content.

