
Sociodemographic and Lifestyle Risk Factors Associated with Fragility Hip Fractures: A Systematic Review and Meta-Analysis
 , ,
, ,
Abstract
:1. Introduction
2. Materials and Methods
2.1. Search Strategy and Selection Criteria
2.2. Screening and Data Extraction
2.3. Statistical Analysis
3. Results
4. Discussion
4.1. Age
4.2. Sex
4.3. Menopause
4.4. Caucasian Ancestry
4.5. BMI
4.6. Parity
4.7. Marital Status
4.8. Environmental Factors
4.9. Previous Falls
4.10. Previous Fractures
4.11. Family History of Hip Fracture and Osteoporosis
4.12. Fracture Risk Assessment
4.13. Limitations
5. Conclusions
Supplementary Materials
Author Contributions
Funding
Data Availability Statement
Conflicts of Interest
Appendix A
References
- Fisher, E.S.; Baron, J.A.; Malenka, D.J.; Barrett, J.A.; Kniffin, W.D.; Whaley, F.S.; Bubolz, T.A. Hip fracture incidence and mortality in New England. Epidemiology 1991, 2, 116–122. [Google Scholar] [CrossRef] [PubMed]
- Hippisley-Cox, J.; Coupland, C. Derivation and validation of updated QFracture algorithm to predict the risk of osteoporotic fracture in primary care in the United Kingdom: Prospective open cohort study. BMJ 2012, 344, e3427. [Google Scholar] [CrossRef] [PubMed]
- Finsterwald, M.; Sidelnikov, E.; Orav, E.J.; Dawson-Hughes, B.; Theiler, R.; Egli, A.; Platz, A.; Simmen, H.P.; Meier, C.; Grob, D.; et al. Gender-specific hip fracture risk in community-dwelling and institutionalized seniors age 65 years and older. Osteoporos. Int. 2014, 25, 167–176. [Google Scholar] [CrossRef] [PubMed]
- Michaelsson, K.; Baron, J.A.; Farahmand, B.Y.; Ljunghall, S. Influence of parity and lactation on hip fracture risk. Am. J. Epidemiol. 2001, 153, 1166–1172. [Google Scholar] [CrossRef] [PubMed]
- Espino, D.V.; Silva Ross, J.; Oakes, S.L.; Becho, J.; Wood, R.C. Characteristics of hip fractures among hospitalized elder Mexican American Black and White Medicare beneficiaries in the Southwestern United States. Aging Clin. Exp. Res. 2008, 20, 344–348. [Google Scholar] [CrossRef] [PubMed]
- Albaba, M.; Cha, S.S.; Takahashi, P.Y. The Elders Risk Assessment Index, an electronic administrative database-derived frailty index, can identify the risk of hip fracture in a cohort of community-dwelling adults. Mayo Clin. Proc. 2012, 87, 652–658. [Google Scholar] [CrossRef] [PubMed] [PubMed Central]
- FitzGerald, G.; Compston, J.E.; Chapurlat, R.D.; Pfeilschifter, J.; Cooper, C.; Hosmer, D.W., Jr.; Adachi, J.D.; Anderson, F.A., Jr.; Diez-Perez, A.; Greenspan, S.L.; et al. Empirically based composite fracture prediction model from the Global Longitudinal Study of Osteoporosis in Postmenopausal Women (GLOW). J. Clin. Endocrinol. Metab. 2014, 99, 817–826. [Google Scholar] [CrossRef] [PubMed] [PubMed Central]
- Farahmand, B.Y.; Persson, P.G.; Michaelsson, K.; Baron, J.A.; Parker, M.G.; Ljunghall, S.; Swedish hip fracture, g. Socioeconomic status, marital status, and hip fracture risk: A population-based case-control study. Osteoporos. Int. 2000, 11, 803–808. [Google Scholar] [CrossRef] [PubMed]
- Mortensen, S.J.; Beeram, I.; Florance, J.; Momenzadeh, K.; Mohamadi, A.; Rodriguez, E.K.; von Keudell, A.; Nazarian, A. Modifiable lifestyle factors associated with fragility hip fracture: A systematic review and meta-analysis. J. Bone Min. Metab. 2021, 39, 893–902. [Google Scholar] [CrossRef] [PubMed]
- Adams, A.L.; Fischer, H.; Kopperdahl, D.L.; Lee, D.C.; Black, D.M.; Bouxsein, M.L.; Fatemi, S.; Khosla, S.; Orwoll, E.S.; Siris, E.S.; et al. Osteoporosis and Hip Fracture Risk From Routine Computed Tomography Scans: The Fracture, Osteoporosis, and CT Utilization Study (FOCUS). J. Bone Miner. Res. 2018, 33, 1291–1301. [Google Scholar] [CrossRef]
- Al-Algawy, A.A.H.; Baiee, H.A.; Hasan, S.; Jassim, I.; Razaq, M.; Kamel, F.; Ali, A.; Khudhair, E. Risk Factors Associated with Hip Fractures among Adult People in Babylon City, Iraq. Open Access Maced. J. Med. Sci. 2019, 7, 3608–3614. [Google Scholar] [CrossRef] [PubMed]
- Albertsson, D.; Mellstrom, D.; Petersson, C.; Thulesius, H.; Eggertsen, R. Hip and fragility fracture prediction by 4-item clinical risk score and mobile heel BMD: A women cohort study. BMC Musculoskelet. Disord. 2010, 11, 55. [Google Scholar] [CrossRef] [PubMed] [PubMed Central]
- Anastasilakis, A.D.; Polyzos, S.A.; Kitridis, D.; Makras, P.; Yavropoulou, M.P.; Palermo, A.; Gerou, S.; Ntenti, C.; Ballaouri, I.; Savvidis, M. Ιrisin levels in postmenopausal women with an incident hip fracture. Endocrine 2021, 73, 719–722. [Google Scholar] [CrossRef] [PubMed]
- Anpalahan, M.; Morrison, S.G.; Gibson, S.J. Hip fracture risk factors and the discriminability of hip fracture risk vary by age: A case-control study. Geriatr. Gerontol. Int. 2014, 14, 413–419. [Google Scholar] [CrossRef] [PubMed]
- Ardiansyah, A.; Yuwana, S. Anthropometric measurements associated with intertrochanteric fractures in the elderly: A case-control study. Med. J. Indones. 2019, 28, 365–369. [Google Scholar] [CrossRef]
- Bartels, S.; Gjertsen, J.-E.; Frihagen, F.; Rogmark, C.; Utvag, S.E. Low bone density and high morbidity in patients between 55 and 70 years with displaced femoral neck fractures: A case-control study of 50 patients vs 150 normal controls. BMC Musculoskelet. Disord. 2019, 20, 371. [Google Scholar] [CrossRef]
- de Bruin, I.J.A.; Wyers, C.E.; Souverein, P.C.; van Staa, T.P.; Geusens, P.P.M.M.; van den Bergh, J.P.W.; de Vries, F.; Driessen, J.H.M. The risk of new fragility fractures in patients with chronic kidney disease and hip fracture-a population-based cohort study in the UK. Osteoporos. Int. 2020, 31, 1487–1497. [Google Scholar] [CrossRef]
- Chang, C.-B.; Yang, R.-S.; Chang, L.-Y.; Peng, J.-K.; Tsar, K.-S.; Huang, W.-J.; Yang, T.-H.; Chan, D.-C. Fracture types affect clinical outcomes of patients managed within the fracture liaison and osteoporosis medication management services. Sci. Rep. 2019, 9, 10089. [Google Scholar] [CrossRef]
- Chen, F.P.; Fu, T.S.; Lin, Y.C.; Fan, C.M. Risk factors and quality of life for the occurrence of hip fracture in postmenopausal women. Biomed. J. 2018, 41, 202–208. [Google Scholar] [CrossRef] [PubMed] [PubMed Central]
- Dai, Z.; Jin, A.; Soh, A.Z.; Ang, L.-W.; Yuan, J.-M.; Koh, W.-P. Coffee and tea drinking in relation to risk of hip fracture in the Singapore Chinese Health Study. Bone 2018, 112, 51–57. [Google Scholar] [CrossRef]
- Enns-Bray, W.S.; Bahaloo, H.; Fleps, I.; Pauchard, Y.; Taghizadeh, E.; Sigurdsson, S.; Aspelund, T.; Buechler, P.; Harris, T.; Gudnason, V.; et al. Biofidelic finite element models for accurately classifying hip fracture in a retrospective clinical study of elderly women from the AGES Reykjavik cohort. Bone 2019, 120, 25–37. [Google Scholar] [CrossRef]
- Fernandez-Ruiz, M.; Guerra-Vales, J.M.; Trincado, R.; Medrano, M.J.; Benito-Leon, J.; Bermejo-Pareja, F. Hip fracture in three elderly populations of central Spain: Data from the NEDICES study. Intern. Emerg. Med. 2014, 9, 33–41. [Google Scholar] [CrossRef] [PubMed]
- Fisher, A.; Srikusalanukul, W.; Fisher, L.; Smith, P.N. Lower serum PINP/beta CTX ratio and hypoalbuminemia are independently associated with osteoporotic nonvertebral fractures in older adults. Clin. Interv. Aging 2017, 12, 1131–1140. [Google Scholar] [CrossRef]
- Fox, K.M.; Cummings, S.R.; Williams, E.; Stone, K.; Study of Osteoporotic, F. Femoral neck and intertrochanteric fractures have different risk factors: A prospective study. Osteoporos. Int. 2000, 11, 1018–1023. [Google Scholar] [CrossRef] [PubMed]
- Grisso, J.A.; Kelsey, J.L.; O’Brien, L.A.; Miles, C.G.; Sidney, S.; Maislin, G.; LaPann, K.; Moritz, D.; Peters, B. Risk factors for hip fracture in men. Hip Fracture Study Group. Am. J. Epidemiol. 1997, 145, 786–793. [Google Scholar] [CrossRef] [PubMed]
- Hansen, L.; Judge, A.; Javaid, M.K.; Cooper, C.; Vestergaard, P.; Abrahamsen, B.; Harvey, N.C. Social inequality and fracturessecular trends in the Danish population: A case-control study. Osteoporos. Int. 2018, 29, 2243–2250. [Google Scholar] [CrossRef]
- Holvik, K.; Meyer, H.E.; Laake, I.; Feskanich, D.; Omsland, T.K.; Sogaard, A.-J. Milk drinking and risk of hip fracture: The Norwegian Epidemiologic Osteoporosis Studies (NOREPOS). Br. J. Nutr. 2019, 121, 709–718. [Google Scholar] [CrossRef]
- Hong, N.; Park, H.; Kim, C.O.; Kim, H.C.; Choi, J.-Y.; Kim, H.; Rhee, Y. Bone Radiomics Score Derived from DXA Hip Images Enhances Hip Fracture Prediction in Older Women. J. Bone Miner. Res. 2021, 36, 1708–1716. [Google Scholar] [CrossRef]
- Huang, Z.; Himes, J.H.; McGovern, P.G. Nutrition and subsequent hip fracture risk among a national cohort of white women. Am. J. Epidemiol. 1996, 144, 124–134. [Google Scholar] [CrossRef] [PubMed]
- Humbert, L.; Bague, A.; Di Gregorio, S.; Winzenrieth, R.; Sevillano, X.; Gonzalez Ballester, M.A.; Del Rio, L. DXA-Based 3D Analysis of the Cortical and Trabecular Bone of Hip Fracture Postmenopausal Women: A Case-Control Study. J. Clin. Densitom. 2020, 23, 403–410. [Google Scholar] [CrossRef]
- Hundrup, Y.A.; Ekholm, O.; Hoidrup, S.; Davidsen, M.; Obel, E.B. Risk factors for hip fracture and a possible effect modification by hormone replacement therapy. The Danish nurse cohort study. Eur. J. Epidemiol. 2005, 20, 871–877. [Google Scholar] [CrossRef] [PubMed]
- Hung, S.-C.; Liao, K.-F.; Hung, H.-C.; Lin, C.-L.; Lee, P.-C.; Hung, S.-J.; Lai, S.-W. Tamoxifen use correlates with increased risk of hip fractures in older women with breast cancer: A case-control study in Taiwan. Geriatr. Gerontol. Int. 2019, 19, 56–60. [Google Scholar] [CrossRef]
- Hwang, H.F.; Lee, H.D.; Huang, H.H.; Chen, C.Y.; Lin, M.R. Fall mechanisms, bone strength, and hip fractures in elderly men and women in Taiwan. Osteoporos. Int. 2011, 22, 2385–2393. [Google Scholar] [CrossRef] [PubMed]
- Iki, M.; Winzenrieth, R.; Tamaki, J.; Sato, Y.; Dongmei, N.; Kajita, E.; Kouda, K.; Yura, A.; Tachiki, T.; Kamiya, K.; et al. Predictive ability of novel volumetric and geometric indices derived from dual-energy X-ray absorptiometric images of the proximal femur for hip fracture compared with conventional areal bone mineral density: The Japanese Population-based Osteoporosis (JPOS) Cohort Study. Osteoporos. Int. 2021, 32, 2289–2299. [Google Scholar] [CrossRef]
- Jha, R.M.; Mithal, A.; Malhotra, N.; Brown, E.M. Pilot case-control investigation of risk factors for hip fractures in the urban Indian population. BMC Musculoskelet. Disord. 2010, 11, 49. [Google Scholar] [CrossRef] [PubMed] [PubMed Central]
- Kauppi, M.; Stenholm, S.; Impivaara, O.; Maki, J.; Heliovaara, M.; Jula, A. Fall-related risk factors and heel quantitative ultrasound in the assessment of hip fracture risk: A 10-year follow-up of a nationally representative adult population sample. Osteoporos. Int. 2014, 25, 1685–1695. [Google Scholar] [CrossRef] [PubMed]
- Khandelwal, S.; Chandra, M.; Lo, J.C. Clinical characteristics, bone mineral density and non-vertebral osteoporotic fracture outcomes among post-menopausal U.S. South Asian Women. Bone 2012, 51, 1025–1028. [Google Scholar] [CrossRef] [PubMed]
- Kim, J.; Jang, S.-N.; Lim, J.-Y. Pre-Existing Disability and Its Risk of Fragility Hip Fracture in Older Adults. Int. J. Environ. Res. Public Health 2019, 16, 1237. [Google Scholar] [CrossRef]
- Komorita, Y.; Iwase, M.; Idewaki, Y.; Fujii, H.; Ohkuma, T.; Ide, H.; Jodai-Kitamura, T.; Yoshinari, M.; Murao-Kimura, A.; Oku, Y.; et al. Impact of hip fracture on all-cause mortality in Japanese patients with type 2 diabetes mellitus: The Fukuoka Diabetes Registry. J. Diabetes Investig. 2020, 11, 62–69. [Google Scholar] [CrossRef]
- Lam, M.-T.; Sing, C.-W.; Li, G.H.Y.; Kung, A.W.C.; Tan, K.C.B.; Cheung, C.-L. Development and Validation of a Risk Score to Predict the First Hip Fracture in the Oldest Old: A Retrospective Cohort Study. J. Gerontol. Ser. A-Biol. Sci. Med. Sci. 2020, 75, 980–986. [Google Scholar] [CrossRef]
- Leslie, W.D.; Lix, L.M.; Majumdar, S.R.; Morin, S.N.; Johansson, H.; Oden, A.; McCloskey, E.V.; Kanis, J.A. Total Hip Bone Area Affects Fracture Prediction with FRAX (R) in Canadian White Women. J. Clin. Endocrinol. Metab. 2017, 102, 4242–4249. [Google Scholar] [CrossRef]
- Lin, J.-C.; Liu, Z.-G.; Liu, R.-R.; Xie, L.-W.; Xie, H.-L.; Cai, H.-G. The increase of osteopontin and beta-carboxy-terminal cross-linking telopeptide of type I collagen enhances the risk of hip fracture in the elderly. J. Clin. Lab. Anal. 2020, 34, e23204. [Google Scholar] [CrossRef]
- Lin, C.C.; Li, C.I.; Liu, C.S.; Wang, M.C.; Lin, C.H.; Lin, W.Y.; Yang, S.Y.; Li, T.C. Lifetime risks of hip fracture in patients with type 2 diabetic: Taiwan Diabetes Study. Osteoporos. Int. 2021, 32, 2571–2582. [Google Scholar] [CrossRef] [PubMed]
- Liu, Z.; Gao, H.; Bai, X.; Zhao, L.; Li, Y.; Wang, B. Evaluation of Singh Index and Osteoporosis Self-Assessment Tool for Asians as risk assessment tools of hip fracture in patients with type 2 diabetes mellitus. J. Orthop. Surg. Res. 2017, 12, 37. [Google Scholar] [CrossRef]
- Liu, Y.; Guo, Y.-L.; Meng, S.; Gao, H.; Sui, L.-J.; Jin, S.; Li, Y.; Fan, S.-G. Gut microbiota-dependent Trimethylamine N-Oxide are related with hip fracture in postmenopausal women: A matched case-control study. Aging-Us 2020, 12, 10633–10641. [Google Scholar] [CrossRef]
- Liu, Z.M.; Huang, Q.; Li, S.Y.; Liu, Y.P.; Wu, Y.; Zhang, S.J.; Li, B.L.; Chen, Y.M. A 1:1 matched case-control study on dietary protein intakes and hip fracture risk in Chinese elderly men and women. Osteoporos. Int. 2021, 32, 2205–2216. [Google Scholar] [CrossRef] [PubMed]
- Lobo, E.; Marcos, G.; Santabarbara, J.; Salvador-Roses, H.; Lobo-Escolar, L.; De la Camara, C.; Aso, A.; Lobo-Escolar, A.; Zarademp, W. Gender differences in the incidence of and risk factors for hip fracture: A 16-year longitudinal study in a southern European population. Maturitas 2017, 97, 38–43. [Google Scholar] [CrossRef]
- Min, D.; Lee, H.S.; Shin, M. Consequences of fall-induced hip fractures on cognitive function, physical activity, and mortality: Korean longitudinal study of aging 2006–2016. Inj.-Int. J. Care Inj. 2021, 52, 933–940. [Google Scholar] [CrossRef]
- Muehlberg, A.; Museyko, O.; Bousson, V.; Pottecher, P.; Laredo, J.-D.; Engelke, K. Three-dimensional Distribution of Muscle and Adipose Tissue of the Thigh at CT: Association with Acute Hip Fracture. Radiology 2019, 290, 426–434. [Google Scholar] [CrossRef]
- Nakatoh, S.; Fujimori, K.; Tamaki, J.; Okimoto, N.; Ogawa, S.; Iki, M. Insufficient persistence of and adherence to osteoporosis pharmacotherapy in Japan. J. Bone Miner. Metab. 2021, 39, 501–509. [Google Scholar] [CrossRef]
- Papadimitriou, N.; Tsilidis, K.K.; Orfanos, P.; Benetou, V.; Ntzani, E.E.; Soerjomataram, I.; Kuenn-Nelen, A.; Pettersson-Kymmer, U.; Eriksson, S.; Brenner, H.; et al. Burden of hip fracture using disability-adjusted life-years: A pooled analysis of prospective cohorts in the CHANCES consortium. Lancet Public Health 2017, 2, E239–E246. [Google Scholar] [CrossRef]
- Ramirez-Martin, R.; Castell Alcala, M.V.; Alarcon, T.; Queipo, R.; Rios German, P.P.; Otero Puime, A.; Ignacio Gonzalez-Montalvo, J. Comprehensive geriatric assessment for identifying older people at risk of hip fracture: Cross-sectional study with comparative group. Fam. Pract. 2017, 34, 679–684. [Google Scholar] [CrossRef]
- Robbins, J.A.; Schott, A.M.; Garnero, P.; Delmas, P.D.; Hans, D.; Meunier, P.J. Risk factors for hip fracture in women with high BMD: EPIDOS study. Osteoporos. Int. 2005, 16, 149–154. [Google Scholar] [CrossRef] [PubMed]
- Robbins, J.; Aragaki, A.K.; Kooperberg, C.; Watts, N.; Wactawski-Wende, J.; Jackson, R.D.; LeBoff, M.S.; Lewis, C.E.; Chen, Z.; Stefanick, M.L.; et al. Factors associated with 5-year risk of hip fracture in postmenopausal women. JAMA 2007, 298, 2389–2398. [Google Scholar] [CrossRef] [PubMed]
- Ruiz Wills, C.; Luis Olivares, A.; Tassani, S.; Ceresa, M.; Zimmer, V.; Gonzalez Ballester, M.A.; Miguel del Rio, L.; Humbert, L.; Noailly, J. 3D patient-specific finite element models of the proximal femur based on DXA towards the classification of fracture and non-fracture cases. Bone 2019, 121, 89–99. [Google Scholar] [CrossRef]
- Saribal, D.; Hocaoglu-Emre, F.S.; Erdogan, S.; Bahtiyar, N.; Okur, S.C.; Mert, M. Inflammatory cytokines IL-6 and TNF- in patients with hip fracture. Osteoporos. Int. 2019, 30, 1025–1031. [Google Scholar] [CrossRef]
- Sarvi, M.N.; Luo, Y. Improving the prediction of sideways fall-induced impact force for women by developing a female-specific equation. J. Biomech. 2019, 88, 64–71. [Google Scholar] [CrossRef]
- Shalev, V.; Moser, S.S.; Goldshtein, I.; Yu, J.; Weil, C.; Ish-Shalom, S.; Rouach, V.; Chodick, G. Adherence with Bisphosphonates and Long-Term Risk of Hip Fractures: A Nested Case-Control Study Using Real-World Data. Ann. Pharmacother. 2017, 51, 757–767. [Google Scholar] [CrossRef]
- Sharifi, M.D.; Mohebbi, M.; Farrokhfar, M.; Farzaneh, R.; Disfani, H.F.; Hashemian, A.M. Analysis of correlation between estradiol and fracture of femur neck. Eur. J. Transl. Myol. 2018, 28, 214–219. [Google Scholar] [CrossRef]
- Su, Y.; Leung, J.; Hans, D.; Aubry-Rozier, B.; Kwok, T. Added clinical use of trabecular bone score to BMD for major osteoporotic fracture prediction in older Chinese people: The Mr. OS and Ms. OS cohort study in Hong Kong. Osteoporos. Int. 2017, 28, 151–160. [Google Scholar] [CrossRef]
- Su, Y.; Kwok, T.C.Y.; Cummings, S.R.; Yip, B.H.K.; Cawthon, P.M. Can Classification and Regression Tree Analysis Help Identify Clinically Meaningful Risk Groups for Hip Fracture Prediction in Older American Men (The MrOS Cohort Study)? JBMR Plus 2019, 3, e10207. [Google Scholar] [CrossRef] [PubMed]
- Takeshima, K.; Nishiwaki, Y.; Suda, Y.; Niki, Y.; Sato, Y.; Kobayashi, T.; Miyamoto, K.; Uchida, H.; Inokuchi, W.; Tsuji, T.; et al. A missense single nucleotide polymorphism in the ALDH2 gene, rs671, is associated with hip fracture. Sci. Rep. 2017, 7, 428. [Google Scholar] [CrossRef]
- Torbergsen, A.C.; Watne, L.O.; Wyller, T.B.; Frihagen, F.; Stromsoe, K.; Bohmer, T.; Mowe, M. Micronutrients and the risk of hip fracture: Case-control study. Clin. Nutr. 2017, 36, 438–443. [Google Scholar] [CrossRef]
- Turner, L.W.; Wang, M.Q.; Fu, Q. Risk factors for hip fracture among southern older women. South. Med. J. 1998, 91, 533–540. [Google Scholar] [CrossRef] [PubMed]
- Valentini, A.; Federici, M.; Cianfarani, M.A.; Tarantino, U.; Bertoli, A. Frailty and nutritional status in older people: The Mini Nutritional Assessment as a screening tool for the identification of frail subjects. Clin. Interv. Aging 2018, 13, 1237–1244. [Google Scholar] [CrossRef]
- Van Den Eeden, S.K.; Barzilay, J.I.; Ettinger, B.; Minkoff, J. Thyroid hormone use and the risk of hip fracture in women > or = 65 years: A case-control study. J. Women’s Health 2003, 12, 27–31. [Google Scholar] [CrossRef] [PubMed]
- Wainwright, S.A.; Marshall, L.M.; Ensrud, K.E.; Cauley, J.A.; Black, D.M.; Hillier, T.A.; Hochberg, M.C.; Vogt, M.T.; Orwoll, E.S.; Study of Osteoporotic Fractures Research, G. Hip fracture in women without osteoporosis. J. Clin. Endocrinol. Metab. 2005, 90, 2787–2793. [Google Scholar] [CrossRef] [PubMed]
- Weber Silva, D.M.; Cochenski Borba, V.Z.; Kanis, J.A. Evaluation of clinical risk factors for osteoporosis and applicability of the FRAX tool in Joinville City, Southern Brazil. Arch. Osteoporos. 2017, 12, 111. [Google Scholar] [CrossRef]
- Wickramarachchi, L.; Peters, J.; Thakrar, A.; Wong, J.M.L.; Mazis, G.; Beckles, V.; Lacey, S.; Chin, K. A dual-site trauma system during COVID-19 pandemic—Our experience in a high-risk area with 60-day mortality report. J. Orthop. 2021, 24, 42–46. [Google Scholar] [CrossRef]
- Yang, L.; Parimi, N.; Orwoll, E.S.; Black, D.M.; Schousboe, J.T.; Eastell, R.; Osteoporotic Fractures Men Mro, S. Association of incident hip fracture with the estimated femoral strength by finite element analysis of DXA scans in the Osteoporotic Fractures in Men (MrOS) study. Osteoporos. Int. 2018, 29, 643–651. [Google Scholar] [CrossRef]
- Yu, Y.-H.; Cheung, W.S.; Miller, D.R.; Steffensen, B. Number of teeth is associated with hip fracture and femoral neck bone mineral density in the NHANES. Arch. Osteoporos. 2021, 16, 105. [Google Scholar] [CrossRef]
- Zhang, Z.-Q.; Cao, W.-T.; Shivappa, N.; Hebert, J.R.; Li, B.-L.; He, J.; Tang, X.-Y.; Liang, Y.-Y.; Chen, Y.-M. Association between Diet Inflammatory Index and Osteoporotic Hip Fracture in Elderly Chinese Population. J. Am. Med. Dir. Assoc. 2017, 18, 671–677. [Google Scholar] [CrossRef]
- Zhang, Y.-W.; Lu, P.-P.; Li, Y.-J.; Dai, G.-C.; Chen, M.-H.; Zhao, Y.-K.; Cao, M.-M.; Rui, Y.-F. Prevalence, Characteristics, and Associated Risk Factors of the Elderly with Hip Fractures: A Cross-Sectional Analysis of NHANES 2005–2010. Clin. Interv. Aging 2021, 16, 177–185. [Google Scholar] [CrossRef]
- Zhuang, H.-f.; Wang, P.-w.; Li, Y.-z.; Lin, J.-k.; Yao, X.-d.; Xu, H. Analysis of Related Factors of Brittle Hip Fracture in Postmenopausal Women with Osteoporosis. Orthop. Surg. 2020, 12, 194–198. [Google Scholar] [CrossRef]
- Zhivodernikov, I.V.; Kirichenko, T.V.; Markina, Y.V.; Postnov, A.Y.; Markin, A.M. Molecular and Cellular Mechanisms of Osteoporosis. Int. J. Mol. Sci. 2023, 24, 15772. [Google Scholar] [CrossRef] [PubMed] [PubMed Central]
- Khosla, S.; Melton, L.J., 3rd; Atkinson, E.J.; O’Fallon, W.M.; Klee, G.G.; Riggs, B.L. Relationship of serum sex steroid levels and bone turnover markers with bone mineral density in men and women: A key role for bioavailable estrogen. J. Clin. Endocrinol. Metab. 1998, 83, 2266–2274. [Google Scholar] [CrossRef] [PubMed]
- Paliwal, P.; Pishesha, N.; Wijaya, D.; Conboy, I.M. Age dependent increase in the levels of osteopontin inhibits skeletal muscle regeneration. Aging 2012, 4, 553–566. [Google Scholar] [CrossRef] [PubMed] [PubMed Central]
- Marks, R.; Allegrante, J.P.; Ronald MacKenzie, C.; Lane, J.M. Hip fractures among the elderly: Causes, consequences and control. Ageing Res. Rev. 2003, 2, 57–93. [Google Scholar] [CrossRef] [PubMed]
- Graafmans, W.C.; Ooms, M.E.; Hofstee, H.M.; Bezemer, P.D.; Bouter, L.M.; Lips, P. Falls in the elderly: A prospective study of risk factors and risk profiles. Am. J. Epidemiol. 1996, 143, 1129–1136. [Google Scholar] [CrossRef] [PubMed]
- Cheng, C.H.; Chen, L.R.; Chen, K.H. Osteoporosis Due to Hormone Imbalance: An Overview of the Effects of Estrogen Deficiency and Glucocorticoid Overuse on Bone Turnover. Int. J. Mol. Sci. 2022, 23, 1376. [Google Scholar] [CrossRef] [PubMed] [PubMed Central]
- Armstrong, M.E.; Cairns, B.J.; Banks, E.; Green, J.; Reeves, G.K.; Beral, V.; Million Women Study, C. Different effects of age, adiposity and physical activity on the risk of ankle, wrist and hip fractures in postmenopausal women. Bone 2012, 50, 1394–1400. [Google Scholar] [CrossRef] [PubMed] [PubMed Central]
- Hariri, A.F.; Almatrafi, M.N.; Zamka, A.B.; Babaker, A.S.; Fallatah, T.M.; Althouwaibi, O.H.; Hamdi, A.S. Relationship between Body Mass Index and T-Scores of Bone Mineral Density in the Hip and Spine Regions among Older Adults with Diabetes: A Retrospective Review. J. Obes. 2019, 2019, 9827403. [Google Scholar] [CrossRef] [PubMed] [PubMed Central]
- Coin, A.; Sergi, G.; Beninca, P.; Lupoli, L.; Cinti, G.; Ferrara, L.; Benedetti, G.; Tomasi, G.; Pisent, C.; Enzi, G. Bone mineral density and body composition in underweight and normal elderly subjects. Osteoporos. Int. 2000, 11, 1043–1050. [Google Scholar] [CrossRef] [PubMed]
- Albertsson, D.; Gause-Nilsson, I.; Mellstrom, D.; Eggertsen, R. Risk group for hip fracture in elderly women identified by primary care questionnaire--clinical implications. Ups. J. Med. Sci. 2006, 111, 179–187. [Google Scholar] [CrossRef] [PubMed]
- Visentin, P.; Ciravegna, R.; Uscello, L.; Molaschi, M.; Fabris, F. Site-specific relative risk of fractures in the institutionalized elderly. Gerontology 1995, 41, 273–279. [Google Scholar] [CrossRef] [PubMed]
- Fujiwara, S.; Kasagi, F.; Masunari, N.; Naito, K.; Suzuki, G.; Fukunaga, M. Fracture prediction from bone mineral density in Japanese men and women. J. Bone Min. Res. 2003, 18, 1547–1553. [Google Scholar] [CrossRef] [PubMed]
- Singh, A.; Varma, A.R. Whole-Body Vibration Therapy as a Modality for Treatment of Senile and Postmenopausal Osteoporosis: A Review Article. Cureus 2023, 15, e33690. [Google Scholar] [CrossRef] [PubMed] [PubMed Central]
- Beeram, I.; Mortensen, S.J.; Yeritsyan, D.; Momenzadeh, K.; von Keudell, A.; Nazarian, A. Multivitamins and risk of fragility hip fracture: A systematic review and meta-analysis. Arch. Osteoporos. 2021, 16, 29. [Google Scholar] [CrossRef] [PubMed]


| Parameter | Description |
|---|---|
| Population | Includes both a healthy population and a population with hip fractures. |
| Intervention/Exposure | Involves examining a series of risk or protective factors associated with hip fractures. |
| Comparison | Compares patients with hip fractures to a healthy control population. |
| Outcome | Focuses on the occurrence of hip fractures as the primary outcome. |
| Study Design | Encompasses case–control and cohort studies. |
| Study | Year | Country | Type of Study | Mean Age | Sex (% Male) | No. Patients with Hip fx | No. Patients w/o Fracture | NOS |
|---|---|---|---|---|---|---|---|---|
| Adams et al. [10] | 2018 | USA | Case–Control | NA | NA | 1306 | 1477 | 8 |
| Al-Algawy et al. [11] | 2019 | Iraq | Case–Control | NA | 38 | 75 | 150 | 3 |
| Albaba et al. [6] | 2012 | USA | Retrospective Cohort | NA | 43 | 265 | 12,385 | 8 |
| Albertsson et al. [12] | 2010 | Sweden | Prospective Cohort | 79.0 | 0 | 7 | 278 | 6 |
| Anastasilakis et al. [13] | 2021 | Greece | Case–Control | NA | 0 | 37 | 32 | 7 |
| Anpalahan et al. [14] | 2014 | Australia | Case–Control | NA | 29 | 245 | 245 | 7 |
| Ardiansyah et al. [15] | 2019 | Indonesia | Case–Control | 75.1 | 26 | 82 | 82 | 7 |
| Bartels et al. [16] | 2019 | Norway | Case–Control | 65.0 | 23 | 50 | 150 | 7 |
| Bruin et al. [17] | 2020 | UK | Cohort | 81.3 | 27 | 23,780 | 44,583 | 8 |
| Chang et al. [18] | 2019 | Taiwan | Cohort | 74.1 | 18 | 166 | 147 | 9 |
| Chen et al. [19] | 2018 | Taiwan | Case–Control | 77.9 | 0 | 100 | 100 | 7 |
| Dai et al. [20] | 2018 | Singapore | Cohort | 56.5 | 44 | 2502 | 60,652 | 9 |
| Enns-Bray et al. [21] | 2019 | Iceland | Case–Control | 77.3 | 0 | 95 | 159 | 7 |
| Fan et al. [19] | 2018 | China | Case–Control | 74.4 | 0 | 277 | 272 | 7 |
| Farahmand et al. [8] | 2000 | Sweden | Case–Control | 71.5 | 0 | 1327 | 3262 | 7 |
| Fernandez-Ruiz et al. [22] | 2014 | Spain | Cohort | 74.3 | 42 | 166 | 5112 | 7 |
| Fisher et al. [23] | 2017 | Australia | Cohort | 78.8 | 33 | 455 | 385 | 7 |
| Fox et al. [24] | 2000 | USA | Cohort | 72.0 | 0 | 501 | 9190 | 9 |
| Grisso et al. [25] | 1997 | USA | Case–Control | NA | 100 | 356 | 402 | 7 |
| Hansen et al. [26] | 2018 | Denmark | Case–Control | 73.9 | 31 | 37,500 | 37,500 | 6 |
| Holvik et al. [27] | 2019 | Norway | Cohort | NA | 49 | 1865 | 33,249 | 8 |
| Hong et al. [28] | 2021 | South Korea | Case–Control | 71.4 | 0 | 177 | 2285 | 7 |
| Huang et al. [29] | 1996 | USA | Prospective Cohort | NA | 0 | 130 | 2383 | 8 |
| Humbert et al. [30] | 2020 | Spain | Case–Control | 68.9 | 0 | 64 | 64 | 7 |
| Hundrup et al. [31] | 2005 | Denmark | Cohort | NA | 0 | 245 | 14,015 | 6 |
| Hung et al. [32] | 2018 | Taiwan | Case–Control | 75.4 | 0 | 762 | 7620 | 6 |
| Hwang et al. [33] | 2011 | Taiwan | Case–Control | 78.0 | 25 | 306 | 306 | 6 |
| Iki et al. [34] | 2021 | Japan | Case–Control | 59.3 | 0 | 68 | 1263 | 7 |
| Jha et al. [35] | 2010 | India | Case–Control | NA | 43 | 100 | 100 | 8 |
| Kauppi et al. [36] | 2014 | Finland | Prospective Cohort | 66.4 | 42 | 96 | 2204 | 7 |
| Khandelwal et al. [37] | 2012 | USA | Retrospective Cohort | 58.4 | 0 | 39 | 7145 | 6 |
| Kim et al. [38] | 2019 | South Korea | Cohort | NA | 39 | 3943 | 86,069 | 8 |
| Komorita et al. [39] | 2020 | Japan | Cohort | 65.0 | 57 | 110 | 4813 | 6 |
| Lam et al. [40] | 2020 | China | Cohort | 83.9 | 39 | 40 | 211 | 9 |
| Leslie et al. [41] | 2017 | Canada | Cohort | 64.3 | 0 | 1369 | 56,739 | 7 |
| Lin et al. [42] | 2020 | China | Cohort | 68.2 | 24 | 108 | 86 | 7 |
| Lin et al. [43] | 2021 | Taiwan | Cohort | 60.5 | 48 | 2061 | 51,167 | 9 |
| Liu et al. [44] | 2017 | China | Case–Control | 73.9 | 0 | 87 | 174 | 7 |
| Liu et al. [45] | 2020 | China | Case–Control | 65.0 | 0 | 286 | 286 | 7 |
| Liu et al. [46] | 2021 | China | Case–Control | 70.3 | 26 | 1064 | 1066 | 9 |
| Lobo et al. [47] | 2016 | Spain | Cohort | 73.4 | 42 | 275 | 4385 | 9 |
| Min et al. [48] | 2020 | South Korea | Cohort | 61.4 | 44 | 306 | 8265 | 8 |
| Muhlberg et al. [49] | 2019 | France and UK | Cohort | 75.9 | 0 | 40 | 55 | 6 |
| Nakatoh et al. [50] | 2021 | Japan | Cohort | 84.6 | NA | 2584 | 48,748 | 8 |
| Papadimitriou et al. [51] | 2017 | Europe and USA (14 countries) | Cohort | NA | 23 | 7724 | 223,880 | 8 |
| Ramirez-Martin et al. [52] | 2017 | Spain | Case–Control | 79.7 | 40 | 509 | 1315 | 7 |
| Robbins et al. [53] | 2005 | France | Prospective Cohort | NA | 0 | 293 | 7304 | 6 |
| Robbins et al. [54] | 2007 | USA | Cohort | NA | 0 | 1132 | 92,544 | 7 |
| Ruiz et al. [55] | 2019 | Spain | Case–Control | NA | 26 | 62 | 49 | 5 |
| Saribal et al. [56] | 2019 | Turkey | Case–Control | 70.5 | 30 | 40 | 40 | 7 |
| Sarvi et al. [57] | 2019 | Canada | Case–Control | 75.4 | 0 | 99 | 294 | 6 |
| Shalev et al. [58] | 2017 | Isael | Case–Control | 73.7 | 0 | 426 | 1278 | 9 |
| Sharifi et al. [59] | 2018 | Iran | Case–Control | 69.7 | 100 | 60 | 60 | 5 |
| Su et al. [60] | 2017 | China | Cohort | 72.4 | 50 | 128 | 3745 | 7 |
| Su et al. [61] | 2019 | USA | Cohort | NA | 100 | 172 | 5802 | 9 |
| Takeshima et al. [62] | 2017 | Japan | Cohort | 79.3 | 0 | 92 | 48 | 7 |
| Torbergsen et al. [63] | 2017 | Norway | Case–Control | 82.6 | 29 | 116 | 73 | 8 |
| Turner et al. [64] | 1998 | USA | Retrospective Cohort | 68.8 | 0 | 195 | 2130 | 6 |
| Valentini et al. [65] | 2018 | Italy | Cohort | 79.1 | NA | 62 | 50 | 7 |
| Van den Eeden et al. [66] | 2003 | USA | Case–Control | NA | 0 | 501 | 533 | 8 |
| Wainwright et al. [67] | 2005 | USA | Cohort | NA | 0 | 243 | 7822 | 9 |
| Weber Silva et al. [68] | 2017 | Brazil | Case–Control | 76.0 | 32 | 213 | 213 | 7 |
| Wickramarachchi et al. [69] | 2021 | UK | Cohort | 59.4 | 49 | 35 | 103 | 6 |
| Yang et al. [70] | 2018 | USA | Cohort | 75.1 | 100 | 170 | 486 | 8 |
| Yu et al. [44] | 2017 | China | Case–Control | 68.9 | 0 | 93 | 50 | 7 |
| Yu et al. [71] | 2021 | USA | Cohort | 53.9 | 52 | 204 | 14,994 | 7 |
| Zhang et al. [72] | 2017 | China | Case–Control | 70.7 | 26 | 1050 | 1050 | 7 |
| Zhang et al. [73] | 2021 | USA | Cohort | 74.2 | 49 | 127 | 4138 | 7 |
| Zhuang et al. [74] | 2020 | China | Cohort | 74.5 | 0 | 135 | 117 | 7 |
| Risk Factor | Beta1 | SE of Beta1 | z | p Value |
|---|---|---|---|---|
| A | ||||
| Age | −1.63 | 3.187 | −0.51 | 0.6085 |
| Sex | −0.76 | 0.465 | −1.62 | 0.1044 |
| Ancestry | −0.71 | 0.685 | −1.03 | 0.301 |
| BMI | 0.56 | 1.716 | 0.33 | 0.7448 |
| Marital Status | 0.73 | 0.791 | 0.92 | 0.3565 |
| Parity | 0.51 | 0.999 | 0.51 | 0.6129 |
| History of Falling | 0.12 | 0.767 | 0.16 | 0.8742 |
| Previous Fracture | 1.61 | 1.214 | 1.33 | 0.1843 |
| Maternal Hip Fracture | −0.38 | 2.338 | −0.16 | 0.8712 |
| Parental Hip Fracture | 1.26 | 1.445 | 0.87 | 0.3846 |
| Residential Care Facility | 2.49 | 2.16 | 1.15 | 0.2496 |
| Rural | −0.32 | 0.771 | −0.42 | 0.6765 |
| B | ||||
| Age | 7.31 | 1.423 | 5.13 | 0.00 |
| Excluding studies with bias | ||||
| −1.18 | 1.771 | −0.66 | 0.5063 | |
| BMI | −10.44 | 1.662 | −6.28 | 0.00 |
| Excluding studies with bias | ||||
| −0.01 | 0.852 | −0.01 | 0.9945 | |
| Weight | 0.87 | 0.754 | 1.15 | 0.2491 |
| Height | 0.57 | 1.383 | 0.41 | 0.6819 |
| Risk Factor | Number of Studies | Studies | Odds Ratio (95% CI) | p Value | |
|---|---|---|---|---|---|
| Age | ≥65 | 3 | Al-Algawy (2019), Lin (2020), Turner (1998) [11,42,64] | 1.66 (0.40, 6.96) | 0.49 |
| ≥85 | 3 | Hung (2018), Kim (2019), Van den Eeden (2003) [32,38,66] | 1.75 (1.28, 2.38) | <0.01 | |
| Sex | Male (reference) | 1.00 | |||
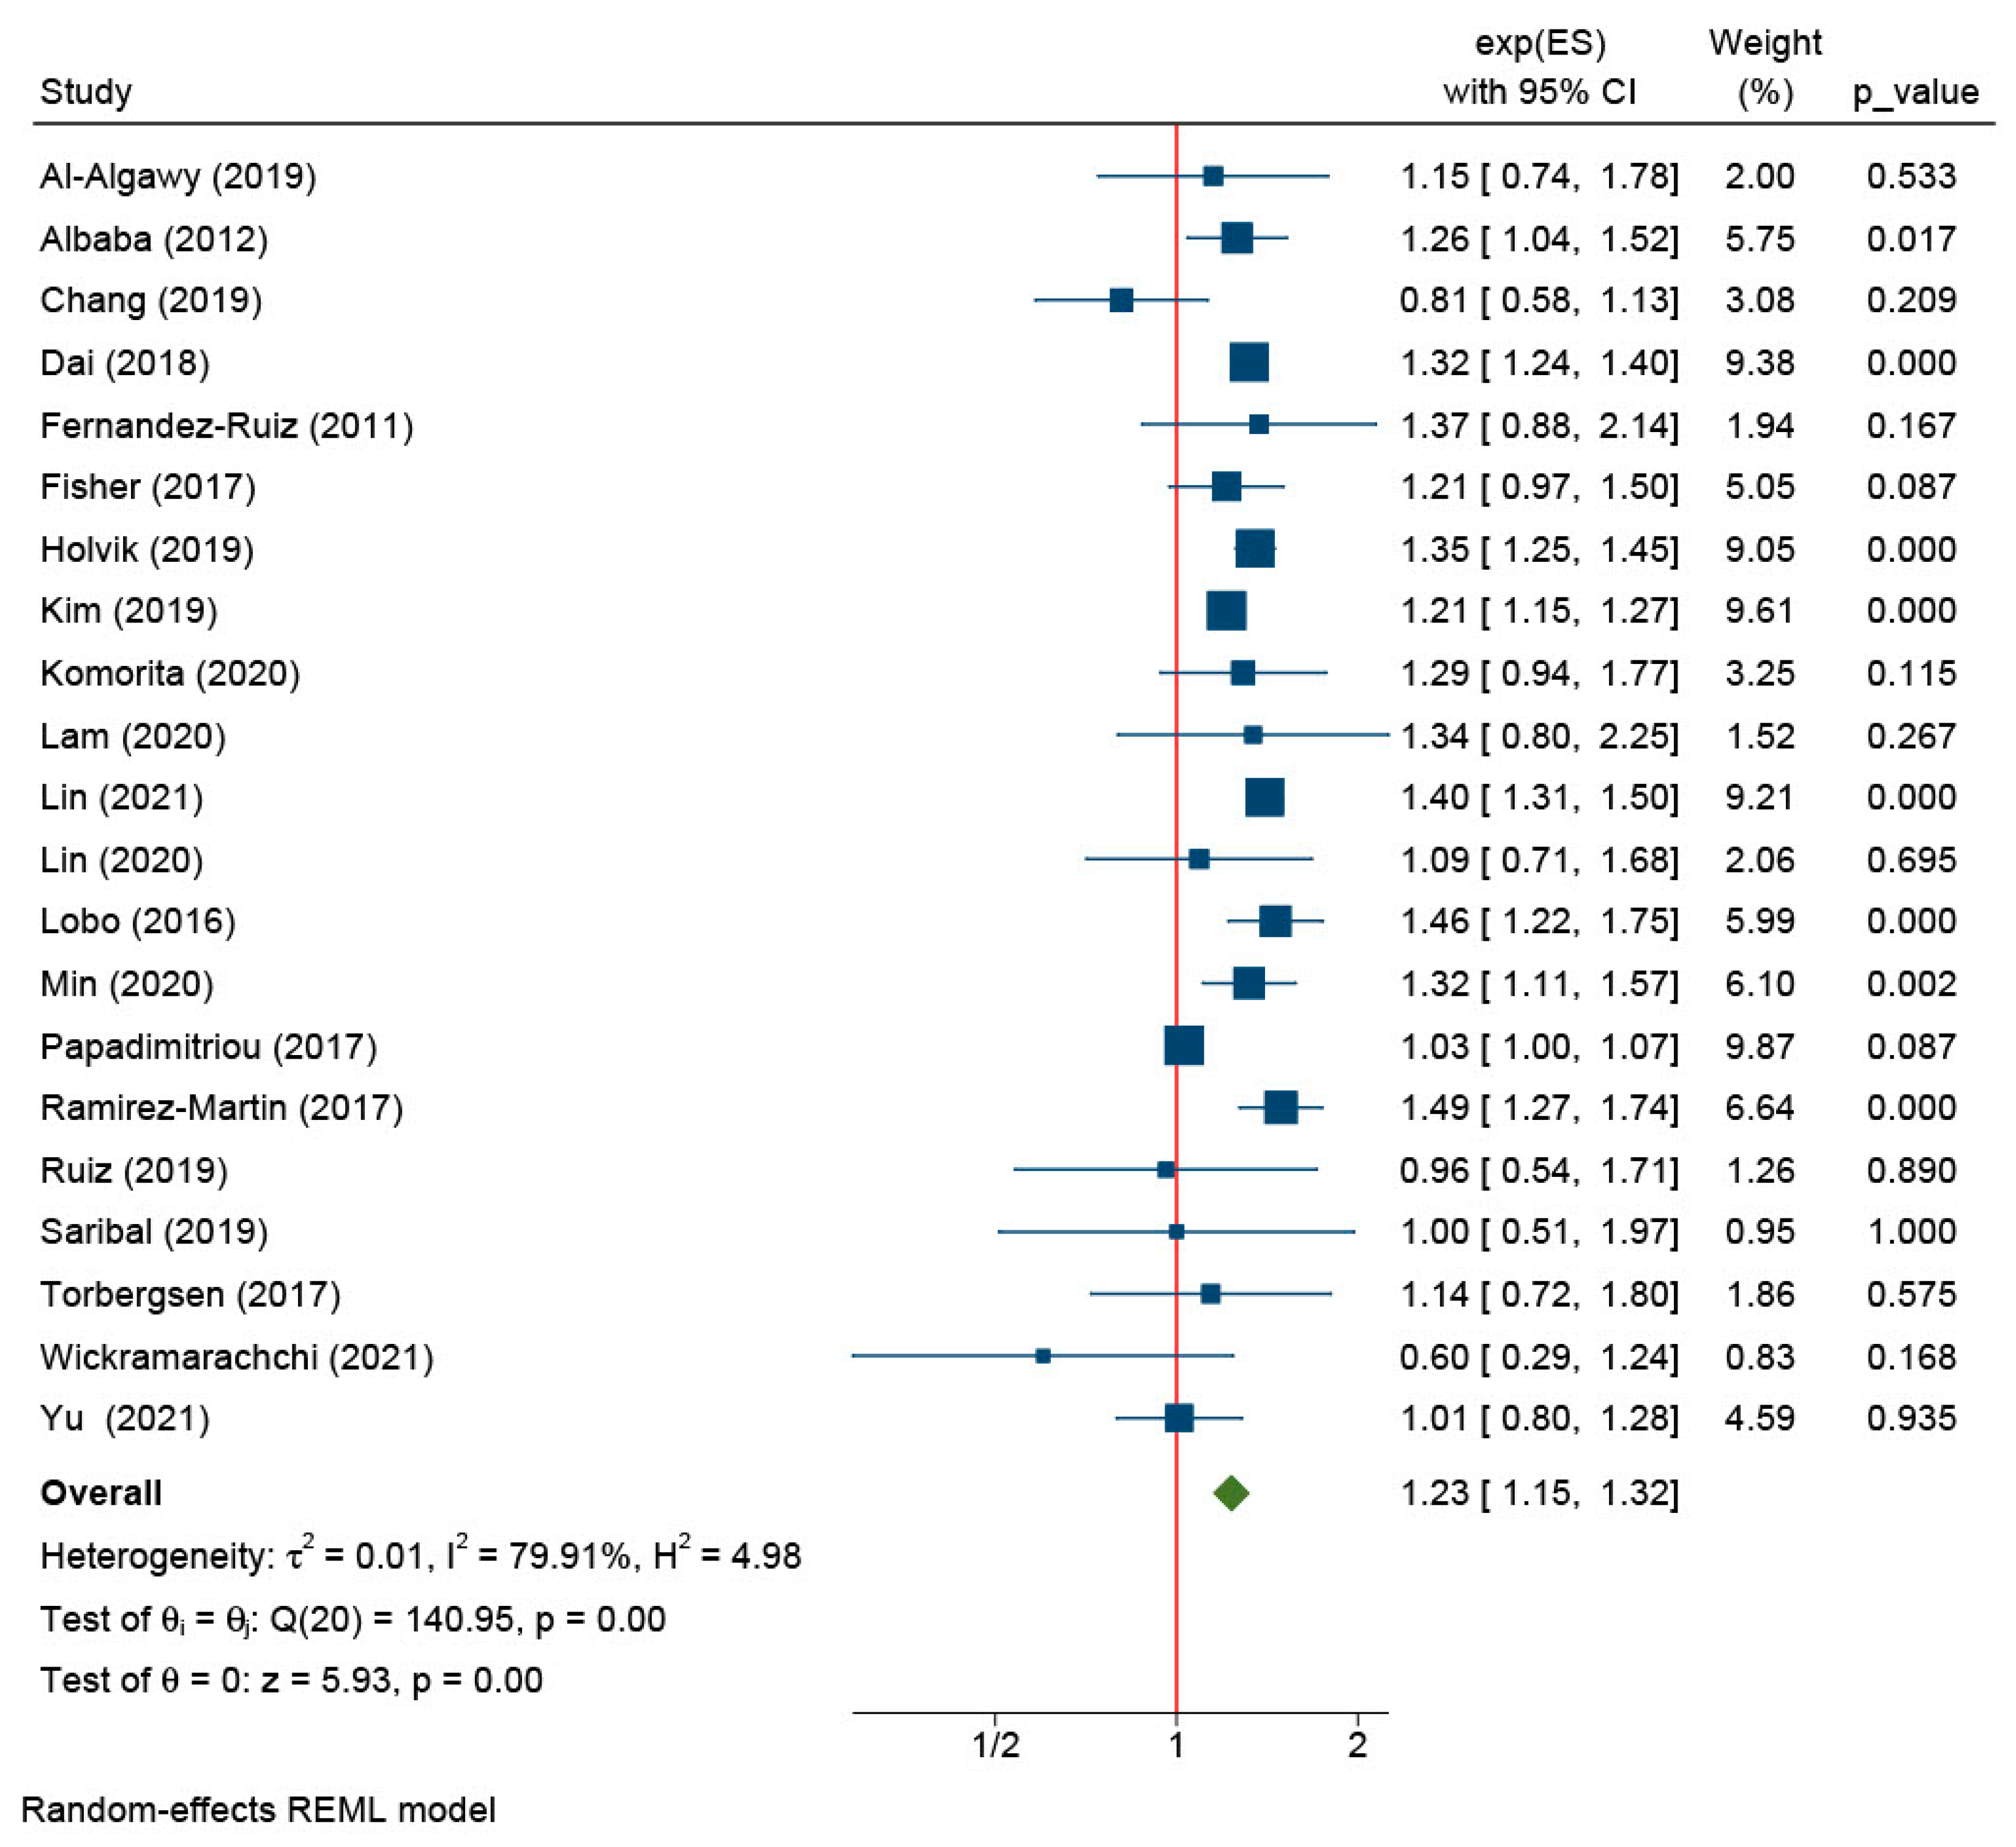
| Female | 21 | Al-Algawy (2019), Albaba (2012), Chang (2019), Dai (2018), Fernandez-Ruiz (2011), Fisher (2017), Holvik (2019), Kim (2019), Komorita (2020), Lam (2020), Lin (2021), Lin (2020), Lobo (2016), Min (2020), Papadimitriou (2017), Ramirez-Martin (2017), Ruiz (2019), Saribal (2019), Torbergsen (2017), Wickramarachchi (2021), and Yu (2021) [6,11,18,20,22,23,27,38,39,40,42,43,47,48,51,52,55,56,63,69,71] | 1.23 (1.15, 1.32) | <0.01 | |
| Ancestry | White (reference) | 1.00 | |||
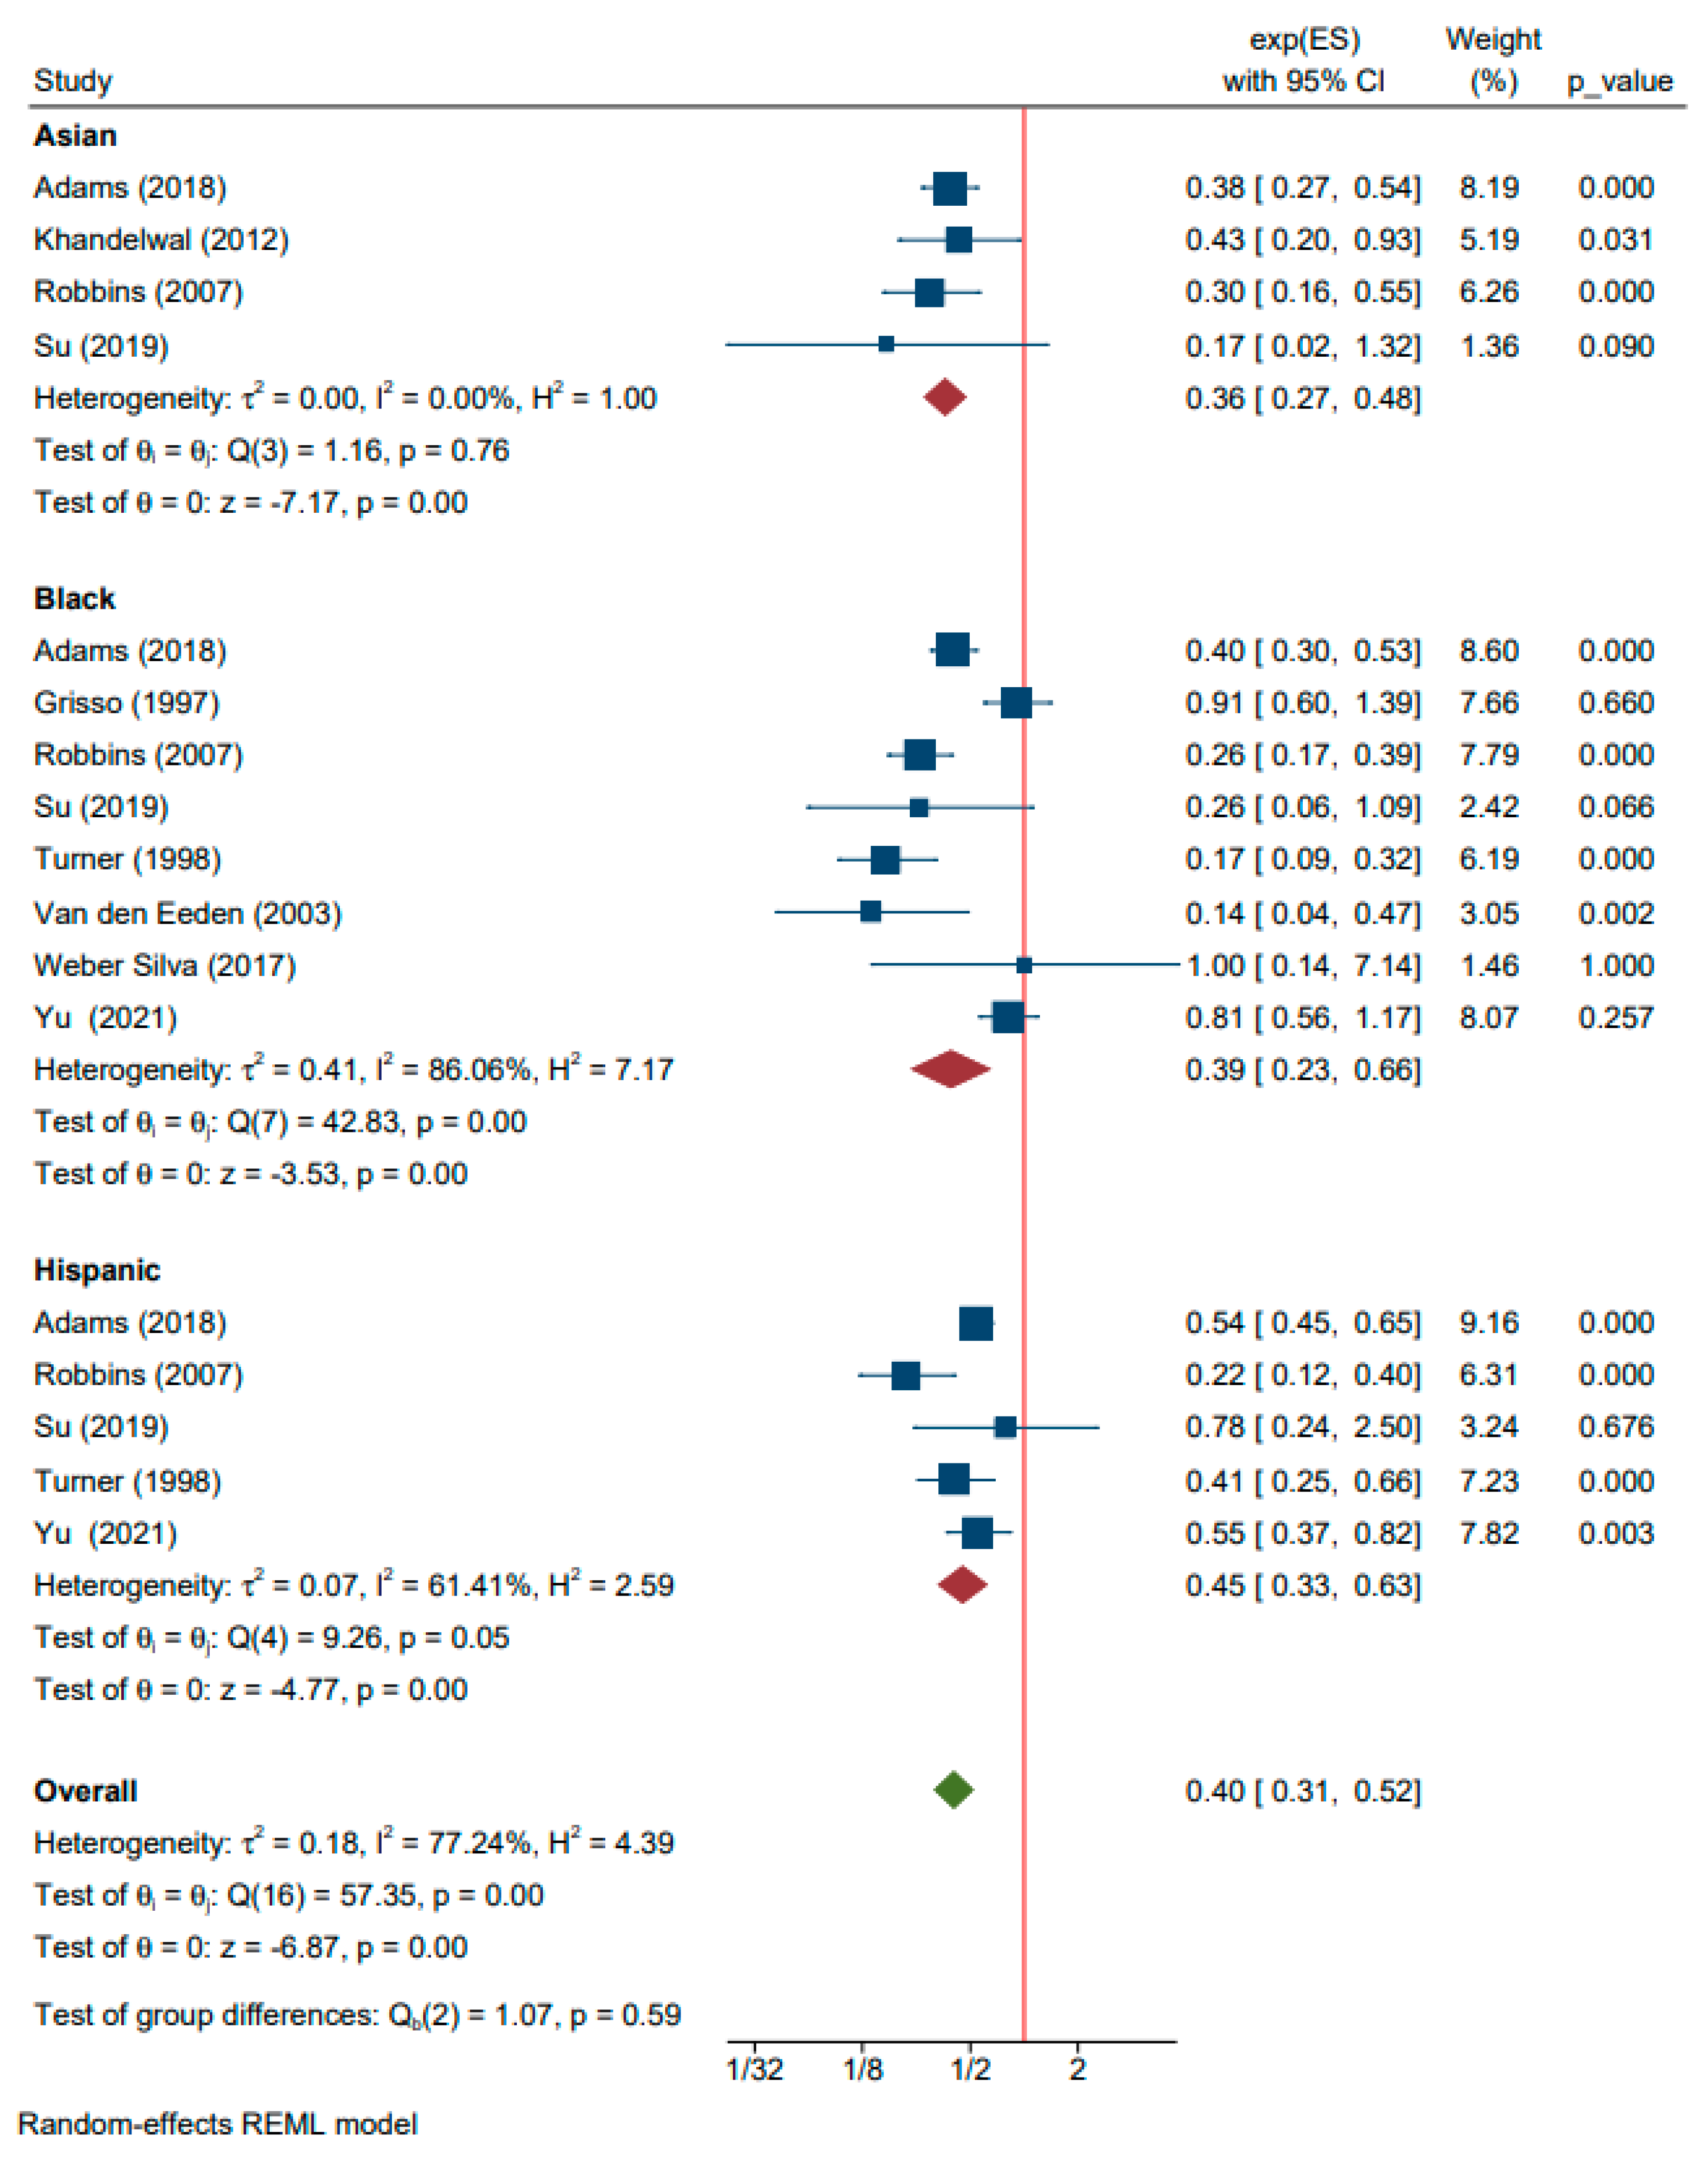
| Asian | 4 | Adams (2018), Khandelwal (2012), Robbins (2007), and Su (2019) [10,37,54,61] | 0.36 (0.27, 0.48) | <0.01 | |
| Black | 8 | Adams (2018), Grisso (1997), Robbins (2007), Su (2019), Turner (1998), Van den Eeden (2003), Weber Silva (2017), and Yu (2021) [10,25,54,61,64,66,68,71] | 0.39 (0.23, 0.66) | <0.01 | |
| Hispanic | 5 | Adams (2018), Robbins (2007), Su (2019), Turner (1998), and Yu (2021) [10,54,61,64,71] | 0.45 (0.33, 0.63) | <0.01 | |
| Non-Caucasian | 9 | Adams (2018), Grisso (1997), Khandelwal (2012), Robbins (2007), Su (2019), Turner (1998), Van den Eeden (2003), Weber Silva (2017), and Yu (2021) [10,25,37,54,61,64,66,68,71] | 0.40 (0.31, 0.52) | <0.01 | |
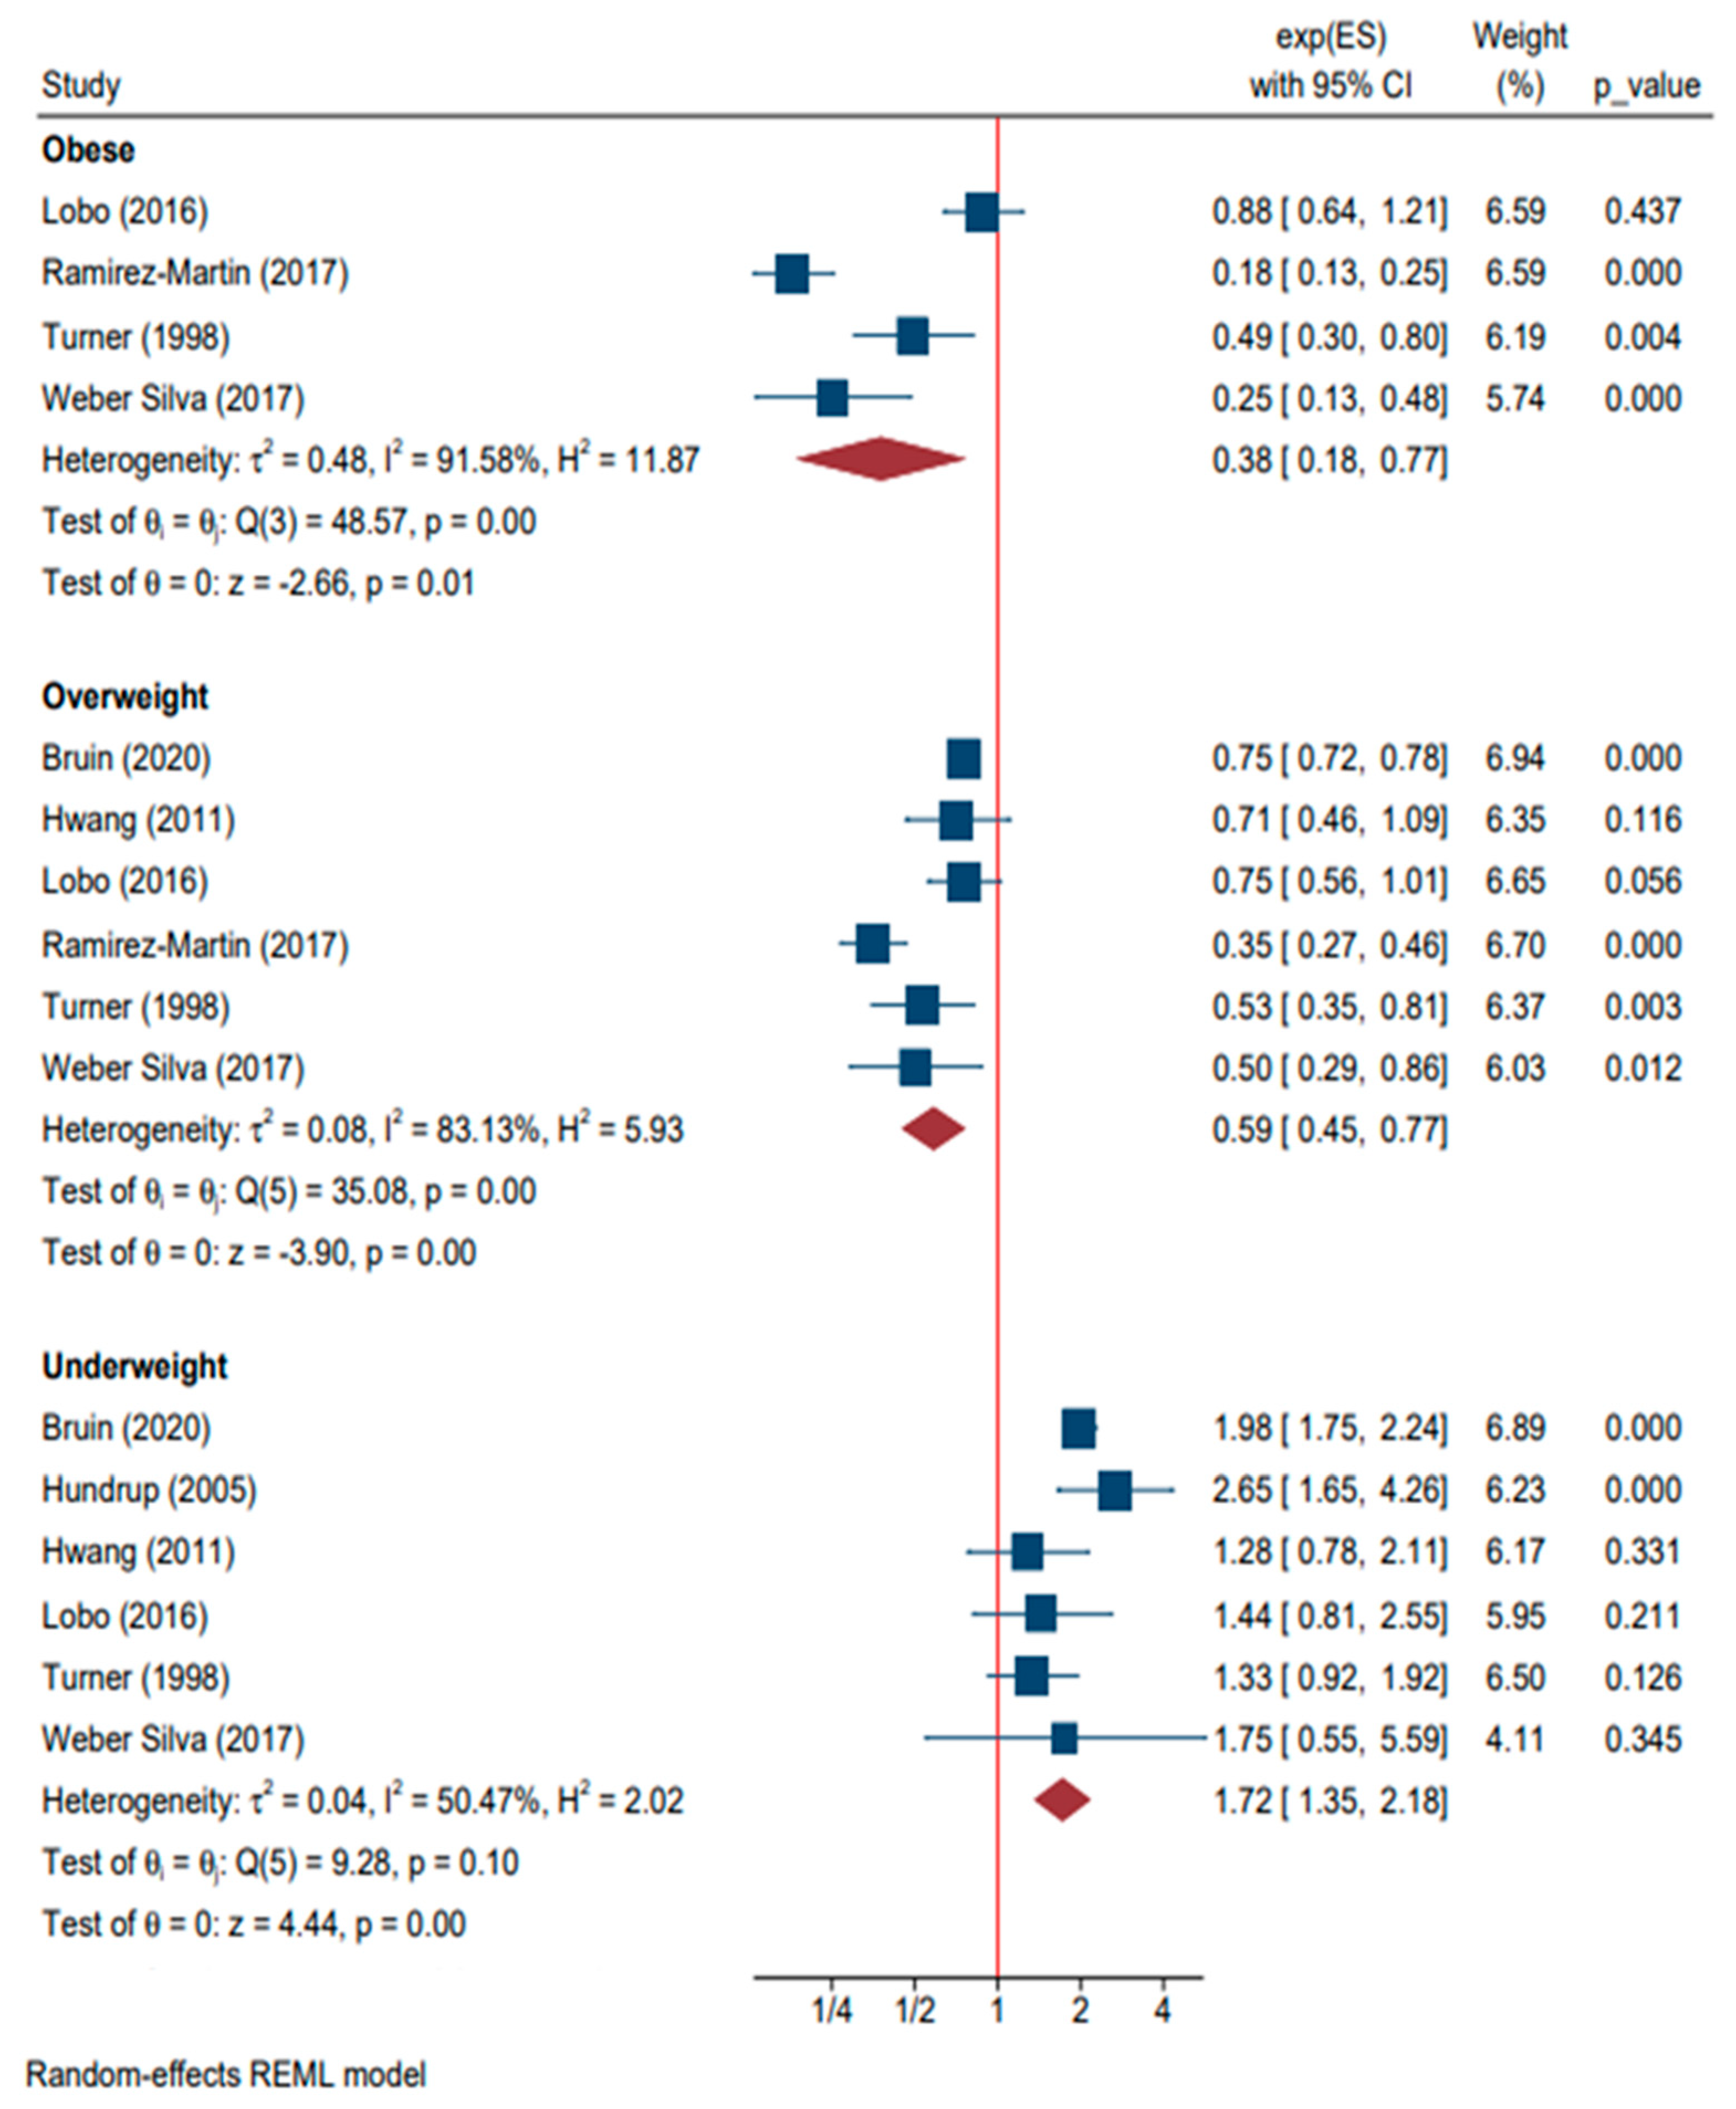
| BMI | Normal (reference) | 1.00 | |||
| Underweight | 6 | Bruin (2020), Hundrup (2005), Hwang (2011), Lobo (2016), Turner (1998), and Weber Silva (2017) [17,31,33,47,64,68] | 1.72 (1.35, 2.18) | <0.01 | |
| Overweight | 6 | Bruin (2020), Hwang (2011), Lobo (2016), Ramirez-Martin (2017), Turner (1998), and Weber Silva (2017) [17,33,47,52,64,68] | 0.59 (0.45, 0.77) | <0.01 | |
| Obese | 4 | Lobo (2016), Ramirez-Martin (2017), Turner (1998), and Weber Silva (2017) [47,52,64,68] | 0.38 (0.18, 0.77) | 0.01 | |
| Marital Status | Married (reference) | 1.00 | |||
| Single and Unmarried | 5 | Farahmand (2000), Fernandez-Ruiz (2014), Grisso (1997), Hansen (2018), and Robbins (2007) [8,22,25,26,54] | 1.70 (1.38, 2.10) | <0.01 | |
| Divorced | 6 | Al-Algawy (2019), Farahmand (2000), Fernandez-Ruiz (2014), Grisso (1997), Hansen (2018), and Robbins (2007) [8,11,22,25,26,54] | 1.38 (1.01, 1.89) | 0.05 | |
| Widowed | 7 | Al-Algawy (2019), Farahmand (2000), Fernandez-Ruiz (2014), Grisso (1997), Hansen (2018), Hwang (2011), and Robbins (2007) [8,11,22,25,26,33,54] | 1.36 (0.91, 2.03) | 0.13 | |
| Parity | 0 (reference) | 1.00 | |||
| ≥1 | 3 | Farahmand (2000), Huang (1996), and Robbins (2007) [8,29,54] | 0.79 (0.69, 0.92) | <0.01 | |
| ≥1 and <3 | 3 | Farahmand (2000), Huang (1996), and Robbins (2007) [8,29,54] | 0.80 (0.71, 0.91) | <0.01 | |
| ≥3 | 3 | Farahmand (2000), Huang (1996), and Robbins (2007) [8,29,54] | 0.77 (0.63, 0.93) | 0.01 | |
| History of Falling | 12 | Albaba (2012), Albertsson (2010), Anpalahan (2014), Bruin (2020), Fox (2000), Hwang (2011), Lam (2020), Lin (2020), Liu (2020), Liu (2021), Su (2019), and Van den Eeden (2003) [6,12,14,17,24,33,40,42,45,46,61,66] | 1.88 (1.43, 2.47) | <0.01 | |
| Previous Fracture | 13 | Albaba (2012), Albertsson (2010), Anpalahan (2014), Bruin (2020), Huang (1996), Lam (2020), Leslie (2017), Lin (2020), Liu (2021), Robbins (2007), Su (2019), Wainwright (2005), and Weber Silva (2017) [6,12,14,17,29,40,41,42,46,54,61,67,68] | 3.16 (2.08, 4.80) | <0.01 | |
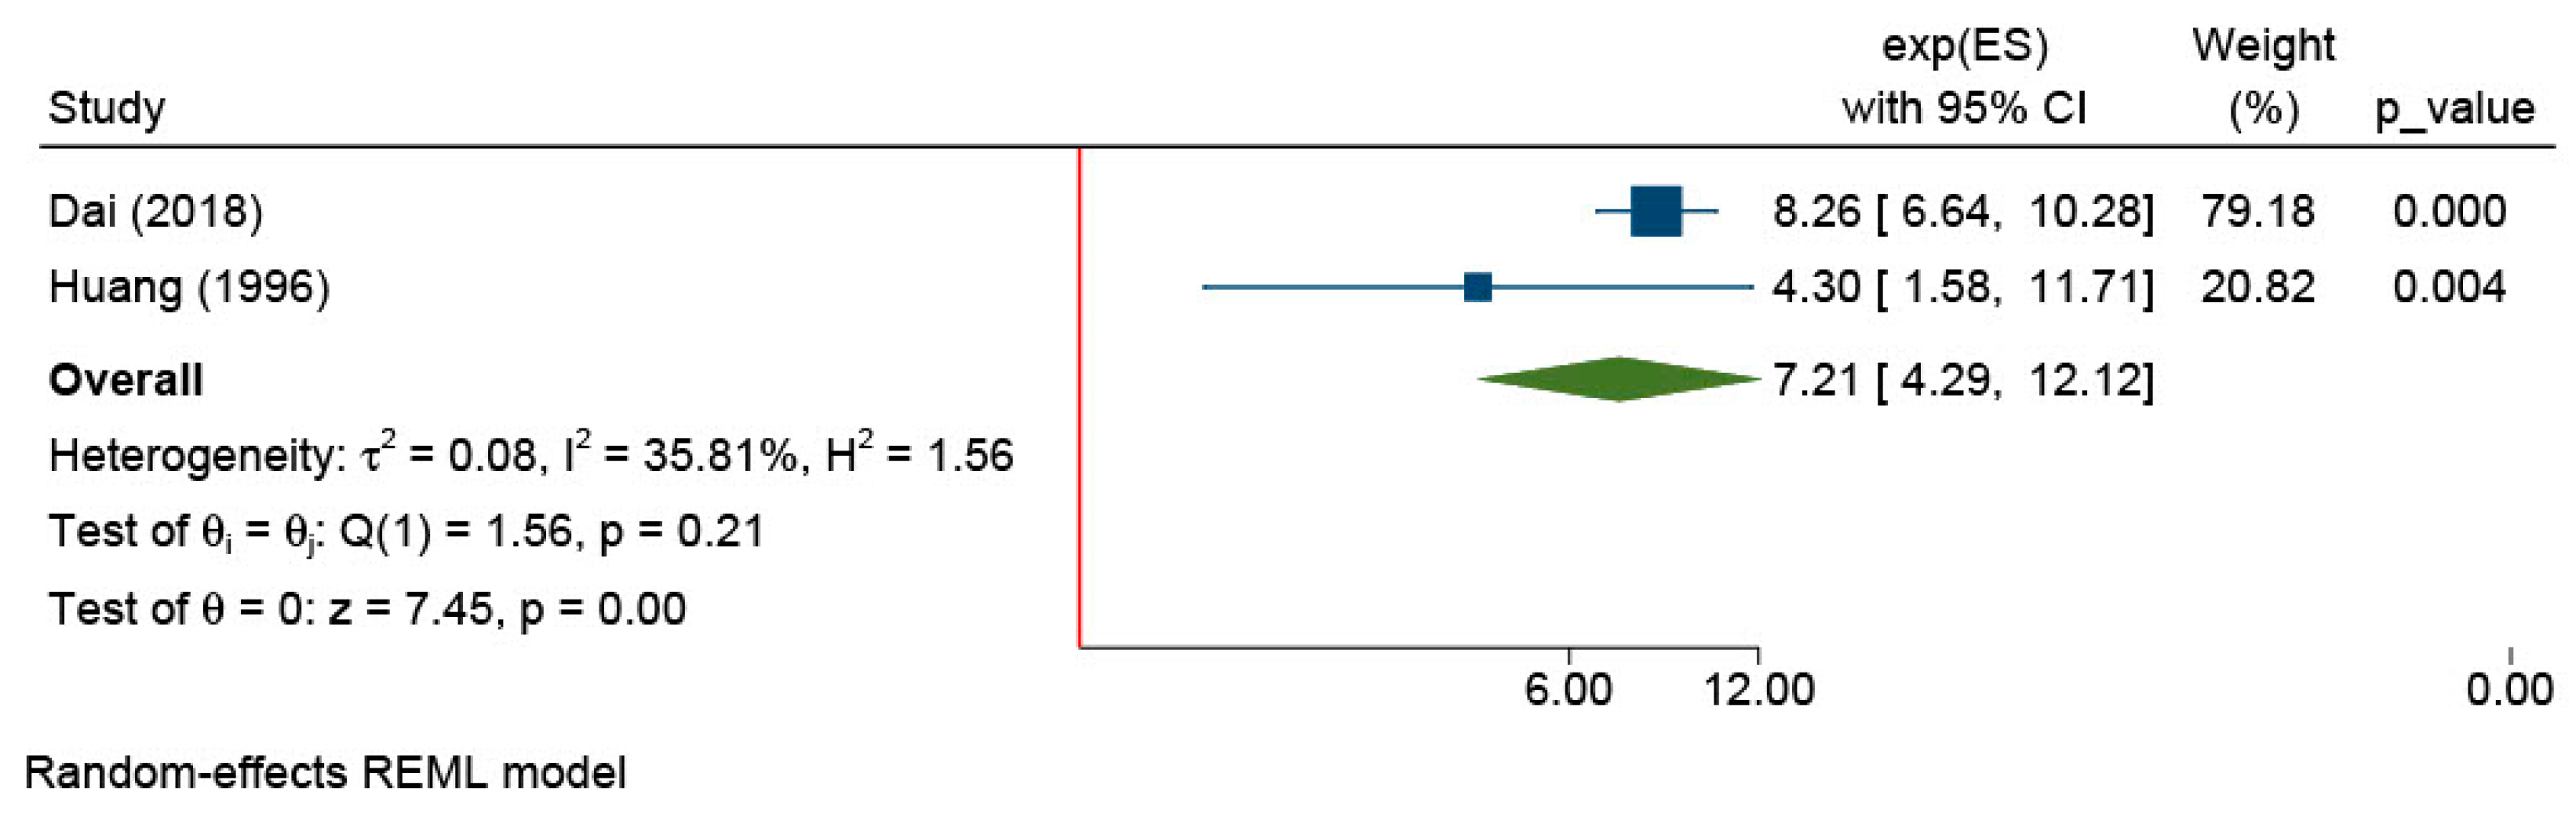
| Menopause | 2 | Dai (2018) and Huang (1996) [20,29] | 7.21 (4.29, 12.12) | <0.01 | |
| Family History | Family History of Osteoporosis | 2 | Hundrup (2005) and Turner (1998) [31,64] | 0.95 (0.68, 1.34) | 0.77 |
| Maternal Hip Fracture | 3 | Fox (2000), Turner (1998), and Zhang (2021) [24,64,73] | 1.63 (1.35, 1.98) | <0.01 | |
| Parental Hip Fracture | 6 | Anpalahan (2014), Hwang (2011), Robbins (2007), Su (2019), Weber Silva (2017), and Zhang (2017) [14,33,54,61,68,72] | 1.42 (0.94, 2.15) | 0.10 | |
| Environmental | Living Alone | 2 | Min (2020) and Zhang (2021) [48,73] | 1.47 (1.15, 1.89) | <0.01 |
| Residential Care Facility | 4 | Albertsson (2010), Anpalahan (2014), Fisher (2017), and Torbergsen (2017) [12,14,23,63] | 5.30 (1.91, 14.75) | <0.01 | |
| Rural | 3 | Al-Algawy (2019), Fernandez-Ruiz (2014), and Hansen (2018) [11,22,26] | 0.95 (0.92, 0.98) | <0.01 | |
| Income | 1st Quintile | 2 | Hansen (2018) and Shalev (2017) [26,58] | 0.86 (0.58, 1.28) | 0.46 |
| 2nd Quintile | 2 | Hansen (2018) and Shalev (2017) [26,58] | 0.76 (0.48, 1.22) | 0.26 | |
| 3rd Quintile (reference) | 1.00 | ||||
| 4th Quintile | 2 | Hansen (2018) and Shalev (2017) [26,58] | 0.83 (0.56, 1.23) | 0.34 | |
| 5th Quintile | 2 | Hansen (2018) and Shalev (2017) [26,58] | 0.65 (0.43, 1.00) | 0.05 | |
| Risk Factor | Number of Studies | Cohen’s d (95% CI) | p Value | |
|---|---|---|---|---|
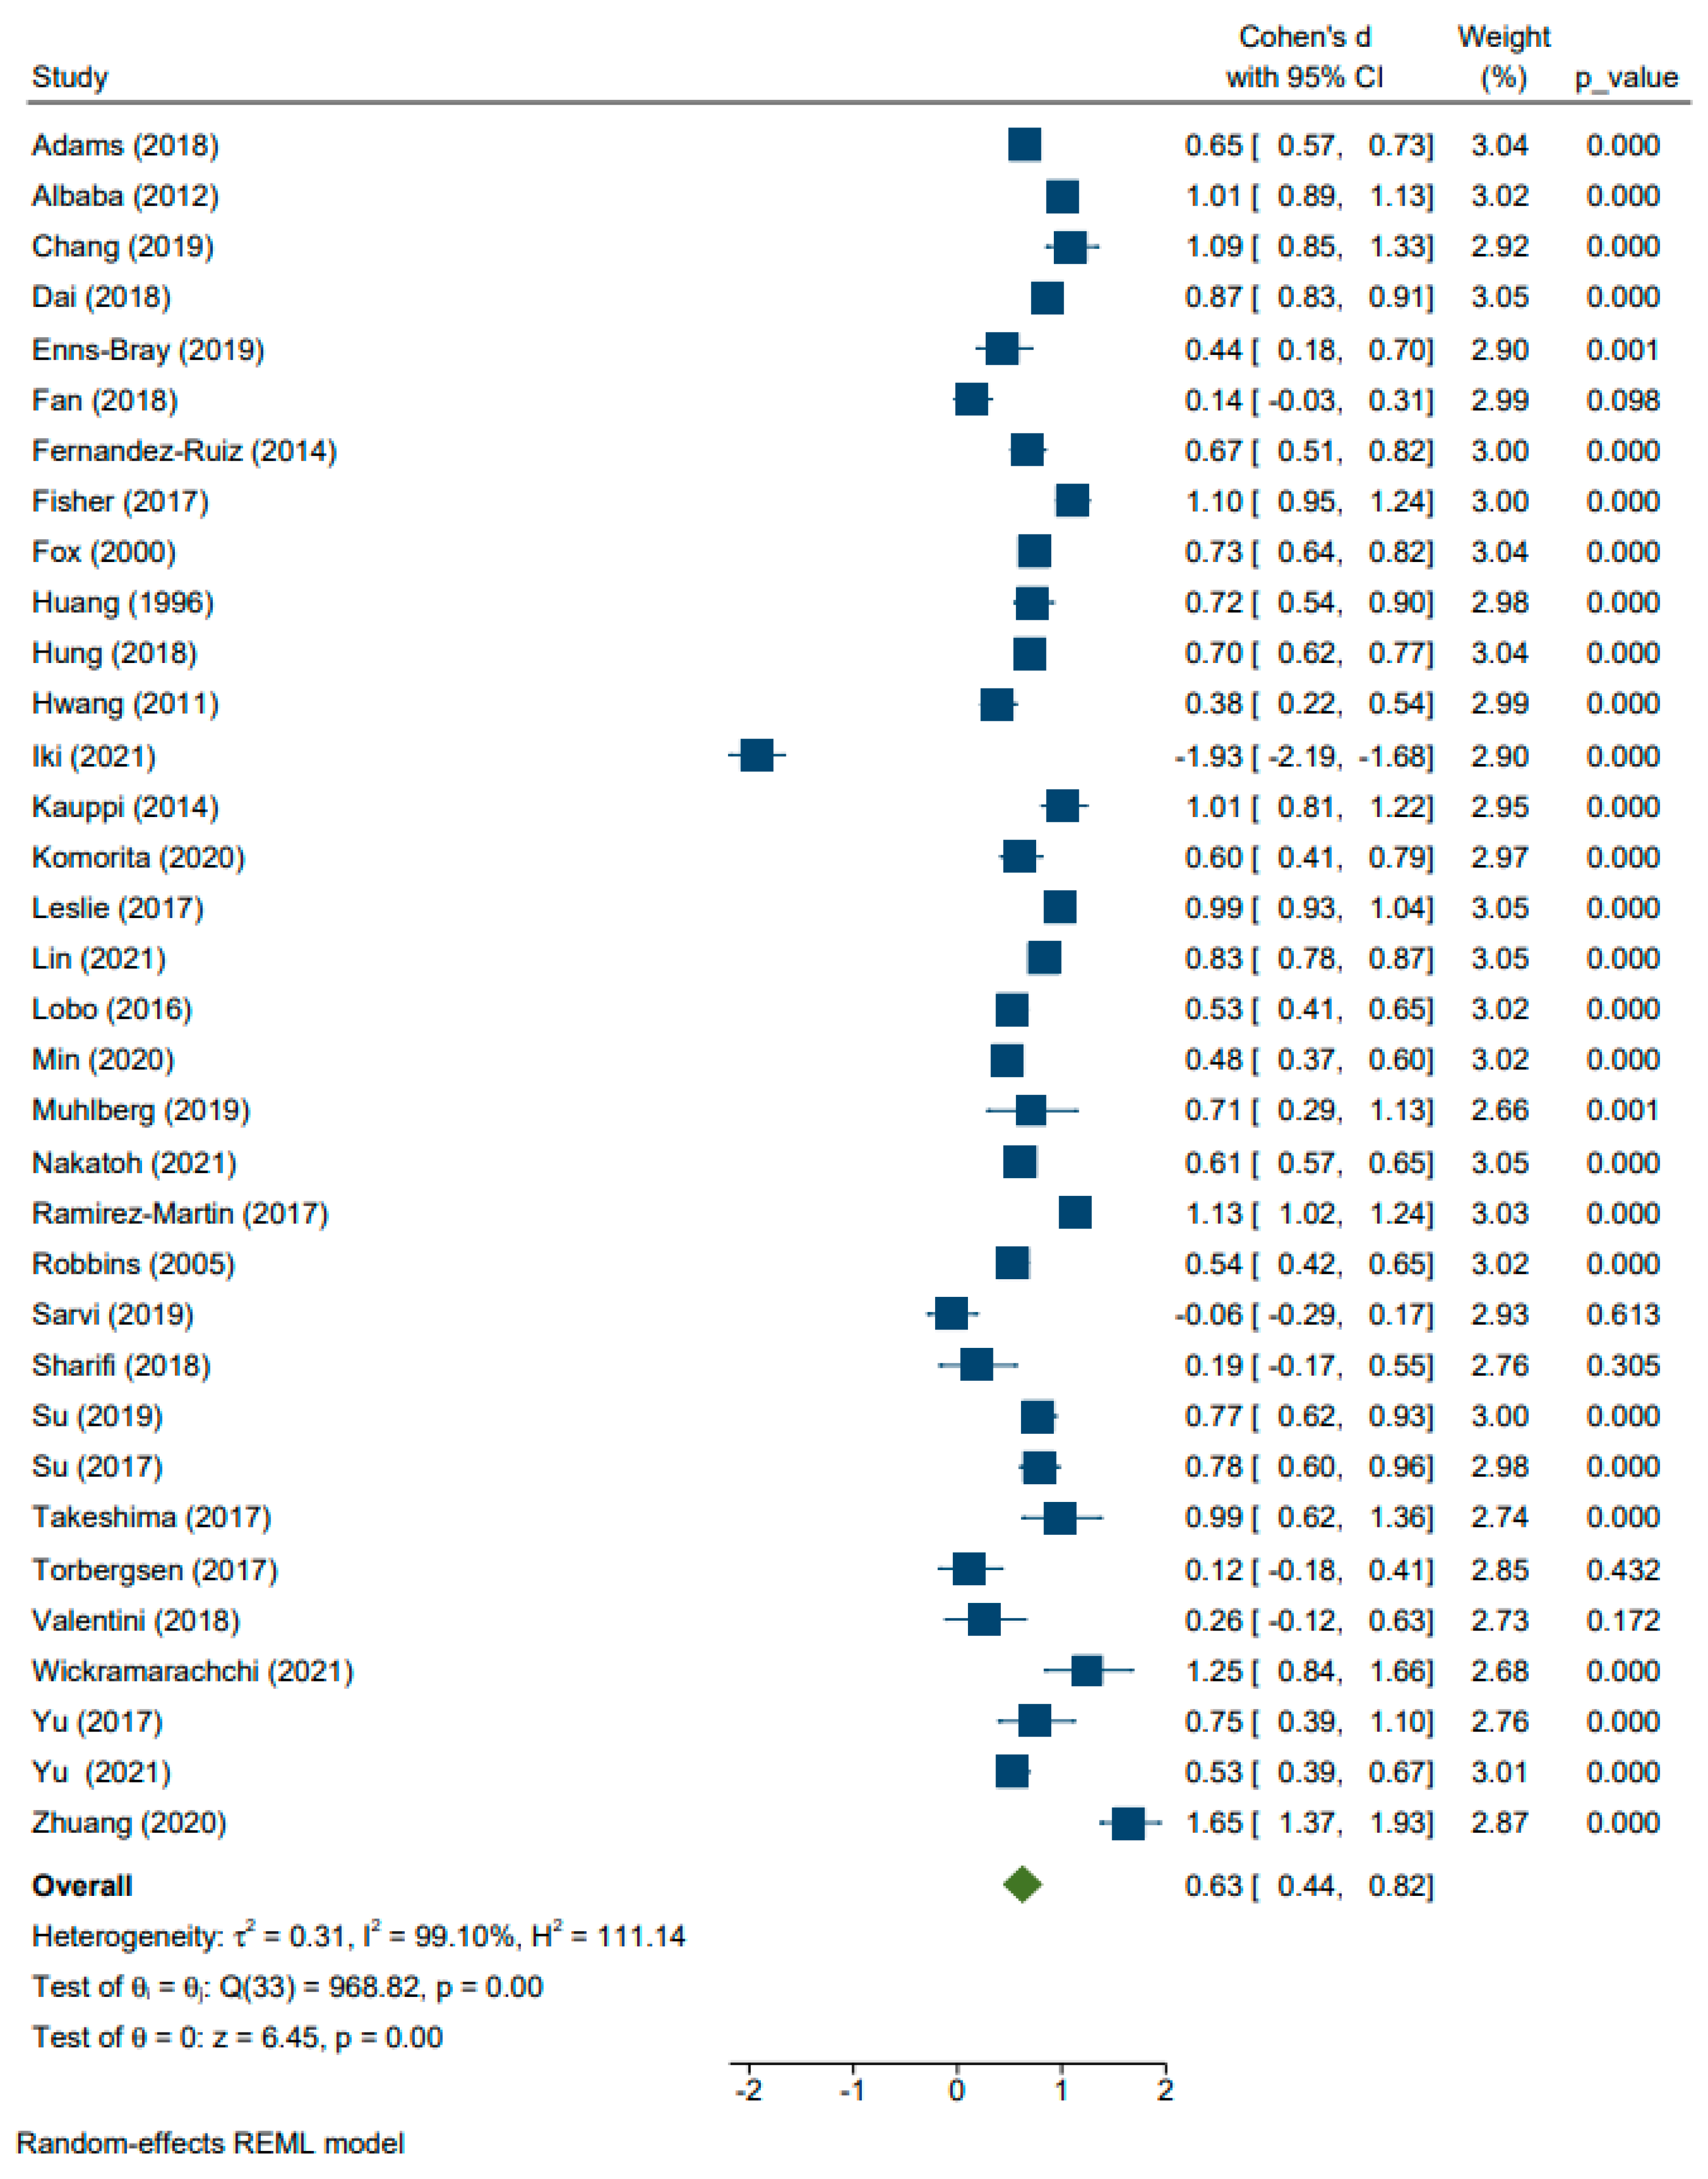
| Age | 34 | Adams (2018), Albaba (2012), Chang (2019), Dai (2018), Enns-Bray (2019), Fan (2018), Fernandez-Ruiz (2014), Fisher (2017), Fox (2000), Huang (1996), Hung (2018), Hwang (2011), Iki (2021), Kauppi (2014), Komorita (2020), Leslie (2017), Lin (2021), Lobo (2016), Min (2020), Muhlberg (2019), Nakatoh (2021), Ramirez-Martin (2017), Robbins (2005), Sarvi (2019), Sharifi (2018), Su (2019), Su (2017), Takeshima (2017), Torbergsen (2017), Valentini (2018), Wickramarachchi (2021), Yu (2017), Yu (2021), and Zhuang (2020) [6,10,18,19,20,21,22,23,24,29,32,33,34,36,39,41,43,44,47,48,49,50,52,53,57,59,60,61,62,63,65,69,71,74] | 0.63 (0.44, 0.82) | <0.01 |
| BMI | 26 | Adams (2018), Ardiansyah (2019), Bruin (2020), Chang (2019), Chen (2018), Dai (2018), Fan (2018), Farahmand (2000), Hong (2021), Huang (1996), Humbert (2020), Jha (2010), Komorita (2020), Leslie (2017), Liu (2017), Liu (2021), Lobo (2016), Min (2020), Su (2019), Su (2017), Takeshima (2017), Torbergsen (2017), Valentini (2018), Wainwright (2005), Yu (2021), and Zhuang (2020) [8,10,15,17,18,19,20,28,29,30,35,39,41,44,46,47,48,60,61,62,63,65,67,71,74] | −0.29 (−0.37, −0.21) | <0.01 |
| Weight | 25 | Anpalahan (2014), Ardiansyah (2019), Chang (2019), Chen (2018), Enns-Bray (2019), Fan (2018), Fox (2000), Huang (1996), Humbert (2020), Iki (2021), Jha (2010), Kauppi (2014), Lam (2020), Leslie (2017), Liu (2021), Liu (2017), Muhlberg (2019), Robbins (2005), Robbins (2007), Sarvi (2019), Sharifi (2018), Su (2017), Takeshima (2017), Yang (2018), and Yu (2017) [14,15,18,19,21,24,29,30,34,35,36,40,41,44,46,49,53,54,57,59,60,62,70] | −0.23 (−0.30, −0.15) | <0.01 |
| Height | 20 | Ardiansyah (2019), Chang (2019), Chen (2018), Enns-Bray (2019), Fan (2018), Fox (2000), Huang (1996), Humbert (2020), Iki (2021), Jha (2010), Kauppi (2014), Leslie (2017), Liu (2017), Muhlberg (2019), Robbins (2007), Sarvi (2019), Su (2017), Takeshima (2017), Yang (2018), and Yu (2017) [15,18,19,21,24,29,30,34,35,36,41,44,49,54,57,60,62,70] | −0.00 (−0.13, 0.13) | 0.96 |
| Menopause age | 2 | Chen (2018) and Hwang (2011) [19,33] | −0.14 (−0.29, 0.02) | 0.09 |
Disclaimer/Publisher’s Note: The statements, opinions and data contained in all publications are solely those of the individual author(s) and contributor(s) and not of MDPI and/or the editor(s). MDPI and/or the editor(s) disclaim responsibility for any injury to people or property resulting from any ideas, methods, instructions or products referred to in the content. |
© 2024 by the authors. Licensee MDPI, Basel, Switzerland. This article is an open access article distributed under the terms and conditions of the Creative Commons Attribution (CC BY) license (https://creativecommons.org/licenses/by/4.0/).
Share and Cite
Yeritsyan, D.; Momenzadeh, K.; Mohamadi, A.; Mortensen, S.J.; Beeram, I.R.; Caro, D.; Kheir, N.; McNichol, M.; Wixted, J.J.; Appleton, P.; et al. Sociodemographic and Lifestyle Risk Factors Associated with Fragility Hip Fractures: A Systematic Review and Meta-Analysis. Osteology 2024, 4, 64-87. https://doi.org/10.3390/osteology4020006
Yeritsyan D, Momenzadeh K, Mohamadi A, Mortensen SJ, Beeram IR, Caro D, Kheir N, McNichol M, Wixted JJ, Appleton P, et al. Sociodemographic and Lifestyle Risk Factors Associated with Fragility Hip Fractures: A Systematic Review and Meta-Analysis. Osteology. 2024; 4(2):64-87. https://doi.org/10.3390/osteology4020006
Chicago/Turabian StyleYeritsyan, Diana, Kaveh Momenzadeh, Amin Mohamadi, Sharri J. Mortensen, Indeevar R. Beeram, Daniela Caro, Nadim Kheir, Megan McNichol, John J. Wixted, Paul Appleton, and et al. 2024. "Sociodemographic and Lifestyle Risk Factors Associated with Fragility Hip Fractures: A Systematic Review and Meta-Analysis" Osteology 4, no. 2: 64-87. https://doi.org/10.3390/osteology4020006