
Integrated Petrophysical Evaluation and Rock Physics Modeling of Broom Creek Deep Saline Aquifer for Geological CO2 Storage


Department of Energy and Petroleum Engineering, College of Engineering and Mines, University of North Dakota, Grand Forks, ND 58202, USA
*
Author to whom correspondence should be addressed.
Fuels 2024, 5(1), 53-74; https://doi.org/10.3390/fuels5010004
Submission received: 22 December 2023
/
Revised: 16 January 2024
/
Accepted: 30 January 2024
/
Published: 6 February 2024
Abstract
:Fossil fuels, such as coal and hydrocarbons, are major drivers of global warming and are primarily responsible for worldwide greenhouse gas emissions, including carbon dioxide CO2. The storage of CO2 in deep saline reservoirs is acknowledged as one of the top practical and promising methods to reduce CO2 emissions and meet climate goals. The North Dakota Industrial Commission (NDIC) recently approved the fourth Class VI permit for a carbon capture and storage project in the Williston basin of North Dakota for the geological CO2 storage in the Broom Creek formation. The current research aimed to conduct a comprehensive petrophysical characterization and rock physics modeling of the Broom Creek deep saline reservoir to unravel the mineralogical distribution and to understand the variations in petrophysical and elastic properties across the formation. This study utilized geophysical well logs, routine core analysis, and advanced core analysis to evaluate the Broom Creek formation. Multimineral petrophysical analysis calibrated with X-ray diffraction results reveals that this formation primarily comprises highly porous clean sandstone intervals with low-porosity interspersed with dolomite, anhydrite, and silt/clay layers. The formation exhibits varying porosities up to 0.3 and Klinkenberg air permeabilities up to ∼2600 mD. The formation water resistivity using Archie’s equation is approximately 0.055 ohm-m at 150 °F, corresponding to around 63,000 ppm NaCl salinity, which is consistent with prior data. The pore throat distribution in the samples from clean sandstone intervals is primarily situated in the macro-mega scales. However, the presence of anhydrite and dolomite impedes both porosity and pore throat sizes. The accurate prediction of effective elastic properties was achieved by developing a rock physics template. Dry rock moduli were modeled using Hill’s average, while Berryman’s self-consistent scheme was employed for modeling saturated moduli.
1. Introduction
Fossil fuels, including coal, oil, and gas, significantly drive global climate change, responsible for over three-quarters of worldwide greenhouse gas discharges and close to 90% of overall carbon dioxide (CO2) emissions [1,2]. CO2 levels have experienced a significant surge since the onset of the industrial era, escalating from an average annual concentration of 280 parts per million (ppm) from the late 1700s to reaching 414 ppm in 2021; there has been a 48% increase. Nearly all of this escalation can be attributed to human activities [3]. Anthropogenic warming reached around 1 °C above pre-industrial levels by the year 2017, with a rate of increase at around 0.2 °C per decade [4]. According to the United Nations, a reduction of 45% in CO2 emissions is required by 2030, and achieving net-zero emissions by 2050 is necessary to limit global warming to a maximum of 1.5 °C [5].
A significant challenge in mitigating the effects of climate change lies in reducing CO2 emissions, aiming to stabilize CO2 concentrations. To achieve this goal, a diverse portfolio of measures and actions has been proposed. Among these, CO2 capture, utilization, and storage (CCUS) emerge as a pivotal strategy, involving the capture of CO2 from large industrial processes, predominantly power generation from fossil fuels, and its injection into deep geological formations [6]. Various approaches are available for carbon dioxide capture technologies, such as pre-combustion capture, post-combustion capture, and oxy-combustion capture [7,8,9,10,11]. Presently, the primary categories of reservoirs suitable for carbon dioxide (CO2) sequestration encompass saline aquifers, depleted oil and gas reservoirs, and coal seams. With the exception of saline aquifers, the aforementioned storage approaches exhibit limited CO2 storage capacity, and the associated technology is relatively underdeveloped [12]. As indicated in the International Energy Forum (IEF) dialogue insight report, the deployment of CCUS needs to achieve a minimum of 5.6 Gigatons (Gt) of CO2 by 2050 to align with the Paris Agreement’s objectives and the UN Sustainable Development Goals [13].
CCUS technology plays a vital role in capturing CO2 emissions, enabling their sustainable use or secure storage, and is critical in our pursuit of achieving net zero emissions. The North Dakota Industrial Commission (NDIC) recently approved the fourth Class VI permit, primacy, for a carbon capture and storage project in the Williston basin of North Dakota [14]. The Class VI Rule is crafted to safeguard underground drinking water sources, incorporating adjustments to the Underground Injection Control Program regulatory framework. These modifications are specifically tailored to accommodate the distinctive characteristics of injecting carbon dioxide, primarily intended for long-term storage [15]. In June 2017, the Energy and Environmental Research Center, University of North Dakota, launched a task to assess the safe, permanent, and cost-effective storage of 50 Mt of CO2 in North Dakota over 25 years [16]. The ultimate aim is to create an authorized geological storage opportunity based on a potential case for dedicated CO2 storage [16]. Reservoir characterization plays a pivotal role in the CO2 storage process, as it aids in assessing a site’s integrity and capacity for storing CO2. However, this crucial step faces various obstacles, such as insufficient advanced data and the resulting uncertainties and intricate geological complexities. Ongoing NDCS efforts have enabled the acquisition of advanced logging data, including comprehensive core analysis encompassing routing core analysis, special core analysis, and geomechanical studies. When calibrated with core data, integrated multimineral analysis becomes a valuable tool for discerning mineralogical, porosity, and permeability variations across the formation [17,18,19,20]. This information can be further utilized for regional-scale reservoir evaluation.
Given the significance of this formation in ongoing efforts for geological CO2 sequestration, the current research aimed to comprehensively petrophysically characterize the Broom Creek deep saline aquifer storage target, with the following specific objectives. (i) Conduct a comprehensive multimineral petrophysical assessment of the Broom Creek formation through well-log cross-plots and multimineral inversion calibrated with core data, aimed at unraveling the mineralogical distribution of the formation. (ii) Conduct petrophysical analysis to understand the petrophysical properties, including the porosity and permeability variations across the formation and their relationship to mineralogical characteristics and reservoir compartmentalization. (iii) Create a rock physics modeling template to model the elastic properties using the multimineral petrophysical evaluation results.
This paper is organized as follows: Section 2 provides a brief overview of the geological characteristics of the Broom Creek formation, including the formations both underlying and overlying it. Section 3 offers a comprehensive discussion on data availability, detailing the methodology employed for multimineral petrophysical evaluation and rock physics modeling. The results, along with a detailed analysis, are presented in Section 4. Finally, in Section 5, the study’s conclusions are succinctly summarized.
2. Geological Settings
The Williston Basin is an intracratonic sedimentary basin known for its rich hydrocarbons, lignite, and potash resources [21,22]. This basin covers portions of North Dakota, Montana, South Dakota, southern Saskatchewan, and southwestern Manitoba [21] (see Figure 1). The geological past of the Williston Basin is established through a sedimentary sequence that can be as thick as 15,000 feet in the central basin region. This sequence encompasses every period from the Cambrian to the Tertiary [23].
Numerous site characterization studies have been conducted over the years on the saline aquifers within the Williston Basin. The Permean-aged Broom Creek formation (see Figure 2), situated within the upper Minnilusa Group, was identified as one of the highly promising candidates for geological CO2 storage because of its reservoir characteristics and the underlying and overlying seals [25,26,27,28]. The Broom Creek saline aquifer is an optimal candidate for CO2 injection due to several favorable attributes. Its high porosity and permeability, expansive lateral coverage, effective sealing on both upper and lower boundaries, and substantial distance from significant faults are noteworthy. This significant separation mitigates or eliminates concerns regarding pore pressure alterations that could induce seismic activity [16]. This formation is characterized by its reddish-brown to pink quartzarenite composition, featuring intermittent thin dolostone beds. The sedimentary makeup consists of aeolian sandstone, carbonates, marine sandstone of nearshore, and anhydrite, all deposited in a sabkha to a shallow marine environment [29].
Directly overlaying the Broom Creek formation is the Opeche Formation from the Permian period (see Figure 2). This geological layer is distinguished by the prevalence of thick red shale beds and silt, complemented by sparse lenses of anhydrite and halite [31]. This formation is widespread in southwest North Dakota, and the broader Williston Basin [31]. The underlying Broom Creek formation is the Amsden formation (see Figure 2), consisting of tight layers of dolomite, dolomitic sandstone, and shale [32]. The primary focus of the current study is the reservoir characterization of the Broom Creek deep saline aquifer. The Opeche Formation in this CO2 storage system serves as the cap rock. It is essential to emphasize that, while caprock integrity characterization holds principal significance for CO2 sequestration, it falls outside the scope of the present work. The current study only focuses on the characterization of the Broom Creek formation.
3. Data Availability and Methodology
3.1. Data
In this study, we utilized geophysical well logs (see Table 1), routine core analysis results, special core analysis results, and drilling cutting data descriptions acquired by various operators available from the North Dakota Industrial Commission (NDIC) website [33]. Various data sources and their utilization in the present study are tabulated in Table 1. The present study utilizes a vertical Well-A, penetrated down to 10,470 ft (MD) through the Broom Creek formation. Well-A is located in Oliver County (see Figure 1), North Dakota, USA, and the NDIC identification number is 37,380 [34].
3.2. Multimineral Petrophysical Evaluation
3.2.1. Preliminary Data Processing
The acquisition of well-log raw data at the well location necessitates a series of corrections prior to its utilization in modeling. These corrections encompass depth-related, environmental, and other factors. The discrepancy in depth-related data arises from various causes, such as the different runs of logging tools used for data recording. Tension variations in the logging cable, influencing the depth shift, can also contribute to this mismatch. Additionally, static shifts between two logging tools in the same string may occur, although infrequently. Addressing depth-related corrections involves identifying a reference log, often chosen based on its consistency at a heterogeneous zone marked by highs and lows. In this study, the gamma ray (GR) log is selected as the reference, and subsequent adjustments are made to bring all other logs to the same depth level as the GR log.
Some well logs, particularly those with a shallow depth of investigation such as RHOZ, PEF, etc., are affected by borehole rugosity [35]. Borehole rugosity and hole enlargements can be effectively identified through the caliper log (CALI). In the wells under study, we have not observed significant borehole enlargements, and consequently, no additional manual corrections were carried out based on the caliper log.
3.2.2. Multimineral Petrophysical Inversion
The initial stage of geophysical inversion involves defining the forward problem and establishing the relationship between geophysical measurements and formation properties. In the context of well logging inversion, geophysical logs are represented as a function of formation properties [36]. Specifically, each measurement in a geophysical log is a linear or nonlinear combination of the response function corresponding to the volume fraction of each constituent in the formation. Mathematically, the linear relationship can be expressed as follows [36,37,38].
where represents the geophysical log measurement, denotes the volume fraction of the ith formation constituent, corresponds to the response value of the ith formation constituent, and is the noise parameter. In addition to Equation (1), a unity constraint can be incorporated, asserting that the sum of all volume fractions equals unity. This constraint can be mathematically expressed as:
The multimineral inversion process aims to determine the constituents () of a geological formation by inverting the response function of Equation (1), encompassing both minerals and fluids. In practical terms, formations comprise numerous mineral components, significantly surpassing the available measurements. As a result, solving the above forward problem becomes impractical for the entire spectrum of constituents and becomes an under-determined problem [36]. To address this, a common approach involves identifying the dominant mineral constituents that largely define the formation and focusing the inversion process solely on those minerals. Alternatively, grouping minerals with similar properties into a consolidated lithological aggregate characterized by effective properties elucidates the collective contribution of these minerals [37]. For example, quartz, feldspar, and mica are frequently grouped and interpreted as sandstone. The decision to aggregate depends on the study’s goals and the availability of independent geophysical well-logs.
Additionally, incorporating extra constraints enhances the ability to obtain physically realistic results from the inversion. Two such constraints include the porosity constraint, , and the non-negativity constraint, [38]. Here, is the volume fraction of the fluid, is the number of fluids, and is the user imposed maximum porosity constraint. Typically, is obtained from the routine core analysis and theoretical limits. It is assumed that the total volume fraction of the fluids equals the total porosity () of the system. Since the Broom Creek formation is entirely water-bearing, the inversion considers a single fluid with brine properties. In practice, the inversion of the matrix is not performed directly. Rather, the difference between the data obtained from Equation (1) and the original data is minimized iteratively while reasonably changing the response function coefficients [37].
It is essential to recognize that solving the inverse problem outlined above provides the best mathematical solution to the given problem. However, it is crucial to understand that the volume constraints derived from this optimal mathematical solution may not necessarily embody the best geological solution. A robust geological model involves cross-verifying the estimated mineral volume constituents with additional datasets, such as XRD mineral data, cutting data, routine core analysis data, and information on regional petrophysical facies variations [39]. In essence, achieving the most accurate geological model necessitates expertise in log analysis. It goes beyond solely relying on mathematical solutions and integrates diverse data sources to construct a comprehensive and reliable representation of the geological formations under study.
3.3. Rock Physics Modeling
In a broader context, rock physics modeling serves as a crucial bridge connecting reservoir properties with the elastic properties of reservoir rocks [40]. The accuracy of the rock physics model is instrumental for integrating the reservoir or geological characteristics with geophysical properties. In the present study, the focus of rock physics modeling is to predict the effective elastic properties of the formation based on the mineralogical and fluid components derived from multimineral petrophysical analysis.
The standard workflow calibrates the model with well-log data, and the model type depends on the geological setting and the formation properties. A generalized mathematical expression of the rock physics modeling can be expressed as [41]
where , is the compressional wave velocity, is the shear wave velocity, is the bulk density, is the rock physics model consists of set of equations, and is the vector of volumetric fractions of the minerals and fluids. A standard rock physics modeling approach involves four consecutive steps: (i) mineral modeling; (ii) fluid modeling; (iii) rock frame modeling; and (iv) adding pore fluid to the rock-frame model. This sequence of modeling steps is illustrated in Figure 3.
3.3.1. Mineral and Fluid Mixing
The effective elastic moduli of the rock mineral mix is calculated using Voigt–Reuss–Hill’s average, an average of Voigt and Reuss bounds. The equations can be given by [42]
Voigt upper bound
Reuss lower bound
Voigt–Reuss–Hill average
In the formation with N mineral constituents, denotes the volume fraction of the ith mineral constituent, while and refer to the bulk modulus (K) and shear modulus (G), respectively, of the ith mineral constituent. Since the Broom Creek formation is 100% water saturated, the fluid mixing step is not necessary. Instead, the bulk modulus and density of the brine are considered effective fluid properties.
3.3.2. Saturated Rock Moduli
In this study, we used an inclusion-based modeling approach to model the effective elastic properties of saturated rock. Specifically, Berryman’s self-consistent approximation scheme is used to model the pore system filled with brine [43]. The effective bulk modulus () and shear modulus () can be expressed as [42,43,44]
where is the volume fraction of ith mineral constituent. The terms and are the volumetric and deviatoric strain concentration factors that depend on the geometry of the pore shape. In the case of penny-shaped pores with an aspect ratio of , they can be expressed as [42,43,44]
and is given by
The subscripts m and i denote the host matrix and inclusion, respectively. To calculate the effective elastic moduli of pores filled with fluid, the shear modulus of the fluid is set to zero. Due to the isolation of the pores in terms of fluid flow, this method replicates the saturated rock behavior at extremely high frequencies, making it suitable for conditions of ultrasonic wave propagation [42].
4. Results and Discussion
This section presents the results and analysis derived from well-log cross-plots, the outcomes of multimineral petrophysical inversion, and their calibration with XRD and core data. Additionally, we present the intricacies of rock physics modeling approaches and their validation. We utilized Schlumberger’s Techlog software [45] to perform multimineral petrophysical inversion and rock physics modeling.
4.1. Analysis of Cross-Plots
Various cross-plots have been systematically generated and are presented alongside the corresponding well logs in Figure 4. The cross-plot markers are color-coded by the distinctive colors specified in the composite well-log template. These color assignments are determined through a quick look at the qualitative interpretation of gamma ray (GR), bulk density (RHOZ), and neutron porosity (NPHI) logs. The bulk density–neutron porosity (RHOZ-NPHI) cross-plot is a valuable tool to approximate the lithology of the water-filled formation [46]. Upon careful examination of the cross-plot, it becomes evident that intervals represented by orange-colored markers correspond to clean sandstone with good porosity. Conversely, dark-colored markers indicate intervals with high bulk density, signifying a mixture of dolomite and shale characterized by lower porosity. Furthermore, the cross-plot of compressional slowness and neutron porosity yields comparable information to that obtained from the RHOZ-NPHI cross-plot. This redundancy in information enhances the robustness of the interpretations.
The cross-plots involving apparent matrix grain density (RHOMAA) versus apparent matrix transit time (DTMAA) and RHOMAA versus apparent matrix volumetric photoelectric factor (UMAA) serve as valuable tools for discerning rock mineralogy [46]. The figure reveals that the Broom Creek formation primarily comprises quartz, dolomite, and anhydrite. Notably, layers with high RHOZ and low GR are distinctive for their anhydrite content. Furthermore, the thorium–potassium (HTHO-HFK) cross-plot indicates that the clay component predominantly comprises illite and mixed clay.
4.2. Mineralogical Interpretation
We have identified matrix constituents for multimineral analysis through cross-plot analysis and XRD laboratory results. These include (i) sandstone, (ii) dolomite, (iii) shale, and (iv) anhydrite. It is crucial to note that sandstone reflects the effective behavior of quartz, orthoclase-feldspar, and plagioclase feldspar. Similarly, shale represents the effective properties of a combination of clay minerals. Lumping minerals into aggregates is essential for formulating a well-defined inverse problem and efficiently solving it. Additionally, unless there is a specific reason to individually address particular minerals, it is advisable to lump them into other minerals that exhibit similar characteristics. The Broom Creek formation is water-bearing. Hence, a single fluid constituent is chosen for modeling. Considering these minerals and the well-logs, the forward problem in Equation (1) can be explicitly written as
In the equation, (1/ohm.m) represents the inverse of the formation deep resistivity (refer to Table 2). denotes the volumetric photoelectric factor. The terms , , , , and correspond to sandstone, dolomite, anhydrite, shale, and water. The variable V signifies the volume fraction of each mineralogical or fluid constituent. For a complete list of abbreviated log mnemonics, please see Table 2.
The objective is to accurately estimate the volume fractions of the rock. The response matrix values are sourced from Schlumberger’s chart book [47]. Through an iterative process of adjusting the response values within reasonable bounds, we aim to identify the optimal set of predicted logs. “Optimal set” signifies a minimal error between the predicted and measured log values and a good alignment with XRD measurements, cutting descriptions, and routine core analysis results. Adhering to these criteria allows one to determine the volume fractions for mineralogical constituents and fluid within the formation. Given that the pore volume is only filled with brine, the volume fraction of brine can be equated to the total porosity of the system.
The results of mineral volumes are presented in Figure 5 along with the XRD core data points. It can be seen that there is a good match between the estimated mineral volumes and the core analysis results. The estimated effective and total porosity and the permeability calculated with Coates’ formula are presented along with NMR measured data and routine core analysis results in Figure 6.
This formation primarily comprises clean sandstone intervals interspersed with dolomite, anhydrite, and silt/clay layers. Towards the top, the sandstone intervals are cleaner, and elevated layers of dolomite/anhydrite become apparent with further descent. The geological characterization of the drilling cuttings within the 4915–4950 ft and 4985–5068 ft intervals reveals well-sorted, predominantly sub-rounded sandstone formations. Additionally, these sandstone intervals frequently exhibit a slight coating of anhydrite and dolomitic cement. The current mineralogical inversion method can effectively capture information about a clean sandstone layer exhibiting minor cementation with anhydrite and dolomite (see Figure 5). Additionally, sandstone layers are developed in the intervals 5098–5106 ft, 5122–5151 ft, and 5167–5191 ft. The dolomite/sandstone and dolomite layers are observed in intervals 4950–4985 ft, 5072–5097 ft, 5106–5122 ft, and 5151–5167 ft. These intervals consist of slight anhydrite and clay minerals. This is consistent with the cutting description, which indicates the presence of anhydrite nodules. Moreover, the overall mineralogical results are in good agreement with the previously published studies [16].
Figure 6 illustrates a strong correlation between the estimated porosity, permeability, and routine core analysis results. Notably, there is a consistent agreement between the NMR-measured porosity permeability and the findings presented here. To summarize, clean sandstone intervals showcase excellent porosities, reaching up to 0.3 p.u, and excellent permeabilities reaching up to 2600 mD. The introduction of dolomite and anhydrite impedes porosity development, leading to diminished permeability. In Figure 6, reduced porosities and permeabilities are associated with the presence of dolomite and anhydrite minerals. Furthermore, the thick dolomite/sandstone and dolomite layers are characterized by poor porosity and permeabilities. Understanding the relative permeability of the CO2–brine system within these tight layers holds the potential to offer vital insights into the fluid compartmentalization within the Broom Creek formation. Moreover, the porosity and permeability results align well with previously published studies [16,27,48].
The Picket plot analysis [46,49] has estimated the formation water resistivity (Rw) using Archie’s equation, yielding a value of approximately 0.055 ohm-m at 150 °F (see Figure 7). When converted to NaCl salinity, this corresponds to around 63,000 ppm [47]. These results align well with previously established data. According to prior studies [16], the salinity of the brine samples varied between 61,000 and 70,000 ppm of total dissolved solids. We focused on Archie’s equation in this study due to the clean sandstone nature of the reservoir. Although more intricate theoretical and empirical water saturation models are available for shaly sand reservoir analysis [50,51,52], they were not necessary in the current research.
The Mercury injection data results for six samples are illustrated in Figure 8, showcasing histograms of pore throat sizes along with corresponding mercury saturation frequencies. The plot reveals that at depths of 4948 ft and 5007.5 ft, the pore throat sizes are predominantly characterized by mega sizes (>10 μm) with a distinct and sharp peak. These locations correspond to clean sandstone intervals, as depicted in Figure 6, exhibiting excellent porosity and permeability. This suggests that the pore throat sizes within the clean sandstone intervals are relatively homogeneous and primarily fall within the mega pore throat size range.
A slight deviation is observed at a depth of 5069.5 ft (refer to Figure 8), where a minor increase in dolomite and anhydrite content (see Figure 6) contributes to a broader and lower-height distribution of pore throat sizes. This could be attributed to the heterogeneous cementation of anhydrite and dolomite in specific areas, reducing pore throat sizes. For samples retrieved from depths of 4980.5 ft and 5086.5 ft, which are primarily composed of dolomite and dolomite/sandstone (see Figure 6), the pore throat sizes exhibit a more heterogeneous distribution, predominantly falling within the nanosize region (see Figure 8). The presence of dolomite and the combination with sandstone result in varied pore throat sizes, indicating a more complex and heterogeneous reservoir structure at these depths.
4.3. Rock Physics Modeling
The velocity–porosity trends and –acoustic impedance (AI) relationships are visually presented in Figure 9 across various lithologies. Notably, the figure illustrates that clean sandstone intervals consistently occupy the lower velocity and higher porosity regions. In contrast, dolomite and anhydrite exhibit higher velocities and lower porosity values. The mixed dolomite–sandstone data points are positioned in an intermediate zone, reflecting their combined characteristics. The and AI plot further underscores the distinctive trends between sandstone and carbonate rocks, aligning with expectations.
In addition, to ensure the quality of the log data, we calculate theoretical bounds, such as Voigt–Reuss and Hashin–Strikman, for end-member minerals/fluids using the formulas provided in Equation (6). These theoretical bound estimates are then juxtaposed with the measured bulk modulus and porosity, as illustrated in Figure 10. The figure demonstrates that the measured bulk modulus is effectively constrained within the theoretical bounds. Moreover, the predominant positioning of the data within the lower Hashin–Strikman bounds strongly indicates that the formation is characterized as soft or unconsolidated.
As outlined in Section 3.3, the bulk modulus of the solid phase is calculated using the Voigt–Reuss–Hill average. The elastic properties and densities of the minerals are sourced from [53] and are summarized in Table 3. The estimated solid bulk modulus and shear modulus are presented in Figure 11. The Broom Creek formation is saturated with only brine; therefore, brine properties in situ conditions are used as effective fluid properties.
The matrix frame with dry pores and subsequently brine saturated pores is calculated using Berryman’s self-consistent scheme as outlined in Section 3.3. Figure 11 presents the predicted bulk modulus and shear modulus.
Figure 11 and Figure 12 illustrate a strong agreement between the estimated and measured velocities, validating the current rock physics modeling approach and suggesting its potential applicability in new wells.
Additionally, we conducted an investigation into the results and correlations. Figure 13 depicts the variations in elastic moduli with porosity. The bulk modulus exhibits a consistent trend across all lithologies, while the shear modulus–porosity variations in the dolomite/sandstone lithology diverge from the global trend.
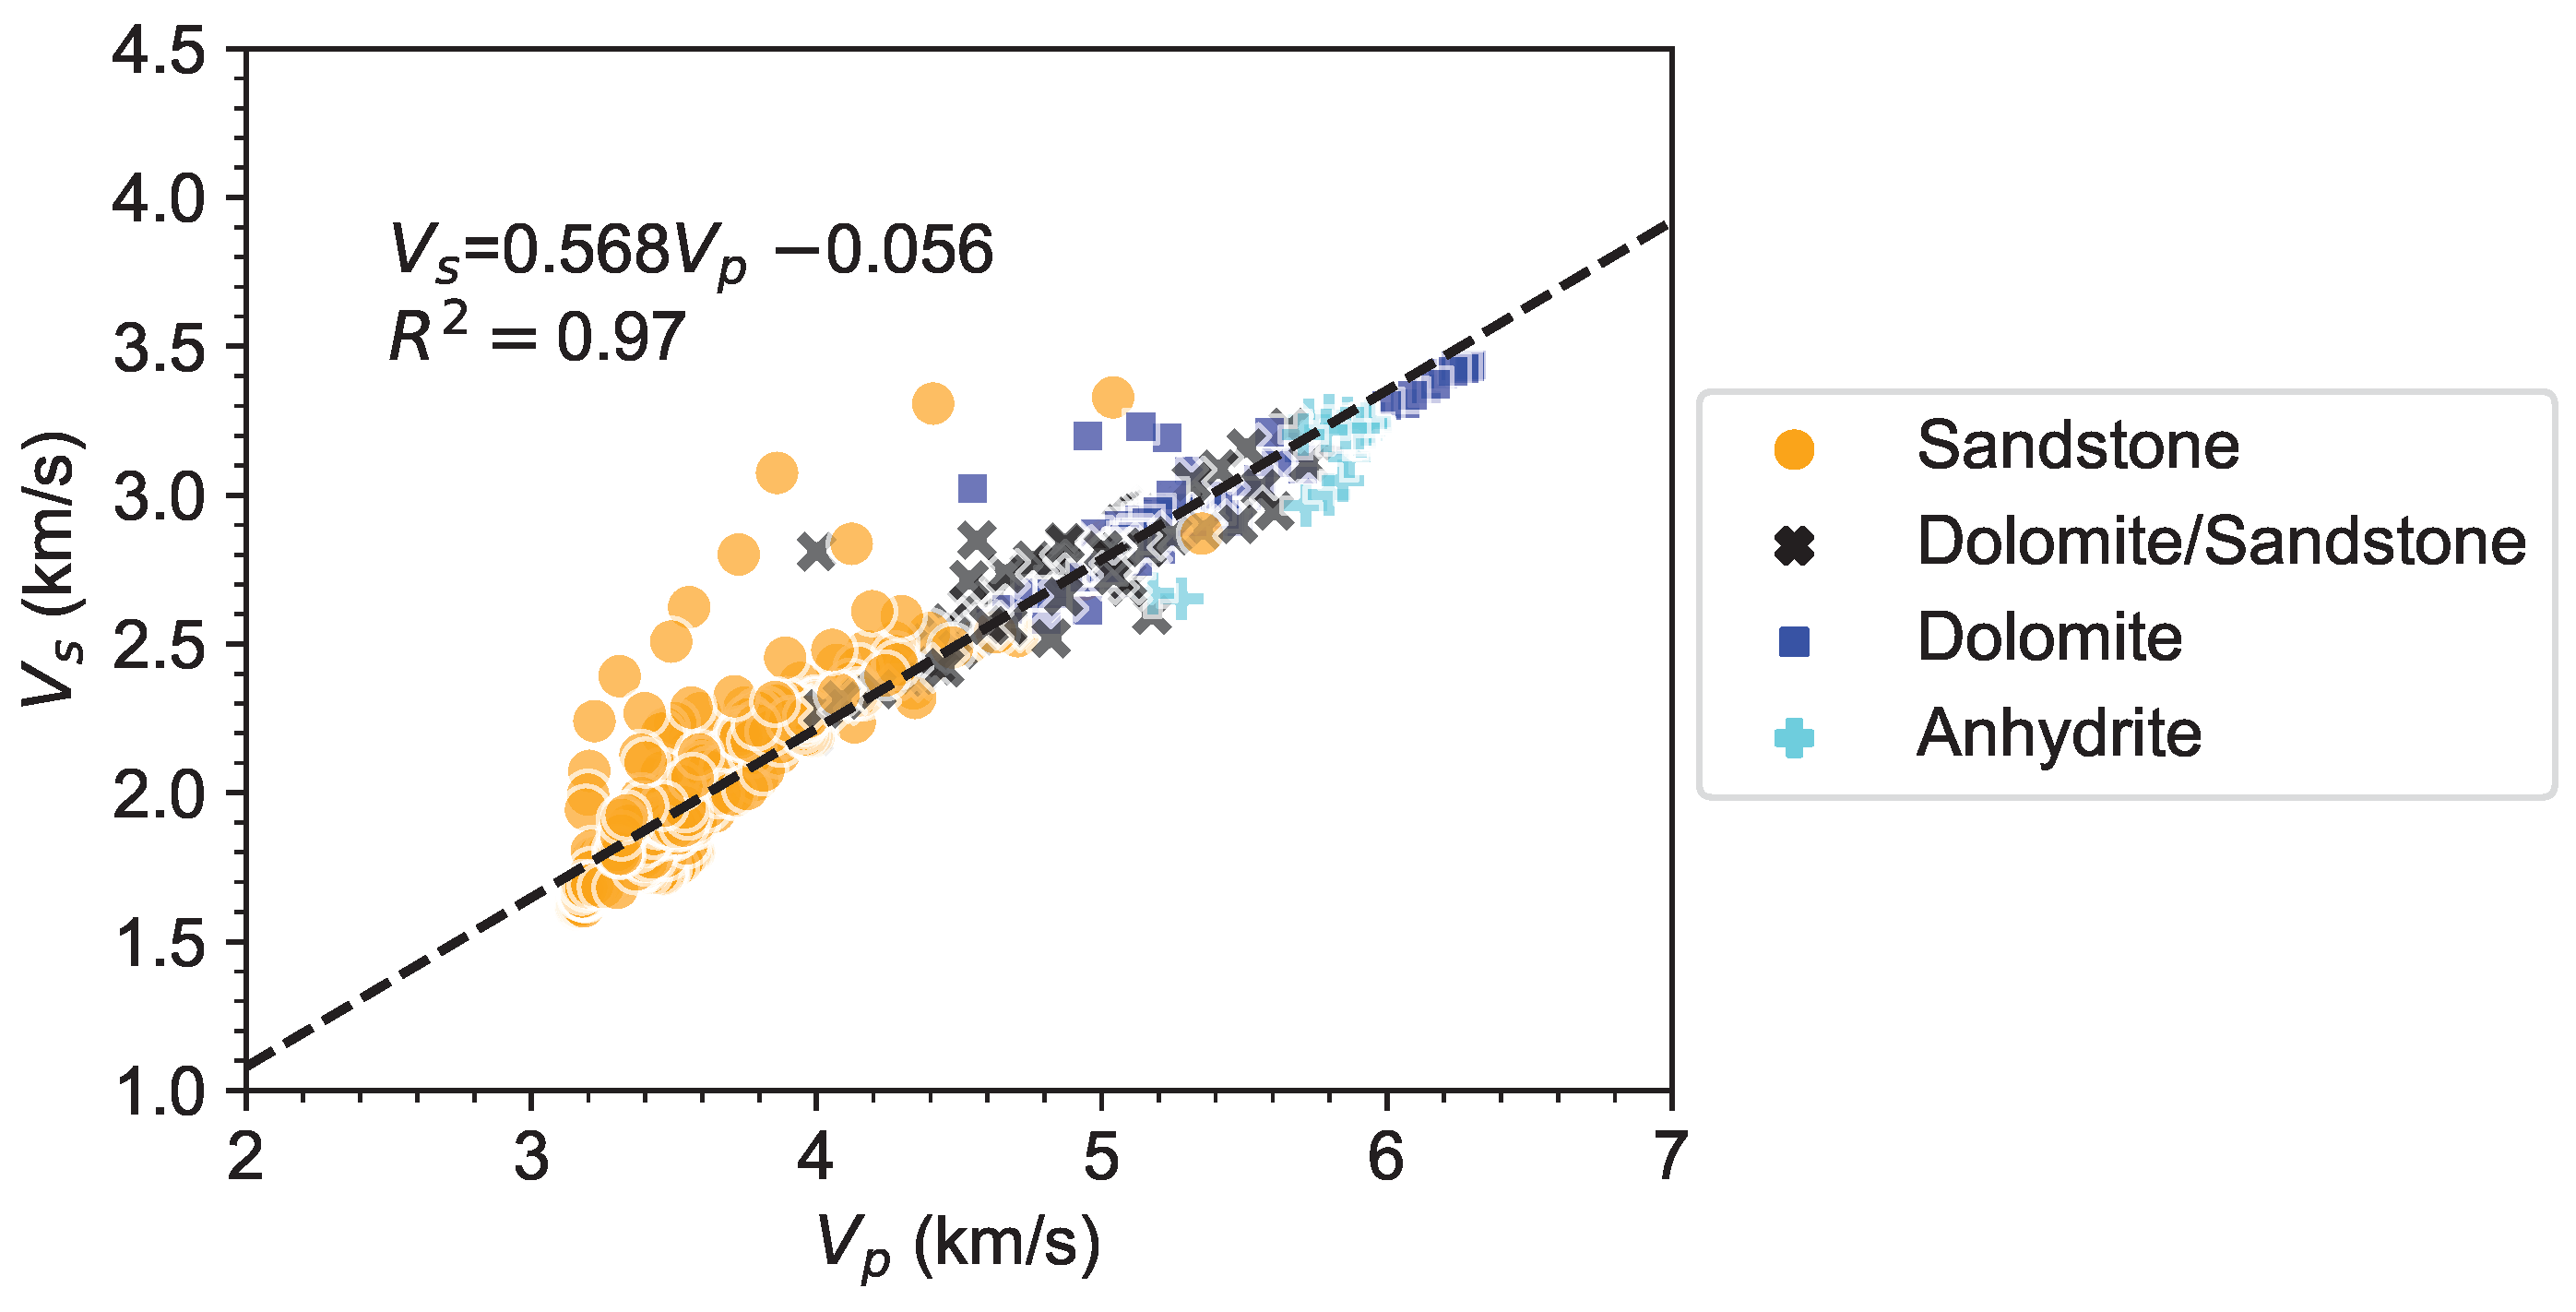
Examining the correlation between and reveals a robust linear relationship, with an R-squared value of 0.97 (see Figure 14). Notably, (km/s) can be expressed in terms of (km/s) as follows:
This equation can be applied to predict the shear wave velocity of the Broom Creek formation in new wells where sonic velocities are not available.
5. Conclusions
Geological CO2 sequestration in the Broom Creek formation, a deep saline aquifer, is an ongoing project in North Dakota. Within subsurface reservoir analysis, petrophysical evaluation emerges as a pivotal determinant. In this regard, this research comprehensively assesses the pertinent petrophysical properties. This is achieved by integrating geophysical well logs with experimentally derived petrophysical parameters encompassing the Broom Creek formation’s porosity, permeability, and mineralogical composition. Rock physics modeling is also carried out to predict the effective elastic properties using the results obtained from the multimineral petrophysical evaluation. The outcome of this research is the detailed petrophysical analysis of the Broom Creek formation and the development of optimal petrophysical and rock physics models to evaluate this reservoir and monitoring.
Utilizing a multimineral petrophysical analysis, this research, calibrated with X-ray diffraction outcomes, elucidates the predominant composition of the Broom Creek formation. The formation predominantly consists of highly porous clean sandstone intervals interspersed with low-porosity dolomite, anhydrite, and silt/clay layers. Notably, the formation exhibits variable porosities up to 0.3 and Klinkenberg air permeabilities reaching approximately 2600 mD. The application of Archie’s equation for the formation water resistivity, at 150 °F, yields a value of approximately 0.055 ohm-m, corresponding to a salinity of around 63,000 ppm NaCl, aligning with prior data. Pore throat distribution in samples from clean sandstone intervals primarily occurs in the macro-mega scales. However, the presence of anhydrite and dolomite hinders both porosity and pore throat sizes. The accurate prediction of effective elastic properties was accomplished by formulating a rock physics template. Dry rock moduli were modeled using Hill’s average, while Berryman’s self-consistent scheme was employed for modeling saturated moduli.
The established multimineral inversion model and the petrophysical properties will play a pivotal role in facilitating the evaluation of the existing storage potential within the Broom Creek formation rock physics models and serve as valuable tools for predicting elastic properties in situations where shear wave velocity data are unavailable. Additionally, these models find applications in seismic reservoir characterization and the 4D seismic monitoring of CO2 storage sites.
Author Contributions
Conceptualization, P.P.; methodology, P.P.; software, P.P.; validation, P.P., G.I. and K.L.; formal analysis, P.P.; investigation, P.P.; resources, K.L.; data curation, K.L.; writing—original draft preparation, P.P.; writing—review and editing, P.P., G.I. and K.L.; visualization, P.P.; supervision, K.L.; project administration, K.L.; funding acquisition, K.L. All authors have read and agreed to the published version of the manuscript.
Funding
This research received no external funding.
Institutional Review Board Statement
Not applicable.
Informed Consent Statement
Not applicable.
Data Availability Statement
All the information supporting this research’s discoveries is included in the article.
Acknowledgments
The authors would like to express and acknowledge the financial support of the North Dakota Industrial Commission (NDIC). The authors express their gratitude to Schlumberger for generously providing an academic license for Techlog software, version 2020.1. This work used advanced cyberinfrastructure resources provided by the University of North Dakota Computational Research Center. The author used AI tools, specifically Grammarly and ChatGPT-3.5, to improve the language and readability. Upon generating draft language, the authors reviewed, edited, and revised the text to their liking, taking ultimate responsibility for the content of this publication.
Conflicts of Interest
The authors declare no conflicts of interest.
Abbreviations
The following abbreviations are used in this manuscript:
| CO2 | Carbon dioxide |
| NDIC | North Dakota Industrial Commission |
| XRD | X-ray diffraction analysis |
| CCUS | Carbon capture, utilization, and storage |
| IEF | International Energy Forum |
| NDCS | North Dakota Integrated Carbon Storage Complex Feasibility Study |
| GR | Natural gamma-ray log |
| AIG | Array induction logs |
| RHOZ | Formation bulk density log |
| NPHI | Neutron porosity log |
| PEF | Photo-electric factor |
| DTCO | Compressional slowness log |
| HTHO | Formation thorium concentration log |
| HURA | Formation uranium concentration log |
| HFK | Formation potassium concentration log |
| TCMR | Total nuclear magnetic resonance (NMR) Porosity |
| CMFF | NMR free fluid |
| CMRP_3MS | NMR porosity with T2 values greater than 3 ms |
| KSDR | NMR SDR permeability |
| KSDR | NMR Timur/Coates permeability |
| Volume fraction of ith mineral | |
| Geophysical log measurement | |
| Log response value of the ith formation constituent | |
| Volume fraction of fth fluid constituent | |
| User imposed maximum porosity constraint | |
| Total porosity | |
| Elastic properties | |
| Rock physics model | |
| Voigt upper bound of bulk modulus | |
| Reuss lower bound of bulk modulus | |
| Hill average of bulk modulus | |
| Voigt upper bound of shear modulus | |
| Reuss lower bound of shear modulus | |
| Hill average of shear modulus | |
| Effective bulk modulus derived from self-consistent approach | |
| Effective shear modulus derived from self-consistent approach | |
| Volumetric strain concentration factor | |
| Deviatoric strain concentration factors | |
| Bulk modulus of host mineral | |
| Shear modulus of host mineral |
| Bulk modulus of inclusion | |
| Shear modulus of inclusion | |
| Aspect ratio | |
| Sw | Water saturation |
| Inverse of formation true resistivity | |
| U | Volumetric photoelectric factor |
| a, m and n | Archie’s parameters |
| Rw | Formation water resistivity |
| Compressional wave velocity | |
| Shear wave velocity | |
| Acoustic impedance | |
| HS+ and HS− | Hashin–Strikman upper and lower bounds |
References
- Causes and Effects of Climate Change|United Nations. Available online: https://www.un.org/en/climatechange/science/causes-effects-climate-change (accessed on 20 December 2023).
- Wei, W.; Mushtaq, Z.; Sharif, M.; Zeng, X.; Wan-Li, Z.; Qaisrani, M.A. Evaluating the coal rebound effect in energy intensive industries of China. Energy 2020, 207, 118247. [Google Scholar] [CrossRef]
- U.S. Global Change Research Program. Climate Science Special Report: Fourth National Climate Assessment; Technical Report; U.S. Global Change Research Program: Washington, DC, USA, 2017; Volume I. [CrossRef]
- Allen, M.; Dube, O.; Solecki, W.; Aragón-Durand, F.; Cramer, W.; Humphreys, S.; Kainuma, M.; Kala, J.; Mahowald, N.; Mulugetta, Y.; et al. Framing and Context. In Global Warming of 1.5 °C. An IPCC Special Report on the Impacts of Global Warming of 1.5 °C above Pre-Industrial Levels and Related Global Greenhouse Gas Emission Pathways, in the Context of Strengthening the Global Response to the Threat of Climate Change, Sustainable Development, and Efforts to Eradicate Poverty; Masson-Delmotte, V., Zhai, P., Pörtner, H.O., Roberts, D., Skea, J., Shukla, P., Pirani, A., Moufouma-Okia, W., Péan, C., Pidcock, R., Eds.; Cambridge University Press: Cambridge, UK; New York, NY, USA, 2018; pp. 49–92. [Google Scholar] [CrossRef]
- Net Zero Coalition|United Nations. Available online: https://www.un.org/en/climatechange/net-zero-coalition (accessed on 20 December 2023).
- Lal, R. Carbon sequestration. Philos. Trans. R. Soc. B Biol. Sci. 2008, 363, 815–830. [Google Scholar] [CrossRef] [PubMed]
- Sharif, M.; Zhang, T.; Wu, X.; Yu, Y.; Zhang, Z. Evaluation of CO2 absorption performance by molecular dynamic simulation for mixed secondary and tertiary amines. Int. J. Greenh. Gas Control 2020, 97, 103059. [Google Scholar] [CrossRef]
- Sharif, M.; Wu, X.; Yu, Y.; Zhang, T.; Zhang, Z. Estimation of diffusivity and intermolecular interaction strength of secondary and tertiary amine for CO2 absorption process by molecular dynamic simulation. Mol. Simul. 2022, 48, 484–494. [Google Scholar] [CrossRef]
- Sharif, M.; Fan, H.; Sultan, S.; Yu, Y.; Zhang, T.; Wu, X.; Zhang, Z. Evaluation of CO2 absorption and stripping process for primary and secondary amines. Mol. Simul. 2023, 49, 565–575. [Google Scholar] [CrossRef]
- Mushtaq, Z.; Wei, W.; Jamil, I.; Sharif, M.; Chandio, A.A.; Ahmad, F. Evaluating the factors of coal consumption inefficiency in energy intensive industries of China: An epsilon-based measure model. Resour. Policy 2022, 78, 102800. [Google Scholar] [CrossRef]
- Sharif, M.; Fan, H.; Wu, X.; Yu, Y.; Zhang, T.; Zhang, Z. Assessment of novel solvent system for CO2 capture applications. Fuel 2023, 337, 127218. [Google Scholar] [CrossRef]
- Luo, A.; Li, Y.; Chen, X.; Zhu, Z.; Peng, Y. Review of CO2 sequestration mechanism in saline aquifers. Nat. Gas Ind. B 2022, 9, 383–393. [Google Scholar] [CrossRef]
- IEF. Strategies to Scale Carbon Capture, Utilization, and Storage; Technical Report; The International Energy Forum: Riyadh, Saudi Arabia, 2022. [Google Scholar]
- Class VI—Geologic Sequestration Wells. Available online: https://www.dmr.nd.gov/dmr/oilgas/ClassVI (accessed on 20 December 2023).
- Class VI—Wells Used for Geologic Sequestration of Carbon Dioxide. Available online: https://www.epa.gov/uic/class-vi-wells-used-geologic-sequestration-carbon-dioxide (accessed on 20 December 2023).
- Peck, W.D.; Ayash, S.C.; Klapperich, R.J.; Gorecki, C.D. The North Dakota integrated carbon storage complex feasibility study. Int. J. Greenh. Gas Control 2019, 84, 47–53. [Google Scholar] [CrossRef]
- Jacobi, D.; Gladkikh, M.; LeCompte, B.; Hursan, G.; Mendez, F.; Longo, J.; Ong, S.; Bratovich, M.; Patton, G.; Shoemaker, P. Integrated Petrophysical Evaluation of Shale Gas Reservoirs. In Proceedings of the SPE Unconventional Resources Conference/Gas Technology Symposium, Calgary, AB, Canada, 16–19 June 2008; p. SPE-114925-MS. [Google Scholar] [CrossRef]
- Mellal, I.; Malki, M.L.; Latrach, A.; Ameur-Zaimech, O.; Bakelli, O. Multiscale Formation Evaluation and Rock Types Identification in the Middle Bakken Formation. In Proceedings of the SPWLA Annual Logging Symposium, Lake Conroe, TX, USA, 10–14 June 2023; p. D031S002R006. [Google Scholar] [CrossRef]
- Mellal, I.; Latrach, A.; Rasouli, V.; Bakelli, O.; Dehdouh, A.; Ouadi, H. Water Saturation Prediction in the Middle Bakken Formation Using Machine Learning. Eng 2023, 4, 1951–1964. [Google Scholar] [CrossRef]
- Mellal, I.; Rasouli, V.; Dehdouh, A.; Letrache, A.; Abdelhamid, C.; Malki, M.L.; Bakelli, O. Formation Evaluation Challenges of Tight and Shale Reservoirs. A Case Study of the Bakken Petroleum System. In Proceedings of the U.S. Rock Mechanics/Geomechanics Symposium, Atlanta, GA, USA, 25–28 June 2023; p. ARMA-2023-0894. [Google Scholar] [CrossRef]
- Gerhard, L.C.; Anderson, S.B.; Lefever, J.A.; Carlson, C.G. Geological Development, Origin, and Energy Mineral Resources of Williston Basin, North Dakota1. AAPG Bull. 1982, 66, 989–1020. [Google Scholar] [CrossRef]
- Bakelli, O.; Chellal, H.A.K.; Aoun, A.E.; Khetib, Y.; Mellal, I.; Kegang, L. Integrated Reservoir Simulation and Discrete Fracture Network Modeling for Produced Water Source Identification in Tight Reservoirs, Case Study from the Bakken Formation, Williston Basin. In Proceedings of the U.S. Rock Mechanics/Geomechanics Symposium, Atlanta, GA, USA, 25–28 June 2023; p. ARMA-2023-0864. [Google Scholar] [CrossRef]
- Carlson, C.G.; Anderson, S.B. Sedimentary and Tectonic History of North Dakota Part of Williston Basin1. AAPG Bull. 1965, 49, 1833–1846. [Google Scholar] [CrossRef]
- Gaswirth, S.B.; Lillis, P.G.; Pollastro, R.M.; Anna, L.O. Geologic Assessment of Undiscovered Oil and Gas Resources in the Madison Group, Williston Basin, North Dakota and Montana. In Assessment of Undiscovered Oil and Gas Resources of the Williston Basin Province of North Dakota, Montana, and South Dakota; US Geological Survey Williston Basin Province Assessment Team, Ed.; U.S. Geological Survey: Reston, VA, USA, 2013; Chapter 4; p. 1. Available online: https://pubs.usgs.gov/dds/dds-069/dds-069-w/ (accessed on 23 January 2024).
- Steadman, E.N.; Daly, D.J.; De Silva, L.L.; Harju, J.A.; Jensen, M.D.; O’Leary, E.M.; Peck, W.D.; Smith, S.A.; Sorensen, J.A. PLAINS CO2 REDUCTION (PCOR) PARTNERSHIP (PHASE I) FINAL REPORT; Technical Report; Energy & Environmental Research Center, University of North Dakota: Grand Forks, ND, USA, 2006. [Google Scholar]
- Belobraydic, M.L.; Richards, T.L.; Pekot, L.J.; Stevens, C.R.; Feole, I.K.; Warmack, M.P.; Regorrah, J.G.; Burnison, S.A.; Meyer, J.A.; Klapperich, R.J.; et al. TECHNICAL APPROACHES to STACKED STORAGE, Plains CO2 Reduction (PCOR) Partnership, Task 2—Deliverable D3.A; Technical Report; Energy & Environmental Research Center, University of North Dakota: Grand Forks, ND, USA, 2021. [Google Scholar]
- Sorensen, J.A.; Bailey, T.P.; Dobroskok, A.A.; Gorecki, C.D.; Smith, S.A.; Fisher, D.W.; Peck, W.D.; Steadman, E.N.; Harju, J.A. Characterization and Modeling of the Broom Creek Formation for potential storage of CO2 from coal-fired power plants in North Dakota. Search Discov. 2009, 1, 1–14. [Google Scholar]
- Bakelli, O.; Xiao, T.; McPherson, B.; Doghmane, M.Z. Geomechanical Characterization of the Broom Creek Reservoir for Geologic Carbon Storage in the Williston Basin, North Dakota, U.S. In Proceedings of the ARMA/DGS/SEG International Geomechanics Symposium, Dhahran, Saudi Arabia, 30 October–2 November 2023; p. ARMA-IGS-2023-0042. [Google Scholar] [CrossRef]
- Rygh, M.E. The Broom Creek Formation (Permian), in Southwestern North Dakota: Depositional Environments and Nitrogen Occurrence. Master’s Thesis, University of North Dakota, Grand Forks, ND, USA, 1990. [Google Scholar]
- Barajas-Olalde, C.; Adams, D.C.; Curcio, A.; Davydycheva, S.; Klapperich, R.J.; Martinez, Y.; Paembonan, A.Y.; Peck, W.D.; Strack, K.; Soupios, P. Application of Electromagnetic Methods for Reservoir Monitoring with Emphasis on Carbon Capture, Utilization, and Storage. Minerals 2023, 13, 1308. [Google Scholar] [CrossRef]
- Benison, K.C.; Goldstein, R.H. Sedimentology of Ancient Saline Pans: An Example from the Permian Opeche Shale, Williston Basin, North Dakota, USA. J. Sediment. Res. 2000, 70, 159–169. [Google Scholar] [CrossRef]
- Ziebarth, H.C. The Stratigraphy and Economic Potential of Permo-Pennsylvanian Strata in Southwestern North Dakota; The University of North Dakota: Grand Forks, ND, USA, 1972. [Google Scholar]
- NDIC. Department of Mineral Resources, North Dakota. Available online: https://www.dmr.nd.gov/ (accessed on 5 December 2023).
- Operator. NDIC 37380 Well File (Unpublished). 2020. Available online: https://www.dmr.nd.gov/ (accessed on 15 December 2022).
- Grandi Karam, S. Effects of Borehole Stability on Well Log Data. Ph.D. Thesis, Massachusetts Institute of Technology, Cambridge, MA, USA, 2003. [Google Scholar]
- Doveton, J.H. Compositional Analysis of Lithologies from Wireline Logs. In Geologic Log Analysis Using Computer Methods; American Association of Petroleum Geologists: Tulsa, OK, USA, 1994. [Google Scholar] [CrossRef]
- Quirein, J.; Kimminau, S.; La Vigne, J.; Julian, S.; Wendel, F. A Coherent Framework For Developing And Applying Multiple Formation Evaluation Models. In Proceedings of the SPWLA 27th Annual Logging Symposium, SPWLA-1986-DD, Houston, TX, USA, 9–13 June 1986; Available online: https://your-url-here.com (accessed on 23 January 2024).
- Cheng, L.; Jin, G.; Michelena, R.; Tura, A. Practical Bayesian Inversions for Rock Composition and Petrophysical Endpoints in Multimineral Analysis. SPE Reserv. Eval. Eng. 2022, 25, 849–865. [Google Scholar] [CrossRef]
- Luycx, M.; Wheelock, B.; Kadir, H.; Oyewole, E.O.; Ijasan, O.; McLendon, D. Core-Calibrated Multi-Mineral Interpretation in Reservoirs with Complex Mineralogy. In Proceedings of the Unconventional Resources Technology Conference, Houston, TX, USA, 20–22 June 2022; p. D031S049R001. [Google Scholar] [CrossRef]
- Avseth, P.; Mukerji, T.; Mavko, G.; Dvorkin, J. Rock-physics diagnostics of depositional texture, diagenetic alterations, and reservoir heterogeneity in high-porosity siliciclastic sediments and rocks—A review of selected models and suggested work flows. Geophysics 2010, 75, 75A31–75A47. [Google Scholar] [CrossRef]
- Grana, D.; Pirrone, M.; Mukerji, T. Quantitative log interpretation and uncertainty propagation of petrophysical properties and facies classification from rock-physics modeling and formation evaluation analysis. Geophysics 2012, 77, WA45–WA63. [Google Scholar] [CrossRef]
- Mavko, G.; Mukerji, T.; Dvorkin, J. Effective Elastic Media: Bounds and Mixing Laws. In The Rock Physics Handbook, 3rd ed.; Cambridge University Press: Cambridge, UK, 2020; pp. 220–308. [Google Scholar] [CrossRef]
- Berryman, J.G. Mixture Theories for Rock Properties. In Rock Physics & Phase Relations; American Geophysical Union (AGU): Washington, DC, USA, 1995; pp. 205–228. [Google Scholar] [CrossRef]
- Berryman, J.G. Single-scattering approximations for coefficients in Biot’s equations of poroelasticity. J. Acoust. Soc. Am. 1992, 91, 551–571. [Google Scholar] [CrossRef]
- Schlumberger. Techlog Wellbore Software, Version 2020.1. Available online: https://www.software.slb.com/products/techlog (accessed on 23 January 2024).
- Doveton, J.H. Graphical Techniques for the Analysis and Display of Logging Information. In Geologic Log Analysis Using Computer Methods; American Association of Petroleum Geologists: Tulsa, OK, USA, 1994. [Google Scholar] [CrossRef]
- Schlumberger Limited. Log Interpretation Charts; Schlumberger: Houston, TX, USA, 2009. [Google Scholar]
- Smith, S.A.; Beddoe, C.J.; Mibeck, B.A.; Heebink, L.V.; Kurz, B.A.; Peck, W.D.; Jin, L. Relative Permeability of Williston Basin CO2 Storage Targets. Energy Procedia 2017, 114, 2957–2971. [Google Scholar] [CrossRef]
- Pickett, G. A Review of Current Techniques for Determination of Water Saturation From Logs. J. Pet. Technol. 1966, 18, 1425–1433. [Google Scholar] [CrossRef]
- Waxman, M.; Smits, L. Electrical Conductivities in Oil-Bearing Shaly Sands. Soc. Pet. Eng. J. 1968, 8, 107–122. [Google Scholar] [CrossRef]
- Gupta, A.R.; Kamal. A theoretical approach for water saturation estimation in shaly sandstones. Geoenergy Sci. Eng. 2023, 228, 212001. [Google Scholar] [CrossRef]
- Gupta, A.R.; Gupta, P.K.; Singh, V.N. A genetic algorithm approach to evaluate models for electrical conductivity response of shaly sand reservoir, based on volumetric approach. In SEG Technical Program Expanded Abstracts; Society of Exploration Geophysicists: Houston, TX, USA, 2023; pp. 1570–1574. [Google Scholar] [CrossRef]
- Mavko, G.; Mukerji, T.; Dvorkin, J. Appendices. In The Rock Physics Handbook, 3rd ed.; Cambridge University Press: Cambridge, UK, 2020; pp. 613–672. [Google Scholar] [CrossRef]
Figure 1.
Geological map of Williston Basin in North Dakota, highlighting major geological features. The specific focus of the current study is Oliver County, indicated in red. (Modified after [24]).
Figure 1.
Geological map of Williston Basin in North Dakota, highlighting major geological features. The specific focus of the current study is Oliver County, indicated in red. (Modified after [24]).
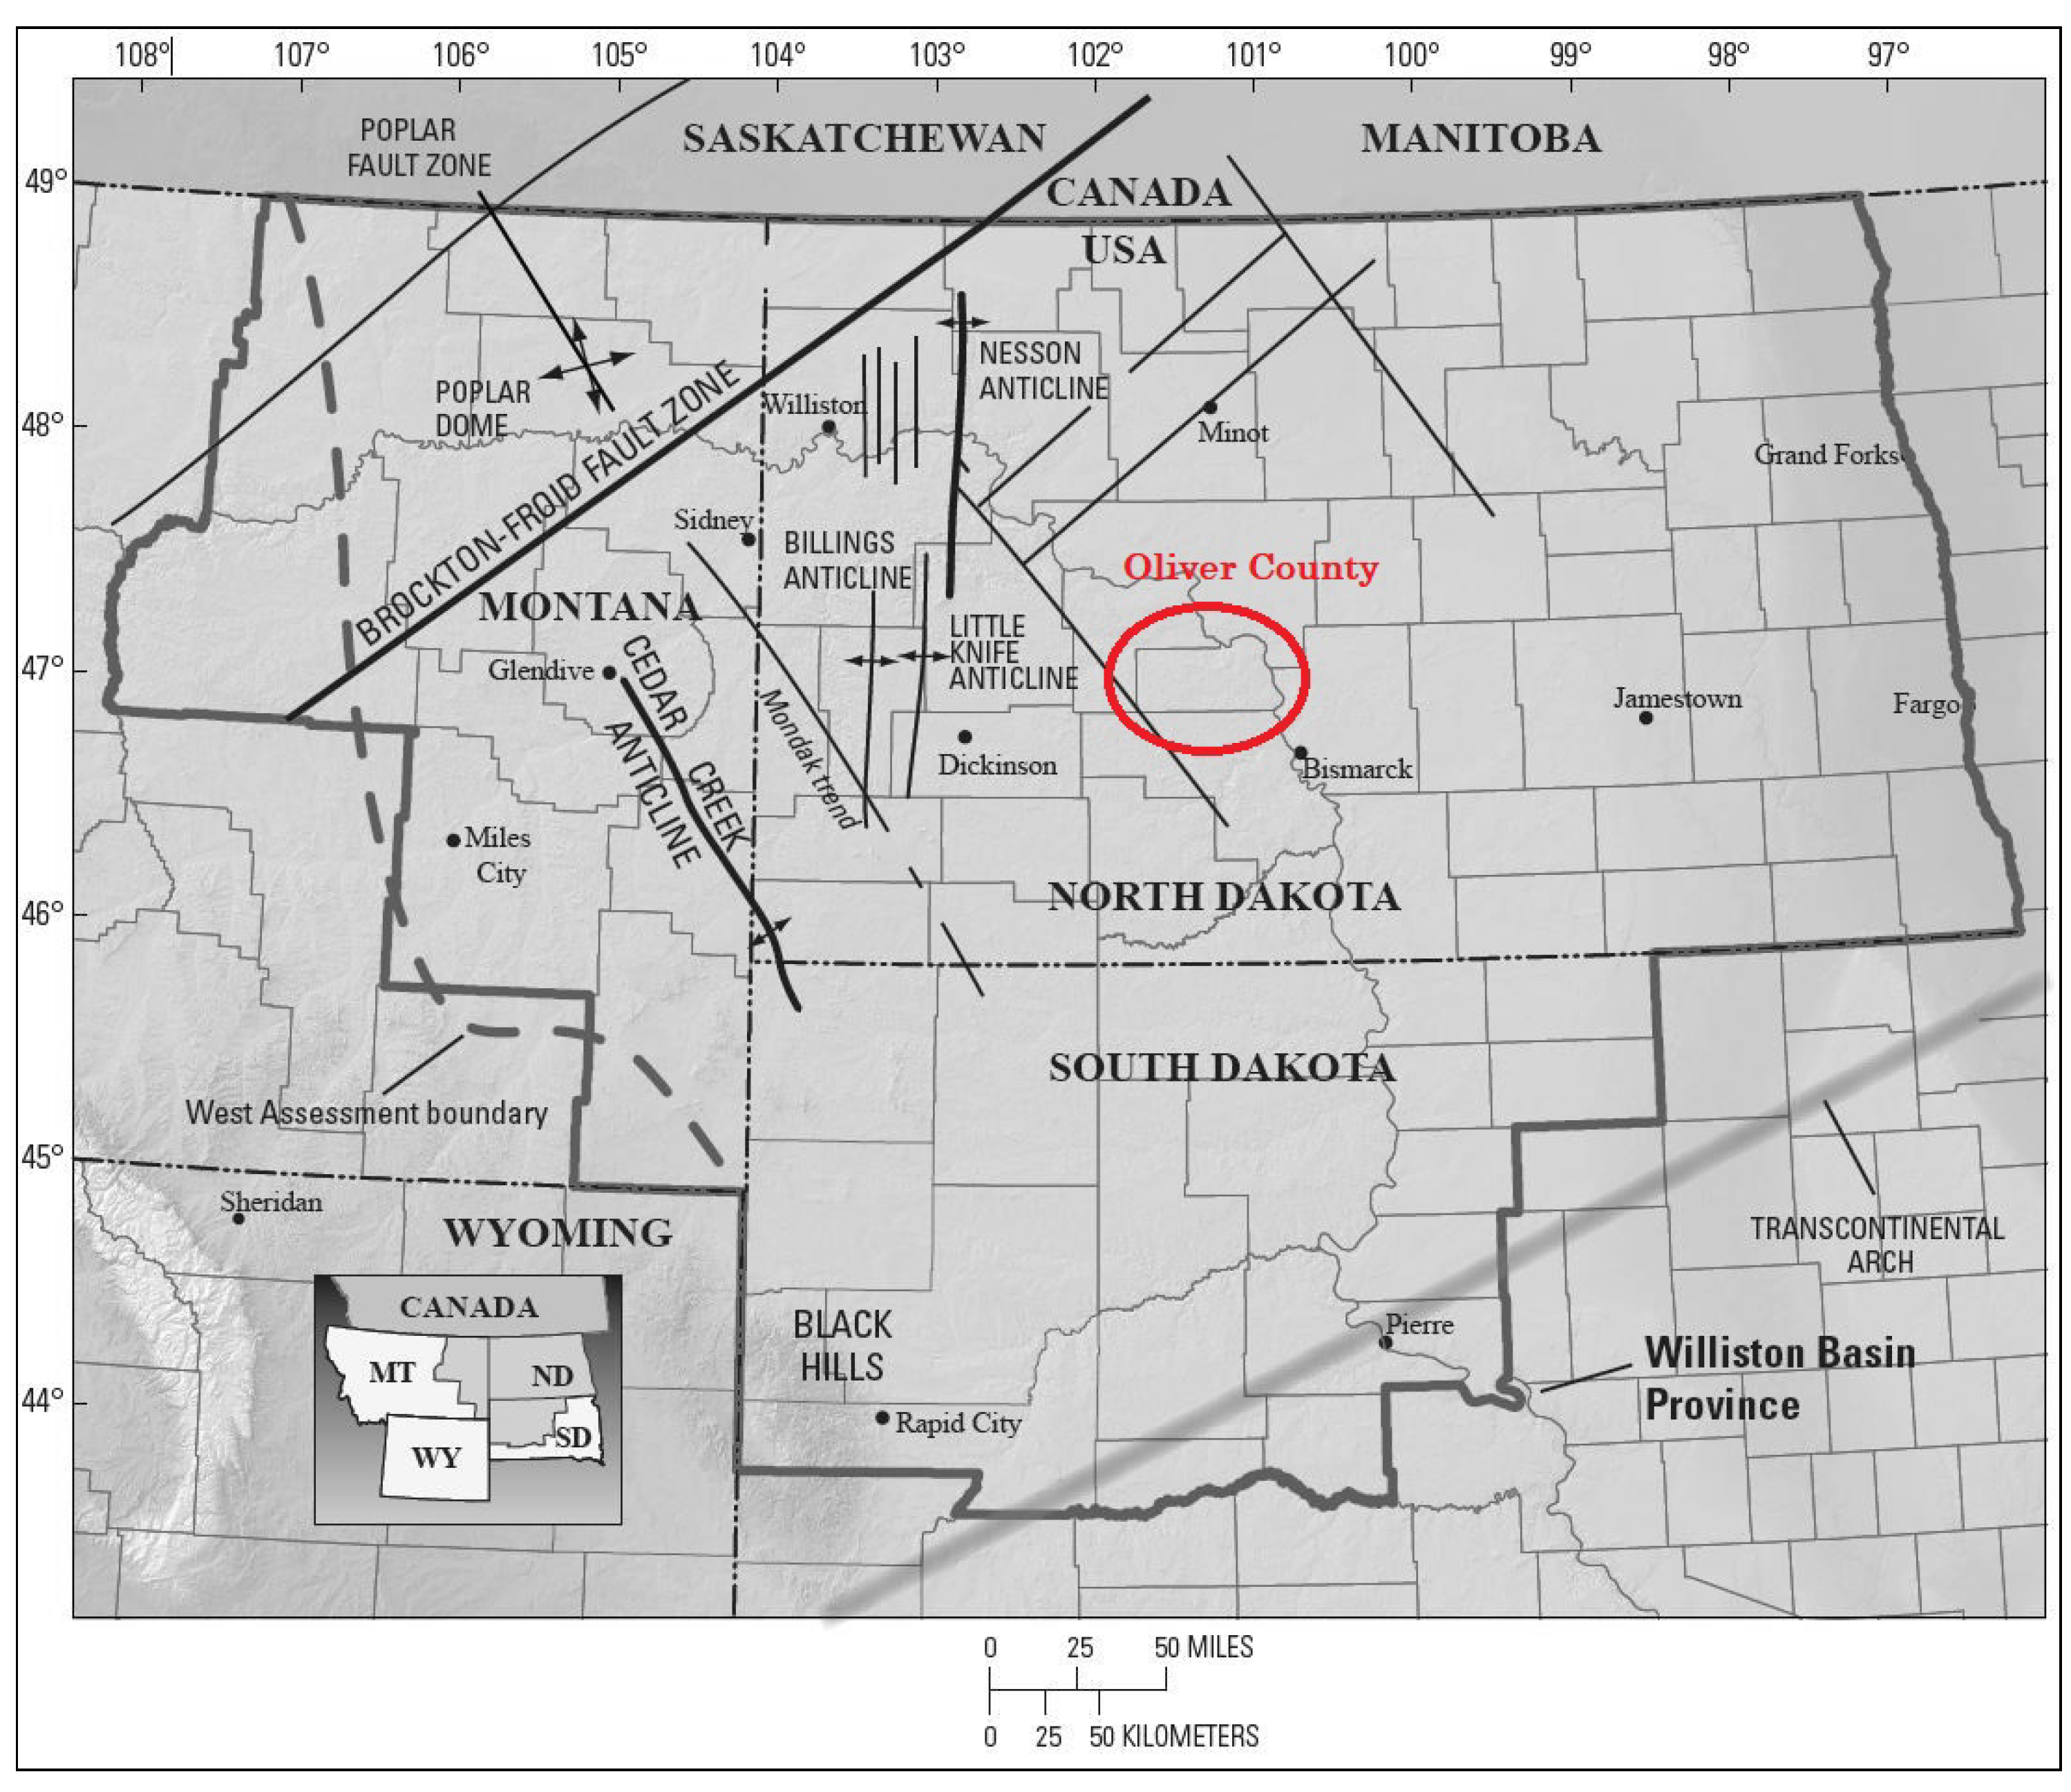
Figure 2.
Generalized stratigraphy of the Williston Basin for selected geological age units (modified after [30]).
Figure 2.
Generalized stratigraphy of the Williston Basin for selected geological age units (modified after [30]).
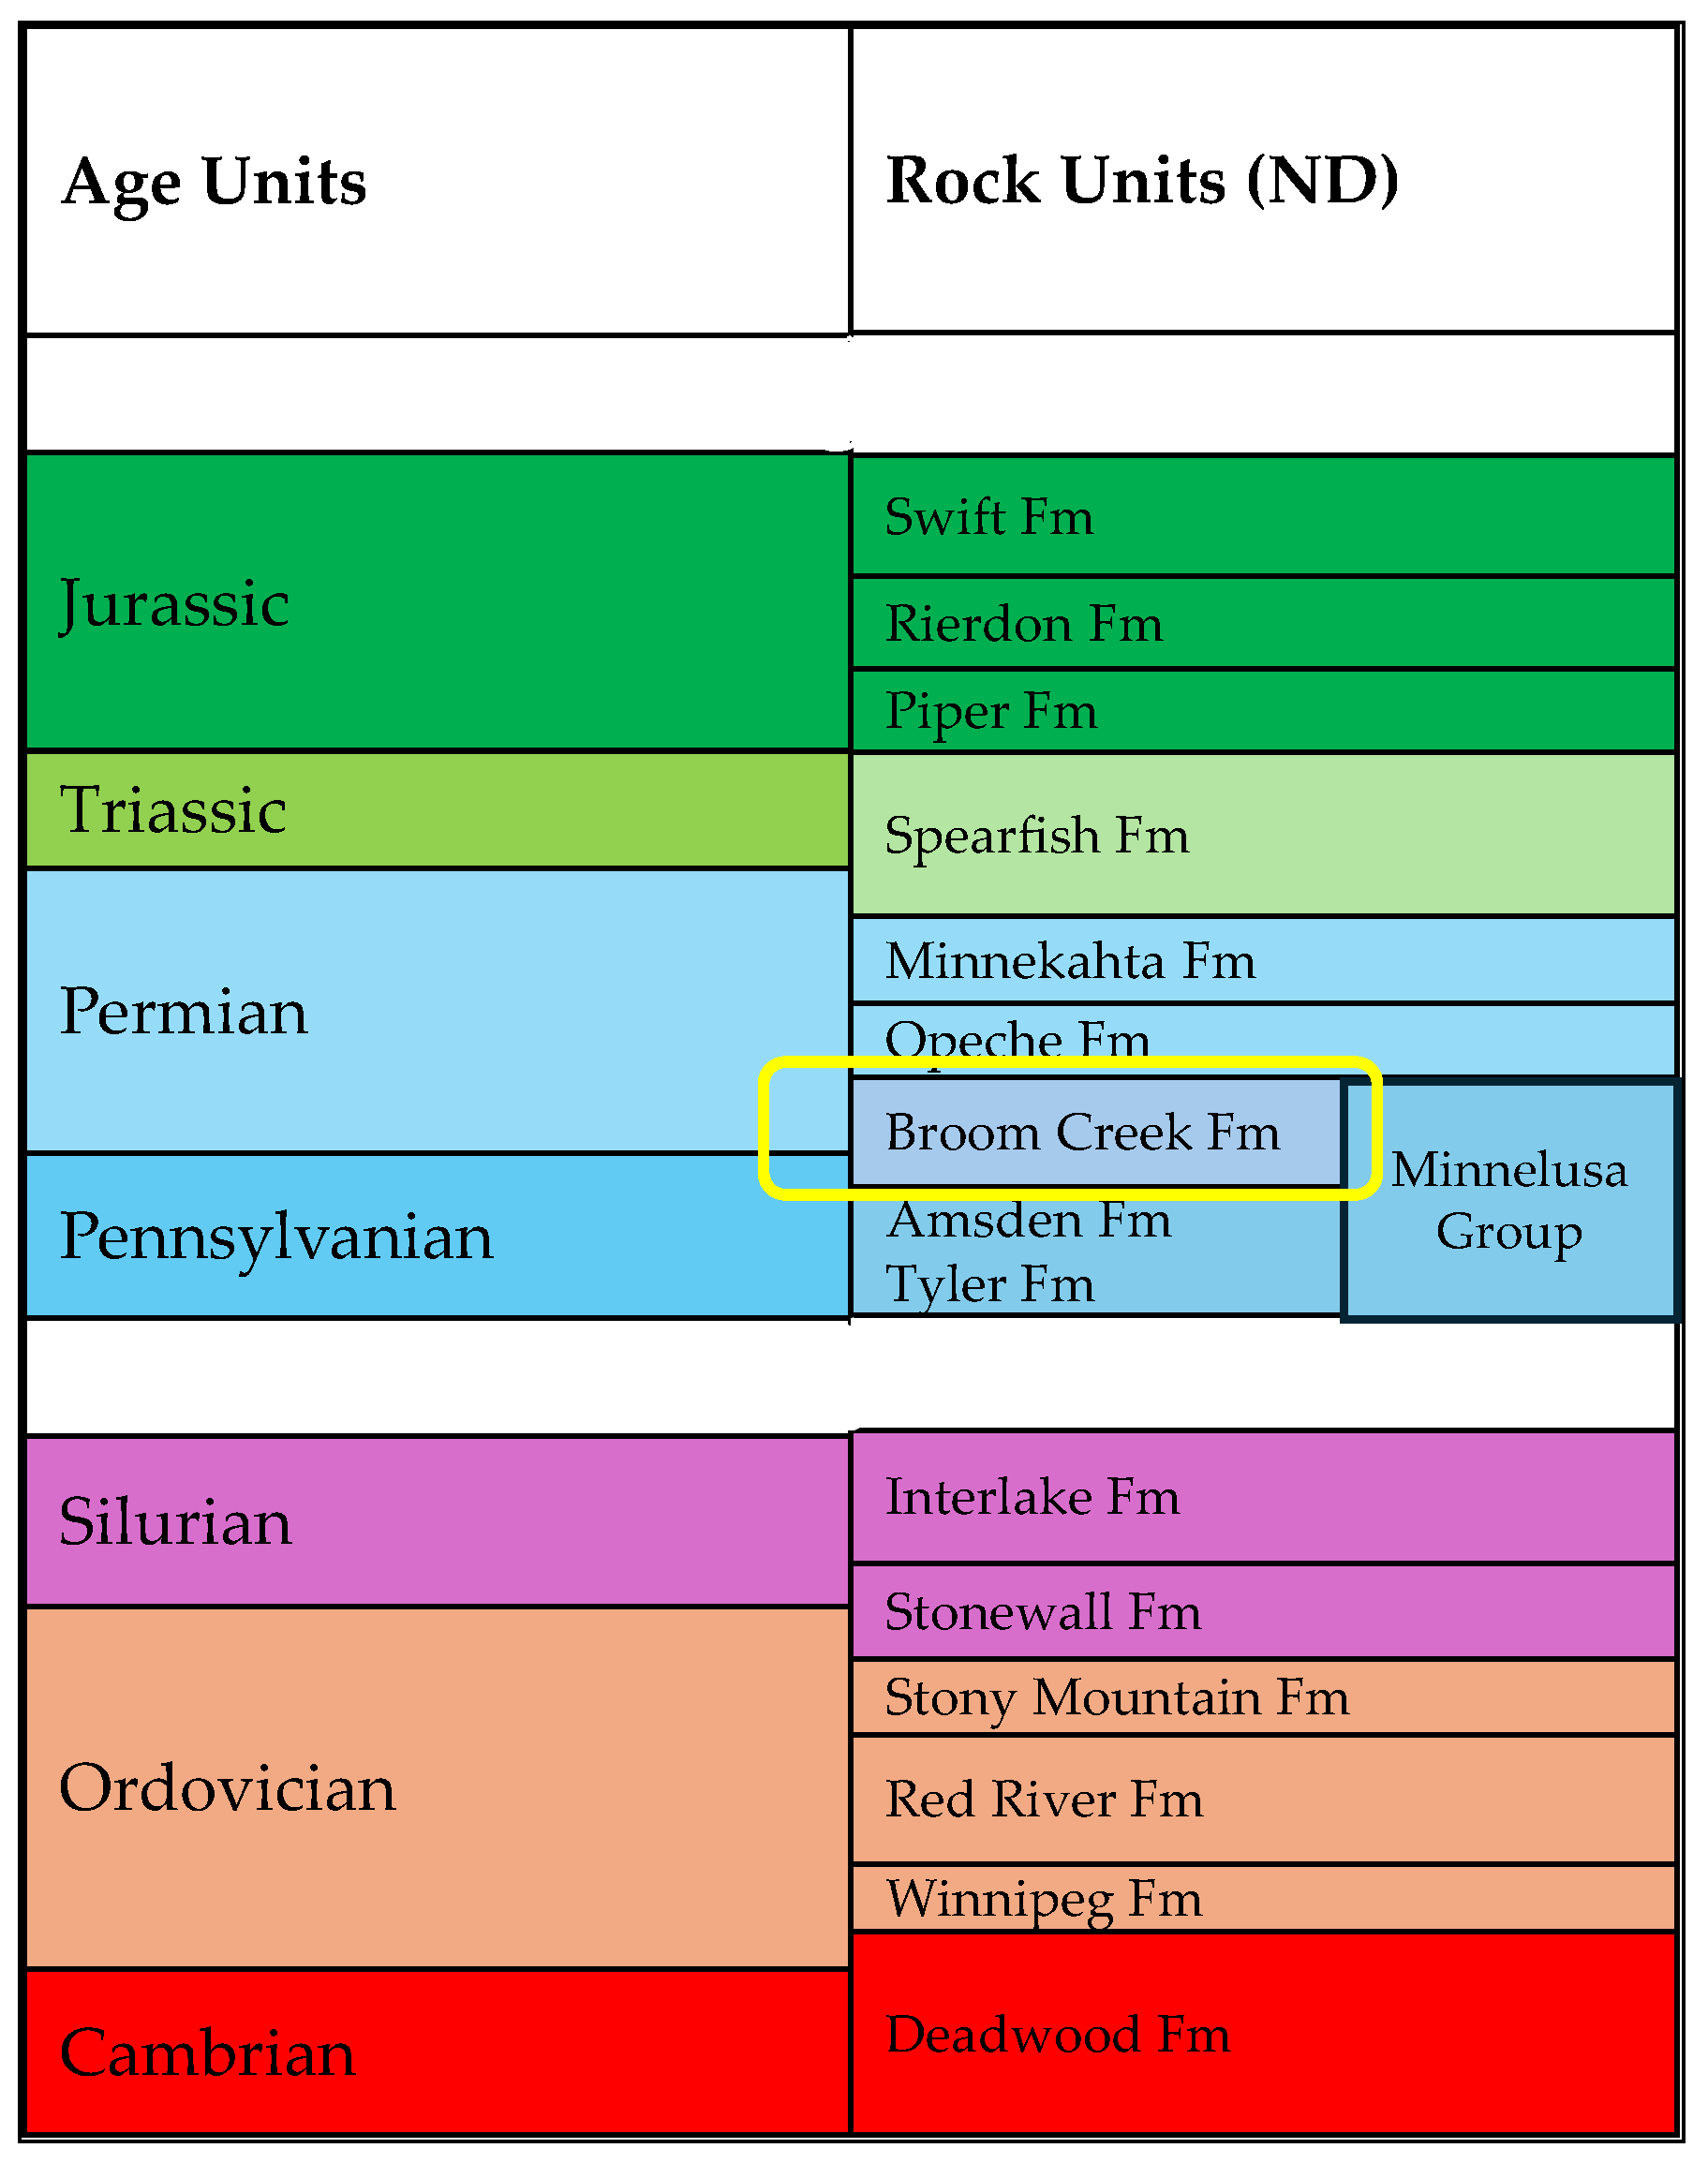
Figure 3.
The schematic diagram illustrates the sequential steps in rock physics modeling: (1) mineral mixing; (2) modeling dry rock moduli; (3) estimating the effective properties of fluids; (4) incorporating pore fluid and modeling saturated rock moduli; and (5) predicting compressional and shear wave velocities, followed by validation with measured results.
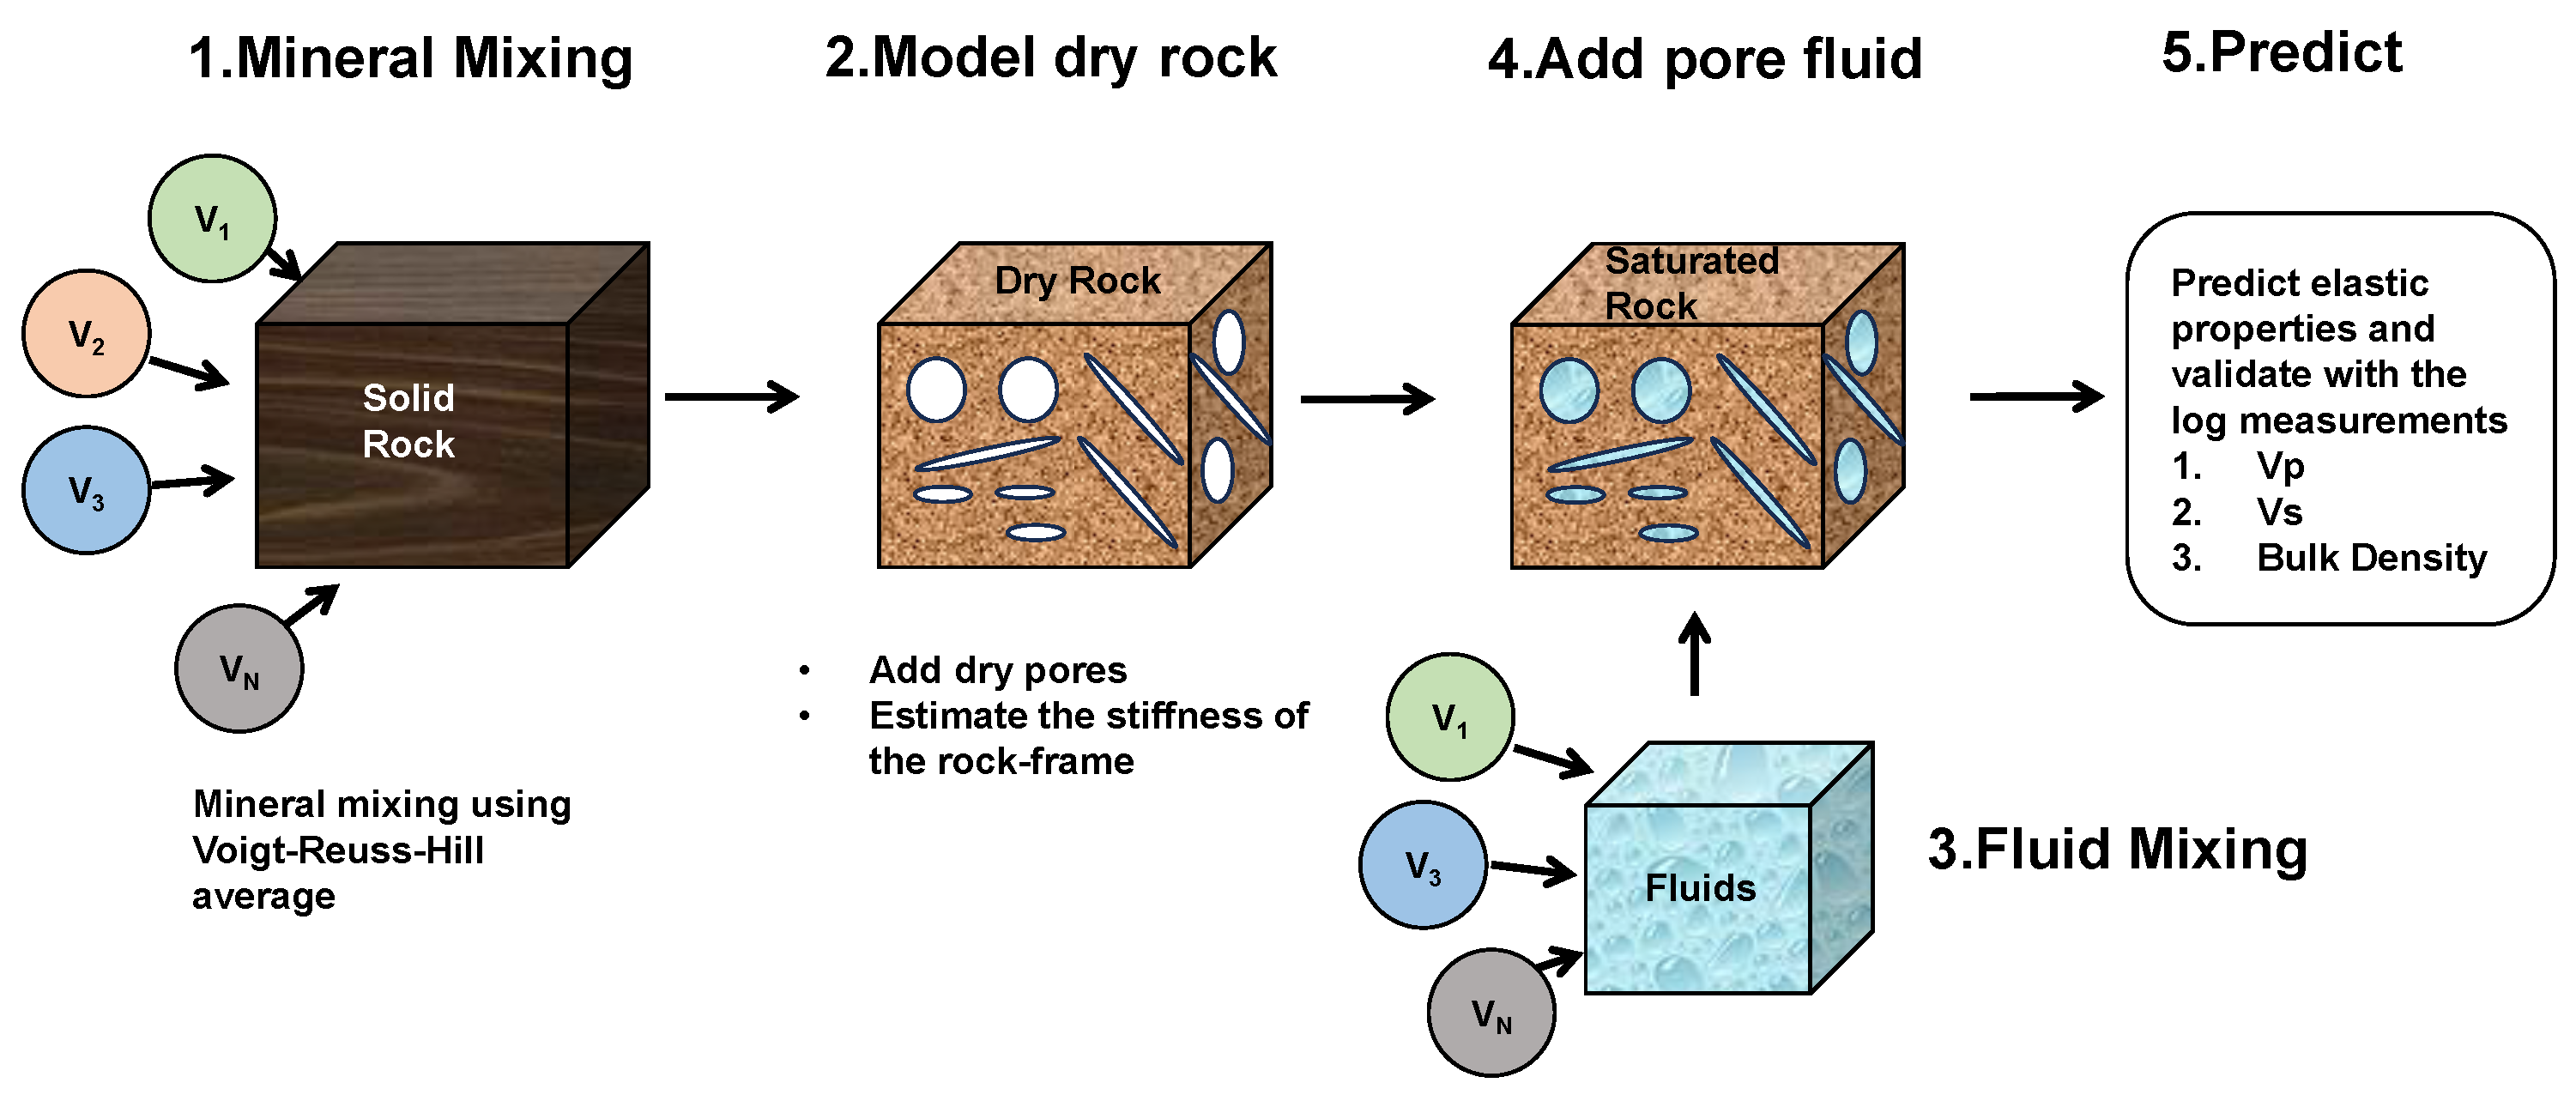
Figure 4.
Well-log cross-plot analysis: (a) composite log presentation consists of GR, CALI, BIT in track-1, resistivity array curves in track-2, RHOZ, PEZ, NPHI–DTCO in track-3 and spectral gamma-ray data in track-4. The colors on the right side are identified based on the quick-look interpretation of the basic logs. These colors are used for markers in the cross-plots (b) RHOZ-NPHI cross-plot; (c) DTCO-NPHI cross-plot; (d) RHOMAA-DTMAA cross-plot; (e) RHOMAA-UMAA cross-plot; (f) thorirum–potassium cross-plot. See Table 2 for the abbreviations and Section 4.1 for further explanation.
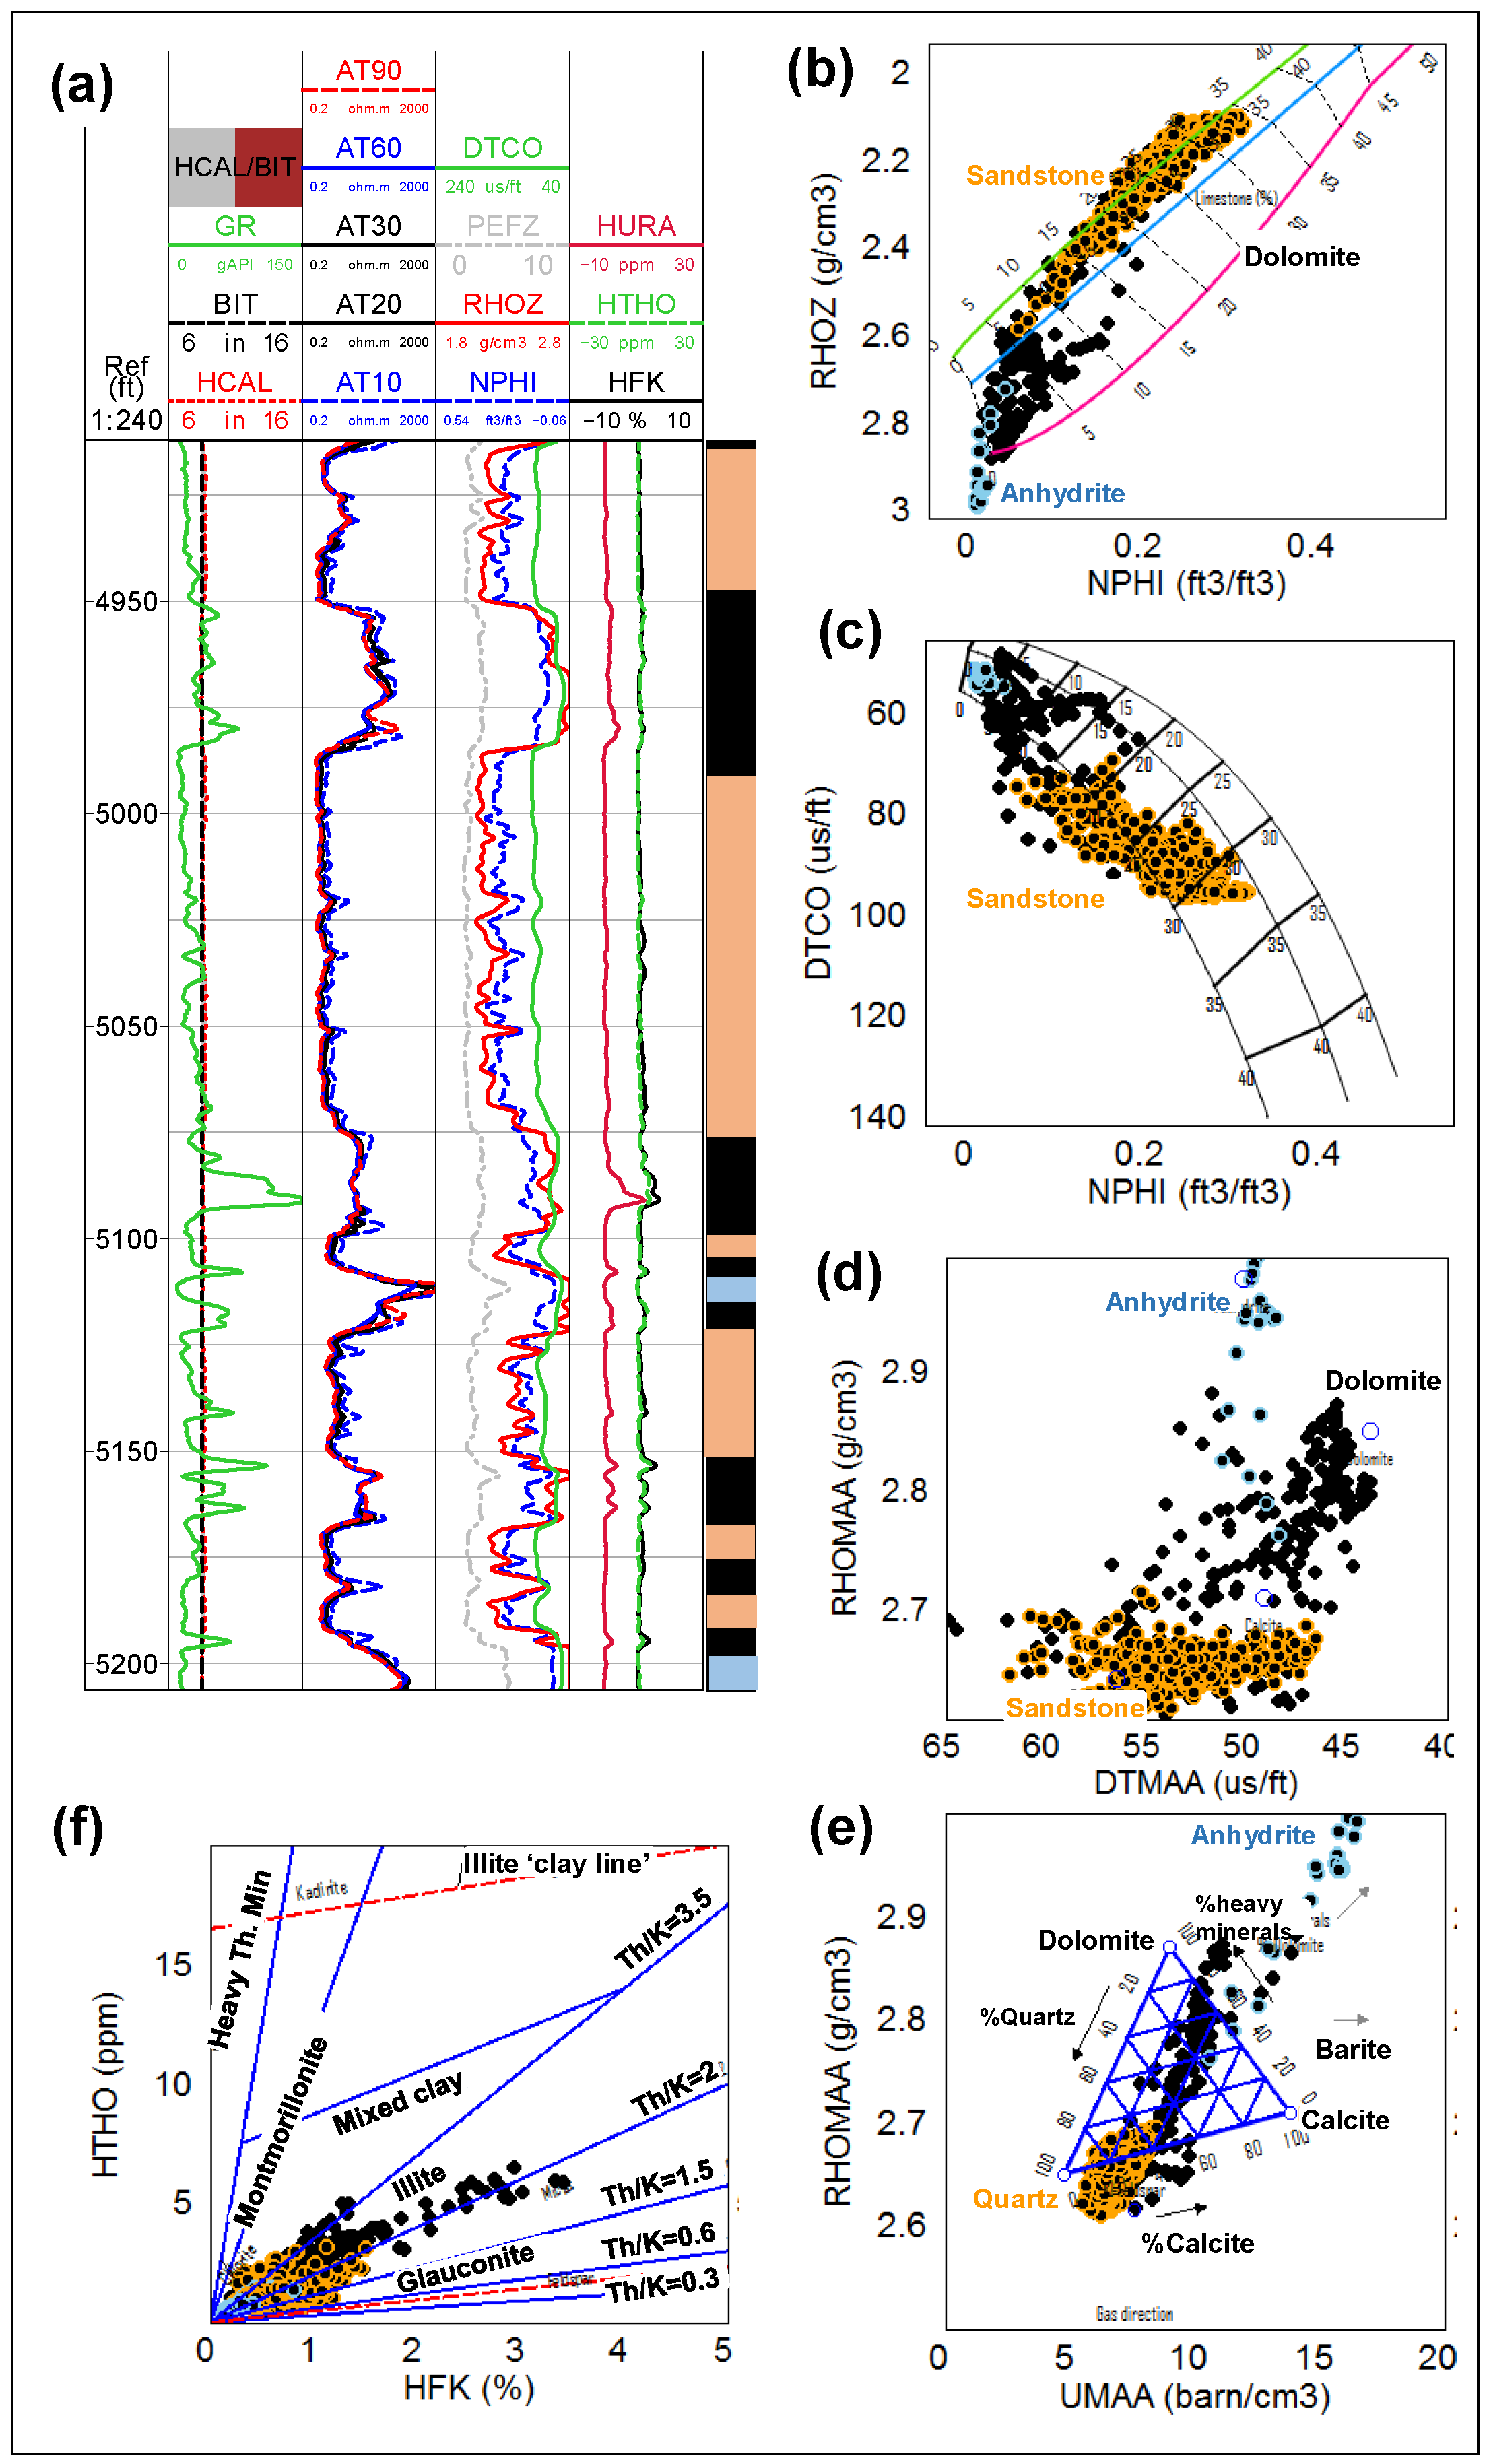
Figure 5.
Composite display of well logs and estimated mineralogical volume fractions. The reference depth is depicted along the vertical axis of the first track. The second track features gamma ray (GR) and caliper (CALI) logs, while the third track displays array induction logs. In the fourth track, RHOZ, NPHI, PEFZ, and DTCO logs are presented. The fifth track showcases spectral logs, and tracks 7–10 provide volume fractions for shale, dolomite, anhydrite, and sandstone. The XRD data are presented as red circles and overlie on the estimated volume fractions. The eleventh track represents the volumetric combination of all minerals and fluids.
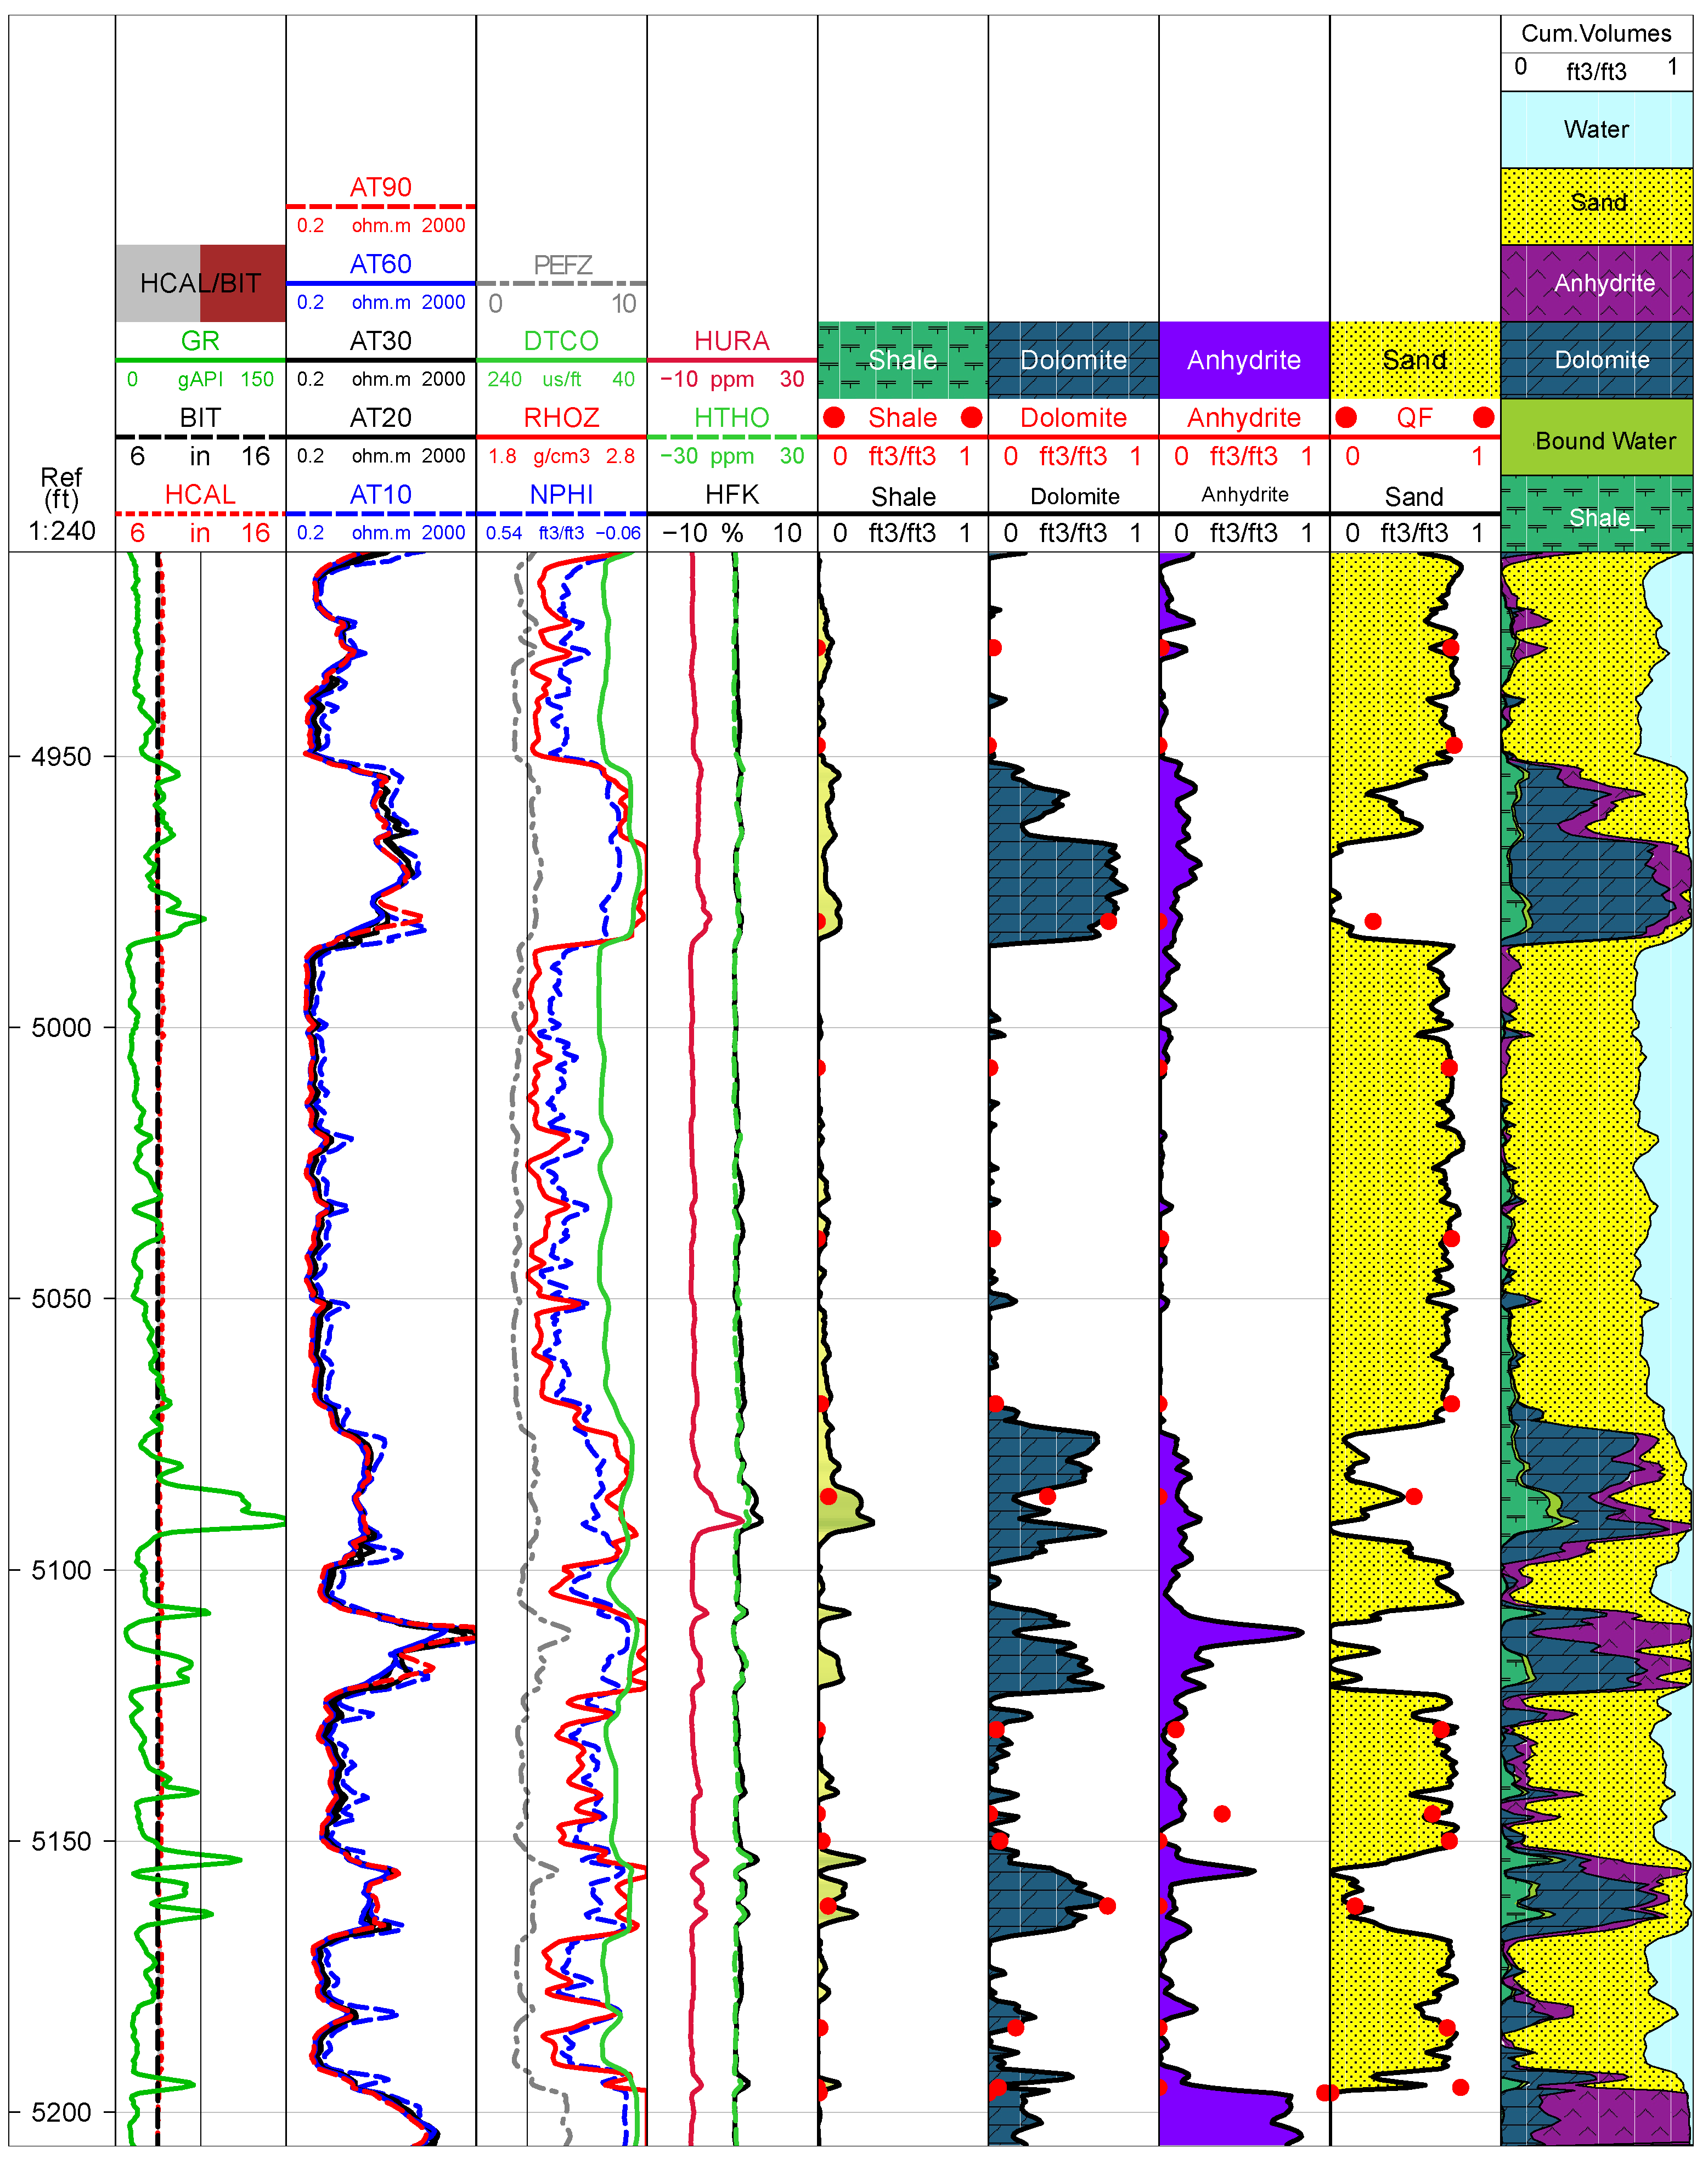
Figure 6.
Composite display of well logs and estimated porosity and permeability curves. Track-1–Track-5 are the same as in Figure 5. The 6th track represents the volumetric combination of all minerals and fluids. Estimated effective porosity (PHIE) and total porosity (PHIT), along with the NMR-measured porosities (CMRP_3MS and TCMR), are presented in track 7. Estimated permeabilities (K_Coates), along with the NMR-derived permeabilities (KSDR and KTIM), are presented in track 8. The porosity and permeability derived from routine core analysis are red circles and overlaid on the estimated values.
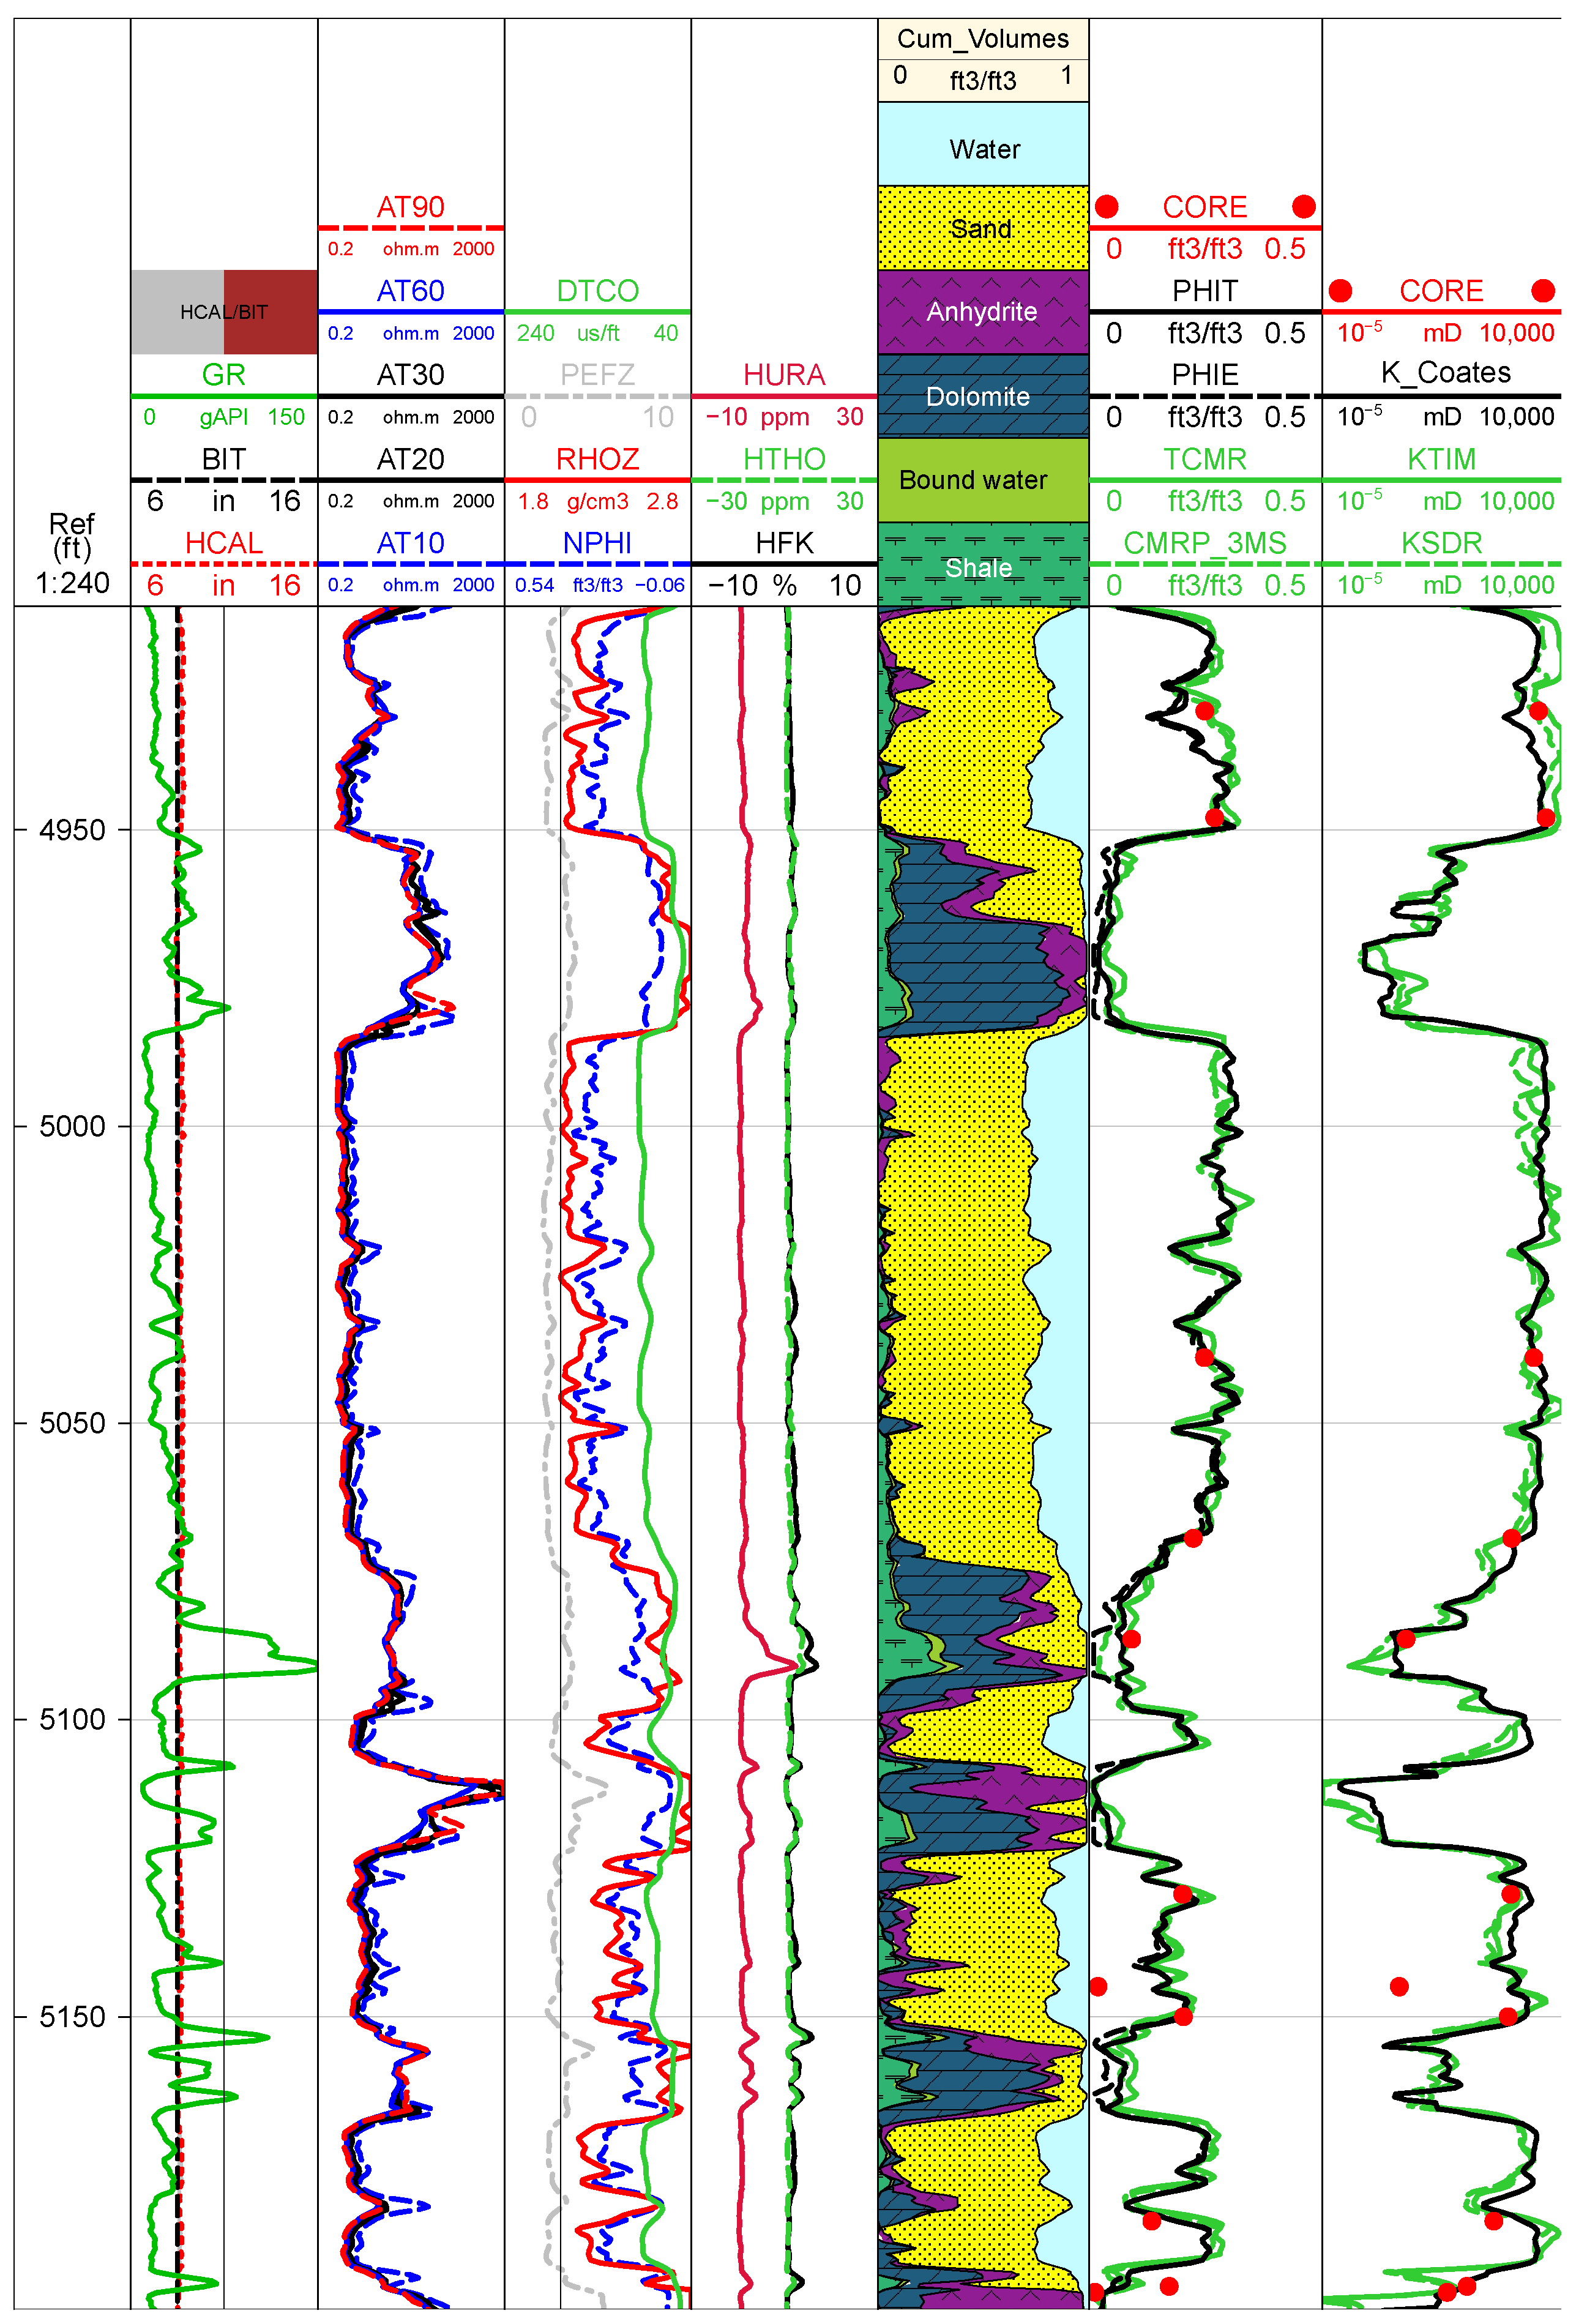
Figure 7.
Picket plot: log–log representation of formation total porosity versus deep resistivity of clean porous sandstone intervals. Archie’s parameters are indicated in the figure, with a corresponding Rw of 0.055 ohm.m at formation temperature 150 °F.
Figure 7.
Picket plot: log–log representation of formation total porosity versus deep resistivity of clean porous sandstone intervals. Archie’s parameters are indicated in the figure, with a corresponding Rw of 0.055 ohm.m at formation temperature 150 °F.
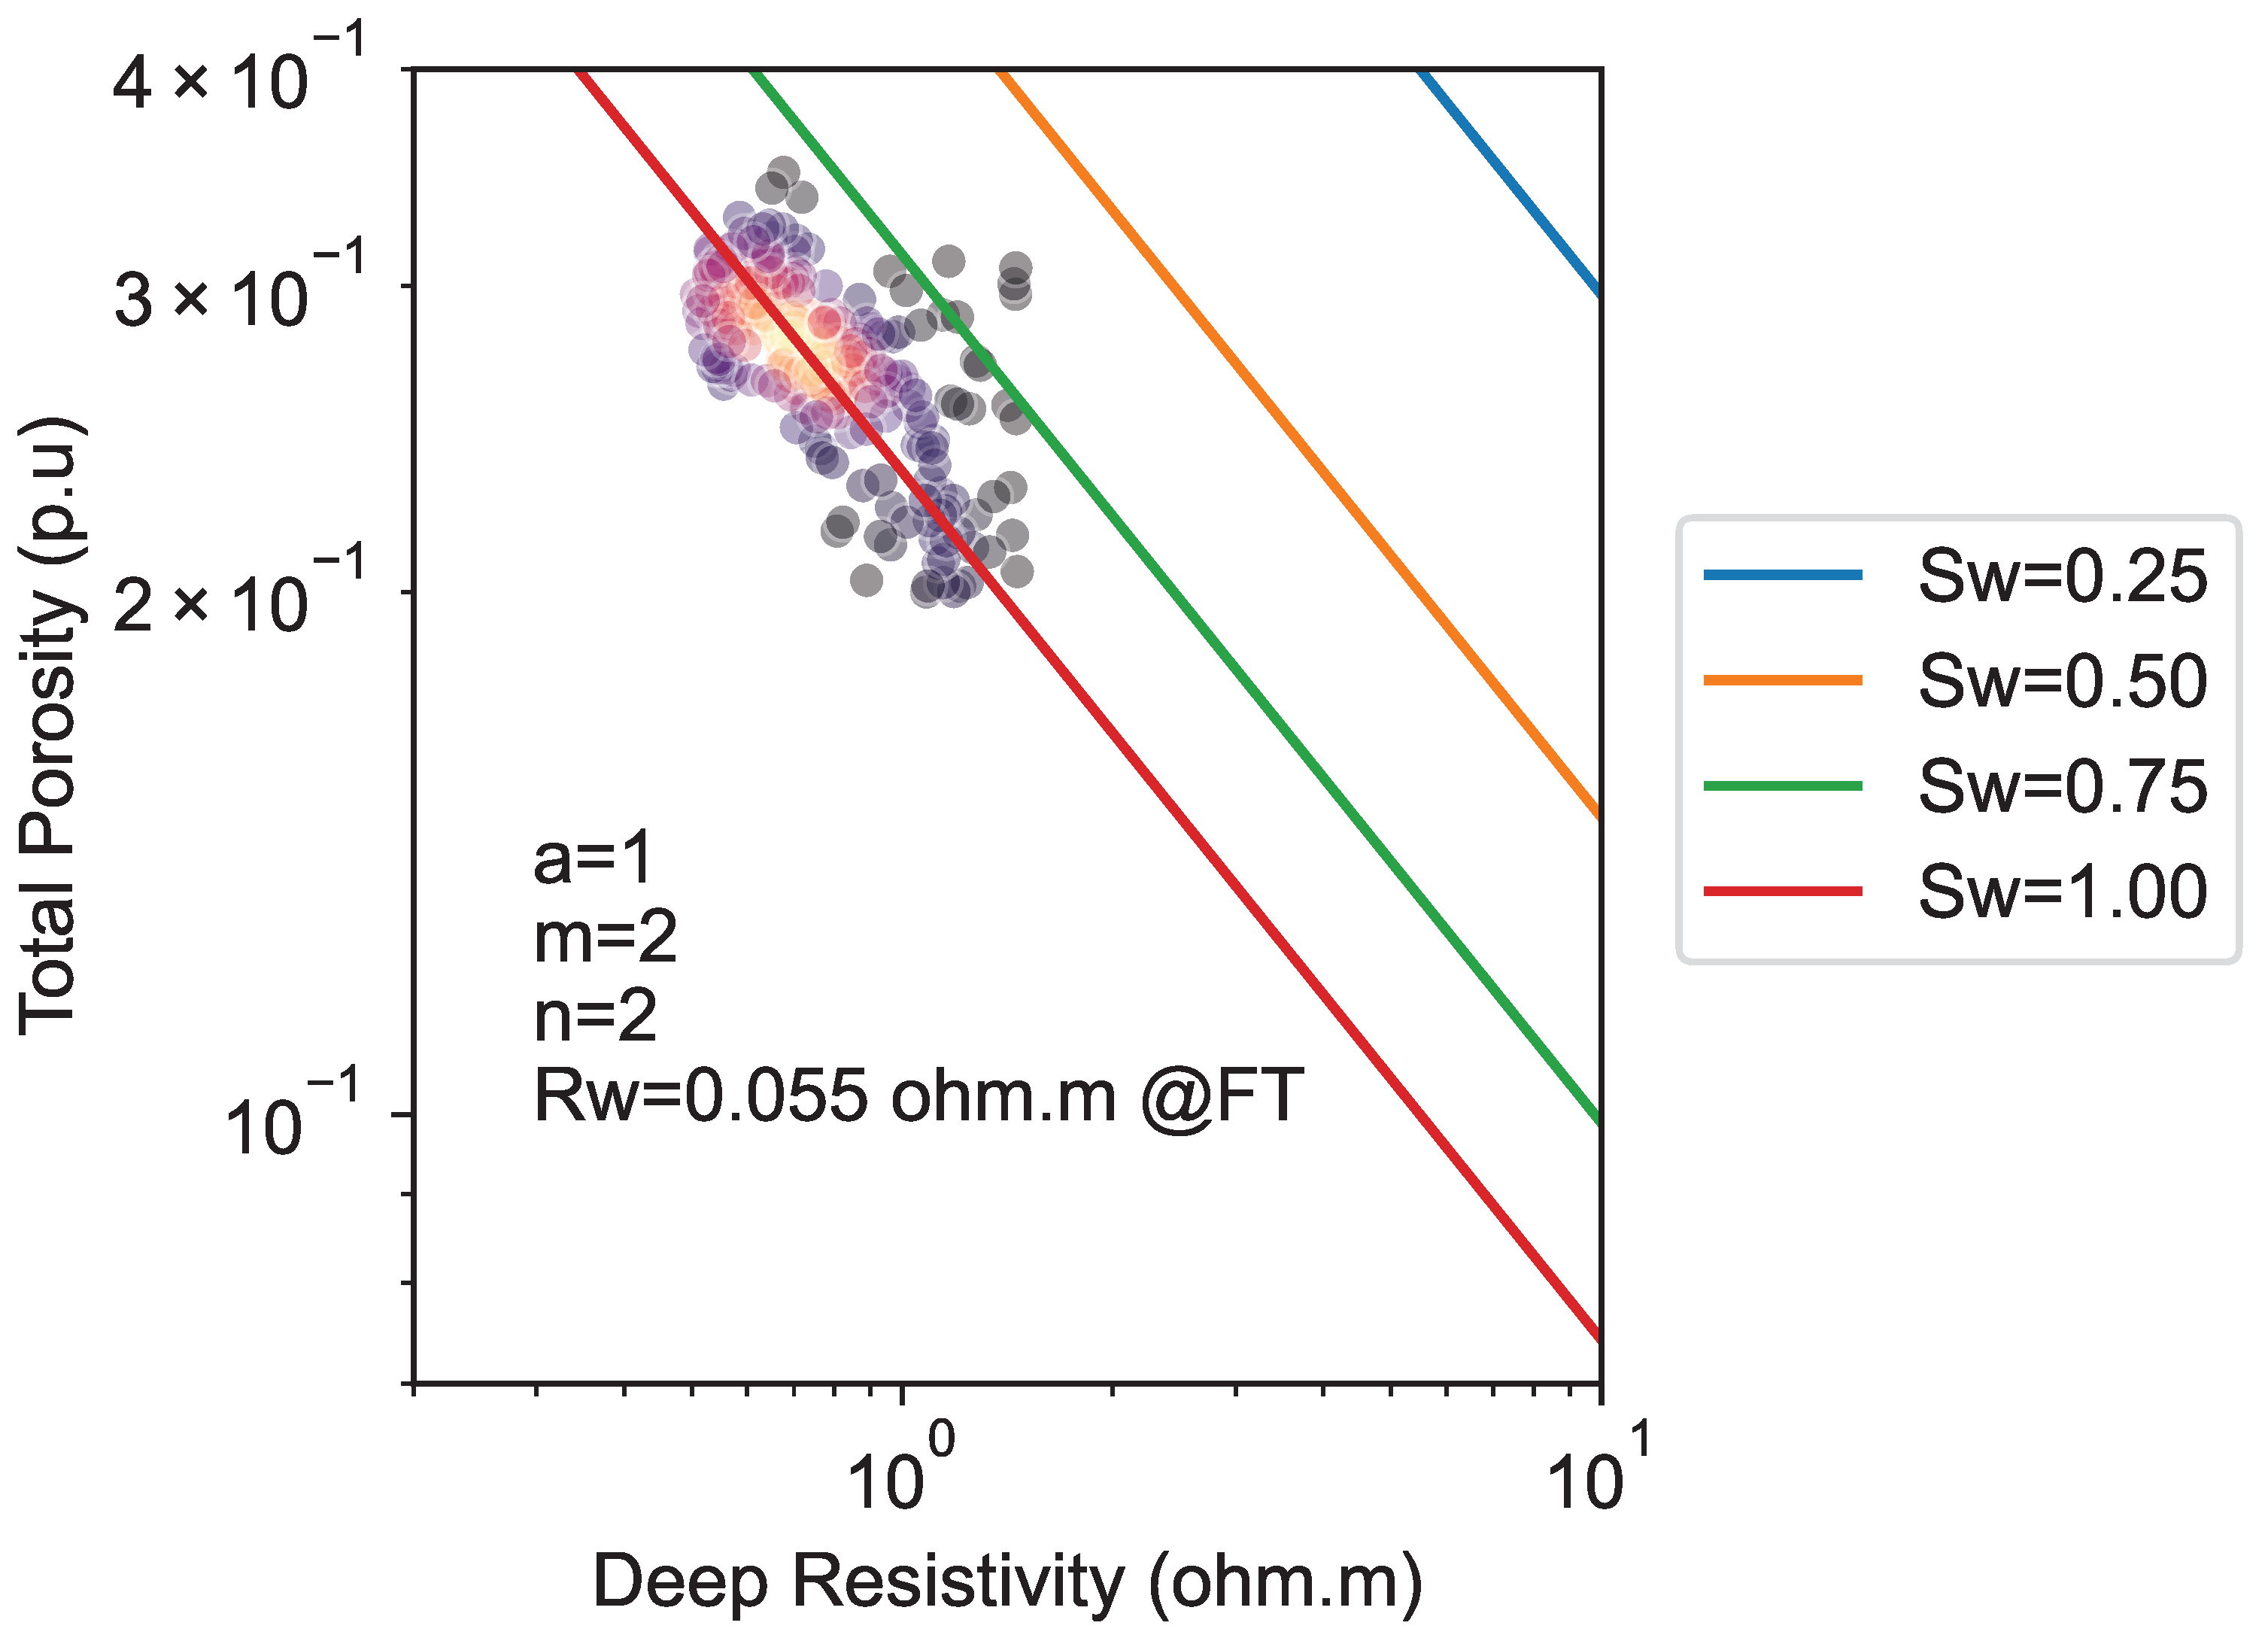
Figure 8.
The figure illustrates the pore-throat size distribution and mercury saturation of six samples collected at various depths. Subplots (a–f) indicate the pore-throat size distribution of samples at depths 4948 ft, 4980.5 ft, 5007.5 ft, 5069.5 ft, 5086.5 ft and 5145 ft respectively.
Figure 8.
The figure illustrates the pore-throat size distribution and mercury saturation of six samples collected at various depths. Subplots (a–f) indicate the pore-throat size distribution of samples at depths 4948 ft, 4980.5 ft, 5007.5 ft, 5069.5 ft, 5086.5 ft and 5145 ft respectively.
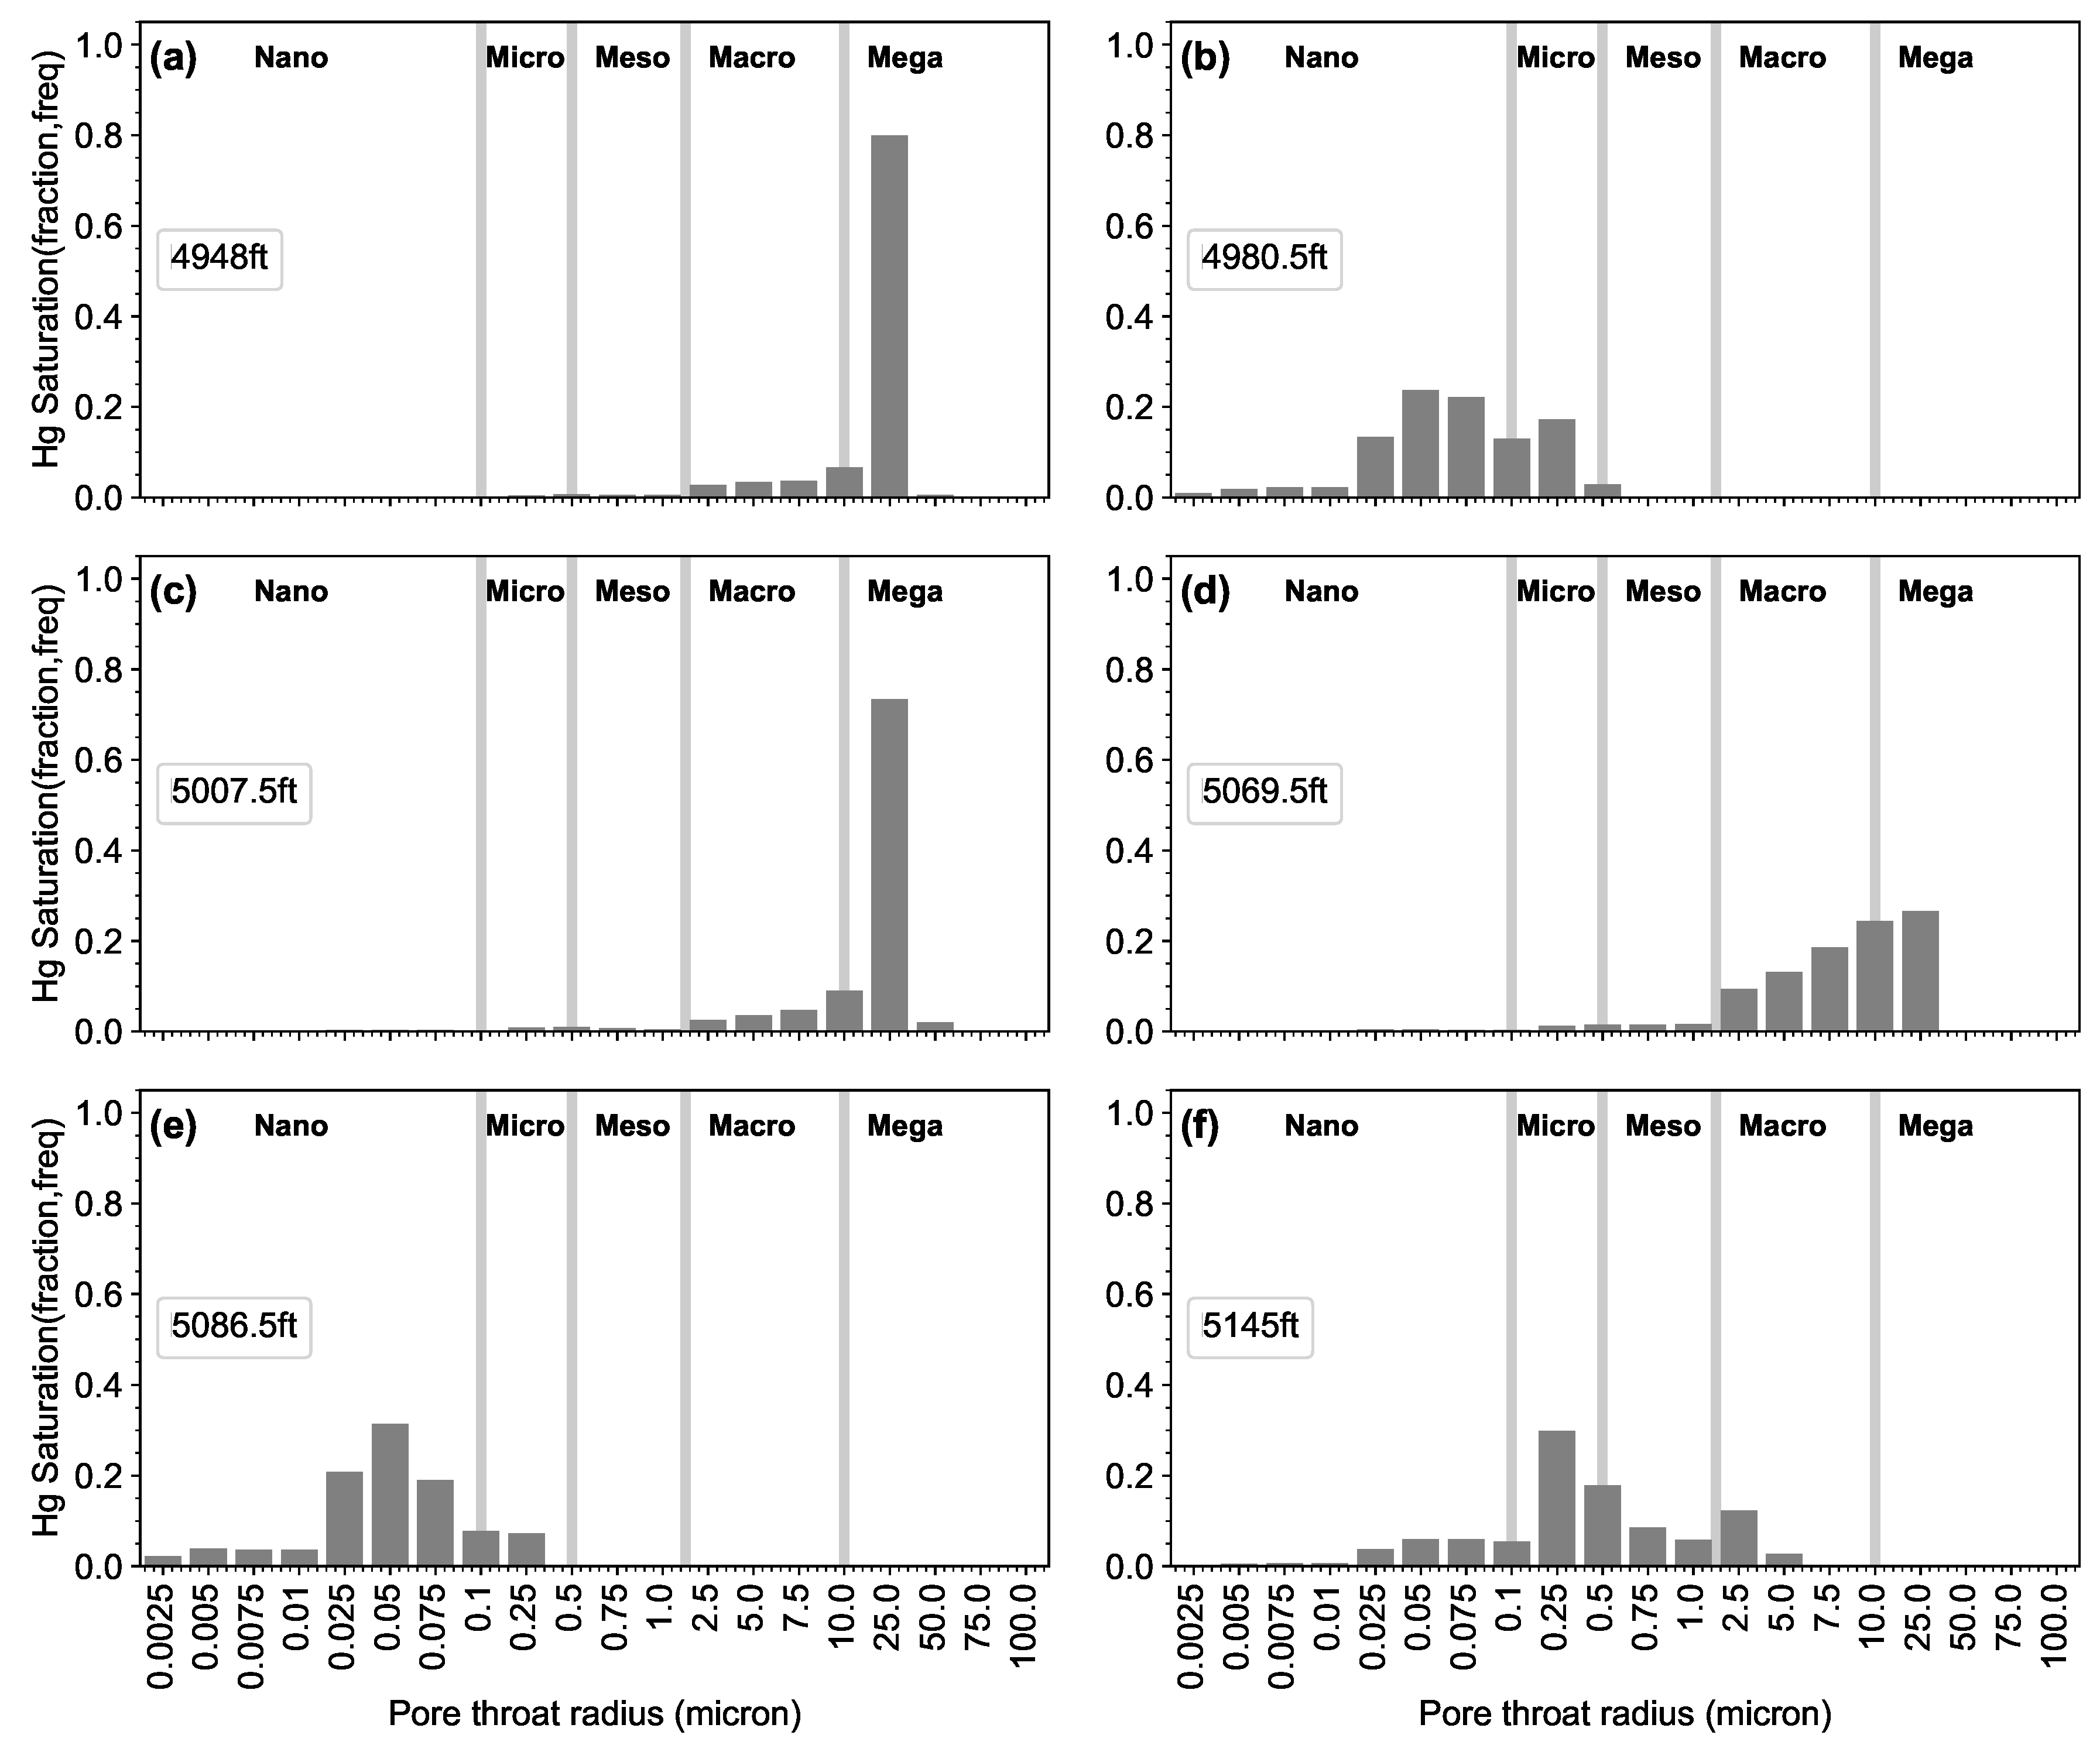
Figure 9.
Quality control and data analysis through cross-plots: (a) compressional wave velocity vs. porosity; (b) shear wave velocity vs. porosity; (c) compressional-to-shear wave velocity ratio vs. acoustic impedance. Detailed explanations for each subplot are provided in the accompanying text.
Figure 9.
Quality control and data analysis through cross-plots: (a) compressional wave velocity vs. porosity; (b) shear wave velocity vs. porosity; (c) compressional-to-shear wave velocity ratio vs. acoustic impedance. Detailed explanations for each subplot are provided in the accompanying text.

Figure 10.
Bulk modulus measurement and porosity values overlayed on theoretical bounds. The plot illustrates measured bulk modulus values alongside corresponding porosity values, juxtaposed against theoretical bounds on bulk modulus.
Figure 10.
Bulk modulus measurement and porosity values overlayed on theoretical bounds. The plot illustrates measured bulk modulus values alongside corresponding porosity values, juxtaposed against theoretical bounds on bulk modulus.
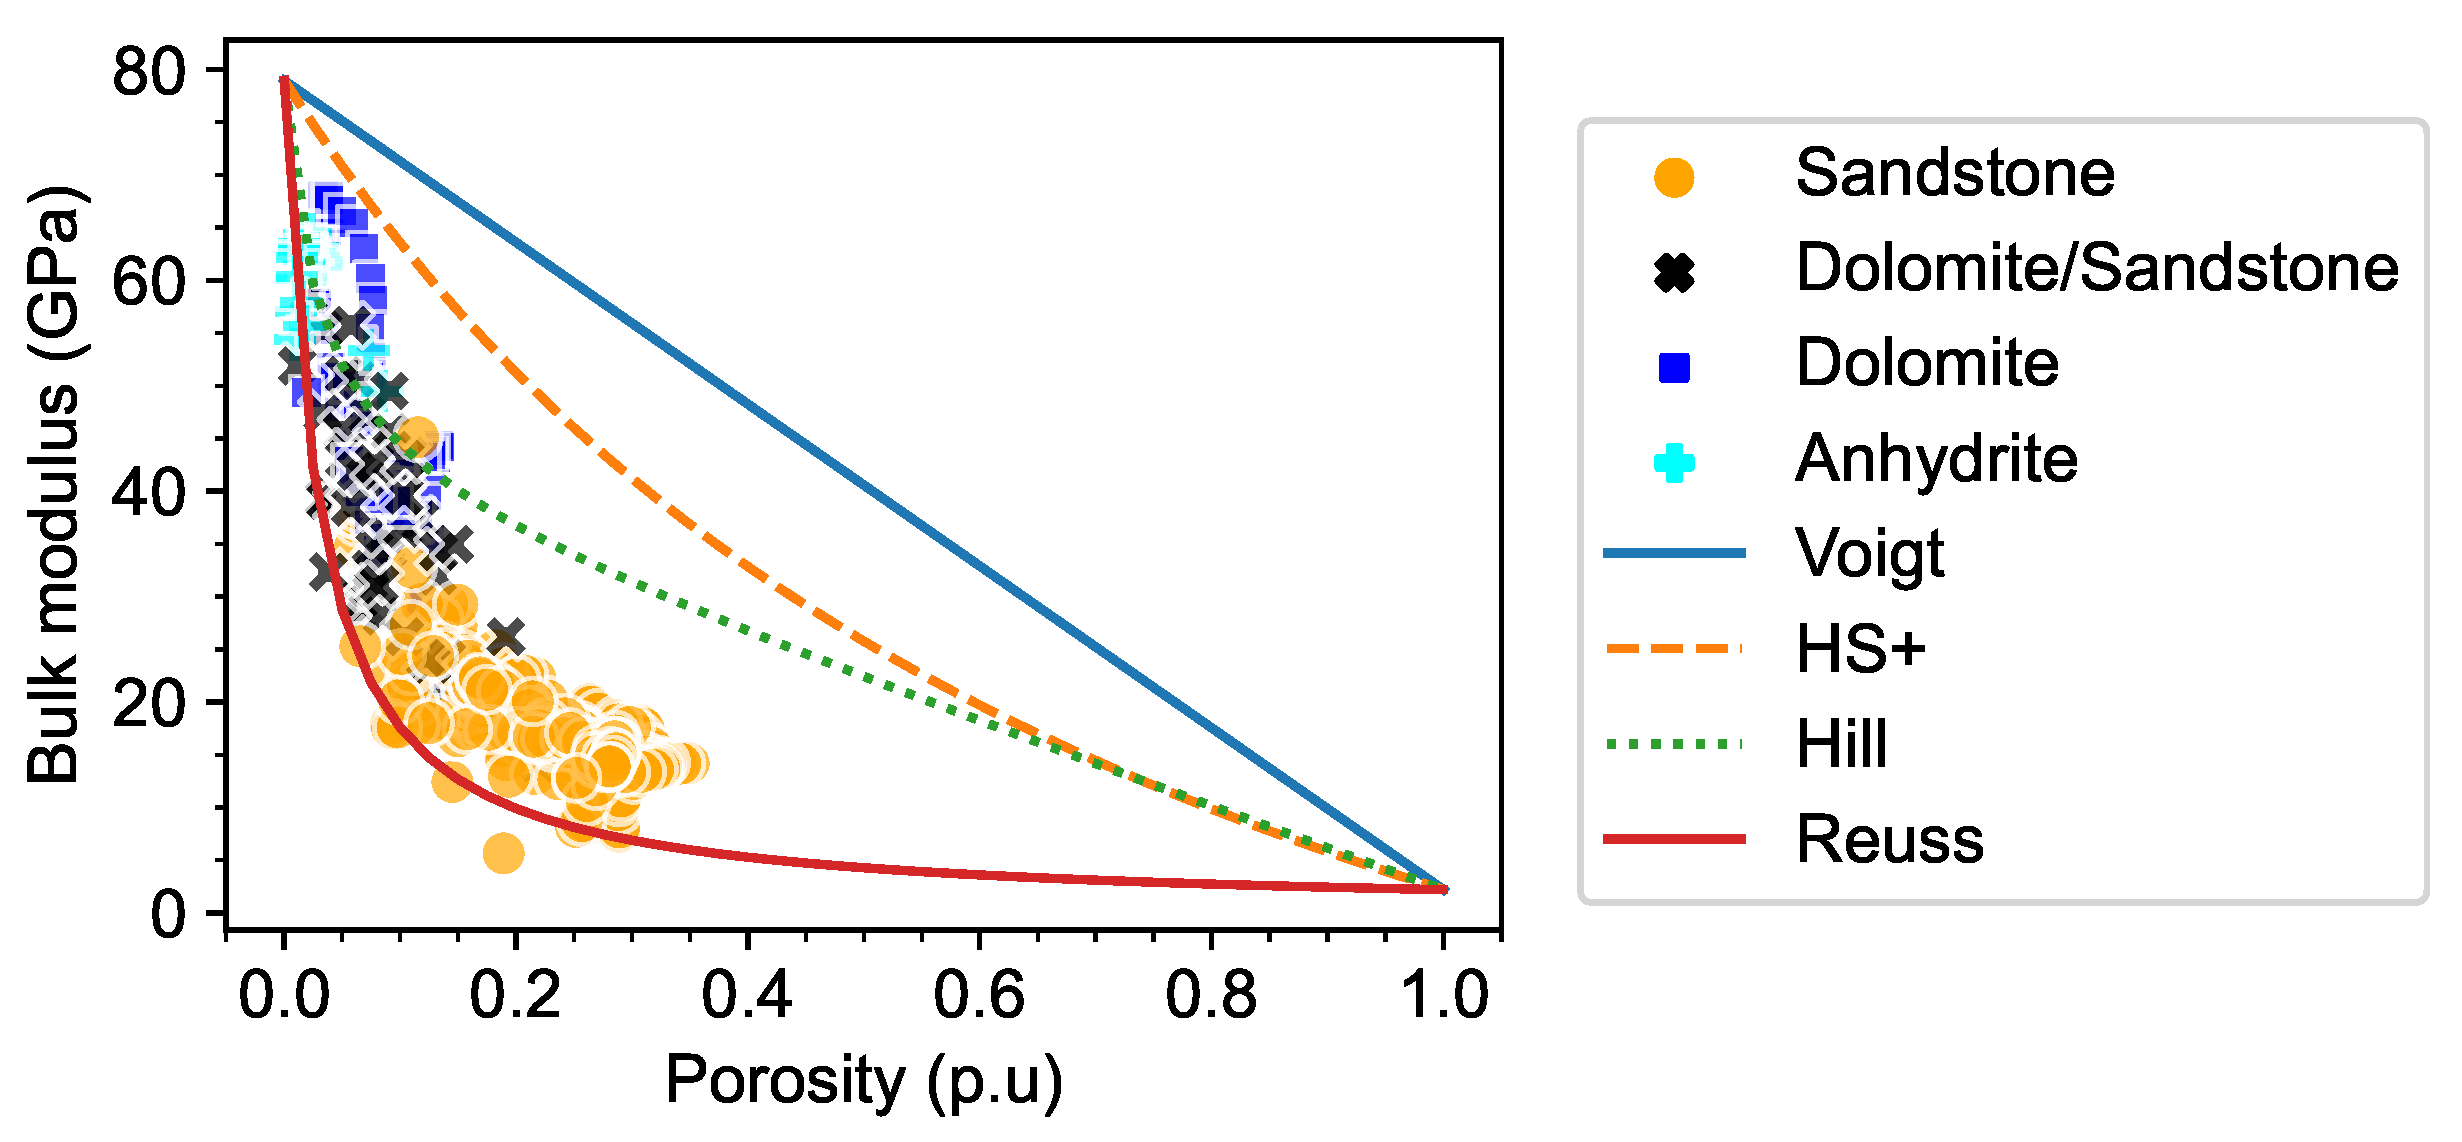
Figure 11.
Composite display of well logs and estimated porosity and permeability curves. Track-1–Track-6 are the same as Figure 6. The 7th track presents the solid-phase bulk moduli, and the 8th track contains the moduli of the saturated rock derived using self-consistent approximation. The 9th and 10th tracks contain the Vp and Vs for predicted logs (VP_RPM and VS_RPM) and measured logs (V_P and V_S).
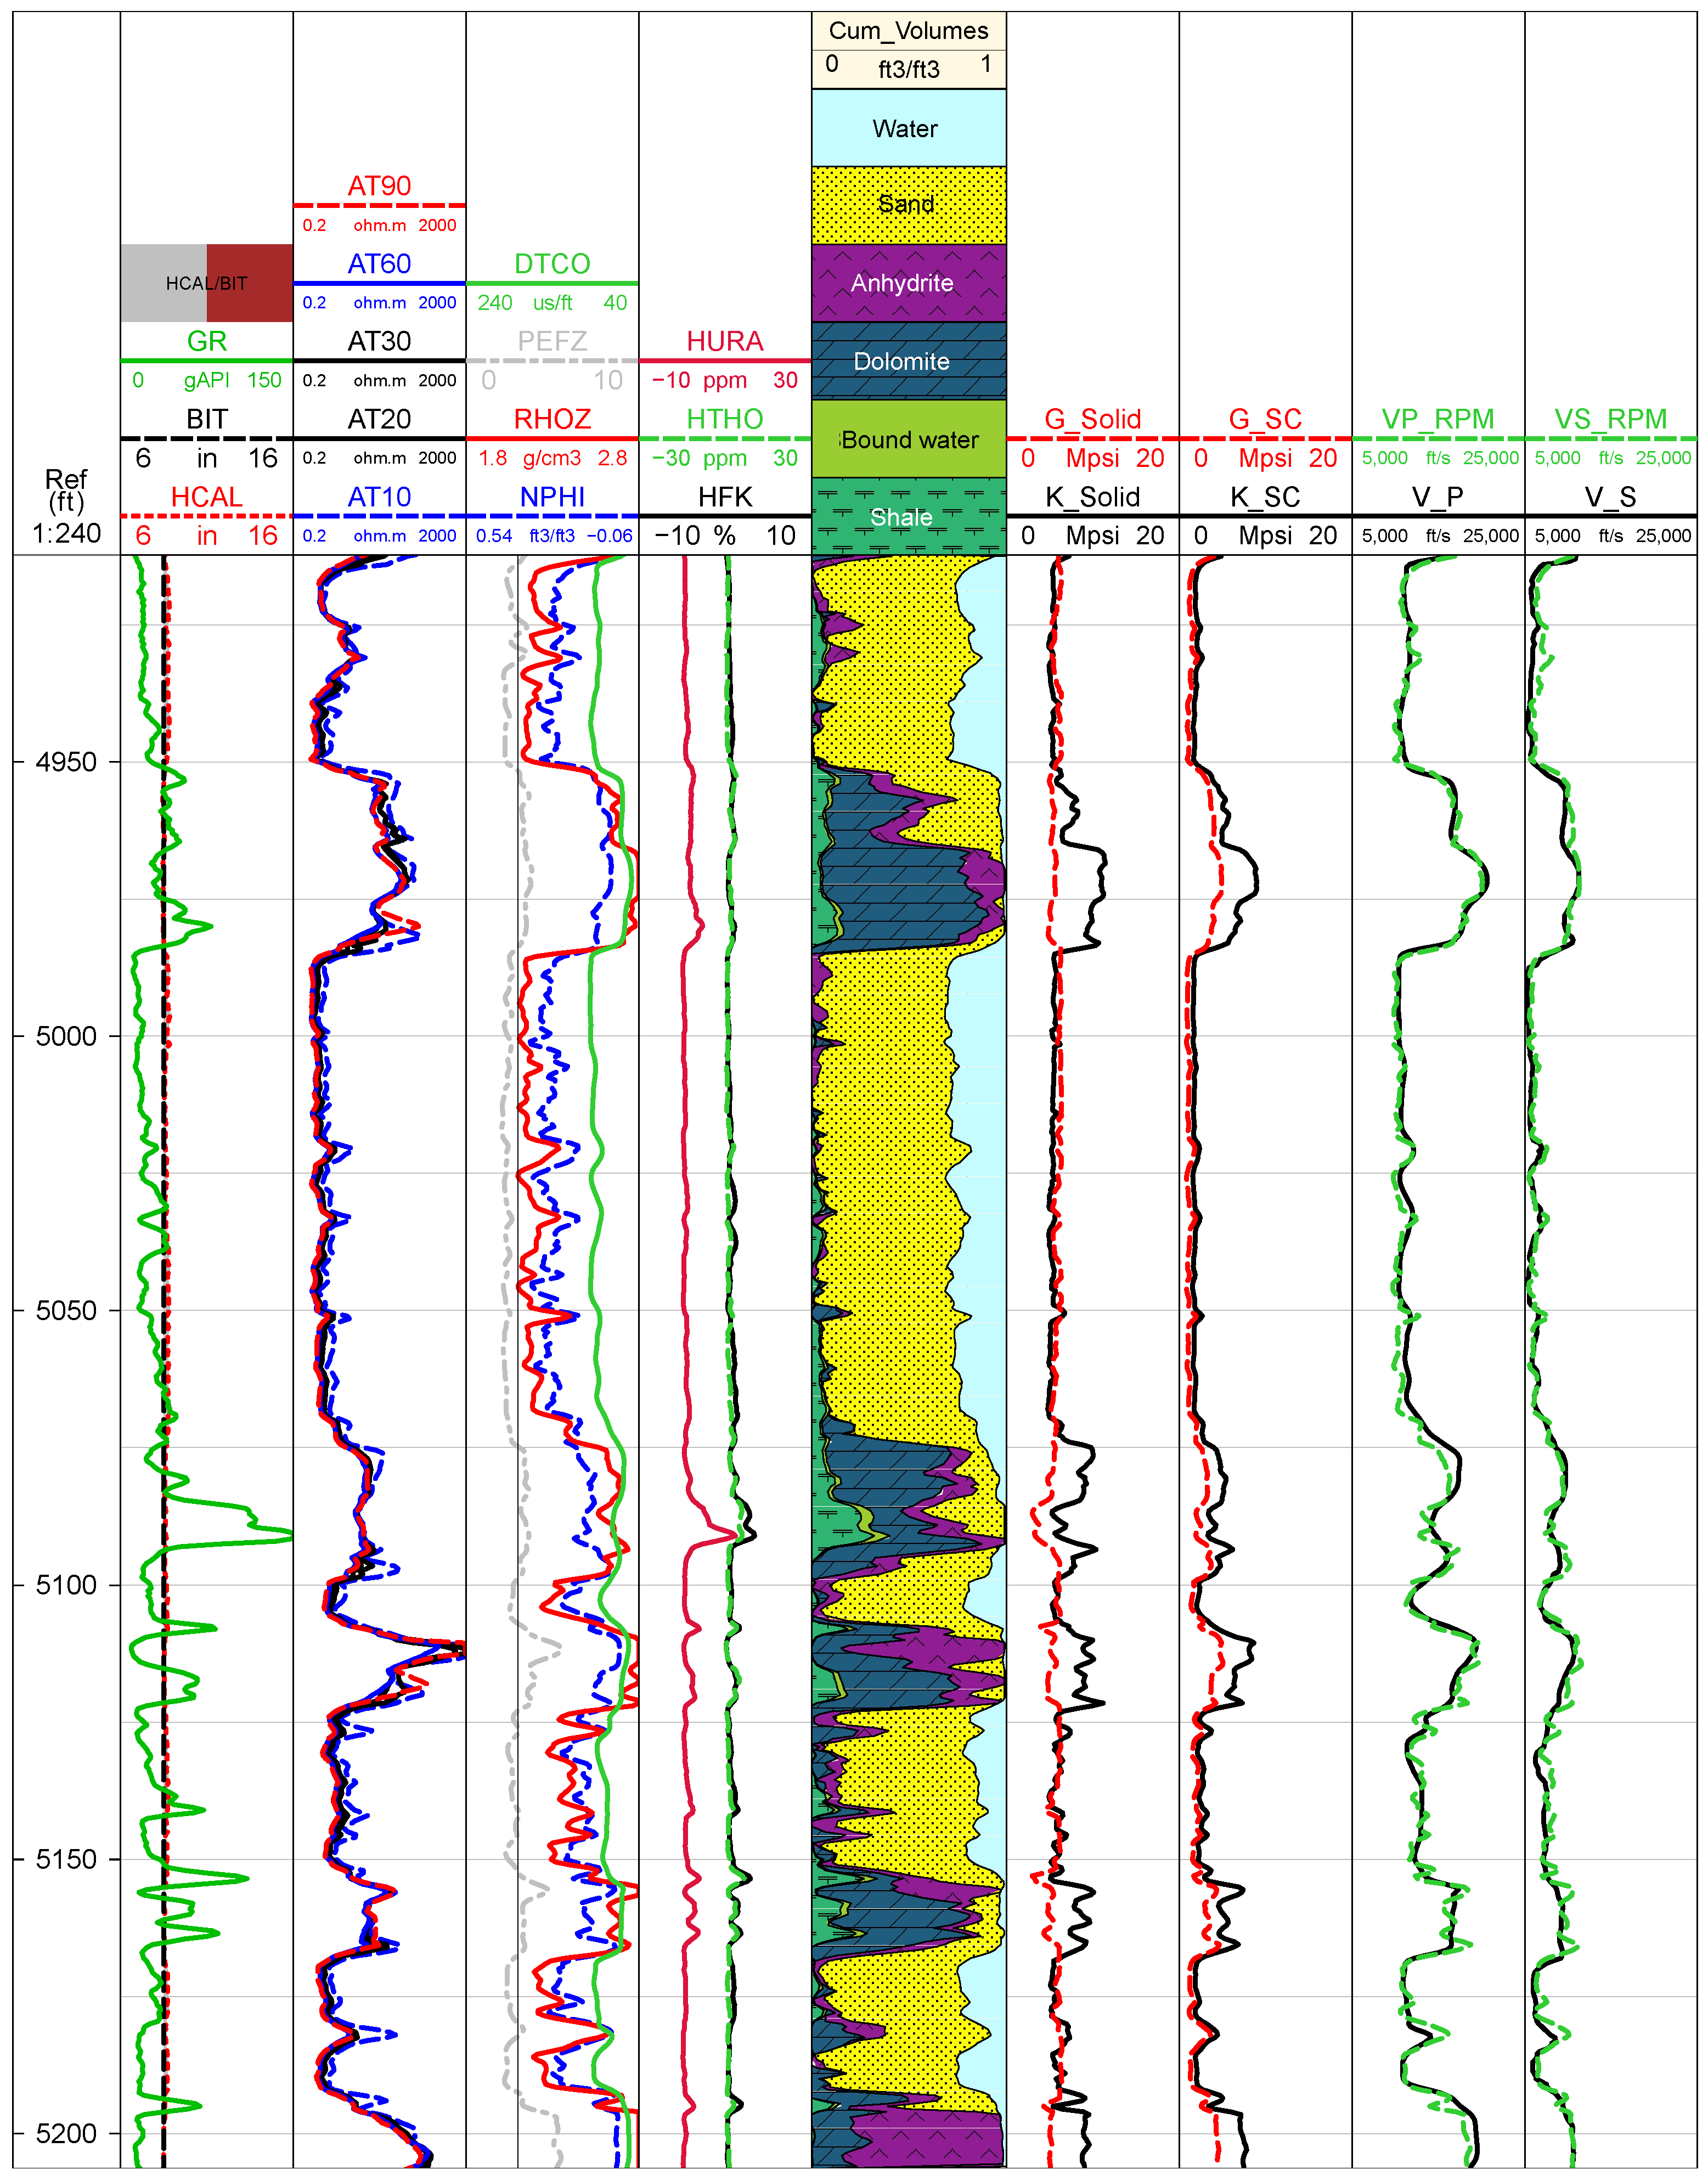
Figure 12.
Predicted velocities using self-consistent approximation and measured velocities. Subplots depict (a) compressional velocity and (b) shear velocity.
Figure 12.
Predicted velocities using self-consistent approximation and measured velocities. Subplots depict (a) compressional velocity and (b) shear velocity.
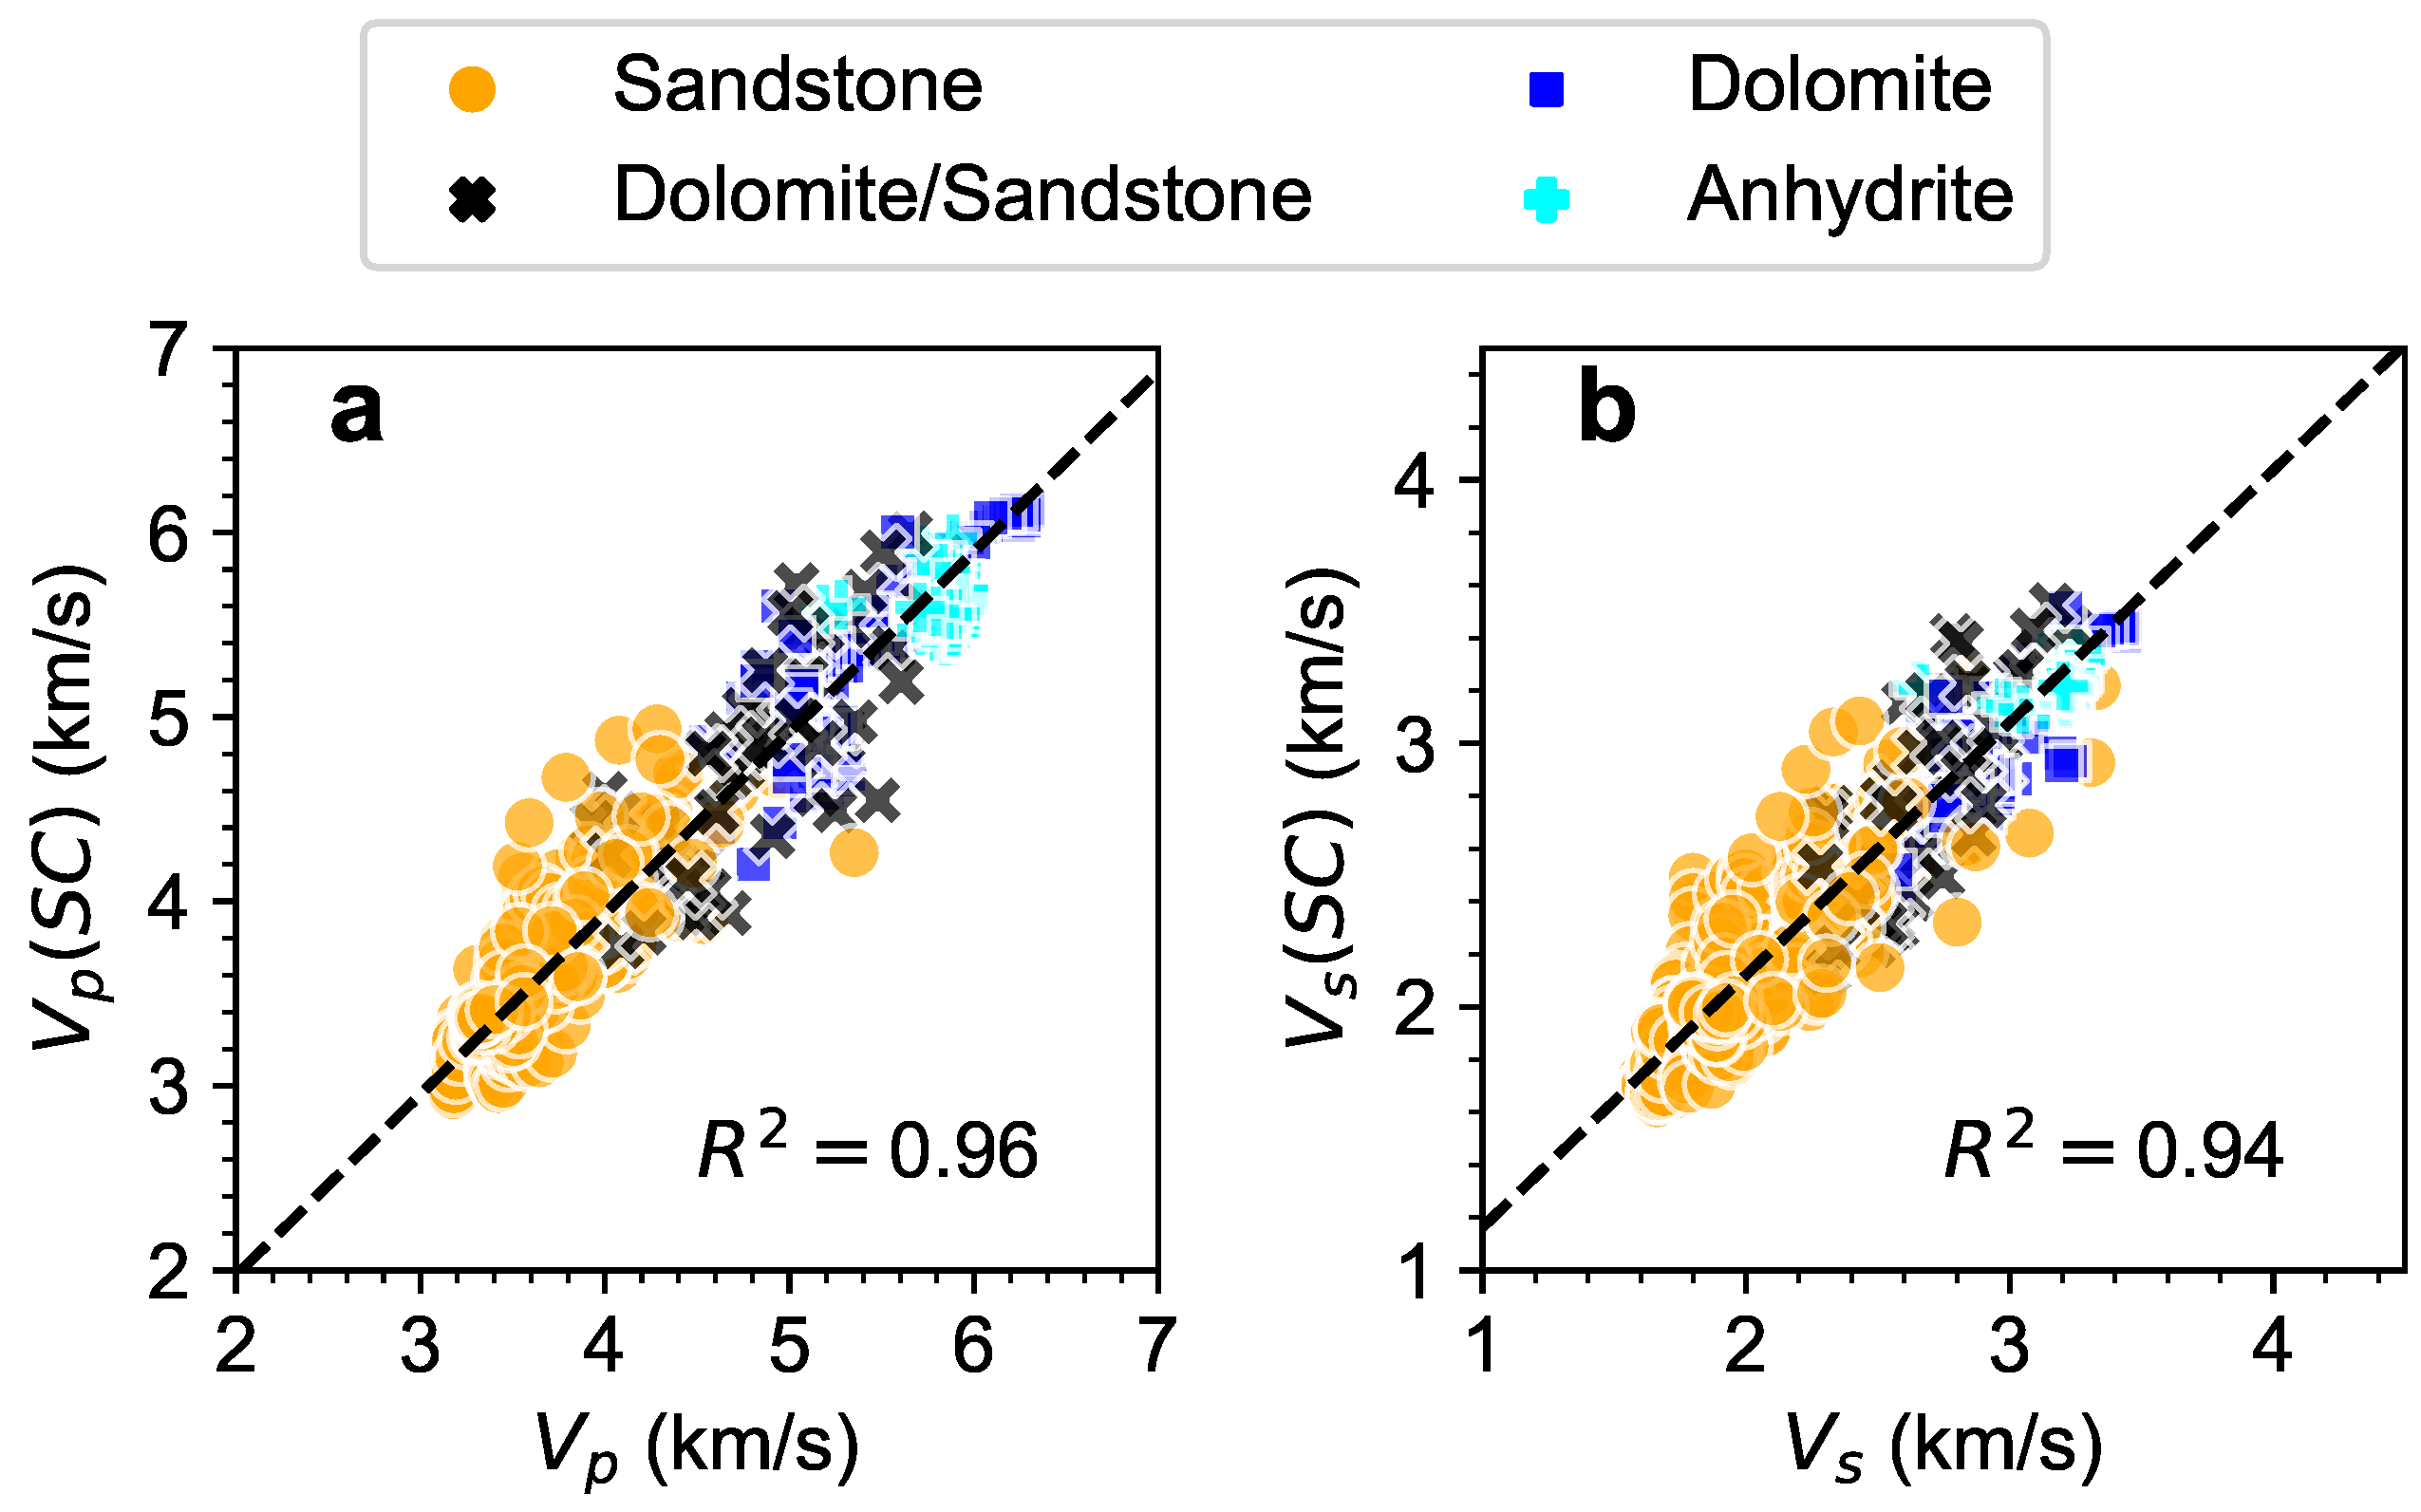
Figure 13.
Variation of elastic moduli using self-consistent approximation with porosity: (a) bulk modulus; and (b) shear modulus.
Figure 13.
Variation of elastic moduli using self-consistent approximation with porosity: (a) bulk modulus; and (b) shear modulus.

Figure 14.
Linear regression between compressional wave velocity and shear wave velocity.

Table 1.
Data types and their utilization in the present study.
| Data | Used in |
|---|---|
| Geophysical well logs | Quantitative multimineral petrophysical evaluation; estimation of porosity and permeability. Rock physics modeling |
| X-ray diffraction (XRD) data | Quantitative validation of multimineral petrophysical evaluation |
| Routine core analysis | Quantitative validation of porosity and permeability |
| Advanced core analysis | Pore throat distribution analysis (derived from mercury injection studies) |
| Cutting description | Qualitative validation of multimineral petrophysical evaluation |
Table 2.
List of geophysical well logs used in the present study.
| Data | Units | Description | Remarks |
|---|---|---|---|
| GR | GAPI | Natural gamma-ray log | Used in the quantitative multimineral evaluation and rock physics modeling |
| AIG | Ohm-m | Array induction logs | |
| RHOZ | g/cc | Formation bulk density log | |
| NPHI | p.u | Neutron porosity log | |
| PEF | b/e | Photo-electric factor | |
| DTCO | μs/ft | Compressional slowness log | |
| HTHO | ppm | Formation thorium concentration log | Used in clay mineralogy identification |
| HURA | ppm | Formation uranium concentration log | |
| HFK | % | Formation potassium concentration log | |
| TCMR | v/v | Total nuclear magnetic resonance (NMR) porosity | Used in calibration/validation |
| CMFF | v/v | NMR free fluid | |
| CMRP_3MS | v/v | NMR-porosity with T2 values greater than 3 ms | |
| KSDR | mD | NMR SDR Permeability | |
| KSDR | mD | NMR Timur/Coates’ permeability |
Table 3.
Bulk modulus, shear modulus, and density of the lithologies used in the present study. Source [53].
Table 3.
Bulk modulus, shear modulus, and density of the lithologies used in the present study. Source [53].
| Sandstone | Dolomite | Anhydrite | Shale | Brine | |
|---|---|---|---|---|---|
| Bulk modulus (K) (GPa) | 37.00 | 94.90 | 56.10 | 15.00 | 2.20 |
| Shear modulus (G) (GPa) | 44.00 | 45.00 | 29.10 | 10.00 | 0.00 |
| Density () (g/cc) | 2.65 | 2.87 | 2.99 | 2.50 | 1.02 |
Disclaimer/Publisher’s Note: The statements, opinions and data contained in all publications are solely those of the individual author(s) and contributor(s) and not of MDPI and/or the editor(s). MDPI and/or the editor(s) disclaim responsibility for any injury to people or property resulting from any ideas, methods, instructions or products referred to in the content. |
© 2024 by the authors. Licensee MDPI, Basel, Switzerland. This article is an open access article distributed under the terms and conditions of the Creative Commons Attribution (CC BY) license (https://creativecommons.org/licenses/by/4.0/).
Share and Cite
MDPI and ACS Style
Pothana, P.; Ifrene, G.; Ling, K. Integrated Petrophysical Evaluation and Rock Physics Modeling of Broom Creek Deep Saline Aquifer for Geological CO2 Storage. Fuels 2024, 5, 53-74. https://doi.org/10.3390/fuels5010004
AMA Style
Pothana P, Ifrene G, Ling K. Integrated Petrophysical Evaluation and Rock Physics Modeling of Broom Creek Deep Saline Aquifer for Geological CO2 Storage. Fuels. 2024; 5(1):53-74. https://doi.org/10.3390/fuels5010004
Chicago/Turabian StylePothana, Prasad, Ghoulem Ifrene, and Kegang Ling. 2024. "Integrated Petrophysical Evaluation and Rock Physics Modeling of Broom Creek Deep Saline Aquifer for Geological CO2 Storage" Fuels 5, no. 1: 53-74. https://doi.org/10.3390/fuels5010004