Abstract
In this work, milk samples collected in a cohort of intensive dairy farms of the Po Valley (Italy) were screened for their (poly)-phenolic profile to check the occurrence of phenolic metabolites of biological interest. The selected dairy farms were previously classified on the basis of their cow feeding system, considering the utilization of corn silage as the main ingredient of the rations. Overall, ultra-high-pressure liquid chromatography coupled with mass spectrometry using an Orbitrap analyzer, followed by unsupervised and supervised statistics, allowed identifying clear different phenolic distributions in the milk samples. Accordingly, a great variability in the phenolic profiles of the different milk samples was observed, with two main phenolic clusters outlined by the unsupervised hierarchical clustering approach and not fully correlated to the nutritional strategy considered. The variables’ importance in the projection approach allowed selecting the most important metabolites, resulting in samples’ discrimination. Among the most discriminative compounds, we found phenolic metabolites (such as hippuric acid and 4-hydroxyhippuric acid), followed by lignans (such as enterolactone) and isoflavonoids (such as equol and O-desmethylangolensin). Taken together, our findings suggested that both the feeding systems and the ability of dairy cows to process parent phenolic compounds were the main factors providing the final (poly)-phenolic profile of the milk samples. Future targeted and ad hoc studies appear of great interest to evaluate the potential biological effects of these compounds on cow health.
1. Introduction
Cow’s milk is characterized by bioactive phenolic compounds (PC) usually arising from the processing of plant compounds promoted by the bovine gut microbiota [1]. The occurrence of polyphenols in milk and dairy products has been associated with different factors, namely, the consumption of fodder crops by cattle, the catabolic activity of bacteria on proteins, contamination with sanitizing agents, process-related addition, or their deliberate addition as flavoring/functional ingredients [2]. Noteworthy, the consumption of PC-rich feeds by cattle could affect not only ruminant health, but also the final yield and overall quality of milk and milk-derived products [2].
The scientific literature on milk polyphenols is mainly focused on some metabolites of biological interest, among which, equol represents one of the most targeted compounds. Equol is classified as an isoflavone metabolite, derived from daidzein, and processed in the gut of humans and animals by certain bacterial biotypes. According to the scientific literature, all the animal species tested (including cows) can produce equol in response to soy or daidzein consumption [3]. Regarding humans, only the 25–50% of the tested subjects are classified as equol producers; the percentage variation largely depends on the community in question and the dietary habits of its members [4]. Additionally, most humans (around 80%) recognized as equol non-producers can convert daidzein into another metabolite, namely, O-desmethylangolensin (O-DMA), showing no estrogenic activity [5]. Overall, O-DMA and equol have been described to be likely produced by different bacterial taxa [4].
Another studied compound, widely assessed as a potential biomarker of different animal feeding regimen, is the phenolic metabolite hippuric acid. In this regard, a high content of hippuric acid has been previously reported in milk from cows administered a diet based on grazing grassland pasture, when compared with diets of concentrates and silage or hay forages [6]. These authors related hippuric acid in milk to the presence of phenolic acids, such as chlorogenic acid, neochlorogenic acid, and caffeoyl compounds, in grassland pasture-based diets. Accordingly, forages contain large amounts of phenolic compounds both in the insoluble cell wall and as soluble (free) phenolic compounds, specific to each plant taxon. These parent compounds are partially degraded in the rumen and partly absorbed in the rumen and intestinal mucosa, and then conjugated before transformation in the liver and excretion in urine or milk [7]. Therefore, the feeding regimen and fodder quality represent two very important factors driving the quantitative/qualitative variation of polyphenols and their metabolites in milk.
In previous years, several analytical methods have been developed to maximize the extraction and recovery of phenolic compounds from milk [8]; however, no comprehensive studies targeting the comprehensive screening of these compounds in milk and dairy products have been published. Therefore, considering the great interest in polyphenols as bioactive compounds, in this work, an untargeted profiling based on a high-resolution mass spectrometry approach was used to screen polyphenols and their metabolites in bulk milk samples collected from different dairy farms using corn silages as the main ingredient of the total mixed rations. In this regard, in our previous work [9], an observational study was carried out to assess the impact of different nutritional corn silage-based strategies on several parameters, such as the efficient use of dietary nutrients, the fecal fermentation profile, and the profitability of intensive dairy farms characterizing the Po valley (Northern Italy). Therefore, in this work, the distribution of phenolic compounds and metabolites was assessed considering as discriminant factors six different feeding regimens that were identified. To this aim, the untargeted phenolic profile of the different milk samples was evaluated through both unsupervised and supervised multivariate statistical methods to find possible correlations with the feeding systems and to extrapolate potential biomarker compounds, respectively.
2. Materials and Methods
2.1. Collection and Classification of Bulk Milk Samples
In this research survey, 36 raw bulk tank milk samples (500 mL) were randomly collected between January and June 2018 in a cohort of intensive dairy farms (in the Po Valley, Northern Italy), being this period the best of the year in terms of productive performance, low influence of seasonal changes on herd composition, overall milk quality and silage bunker. The farms visited are representative of the intensive dairy farm system in Italy, raising Holstein-Friesian cows, housed in free-stall barns, fed total mixed ration (TMR), and with no access to pasture. In a previous work by our research group [9], an observational study was carried out to evaluate the impact of different nutritional corn silage-based strategies on several parameters related to both dairy farms and milk quality. In particular, an unsupervised clustering approach (multivariate statistics) allowed observing 6 different clusters, according to the nutritional strategies adopted, namely: (a) high-moisture ear corn (HMC) and legume silage (cluster 1), (b) compound feed (cluster 2), (c) corn and soy meals (cluster 3), (d) HMC and soy meal (cluster 4), (e) corn meal and protein compound feeds (cluster 5), and (f) HMC and protein compound feed strategies (cluster 6). More details regarding the different nutritional strategies considered in this work can be found in [9].
2.2. Extraction of Phenolic Compounds
In this work, phenolic compounds were extracted according to a method previously reported [10]. Following a skimming process (by centrifugation), 2 mL of milk samples was extracted in 14 mL of acetonitrile, adding 3% of formic acid (both LC–MS-grade, from Sigma-Aldrich, Milan, Italy). Milk samples were vortexed for 3 min and then incubated for ultrasound-assisted extraction (UAE) for 5 min. The samples were then centrifuged at 12,000× g for 15 min in cold temperature (4 °C) and incubated overnight in a freezer at –18 °C to facilitate the precipitation of proteins. Finally, the supernatants were filtered using cellulose syringe filters (diameter: 0.2 μm) in UHPLC vials until untargeted metabolomic profiling was performed.
2.3. Phenolic Profiling Based on High-Resolution Mass Spectrometry
The milk extracts were then analyzed trough a high-resolution mass spectrometry (HRMS) approach, based on a Q-Exactive™ Focus Hybrid Quadrupole-Orbitrap Mass Spectrometer (Thermo Scientific, Waltham, MA, USA) coupled to a Vanquish ultra-high-pressure liquid chromatographer (UHPLC). UHPLC was based on a gradient separation of 35 min, using water and acetonitrile (both of LC–MS grade, from Sigma-Aldrich, Milan, Italy) as mobile phases (both acidified with 0.1% formic acid). The separation was achieved on an Agilent Zorbax Eclipse Plus C18 column (50 × 2.1 mm, 1.8 μm). The UHPLC–HRMS conditions are fully described in a previous work by our research group [11]. The milk extracts were analyzed using a full scan MS-data-dependent (Top N = 3) MS/MS mode, in the range of 100–1200 m/z, with a positive ionization mode and a mass resolution of 70,000 FWHM. The Top N ions were selected for fragmentation using typical normalized collision energies, namely, 10, 20, 40 eV. The HESI parameters are fully reported in a previous work [12]. The raw data (.RAW files) generated were then processed using the software MS-DIAL (version 4.70) for post-acquisition data filtering, then achieving annotation via spectral matching against the databases FooDB and Phenol-Explorer. In our experimental conditions, the identification step was based on mass accuracy (using a 5 ppm mass tolerance), isotopic pattern, and spectral matching, thus working according to a level 2 of confidence in annotation (i.e., putatively annotated compounds and structural confirmation according to spectral matching), typical for untargeted metabolomics-based strategies.
2.4. Multivariate Statistical Analysis
The phenolic dataset exported from MS-DIAL was then elaborated using the software MetaboAnalyst 5.0 [13]. Following normalization, the data were processed for both unsupervised (i.e., hierarchical cluster analysis, HCA) and supervised (orthogonal projection to latent structures discriminant analysis, OPLS-DA) multivariate statistics. Additionally, those parameters related to the goodness of fit and prediction of the model were also recorded, namely, R2Y and Q2Y, respectively, whilst a permutation testing (N > 100) was used to exclude model over-fitting. The variable selection method VIP (i.e., variables importance in projection) was used to evaluate the discriminant power of each phenolic metabolite, considering values >1 as the minimum significant threshold, also inspecting the corresponding S-plot. Volcano plots were produced for the comparison between the two phenolic groups revealed by cluster analysis, by coupling a Fold-Change analysis (cut-off value >1.2) and ANOVA (p-value < 0.05, with a False Discovery Rate correction). Finally, Pearson’s correlation coefficients (p-value < 0.05, two-tailed) were inspected to identify those discriminative phenolic metabolites more influenced by the different ingredients of the feeding rations.
3. Results and Discussion
3.1. Profiling of Phenolic Compounds in the Different Milk Samples
In this work, the untargeted screening of phenolic compounds in the different milk samples from different cow feeding regimens revealed a total of 267 annotated metabolites. Each identified compound is reported in Supplementary File S1, considering adduct type, reference m/z, formula, total ID score (as provided by the MS-Dial software), MS1 isotopic spectrum, MS/MS spectrum (when available), and relative abundance values when considering three replicates for each sample. Interestingly, 70 phenolics (26% of total compounds) were structurally confirmed by MS/MS, according to the annotation step provided by the QC samples and against the comprehensive FooDB spectral library. Among the most abundant and structurally confirmed compounds, the highest annotation scores were found when considering three compounds, namely, hippuric acid, hydroxycaffeic acid, and umbelliferone (Supplementary File S1). Regarding the phenolic classes annotated, we found a clear abundance of flavonoids (120 compounds), followed by phenolic acids (65 compounds), low-molecular-weight phenolics (i.e., tyrosol equivalents; 61 compounds), lignans (14 compounds), and stilbenes (7 compounds). Overall, the untargeted screening of phenolic compounds in the different milk samples revealed a great distribution of phenolic metabolites such as phenolic glucuronides and sulfates. According to the scientific literature, it is known that the quantification of polyphenols in biological samples collected from animals might be underestimated; in particular, many phenolic metabolites resulting from the catabolism of parent compounds by the colonic microbiota can still be absorbed into the blood and are usually not considered [14]. Many of these compounds can undergo further metabolism and be conjugated by phase II enzymes, to form sulfated, glucuronidated, and methylated compounds. In our experimental conditions, several compounds potentially associated with phase II metabolism were detected, such as quercetin 3-O-xylosyl-glucuronide, apigenin 7-O-glucuronide, daidzein 4′-O-glucuronide, daidzin 4′-O-glucuronide, formononetin 7-O-glucuronide, luteolin 7-O-glucuronide, hesperetin 3′,7-O-diglucuronide, caffeic acid 3-O-glucuronide, 5-(3′,5′-dihydroxyphenyl)-gamma-valerolactone 3-O-glucuronide, hesperetin 3′-sulfate, tyrosol 4-sulfate, dihydroferulic acid 4-sulfate, and others (Supplementary File S1).
In the last years, the interest in plant polyphenols and in their impact on animal nutrition has increased. These compounds, ubiquitously distributed in the plant kingdom, characterize some plants exploited as feeding resources alternative to cultivated crops and can be found in several agro-industry by-products [15]. Polyphenols can also interact with the rumen microbiota, thus affecting carbohydrate fermentation, protein degradation, and lipid metabolism. Some of these key aspects have been largely reviewed, especially for tannins (polymeric phenolic compounds). Among the most studied effects of polyphenols on ruminant nutrition, it is important to list their ability to depress (condensed tannins) or modulate (hydrolyzable tannins) the biohydrogenation of unsaturated fatty acids by a perturbation of the ruminal microbiota composition [15], together with a potential reduction of methane emission by directly interacting with the rumen microbiota (without affecting fiber digestion) [16]. Another very studied topic regarding plant polyphenols and farming animals is their potential ability to affect reproductive events [17]. In particular, the presence of phenolic compounds in the diets of farming animals during their reproductive cycle was found to improve or interfere with their reproductive performance; however, there are still associated unknown reproductive hazards and a great source of variability regarding the biological effects that need to be assessed in future research [17]. Starting from these background conditions on the importance of polyphenols in animal nutrition, in the next paragraphs, we evaluated the ability of phenolic compounds to distinguish the milk samples under investigation and their potential correlation with the feeding systems of the visited dairy farms.
3.2. Discrimination of the Milk Samples According to Their Comprehensive Phenolic Profiles
The phenolic dataset resulting from the UHPLC–HRMS analysis was then elaborated trough an unsupervised statistical approach, namely, hierarchical cluster analysis. The corresponding heat map built according to the fold-change variation of each annotated metabolite in the different milk samples is reported in Figure 1. As a first consideration, it was clear that the unsupervised clustering identified two main groups (Cluster 1: blue-colored; Cluster 2: red-colored) of milk samples according to the measured phenolic profiles. Overall, it is important to state that the sample grouping outlined by the cluster analysis was built without supervision, thus revealing a huge variability in the phenolic composition of the different milk samples that, likely, was not related only to the feeding systems under investigation. In this regard, it is known that phenolic compounds in cow’s milk are derived from the feed, although a proportion of these compounds may also result from amino acid catabolism and by the catabolic activity of rumen and intestinal bacteria [2]. In addition, the typical deglycosylation, dehydroxylation, and dehydrogenation reactions in humans are known to play an essential role in the metabolism of polyphenols, but few information is to date available regarding the ruminal bacteria species or consortia involved in these reactions. In a previous work by our research group, an unsupervised hierarchical clustering approach was used to discriminate farms’ feeding choices when considering the visited dairy farms. As reported in Table 1, the farms’ feeding choices were grouped based on the high use of high moisture corn (HMC) and legume silage (cluster 1), compound feed (cluster 2), corn and soy meals (cluster 3), HMC and soy meal (cluster 4), corn meal and protein compound feeds (cluster 5), and HMC and protein compound feed strategies (cluster 6). Therefore, by comparing the heat maps of the milk phenolic profiles with the feeding strategies previously reported [9], it was possible to conclude that the phenolic compounds were not good predictors of the feeding strategies adopted by the different intensive dairy farms. As highlighted in Table 1, it was difficult to find a clear relationship between the feeding regimen and the phenolic group, considering the many factors of variability involved. Therefore, in the next part of this work, we used a supervised statistical approach to highlight the differences driving the separation of the two main phenolic groups observed.

Figure 1.
Heat map resulting from the unsupervised hierarchical cluster analysis of the different milk samples under investigation. Two main clusters (i.e., blue on the left and red on the right) could be identified.

Table 1.
Bulk milk samples under investigation, classified according to both the feeding regimen and the phenolic group.
3.3. Discriminative Phenolic Metabolites According to the Supervised OPLS-DA Prediction Model
Considering that hierarchical clustering (Figure 1) showed a clear difference between the phenolic profiles of two milk groups (i.e., Cluster 1 vs. Cluster 2), we used a supervised prediction model, namely, OPLS-DA to maximize the separation between these two groups and to extrapolate the marker compounds of the observed trend. The orthogonal signal correction characterizing this supervised method was particularly effective in maximizing the covariance existing between the measured data (i.e., MS peak intensities) and the response variable (i.e., predictive classification based on the phenolic clusters outlined by hierarchical clustering). Overall, the OPLS-DA score plot (Figure 2) was particularly effective in separating the milk samples when considering the orthogonal latent vector, revealing a strong prediction ability given by the Q2 goodness parameter (0.975). In addition, the output of permutation test cross-validation (N = 200) revealed no over-fitting. The OPLS-DA score plot also showed a higher variability of the milk samples belonging to cluster 2, as highlighted by the wider confidence ellipse in the score plot (Figure 2).
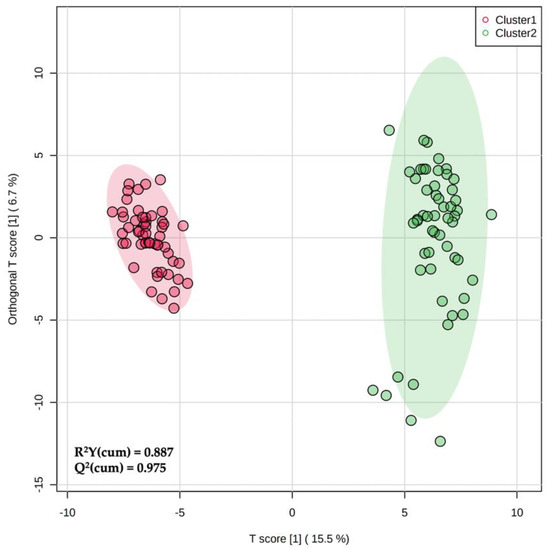
Figure 2.
Orthogonal projection to latent structures discriminant analysis (OPLS-DA) score plot when considering the two phenolic groups (Cluster 1 and Cluster 2) outlined by unsupervised clustering analysis.
The variable importance in projection (VIP) approach was then used to select the most significant phenolic markers involved in the separation between the two milk clusters. The VIP selection method revealed 20 discriminative milk metabolites possessing a VIP score > 1 (i.e., highly discriminant) and, therefore, driving the hyperspace separation observed in Figure 2. A detailed list containing all the phenolic compounds and metabolites collected in the major subclasses is provided in Table 2. Additionally, for each VIP phenolic marker, we evaluated its Log2 fold-change (FC) variation and the significance (p < 0.05) of this variation according to a volcano plot analysis.
Table 2.
VIP discriminant phenolic metabolites resulting from the OPLS-DA prediction model. Each compound is provided with its prediction (VIP) score, Log2 fold-change (FC) value, and p-value.
Overall, the highest VIP score and significance were found for the lignan-related compound enterolactone, being an exclusive marker of the milk samples belonging to Cluster 1 (Log2 FC = 3.58). Also, the compound 7-hydroxysecoisolariciresinol showed a strong and significant down-accumulation in milk samples belonging to cluster 1 (i.e., Log2 FC = −4.19). Lignans are phytoestrogen compounds known for their biological functions and bioactive properties, such as weak estrogenic and cardioprotective activities, together with antiestrogenic, antioxidant, anti-inflammatory, and anticarcinogenic potential [18]. The weak and antiestrogenic effects of lignans are caused by distinct transactivation activities of estrogen receptors of the enterolignans enterodiol and enterolactone [19]. The outer fibrous-containing layers of flaxseed (Linum usitatissimum L.) is reported to be the richest source of the lignan secoisolariciresinol diglucoside. Additionally, plant lignans have been also detected in soybeans and other legumes [20]. In ruminants, the rumen appears to be the main site for the conversion of secoisolariciresinol diglucoside into the mammalian lignans enterodiol and enterolactone [21]. However, only enterolactone has been detected in the milk of dairy cows fed flaxseed meal [22], possibly because of ruminal dehydrogenation reactions converting enterodiol to enterolactone, like those occurring in humans [19]. In our experimental conditions, enterolactone was found mainly in milk samples characterizing the nutritional strategies classified by [9] as cluster 3 and cluster 4, i.e., those characterized by the ingredient full fat seeds, consisting of soybean grain and flax seeds. Therefore, a certain impact of the feeding strategy on the milk phenolic profile was outlined when considering lignans metabolism.
Among the other VIP discriminant compounds, we found several isoflavonoids, such as 4′,7-dihydroxy-3′-methoxyisoflavan, O-desmethylangolensin, 6″-O-malonylgenistin, equol, and formononetin (Table 2). The abundance of isoflavonoids as discriminative and highly predictive compounds is not surprising. As already known [23], the concentration of isoflavones in bovine milk ranges from non-detectable amounts to few ng/mL, when considering biochanin A, formononetin, daidzein, glycitein, and genistein. The concentration of equol, the major metabolic product of isoflavones, is generally higher, ranging from 4 up to 1000 ng/mL in raw milk, whereas dairy processing may affect its final content. The detection of isoflavonoids in bovine milk is likely due to a direct transfer from the feeds, considering that some leguminous plants are naturally rich in isoflavones [24]. Accordingly, soybean (Glycine max) is a great source of isoflavones, such as 6″-O-malonylgenistin, 6″-O-malonyldaidzin, genistin, and daidzin. Therefore, looking at the nutritional strategies reported in [9] outlining the utilization of soybean meal, de-hulled soybean meal, expeller or extruded soybean, and soybean grains as single feeds used in the rations of the visited dairy farms, it is possible to conclude that soybean was highly able to affect the phenolic profile of the milk samples under investigation. In our experimental conditions, the isoflavonoid metabolite equol was found to be a marker of the milk samples included in cluster 2 (Table 2). In ruminants, the metabolites of soybean isoflavonoids mainly include equol, p-ethyl-phenol, and O-desmethylangolensin [25]. The metabolic conversion of isoflavonoids mainly takes place in the rumen, and the dominant isoflavone found in the digesta of cattle is equol. Relatively large proportions of isoflavonoids are extracted in milk, where the dominant metabolite is, again, equol. Therefore, milk and dairy products have been proposed as potential sources of equol for humans classified as equol non-producers. Interestingly, our findings outlined both O-desmethylangolensin and equol as markers of cluster 2, although these two metabolites are likely produced by different bacterial taxa. In addition, O-desmethylangolensin (derived from daidzein) is a phenolic metabolite showing no estrogenic activity when compared with the equol. It is also important to cite the importance of alfalfa silage and hay [9] in providing the phenolic profiles observed. In this regard, the most abundant isoflavone characterizing alfalfa sprouts is formononetin, although its absolute content could be affected by the degree of germination [26]. Isoflavones are natural phytoestrogens with antioxidant and endocrine-disrupting potencies. Specifically, dairy cow milk has recently been shown to contain various phytoestrogens, including coumestans, lignans, and, most importantly, isoflavones (genistein, daidzein, formononetin, and biochanin A) and equol (a metabolite of formononetin). Isoflavones occur in biological fluids in two major forms; from the rumen, they are absorbed mainly as aglycones (i.e., the basic non-conjugated form). Then, metabolization in animals leads to the formation of conjugates with sulfate or glucuronic acid, and these metabolites are transferred to the milk. Aglycones represent the biologically active form associated with the endocrine disruptors’ properties of isoflavones [27]. Additionally, several studies based on ruminants as a model, revealed that phytoestrogen exposure may affect cattle in terms of reproductive health. It is also known that the effects of phytoestrogens mainly depend on the dose and route of exposure, that can impact the final serum levels. In particular, the timing of exposure is critical in determining the related effects, and different tissues have species-specific windows of sensitivity to morphological and functional disruption. Therefore, it seems extremely important to carefully assess the impact of these compounds on reproductive outcomes [28]. Our study suggests that monitoring isoflavones’ levels is important to ensure the high quality and safety of milk and dairy products.
Additionally, looking at the other discriminative compounds in Table 2, it is possible to notice that hesperetin 3′,7-O-diglucuronide (flavanones) showed the highest down-accumulation value (i.e., Log2 FC = −12.23), being a great marker of those milk samples included in cluster 2. Other discriminative compounds that deserve to be cited are two phenolic metabolites, namely, hippuric acid (VIP score = 1.176; significant marker of cluster 1) and 4-hydroxyhippuric acid (VIP score = 1.162; significant marker of cluster 1) (Table 2). Hippuric acid has been reported as a member of the non-protein nitrogen fraction of milk [29]. This phenolic metabolite derives from caffeoylquinic compounds characterizing the feeding systems, and increased levels of hippuric acid in cow’s milk from pasture-based feeding systems have been previously reported [6,30]. Finally, several discriminative compounds belonging to the category of phenolic acids (both hydroxycinnamics and hydroxybenzoics) were listed (Table 2). Overall, these compounds could be related to the large utilization of corn silage in each nutritional feeding strategy considered [9,28]. Among the main phenolic acids previously reported in corn silage it is possible to also list p-coumaric acid, trans-ferulic acid, and 4-hydroxybenzoic acid [31,32].
Finally, Pearson’s correlation coefficients between the VIP discriminant metabolites (Table 2) and the composition of the feeding regimen associated with each milk sample under investigation (Supplementary File S2) were inspected. Overall, a higher number of significant correlations (p < 0.05) were found between the feeding system and the phenolic profile of cluster 1. In this regard, nine VIP discriminant metabolites showed a certain degree of correlation with five of the main ingredients. Enterolactone was inversely correlated (−0.683; p < 0.01) to the utilization of hay from permanent meadows, while ellagic acid was positively correlated (0.767; p < 0.01) with the inclusion of alfalfa silage in the ration (Supplementary File S2). Regarding the milk samples classified as cluster 2, we found only two significant correlation coefficients; in particular, equol was significantly correlated to the utilization of hay from permanent meadows (0.645; p < 0.01), while formononetin showed a significant correlation coefficient with alfalfa hay (0.522; p < 0.01). Therefore, taken together, our findings suggest that the milk samples were mainly classified as a function of the metabolic processes and biochemical pathways involving lignans (cluster 1) and flavonoids (cluster 2), although further ad hoc feedomics-based works are mandatory to evaluate potential carry-over phenomena from feed to milk and catabolism of parent compounds.
4. Conclusions
In this preliminary observational study, we evaluated the untargeted phenolic profiles of 36 milk samples collected in a cohort of intensive dairy farms in Italy (Po Valley). In particular, the occurrence of phenolic metabolites of biological interest, such as to isoflavonoids and lignans, was assessed. Overall, untargeted metabolomics coupled with different multivariate statistical approaches allowed us to identify two main clusters of milk samples, according to their phenolic profile. The two main phenolic clusters detected were not fully correlated to the feeding strategies associated with the collected bulk milk samples. Interestingly, the most discriminative compounds driving the separation of the milk samples were phenolic metabolites (such as hippuric acid and 4-hydroxyhippuric acid), enterolactone (an intestinal metabolite of lignans), and isoflavonoids (such as equol and O-desmethylangolensin). Our findings showed that ad hoc targeted studies on selected metabolites (such as isoflavones and their metabolites, presenting an estrogenic activity) are required to evaluate the potential biological effects of these compounds on cows’ health.
Supplementary Materials
The following supporting information can be downloaded at: https://www.mdpi.com/article/10.3390/dairy3020024/s1, File S1: Dataset resulting from the untargeted phenolic profiling according to the UHPLC–HRMS analysis (level 2 of annotation). File S2: Pearson’s correlation coefficients between the VIP discriminative metabolites and the amount of different ingredients in the feeding rations.
Author Contributions
Conceptualization, A.G. and F.M.; methodology, G.R.; software, G.R.; validation, G.R. and A.G.; formal analysis, F.G., M.M., and G.R.; investigation, G.R. and A.G.; resources, A.G. and F.M.; data curation, F.G., M.M. and G.R.; writing—original draft preparation, G.R., F.G., and M.M.; writing—review and editing, A.G. and F.M.; visualization, G.R.; supervision, A.G. and F.M.; project administration, A.G. and F.M. All authors have read and agreed to the published version of the manuscript.
Funding
This research received no external funding.
Institutional Review Board Statement
Not applicable.
Informed Consent Statement
Not applicable.
Data Availability Statement
Data is contained within the article and supplementary material.
Acknowledgments
This work was supported by the Cremona Agri-food technologies project (CRAFT) funded by Fondazione Cariplo and Regione Lombardia. The authors also wish to thank the “Romeo ed Enrica Invernizzi” Foundation for supporting the metabolomic facility.
Conflicts of Interest
The authors declare no conflict of interest.
References
- Tsen, S.Y.; Siew, J.; Lau, E.K.L.; Afiqah Bte Roslee, F.; Chan, H.M.; Loke, W.M. Cow’s milk as a dietary source of equol and phenolic antioxidants: Differential distribution in the milk aqueous and lipid fractions. Dairy Sci. Technol. 2014, 94, 625–632. [Google Scholar] [CrossRef]
- O’Connell, J.E.; Fox, P.F. Significance and applications of phenolic compounds in the production and quality of milk and dairy products: A review. Int. Dairy J. 2001, 11, 103–120. [Google Scholar] [CrossRef]
- Schwen, R.J.; Nguyen, L.; Jackson, R.L. Elucidation of the metabolic pathway of S-equol in rat, monkey and man. Food Chem. Toxicol. 2012, 50, 2074–2083. [Google Scholar] [CrossRef] [PubMed]
- Mayo, B.; Vázquez, L.; Flórez, A.B. Equol: A Bacterial Metabolite from The Daidzein Isoflavone and Its Presumed Beneficial Health Effects. Nutrients 2019, 11, 2231. [Google Scholar] [CrossRef] [PubMed] [Green Version]
- Gardana, C.; Canzi, E.; Simonetti, P. R(-)-O-desmethylangolensin is the main enantiomeric form of daidzein metabolite produced by human in vitro and in vivo. J. Chrom. B 2014, 953, 30–37. [Google Scholar] [CrossRef] [PubMed]
- Besle, J.M.; Viala, D.; Martin, B.; Pradel, P.; Meunier, B.; Berdagué, J.L.; Fraisse, D.; Lamaison, J.L.; Coulon, J.B. Ultraviolet-absorbing compounds in milk are related to forage polyphenols. J. Dairy Sci. 2010, 93, 2846–2856. [Google Scholar] [CrossRef] [Green Version]
- Carpio, A.; Bonilla-Valverde, D.; Arce, C.; Rodríguez-Estévez, V.; Sánchez-Rodríguez, M.; Arce, L.; Valcárcel, M. Evaluation of hippuric acid content in goat milk as a marker of feeding regimen. J. Dairy Sci. 2013, 96, 5426–5434. [Google Scholar] [CrossRef] [Green Version]
- Vázquez, C.V.; Rojas, M.G.V.; Ramírez, C.A.; Chávez-Servín, J.L.; García-Gasca, T.; Martínez, R.A.F.; García, O.P.; Rosado, J.L.; López-Sabater, C.M.; Castellote, A.I.; et al. Total phenolic compounds in milk from different species. Design of an extraction technique for quantification using the Folin–Ciocalteu method. Food Chem. 2015, 176, 480–486. [Google Scholar] [CrossRef]
- Gallo, A.; Valsecchi, C.; Masseroni, M.; Cannas, A.; Ghilardelli, F.; Masoero, F.; Atzori, A.S. An observational study to verify the influence of different nutritional corn silage-based strategies on efficient use of dietary nutrients, faecal fermentation profile, and profitability in a cohort of intensive dairy farms. Ital. J. Anim. Sci. 2022, 21, 228–243. [Google Scholar] [CrossRef]
- Rocchetti, G.; Gallo, A.; Nocetti, M.; Lucini, L.; Masoero, F. Milk metabolomics based on ultra-high-performance liquid chromatography coupled with quadrupole time-of-flight mass spectrometry to discriminate different cows feeding regimens. Food Res. Int. 2020, 134, 109279. [Google Scholar] [CrossRef]
- Rocchetti, G.; Ghilardelli, F.; Masoero, F.; Gallo, A. Screening of Regulated and Emerging Mycotoxins in Bulk Milk Samples by High-Resolution Mass Spectrometry. Foods 2021, 10, 2025. [Google Scholar] [CrossRef]
- Rocchetti, G.; Ghilardelli, F.; Bonini, P.; Lucini, L.; Masoero, F.; Gallo, A. Changes of Milk Metabolomic Profiles Resulting from a Mycotoxins-Contaminated Corn Silage Intake by Dairy Cows. Metabolites 2021, 11, 475. [Google Scholar] [CrossRef] [PubMed]
- Pang, Z.; Chong, J.; Zhou, G.; de Lima Morais, D.A.; Chang, L.; Barrette, M.; Gauthier, C.; Jacques, P.E.; Li, S.; Xia, J. MetaboAnalyst 5.0: Narrowing the gap between raw spectra and functional insights. Nucleic Acids Res. 2021, 49, W388–W396. [Google Scholar] [CrossRef] [PubMed]
- Pimpão, R.C.; Ventura, M.R.; Ferreira, R.B.; Williamson, G.; Santos, C.N. Phenolic sulfates as new and highly abundant metabolites in human plasma after ingestion of a mixed berry fruit purée. Br. J. Nutr. 2015, 113, 454–463. [Google Scholar] [CrossRef] [PubMed] [Green Version]
- Vasta, V.; Daghio, M.; Cappucci, A.; Buccioni, A.; Serra, A.; Viti, C.; Mele, M. Invited review: Plant polyphenols and rumen microbiota responsible for fatty acid biohydrogenation, fiber digestion, and methane emission: Experimental evidence and methodological approaches. J. Dairy Sci. 2019, 102, 3781–3804. [Google Scholar] [CrossRef] [PubMed]
- Hook, S.E.; Wright, A.D.G.; McBride, B.W. Methanogens: Methane producers of the rumen and mitigation strategies. Archaea 2010, 2010, 945785. [Google Scholar] [CrossRef] [Green Version]
- Hashem, N.M.; Gonzalez-Bulnes, A.; Simal-Gandara, J. Polyphenols in Farm Animals: Source of Reproductive Gain or Waste? Antioxidants 2020, 9, 1023. [Google Scholar] [CrossRef]
- Brito, A.F.; Zang, Y. A Review of Lignan Metabolism, Milk Enterolactone Concentration, and Antioxidant Status of Dairy Cows Fed Flaxseed. Molecules 2019, 24, 41. [Google Scholar] [CrossRef] [Green Version]
- Senizza, A.; Rocchetti, G.; Mosele, J.I.; Patrone, V.; Callegari, M.L.; Morelli, L.; Lucini, L. Lignans and Gut Microbiota: An Interplay Revealing Potential Health Implications. Molecules 2020, 25, 5709. [Google Scholar] [CrossRef]
- Peñalvo, J.L.; Heinonen, S.M.; Nurmi, T.; Deyama, T.; Nishibe, S.; Adlercreutz, H. Plant Lignans in Soy-Based Health Supplements. J. Agr. Food Chem. 2004, 52, 4133–4138. [Google Scholar] [CrossRef]
- Côrtes, C.; Gagnon, N.; Benchaar, C.; da Silva, D.; Santos, G.T.D.; Petit, H.V. In vitro metabolism of flax lignans by ruminal and faecal microbiota of dairy cows. J. Appl. Microbiol. 2008, 105, 1585–1594. [Google Scholar] [CrossRef] [PubMed]
- Petit, H.V.; Gagnon, N. Milk concentrations of the mammalian lignans enterolactone and enterodiol, milk production, and whole tract digestibility of dairy cows fed diets containing different concentrations of flaxseed meal. Anim. Feed Sci. Technol. 2009, 152, 103–111. [Google Scholar] [CrossRef]
- Křížová, L.; Křešt’áková, V.; Dadáková, K.; Kašparovský, T. Production of Bovine Equol-Enriched Milk: A Review. Animals 2021, 11, 735. [Google Scholar] [CrossRef] [PubMed]
- Clarke, H.J.; Griffin, C.; Rai, D.K.; O’Callaghan, T.F.; O’Sullivan, M.G.; Kerry, J.P.; Kilcawley, K.N. Dietary Compounds Influencing the Sensorial, Volatile and Phytochemical Properties of Bovine Milk. Molecules 2020, 25, 26. [Google Scholar] [CrossRef] [PubMed] [Green Version]
- Wójciak–Kosior, M.; Dresler, S.; Sowa, I.; Łuć, K.; Staniak, M.; Latalski, M.; Kiełbowicz, K.Z.; Kocjan, R. Effect of various strontium concentrations on its uptake and the content of isoflavonesin soybean sprouts. Acta Biolog. Crac. Ser. Bot. 2019, 61, 7–12. [Google Scholar]
- Chiriac, E.R.; Chiţescu, C.L.; Borda, D.; Lupoae, M.; Gird, C.E.; Geană, E.-I.; Blaga, G.-V.; Boscencu, R. Comparison of the Polyphenolic Profile of Medicago sativa L. and Trifolium pratense L. Sprouts in Different Germination Stages Using the UHPLC-Q Exactive Hybrid Quadrupole Orbitrap High-Resolution Mass Spectrometry. Molecules 2020, 25, 2321. [Google Scholar] [CrossRef] [PubMed]
- Bláhová, L.; Kohoutek, J.; Procházková, T.; Prudíková, M.; Bláha, L. Phytoestrogens in milk: Overestimations caused by contamination of the hydrolytic enzyme used during sample extraction. J. Dairy Sci. 2016, 99, 6973–6982. [Google Scholar] [CrossRef]
- Wocławek-Potocka, I.; Mannelli, C.; Boruszewska, D.; Kowalczyk-Zieba, I.; Waśniewski, T.; Skarzyński, D.J. Diverse effects of phytoestrogens on the reproductive performance: Cow as a model. Int. J. Endocrinol. 2013, 2013, 650984. [Google Scholar] [CrossRef] [Green Version]
- Patton, S. The Presence of Hippuric Acid in Milk. J. Dairy Sci. 1953, 36, 943–947. [Google Scholar] [CrossRef]
- Carpio, A.; Rodríguez-Estévez, V.; Sánchez-Rodríguez, M.; Arce, L.; Valcárcel, M. Differentiation of organic goat’s milk based on its hippuric acid content as determined by capillary electrophoresis. Electrophoresis 2010, 31, 2211–2217. [Google Scholar] [CrossRef]
- bin Cao, B.; Jin, X.; Yang, H.J.; Li, S.L.; Jiang, L.S. Microbial release of ferulic and p-coumaric acids from forages and their digestibility in lactating cows fed total mixed rations with different forage combinations. J. Sci. Food Agric. 2016, 96, 650–655. [Google Scholar]
- Stefanello, F.S.; Santos, C.O.; Bochi, V.C.; Fruet, A.P.B.; Soquetta, M.B.; Dörr, A.C.; Nörnberg, J.L. Analysis of polyphenols in brewer’s spent grain and its comparison with corn silage and cereal brans commonly used for animal nutrition. Food Chem. 2018, 239, 385–401. [Google Scholar] [CrossRef] [PubMed]
Publisher’s Note: MDPI stays neutral with regard to jurisdictional claims in published maps and institutional affiliations. |
© 2022 by the authors. Licensee MDPI, Basel, Switzerland. This article is an open access article distributed under the terms and conditions of the Creative Commons Attribution (CC BY) license (https://creativecommons.org/licenses/by/4.0/).