
Recovery Rates of Treated vs. Non-Treated Dairy Cows with Subclinical Mastitis


1
Israeli Cattle Breeders Association, Caesarea 3781500, Israel
2
Armenta Ltd., Ra’anana 4321545, Israel
*
Author to whom correspondence should be addressed.
Dairy 2021, 2(4), 576-584; https://doi.org/10.3390/dairy2040045
Submission received: 16 July 2021
/
Revised: 9 September 2021
/
Accepted: 8 October 2021
/
Published: 13 October 2021
Abstract
:The term “spontaneous recovery” refers to a return to a previous condition without any external treatment. In cow mastitis, it refers to cases exhibiting visual symptoms (clinical) or an increase in somatic cell count (SCC) with no visual symptoms (subclinical), with or without identification of a pathogen, from which the animal recovers. A large retrospective analysis of data compiled from the Israeli Dairy Herd Book was performed to evaluate the occurrence of: (i) actual “spontaneous recovery” from the inflammation; (ii) recovery from the inflammation due to antibiotic treatment. In 2018, 123,958 cows from 650 herds with first elevation of SCC at monthly test-day milk yield were clustered into five SCC-cutoff levels (CL) (×103 cells/mL): CL1 (200–299), CL2 (300–399), CL3 (400–499), CL4 (500–999), CL5 (≥1000). Each cutoff level was analyzed separately, and each cow appeared only once in the same lactation and cutoff level, thus resulting in five independent analyses. Recovery was defined as decreased SCC on all three monthly test days, or on the second and third test days, set to: R1 (<100 × 103 cells/mL); R2 (<250 × 103 cells/mL). No difference was found among cutoff levels when the recovery was set to R1, with only 10–12% of the cows presenting spontaneous recovery. When the recovery was set to R2, percent spontaneous recovery was 25–27% at the three higher cutoff levels (CL3–CL5) and 35–41% at the lowest levels (CL1, CL2). Antibiotic treatment was administered to only ~10% of the cows, and in only the higher cutoff-level groups—CL4 and CL5. No difference was found between spontaneous recovery and recovery after antibiotic treatment. Moreover, percentage culled cows treated with antibiotics was significantly higher (p < 0.01) than that of non-treated culled cows (18 and 10.2, respectively), suggesting that the more severe mastitis cases were treated. We concluded that (i) actual spontaneous recovery from inflammation is low and does not depend on the number of cells in the milk at time of infection, and (ii) recovery from inflammation following antibiotic treatment is not higher.
1. Introduction
Mastitis, inflammation of the gland or intramammary infection, causes considerable economic losses to dairy cattle farms [1]. Production losses occur due to the inflammation in both clinical [2,3] and subclinical mastitis [4,5].
The term “spontaneous recovery” (SR) refers to a return to a previous condition without the use of external treatment. In cow mastitis, it refers to cases in which mastitis exhibits visual symptoms (clinical) or an increase in somatic cells with no visual symptoms (subclinical), with or without identification of a pathogen, from which the animal recovers [6]. Although the recovery can be related to the clinical symptoms, the term recovery should focus on the gland or cow returning to its previous level of milk production and quality [7], making it an economic and cost–benefit issue. In many publications, this term is confused with “cure”, i.e., identification of the pathogen and its elimination. Cure and spontaneous cure are calculated for cows that have been diagnosed with mastitis and a pathogen has been isolated, which is highly important when drugs, such as antibiotics, are used. However, cure from the pathogen does not mean recovery; therefore, recovery, and not cure, should be measured [8].
Success in treating an animal should refer to the cow’s health and return to productivity, rather than only elimination of the bacteria, which is nevertheless important in the healing process. Calculation of SR can only be done for cows diagnosed with clinical or subclinical mastitis. Moreover, since many of the cows are not bacteriologically diagnosed, somatic cell count (SCC) is the working criterion [9,10]. The question is, what level of SCC determines subclinical mastitis or recovery [9]. Studies have shown that ~20% of cows with confirmed infections are spontaneously cured, although the hidden spontaneous cure or SR are not measurable. Cure rate is related to the type of bacteria involved, time of treatment, and medicine used (e.g., cure rate of Staphylococcus aureus infections in heifers exceeded 90% when treatment was administered prepartum, whereas during lactational therapy, it was approximately 50% [11].
Antibiotic therapy has played an important role in treating cases of mastitis in dairy cows for almost 70 years. Controlling the spread of pathogens from infected cows in a herd is related mainly to infectious bacteria, such as Streptococcus agalactiae, but has little influence on most of the other pathogens involved in mastitis. The finding that antibiotic treatments have only a slight influence on controlling the spread of mastitis are not new [12]. Numerous studies have been published over the last decades regarding the diversity of antibiotics used for the variety of bacteria involved in mastitis [13]. Although in many studies, the results are satisfactory, overall, they are not conclusive, with large differences in cure rates for the involved pathogens [8,14,15]. Therefore, treatment is designed for the individual cow, rather than for the entire herd.
Treating animals suffering from clinical mastitis is both a welfare and economic issue. Although treatment can be holistic, supportive, or elective, in many dairy farms, antibiotics are the first line of defense in mastitis treatment, even though this is not always justified. Differences in cure rates are related, in part, to different interpretations of infection vs. inflammation, and identification of the pathogen involved. Inflammation results from activation of the immune system and is highly important in fighting the pathogen. However, during the host response, tissue cells are damaged; this leads to chronic inflammation, which results in lower yield and poorer quality of the milk long after pathogen clearance [1,16,17,18].
Antibiotic treatment costs money, both directly for medications and veterinarians, and indirectly, mainly owing to milk loss during antibiotic residue withdrawal. Thus, its use calls for cautious decision-making. A study by Rollin at al. [19] stated that “the average case of clinical mastitis resulted in a total economic cost of $444, including $128 in direct costs and $316 in indirect costs.” Continued use of antibiotics in dairy cows has a direct effect on fostering antimicrobial resistance and its consequences on human health due to the appearance of new pathogenic bacteria. Thus, the use of antibiotics for treating mastitis should be weighed in terms of both its cost–benefit and government regulations for reducing overall use.
To explore this important subject, we conducted a large retrospective analysis of data compiled from the Israeli Dairy Herd Book to evaluate: (i) actual SR from inflammation; (ii) recovery from inflammation due to antibiotic treatment.
2. Materials and Methods
Retrospective analyses were conducted using data drawn from the Herd Book of the Israel Cattle Breeders Association (ICBA, Caesarea, Israel). In 2018, 123,958 cows from 650 herds (lactations: 1–34%, 2–25%, 3–18%, and 4+–22%) with first elevation of monthly test-day SCC above the selected cutoff were clustered into five SCC-cutoff levels (×103 cells/mL): CL1 (200–299), CL2 (300–399), CL3 (400–499), CL4 (500–999), CL5 (≥1000). Given the way in which the cows were enrolled, it is possible that some cows in the CL5 group had clinical symptoms. However, the reference in the article relates to all cows as if they had subclinical mastitis. Each cutoff level was analyzed separately, and each cow appeared only once in the same lactation and cutoff level, thus resulting in five independent analyses. Data of lactation, days in milk (DIM), SCC, daily milk yield (MY) at time of first SCC elevation and up to 3 months after it (90 days), along with information on antibiotic treatments, and culling and its cause, were also recorded. The SR and recovery due to antibiotic administration (AR) were calculated. Recovery from inflammation was defined as a decrease in the SCC on all three monthly test days or on the second and third test days to two levels: R1 (<100 × 103) and R2 (<250 × 103 cells/mL). Cows that did not recover were considered to have chronic inflammation. Antibiotic treatments were administered in each herd according to veterinarian and herd manager decisions and protocols, and therefore, different protocols may have been used.
Statistical Analysis
Distribution of dairy cows according to the different SCC-cutoff levels and the other parameters was tested using the proc summary procedure of SAS (SAS Institute Inc. Version 9.2, Cary, NC, USA, 2009).
To test the different parameters influencing recovery and culling rate, recovery was set as R2. Recovery and culling rate were tested for all levels. However, we decided to present the result at two cutoff levels, CL2 and CL5. Multivariable models were designed with a logistic model statement using the GLIMMIX procedure of SAS, with recovery or culling rate (until 90 days from SCC elevation) as the dependent variable, as previously described [20]. The first model tested the probability of recovery to level R2 and culling at the cutoff level CL2. The analysis was performed with the general form: recovery rate or culling rate = intercept + lactation number + DIM + MY + error. The second model aimed for cutoff level CL5 and analysis was performed by adding treatments (antibiotics—AB; not treated—NT): recovery rate or culling rate = intercept + treatment + lactation number + DIM + MY + treatment × lactation + treatment × DIM + treatment × MY + error, where recovery rate or culling rate = ln P/(1−P), P = probability of recovery/culling; treatment = cows treated with AB vs. NT; lactation number = first, second, third, fourth, and more lactations; DIM = ≤50, 51–100, 101–200, >200; MY (Lvfday) = ≥30, 31–40, 41–50, >50. All variables were considered as fixed effects.
Probability of recovery or culling for the level of a specific variable included in the two models was based on least-squares means. To compare levels within a variable, we ran the Bonferroni adjustment for multiple comparisons.
3. Results
Along lactation, 32% of the dairy cows were assigned to CL1, 19% each to CL2 and CL4, 12% to CL3, and 18% to CL5 (Table 1). Average SCC at time of first elevation was around mid-range of the cutoff level for all groups, except for CL5 with an average >2700 × 103 cells/mL. No difference in the average MY at t = 0 was noted among the first four cutoff levels, whereas CL5 had a lower MY (Table 1). No differences were found in lactation number or DIM among the five cutoff levels with an average lactation number of 2.4–2.7 and 123–147 DIM.
Overall culling during the 90 days after first elevation of SCC, regardless of treatment, was 6–7% for CL1–CL3, increased to ~8% for CL4 and up to 11% for CL5. Percent culling due to mastitis was calculated from the total number of culled cows as recorded by the herd staff for CL1–CL5 (Table 1). It was 44% for CL1, 43% for CL2, 47% for CL3, increased to 50% for CL4 and up to 61% for CL5.
SR and AR from the inflammation were calculated for each cutoff level and are reported in Table 2. Recovery was set as decreased level of SCC on all three monthly test days or on the second and third test days to: <100 × 103 cells/mL (R1) or <250 × 103 cells/mL (R2). No difference in SR was found at any of the cutoff levels when the recovery was set to R1, with only 10–13% of the cows presenting it. When the recovery was set to R2, SR was 25–27% for the three highest cutoff levels (CL3–CL5), and 41% and 32% for the lowest levels (CL1 and CL2, respectively). Percent AR was calculated only for the three highest cutoff levels due to the low number of cows treated at the lower cutoff levels. No significant differences were found among the cutoff levels (CL3–CL5) or between SR and AR (Table 2).
A complete analysis was performed for each cutoff level and the statistical results are summarized for cutoff levels CL2 and CL5. The complete analysis for CL2 of the association of SR and culling due to mastitis with lactation number, DIM, and MY is summarized in Table 3. When SR was set to level R2, a significantly higher recovery level (p < 0.001) was found in cows in first lactation, in early DIM (≤50 days) and with higher than 30 L/day MY. Total culling for the 90-day period was 6.5% and was significantly (p < 0.001) higher in cows that were 51–200 DIM and those producing less than 30 L/day milk (Table 3).
Complete analysis of the association of SR, AR, and culling due to mastitis with lactation number, DIM, and MY for CL5 (first SCC elevation >1000 × 103 cells/mL, 22,032 cows, 17.8% of the total cows in 2018) is summarized in Table 4. The number of cows treated with antibiotics was only 10.6% (2328/22,032) and this may have influenced the analyses. Table 4 presents the association of treatment, lactation number, DIM, and MY with recovery or culling rates of subclinical mastitis cows. Treatment of cows with antibiotic resulted in somewhat higher recovery rates than in the non-treated group, but not significantly so. Primiparous cows and second-lactation cows showed significantly higher recovery rates compared to the older cows (p < 0.001). Cows with more than 200 DIM showed significantly lower recovery rates compared to those with lower DIM (p < 0.001), and cows with high MY (>40 L/day) showed lower recovery rates than those with lower milk production (p < 0.05). Effect of antibiotic treatment vs. no treatment on recovery from mastitis in different interactions is also shown in Table 4. Significant differences were found in cows from second and fourth lactations, as well as in cows with higher DIM and lower MY (Table 4; p < 0.01).
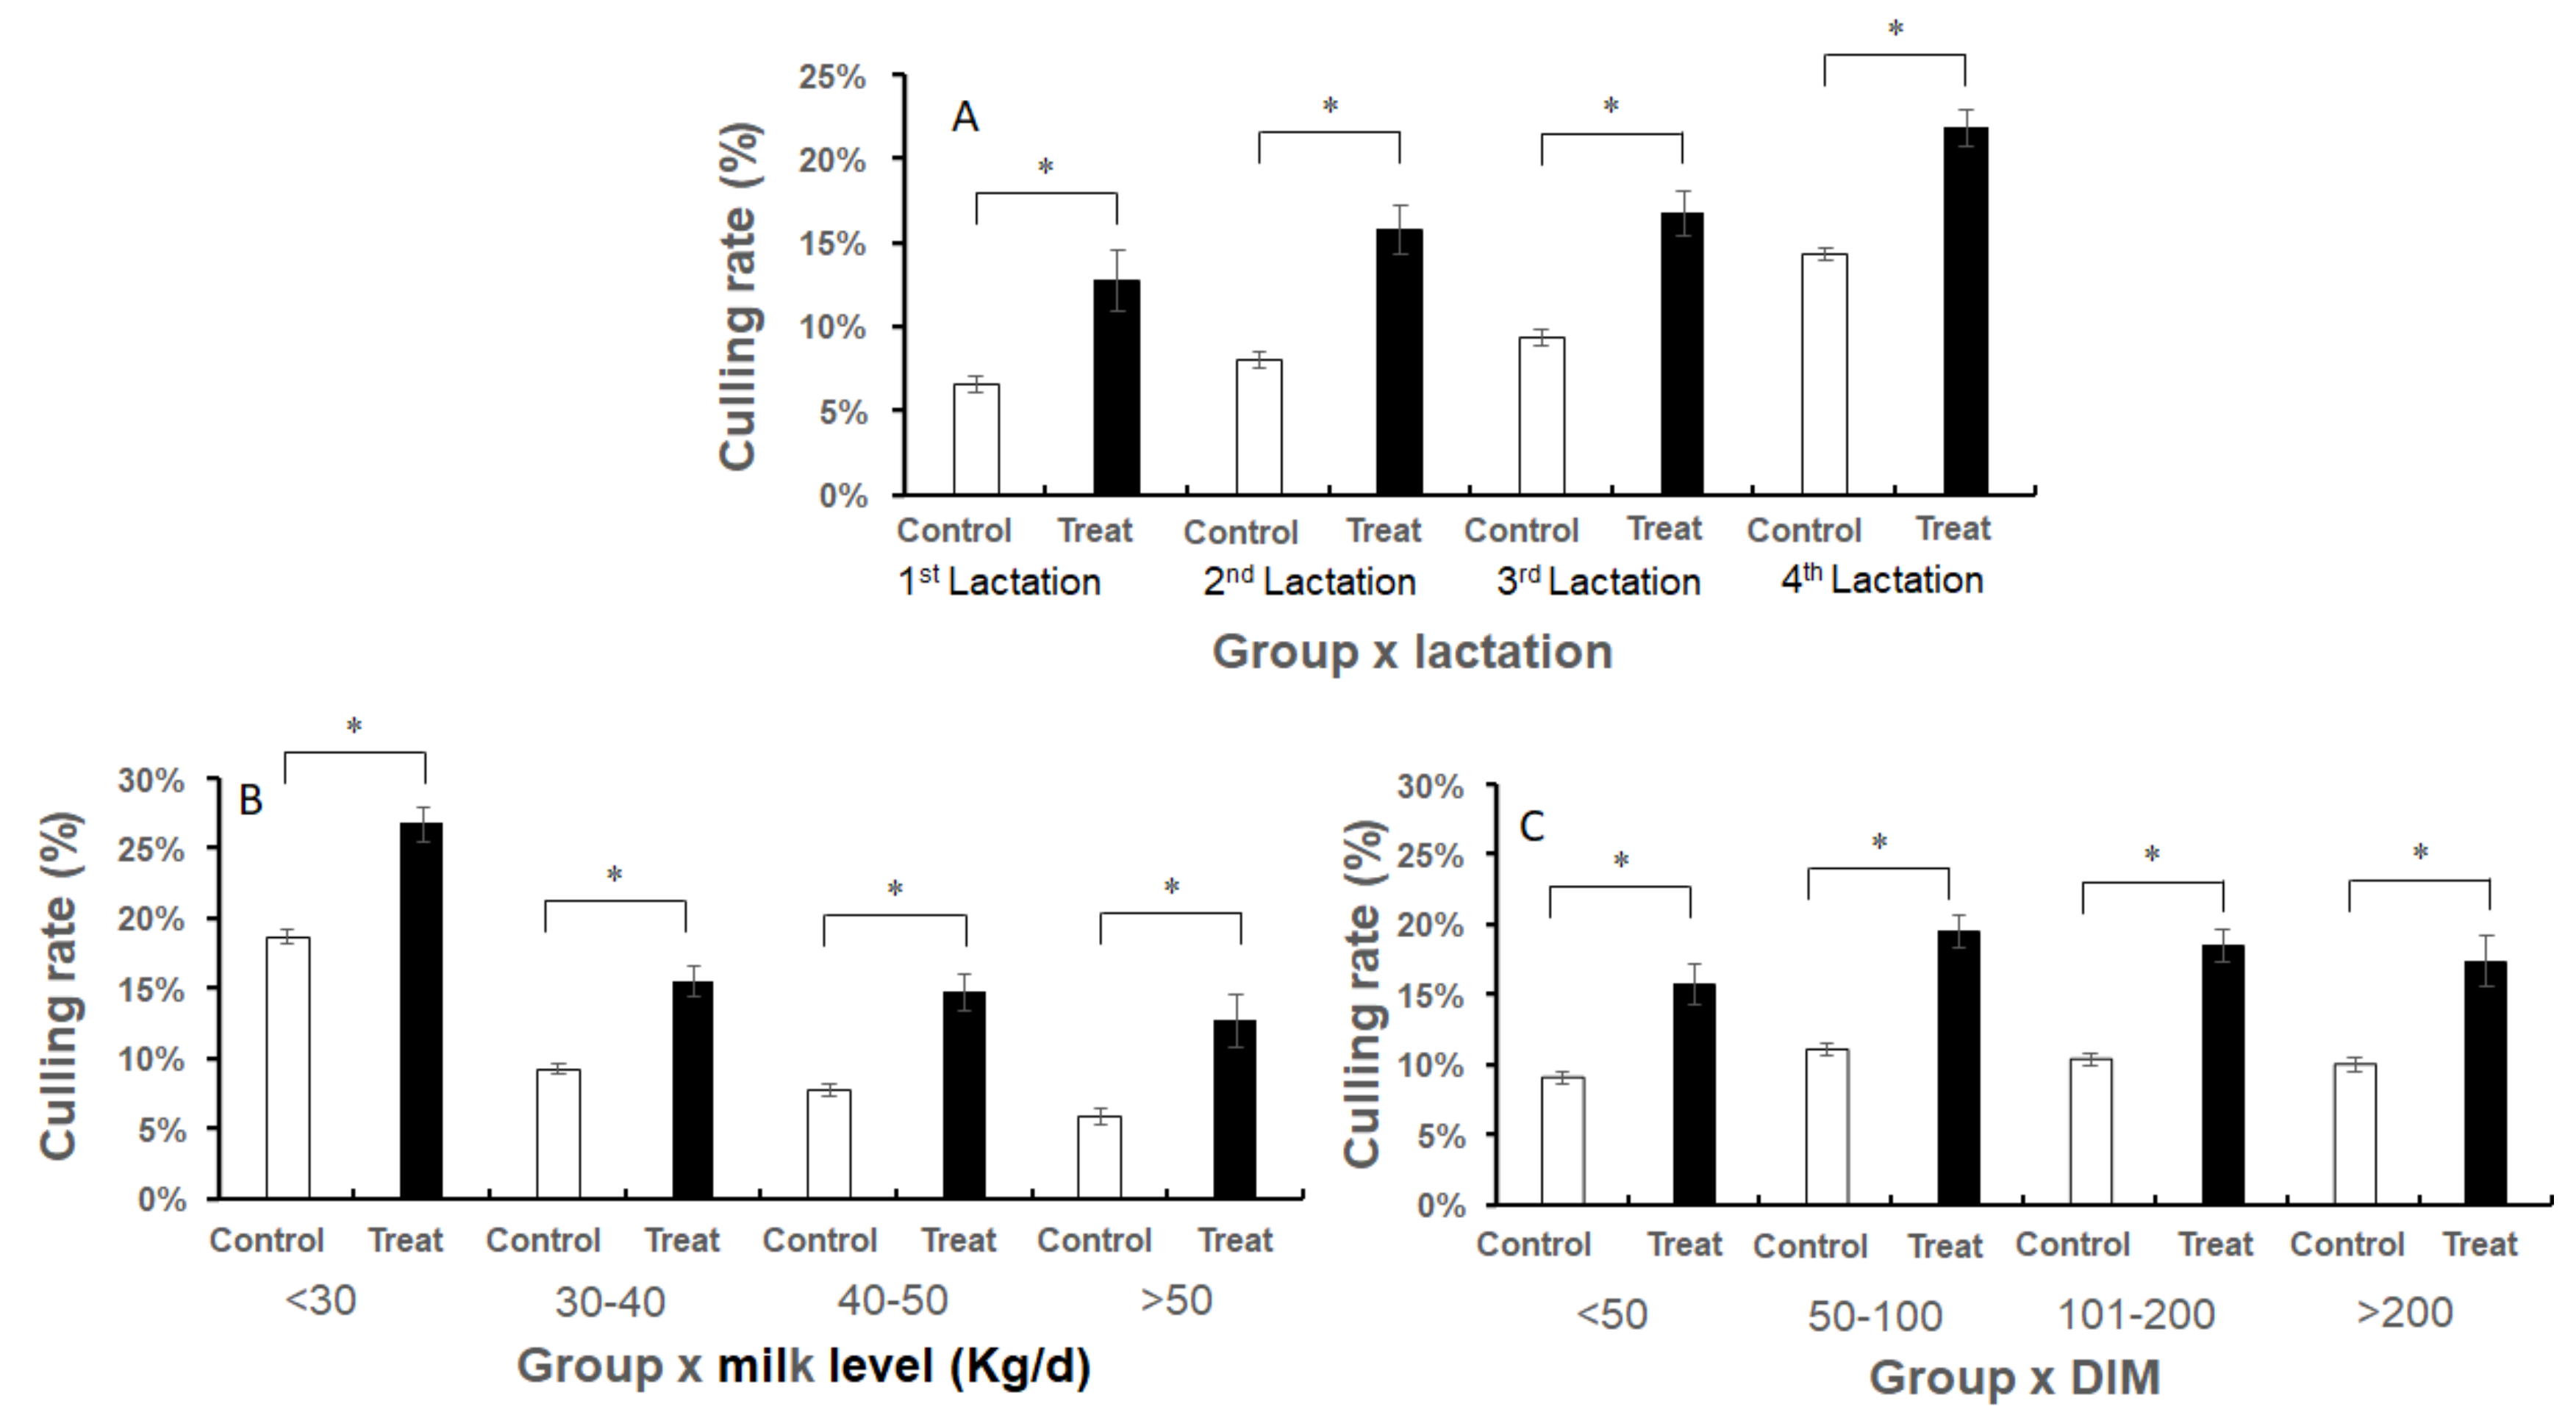
Treatment of cows with antibiotics resulted in a higher culling rate (p < 0.001) than in non-treated cows. Primiparous cows showed the lowest culling rate, and higher rates were found in older cows (p < 0.001); cows early in lactation had the lowest culling rates and cows with low MY (≤30 L/day) showed the highest culling rates (p < 0.001). The association between antibiotic treatment vs. no treatment and culling rates in the different interactions is seen in Figure 1A–C and Table 4. Treatment with antibiotics resulted in significantly higher culling rates in all subgroups, although the number of treated cows was very small (Table 4 and Figure 1A–C; p < 0.01).
Cause of culling (reproduction, mastitis, or other problems low MY, age, or lack of information) was recorded by the dairy owners. The number and percentage of culled cows for 90 days from first SCC elevation and the distribution over time, according to the cause marked by the owner, for SCC-cutoff level CL5, separately for non-treated and antibiotic-treated cows, are summarized in Table 5. Percent culling of the antibiotic-treated cows was significantly higher (p < 0.01) than for the non-treated cows (18% vs. 10.2%, respectively; Table 5), suggesting that the more severe mastitis cases were treated. The mean time to culling was 45 days, suggesting that most of the cows recorded as culled due to “other problems” were also culled due to the mastitis event. Under this assumption, ~90% of the cows culled in both non-treated and treated groups were culled due to mastitis events.
4. Discussion
The objective of this analysis was to evaluate the actual SR and AR from inflammation. For example, expectations for spontaneous bacteriological cure of subclinical and clinical mastitis caused by Staphylococcus aureus are essentially low [21], whereas the expectation for spontaneous cure from Escherichia coli is quite high [22] and therapeutic cure rates for several pathogens (yeast, Pseudomonas, mycoplasma, Prototheca, etc.) are essentially zero, regardless of treatment. When deciding on the best treatment, it is very important to consider the possibility of intrinsic resistance. Intrinsic resistance occurs when a bacterial genus or species lacks targets or has defenses that render antimicrobials ineffective [23]. Knowledge of etiology is essential to ensuring that the spectrum of activity of an antimicrobial drug is appropriate for the case at hand [24]. Another important parameter to consider is dairy cow welfare. Mastitis is a painful disease that has direct welfare implications for the cow and can also increase the risk of early and involuntary culling of the cow from the herd, as was found here and in other studies [19,25,26].
This issue presents a very important daily concern for dairy farmers, i.e., how to manage subclinical or clinical mastitis in terms of cost–benefit and animal welfare. Here, two assumptions were made: (i) recovery from the inflammation rather than cure; (ii) culling up to 45 days from first detection of SCC elevation relates to the mastitis event, although these same cows were programmed to be involved in voluntary culling (in the article we use the term “time of culling”). Managing mastitis must take the following factors into account: management, pathogens causing the infection, alternative treatments, cost–benefit of prevention or treatment, and short- and long-term effects on the consumer, cow welfare, and the environment. No single protocol serves all of these factors, and not every scientifically based result can be implemented as reported, but should be related to mastitis severity, medicine availability, regulations, and cost–benefit considerations. In this respect, large retrospective analyses conducted with data from the Israeli Dairy Herd Book, with actual SR and AR from the inflammation, enable a broader understanding of the management of mastitis under local conditions and suggestions for an economic model. SR is the term used when the cow’s immune system becomes engaged and eliminates an infection without the use of antibiotics. A study by the extension service in Georgia showed that this occurs in only about 20% of confirmed infections for a variety of mastitis-causing bacteria. In the current study, the SR was around 25–30% in cows with moderate to severe subclinical mastitis.
Most of the decisions of whether to treat, and if so, with what antibiotics, neglected to consider bacteriology. Moreover, the antibiotic treatments were applied by different veterinarians and dairy workers. Thus, most of the treatments were not applied following bacterial identification, and we do not know whether the treatments followed the protocol for each antibiotic used. Due to the lack of information on bacteriology after treatment, the cure rate is unknown. However, what this large study demonstrates is that the main target of treatment, i.e., recovery from infection and a return to normal milk production, was not achieved using antibiotics. Lack of differences between the treated and non-treated cows indicated that the protocols used by the farm (antibiotics, bacteriology, time of treatment) were not appropriate. These results are similar to those of most other studies where antibiotics were used for treatment of clinical mastitis (reviewed in [24]) and no significant differences were found between the treated and non-treated groups. The analyses were based on data from monthly milk records, daily MY, and SCC. Within these limitations, i.e., inflammation = SCC and no bacteriological information, we found that first SCC elevation can range from 300 × 103 cells/mL to 1000 × 103 cells/mL with no significant difference in daily MY, percentage of SR, or timing of culling. In contrast, at ≥1000 × 103 cells/mL, presumably representing clinical mastitis but not always with visible symptoms, daily MY was significantly lower and percent culling was higher than at all other SCC-cutoff levels. In addition, no difference was found between SR and AR in the two high-cutoff groups, CL4 and CL5. This implies that the probability of SR is not correlated with the level of the SCC, and is probably related to the pathogen causing the infection, and the resultant damage to the mammary tissue and immune cells. It is important to mention that the proportion of cows with SCC <1000 × 103 cells/mL that were treated with antibiotics was very low, probably only including the more severe cases, leaving the farmer with no tools to cope with low to moderate subclinical mastitis.
5. Conclusions
(i) Actual SR from inflammation is low and does not depend on the number of somatic cells in the milk. This result probably relates to the different pathogens involved, the cow’s genetic makeup and health, and their interaction. However, for the farmer, the decision to cull or leave the cow in the herd involves not just recovery, but also whether the cow’s profitably is restored. (ii) The AR was not higher than the SR. First, these results indicate that the protocols used (antibiotics, bacteriology, time of treatment) were not appropriate. Antibiotic treatment with no bacteriology suggests a violation of the protocol and can cause more harm than good for the farmer, the public, and the environment relative to the cow’s recovery. Second, it is clear that antibiotics are not suitable for treating cows with SCC <500 × 103 cells/mL and no clinical symptoms, leaving the farmer with no treatment options.
Author Contributions
Y.L.: Result interpretation, statistical analysis, writing—original draft. G.L.: result interpretation, statistical analysis, writing—original draft. D.G.: result interpretation. All authors have read and agreed to the published version of the manuscript.
Funding
This research received no external funding.
Institutional Review Board Statement
Not applicable.
Informed Consent Statement
Not applicable.
Acknowledgments
We thank the ICBA computer unit for their help with the original data for analysis.
Conflicts of Interest
The authors declare no conflict of interest.
References
- Halasa, T.; Huijps, K.; Østerås, O.; Hogeveen, H. Economic effects of bovine mastitis and mastitis management: A review. Vet. Q. 2007, 29, 18–31. [Google Scholar] [CrossRef]
- Gröhn, Y.T.; Wilson, D.J.; González, R.N.; Hertl, J.A.; Schulte, H.; Bennett, G.; Schukken, Y.H. Effect of pathogen-specific clinical mastitis on milk yield in dairy cows. J. Dairy Sci. 2004, 87, 3358–3374. [Google Scholar] [CrossRef]
- Hertl, J.A.; Schukken, Y.H.; Welcome, F.L.; Tauer, L.W.; Gröhn, Y.T. Effects of pathogen-specific clinical mastitis on probability of conception in Holstein dairy cows. J. Dairy Sci. 2014, 97, 6942–6954. [Google Scholar] [CrossRef] [PubMed] [Green Version]
- Hortet, P.; Beaudeau, F.; Seegers, H.; Fourichon, C. Reduction in milk yield associated with somatic cell counts up to 600 000 cells/mL in French Holstein cows without clinical mastitis. Live. Prod. Sci. 1999, 61, 33–42. [Google Scholar] [CrossRef]
- Halasa, T.; Nielen, M.; De Roos, A.P.W.; Van Hoorne, R.; de Jong, G.; Lam, T.J.G.M.; Van Werven, T.; Hogeveen, H. Production loss due to new subclinical mastitis in Dutch dairy cows estimated with a test-day model. J. Dairy Sci. 2009, 92, 599–606. [Google Scholar] [CrossRef] [PubMed] [Green Version]
- Smith, K.L. Standards for somatic cells in milk: Physiological and regulatory. IDF Mastit. Newsl. 1995, 144, 7–9. [Google Scholar]
- Leitner, G.; Blum, S.E.; Krifuks, O.; Edery, N.; Merin, U. Correlation between milk bacteriology, cytology, and mammary tissue histology in cows: Cure from the pathogen or recovery from the inflammation. Pathogens 2020, 9, 364. [Google Scholar] [CrossRef] [PubMed]
- Barkema, H.W.; Schukken, Y.H.; Zadoks, R.N. Invited review: The role of cow, pathogen, and treatment regimen in the therapeutic success of bovine Staphylococcus aureus mastitis. J. Dairy Sci. 2006, 89, 1877–1895. [Google Scholar] [CrossRef] [Green Version]
- Djabri, B.; Bareille, N.; Beaudeau, F.; Seegers, H. Quarter milk somatic cell count in infected dairy cows: A meta-analysis. Vet. Res. 2002, 33, 335–357. [Google Scholar] [CrossRef] [Green Version]
- Schukken, Y.H.; Wilson, D.J.; Welcome, F.; Garrison-Tikofsky, L.; Gonzalez, R.N. Monitoring udder health and milk quality using somatic cell counts. Vet. Res. 2003, 34, 579–596. [Google Scholar] [CrossRef] [Green Version]
- Owens, W.E.; Nickerson, S.C.; Boddie, R.L.; Tomita, G.M.; Ray, C.H. Prevalence of mastitis in dairy heifers and effectiveness of antibiotic therapy. J. Dairy Sci. 2001, 84, 814–817. [Google Scholar] [CrossRef]
- Murphy, J.M. Mastitis—The struggle for understanding. J. Dairy Sci. 1956, 39, 1768–1773. [Google Scholar] [CrossRef]
- Wilson, D.J.; Gonzalez, R.N.; Case, K.L.; Garrison, L.L.; Groöhn, Y.T. Comparison of seven antibiotic treatments with no treatment for bacteriological efficacy against bovine mastitis pathogens. J. Dairy Sci. 1999, 82, 1664–1670. [Google Scholar] [CrossRef]
- Apparao, D.J.; Oliviera, L.; Ruegg, P.L. Relationship between results of in vitro susceptibility tests and outcomes following treatment with pirlimycin hydrochloride in cows with subclinical mastitis associated with gram-positive pathogens. J. Am. Vet. Med. Assoc. 2009, 234, 1437–1446. [Google Scholar] [CrossRef]
- Steeneveld, W.; van Werven, T.; Barkema, H.W.; Hogeveen, H. Cow-specific treatment of clinical mastitis: An economic approach. J. Dairy Sci. 2011, 94, 174–188. [Google Scholar] [CrossRef]
- Rajala-Schultz, P.J.; Gröhn, Y.T.; McCulloch, C.E.; Guard, C.L. Effects of clinical mastitis on milk yield in dairy cows. J. Dairy Sci. 1999, 82, 1213–1220. [Google Scholar] [CrossRef]
- Schukken, Y.H.; Bennett, G.J.; Zurakowski, M.J.; Sharkey, H.L.; Rauch, B.J.; Thomas, M.J.; Ceglowski, B.; Saltman, R.L.; Belomestnykh, N.; Zadoks, R.N. Randomized clinical trial to evaluate the efficacy of a 5-day ceftiofur hydrochloride intramammary treatment on nonsevere gram-negative clinical mastitis. J. Dairy Sci. 2011, 94, 6203–6215. [Google Scholar] [CrossRef] [PubMed] [Green Version]
- Blum, S.; Heller, E.D.; Leitner, G. Long term effects of Escherichia coli. Vet. J. 2014, 201, 72–77. [Google Scholar] [CrossRef] [PubMed]
- Rollin, E.; Dhuyvetter, K.C.; Overton, M.W. The cost of clinical mastitis in the first 30 days of lactation: An economic modeling tool. Prev. Vet. Med. 2015, 122, 257–264. [Google Scholar] [CrossRef] [PubMed] [Green Version]
- Lavon, Y.; Ezra, E.; Leitner, G.; Wolfenson, D. Association of conception rate with pattern and level of somatic cell count elevation relative to time of insemination in dairy cows. J. Dairy Sci. 2011, 94, 4538–4545. [Google Scholar] [CrossRef]
- Oliver, S.P.; Gillespie, B.E.; Headrick, S.J.; Moorehead, H.; Lunn, P.; Dowlen, H.H.; Johnson, D.L.; Lamar, K.C.; Chester, S.T.; Moseley, W.M. Efficacy of extended Ceftiofur intramammary therapy for treatment of subclinical mastitis in lactating dairy cows. J. Dairy Sci. 2004, 87, 2393–2400. [Google Scholar] [CrossRef]
- Suojala, L.; Kaartinen, L.; Pyorala, S. Treatment for bovine Escherichia coli mastitis—An evidence based approach. Vet Pharm. Ther. 2013, 36, 521–531. [Google Scholar] [CrossRef]
- Boerlin, P.; White, D.G. Antimicrobial resistance and its epidemiology. In Antimicrobial Therapy in Veterinary Medicine, 5th ed.; Giguere, S., Prescott, J.F., Dowling, P.M., Eds.; Wiley Blackwell: Ames, IA, USA, 2013; pp. 21–40. [Google Scholar] [CrossRef]
- Ruegg, P.L. What is success? A narrative review of research evaluating outcomes of antibiotics used for treatment of clinical mastitis. Front. Vet. Sci. 2021, 8, 639641. [Google Scholar] [CrossRef]
- Liang, D.; Arnold, L.M.; Stowe, C.J.; Harmon, R.J.; Bewley, J.M. Estimating US dairy clinical disease costs with a stochastic simulation model. J. Dairy Sci. 2017, 100, 1472–1486. [Google Scholar] [CrossRef] [Green Version]
- Aghamohammadi, M.; Haine, D.; Kelton, D.F.; Barkema, H.W.; Hogeveen, H.; Keefe, G.P.; Dufour, S. Herd-level mastitis-associated costs on Canadian dairy farms. Front. Vet. Sci. 2018, 5, 100. [Google Scholar] [CrossRef] [PubMed]
Figure 1.
Culling rates of treated (Treat) vs. non-treated (Control) dairy cows due to mastitis according to different interactions. (A) Group x lactation number. (B) Group x milk level. (C) Group x DIM. Numbers of cows are presented in Table 4. Data are presented as mean ± SEM. * p < 0.01.
Figure 1.
Culling rates of treated (Treat) vs. non-treated (Control) dairy cows due to mastitis according to different interactions. (A) Group x lactation number. (B) Group x milk level. (C) Group x DIM. Numbers of cows are presented in Table 4. Data are presented as mean ± SEM. * p < 0.01.

Table 1.
The five independent analyses based on somatic cell count (SCC)-cutoff levels of number of cows and percent of total in 2018 (n = 958,123), average and SE of SCC and milk yield at time of first SCC elevation, and number of cows culled and percent of total number of cows culled due to mastitis and overall per cutoff group.
| Cutoff Level SCC (×103/mL) | Cows | SCC (×103/mL) | Milk Yield (L/Day) | Total Cows Culled | Cows Culled Due to Mastitis (from Total) | |||
|---|---|---|---|---|---|---|---|---|
| n | % | n | % | n | % | |||
| CL1 (200–299) | 39,170 | 31.6 | 243 ± 0.03 | 39.9 ± 0.03 | 2195 | 5.6 | 965 | 44.0 |
| CL2 (300–399) | 23,390 | 18.9 | 344 ± 0.06 | 39.6 ± 0.03 | 1518 | 6.5 | 651 | 42. 9 |
| CL3 (400–499) | 15,164 | 12.2 | 444 ± 0.05 | 39.7 ± 0.04 | 1056 | 7.0 | 499 | 47.3 |
| CL4 (500–999) | 24,202 | 19.5 | 693 ± 0.20 | 39.3 ± 0.03 | 1913 | 7.9 | 959 | 50.1 |
| CL5 (≥1000) | 22,032 | 17.8 | 2785 ± 0.20 | 36.5 ± 0.04 | 2435 | 11.1 | 1487 | 61.1 |
Table 2.
The five independent analyses based on somatic cell count-cutoff levels for spontaneous recovery (SR) from inflammation and recovery due to antibiotic treatments (AR), with recovery set at 100 × 103 or 250 × 103 cells/mL.
Table 2.
The five independent analyses based on somatic cell count-cutoff levels for spontaneous recovery (SR) from inflammation and recovery due to antibiotic treatments (AR), with recovery set at 100 × 103 or 250 × 103 cells/mL.
| Cutoff Level | Cows | SR | AR | ||||||||
|---|---|---|---|---|---|---|---|---|---|---|---|
| Total | Treatment 1 | 100 × 103 | 250 × 103 | 100 × 103 | 250 × 103 | ||||||
| n | NT | AB | n | % | n | % | n | % | N | % | |
| CL1 (200–299) 2 | 39,169 | 37,315 | 1854 | 4676 | 12.5 | - | - | n/a | |||
| CL2 (300–399) | 23,390 | 22,221 | 1169 | 2171 | 9.8 | 7035 | 31.7 | n/a | |||
| CL3 (400–499) | 15,164 | 14,296 | 868 | 1918 | 13.4 | 3848 | 26.9 | 92 | 10.6 | 251 | 28.9 |
| CL4 (500–999) | 24,202 | 22,557 | 1645 | 2239 | 9.9 | 6133 | 27.2 | 170 | 10.3 | 433 | 26.3 |
| CL5 (≥1000) | 22,032 | 19,704 | 2328 | 2045 | 10.4 | 4988 | 25.3 | 320 | 13.8 | 701 | 30.1 |
1 NT—not treated; AB—treated with antibiotics; n/a—analysis not applicable due to low number of cows treated with AB. 2 CL1 group—data on recovery are just when SCC decline below 100.
Table 3.
Association between lactation number, days in milk (DIM) and milk yield on day of somatic cell count (SCC) elevation to between 300 × 103 and 399 × 103 cells/mL (CL2) with spontaneous recovery (<250 × 103 cells/mL) (R2) and culling percentage (90 days) from mastitis event.
Table 3.
Association between lactation number, days in milk (DIM) and milk yield on day of somatic cell count (SCC) elevation to between 300 × 103 and 399 × 103 cells/mL (CL2) with spontaneous recovery (<250 × 103 cells/mL) (R2) and culling percentage (90 days) from mastitis event.
| Variable | Level | Cows # | LSM Diff 1 | REF Level 2 | p-Value | SE | LSM Diff | REF Level | p-Value | SE |
|---|---|---|---|---|---|---|---|---|---|---|
| Recovery 3 | Culling 4 | |||||||||
| Lactation | 1 | 6974 | - | 0.391 | - | - | - | 0.02 | - | - |
| 2 | 5023 | −0.026 | 0.007 | 0.032 | 0.031 | 0.001 | 0.066 | |||
| 3 | 4726 | −0.085 | 0.001 | 0.034 | 0.04 | 0.001 | 0.065 | |||
| 4+ | 6667 | −0.155 | 0.001 | 0.030 | 0.071 | 0.001 | 0.049 | |||
| DIM | ≤50 | 3117 | - | 0.414 | - | - | - | 0.039 | - | - |
| 51–100 | 4600 | −0.056 | 0.001 | 0.032 | 0.025 | 0.001 | 0.067 | |||
| 101–200 | 8770 | −0.076 | 0.001 | 0.024 | 0.015 | 0.002 | 0.052 | |||
| >200 | 6903 | −0.215 | 0.001 | 0.033 | 0.001 | 0.818 | 0.060 | |||
| Milk yield (L/day) | ≤30 | 4090 | - | 0.256 | - | - | - | 0.173 | - | - |
| 31–40 | 8951 | 0.056 | 0.001 | 0.026 | −0.112 | 0.001 | 0.051 | |||
| 41–50 | 7103 | 0.091 | 0.001 | 0.027 | −0.144 | 0.001 | 0.067 | |||
| >50 | 3246 | 0.119 | 0.001 | 0.040 | −0.156 | 0.001 | 0.109 | |||
1 Differences in parameters’ least-squares means (LSM) are deviations from the reference levels. 2 LSM values are deviations from the reference levels. Reference levels of the variables correspond to the probability of recovery or culling for each variable. 3 Recovery was set as decreased level of SCC on all three monthly test days or on the second and third test days to <250 × 103 cells/mL. 4 Cows that left the herd up to 90 days after first SCC elevation.
Table 4.
Association between treatment, lactation number, days in milk (DIM) and milk yield on day of somatic cell count (SCC) elevation ≥1000 ×103 (CL5) and spontaneous recovery, recovery after antibiotic treatment (recovery set to <250 × 103 cells/mL), and culling percentage (90 days) due to mastitis event.
| Variable | Level | N | LSM Diff 1 | REF Level 2 | p-Value | SE | LSM Diff | REF Level | p-Value | SE |
|---|---|---|---|---|---|---|---|---|---|---|
| Recovery 3 | Culling 4 | |||||||||
| Treatment | Not treated | 19,704 | - | 0.254 | - | - | - | 0.076 | - | - |
| Treated | 2328 | 0.035 | 0.004 | 0.058 | 0.061 | 0.001 | 0.077 | |||
| Lactation | 1 | 4978 | - | 0.312 | - | - | - | 0.061 | - | - |
| 2 | 4484 | 0.029 | 0.096 | 0.053 | 0.035 | 0.001 | 0.075 | |||
| 3 | 4687 | −0.056 | 0.006 | 0.053 | 0.054 | 0.001 | 0.067 | |||
| 4+ | 7883 | −0.121 | 0.001 | 0.046 | 0.108 | 0.001 | 0.048 | |||
| DIM | ≤50 | 4490 | - | 0.309 | - | - | - | 0.101 | - | - |
| 51–100 | 5548 | −0.015 | 0.324 | 0.096 | 0.029 | 0.001 | 0.057 | |||
| 101–200 | 7717 | 0.004 | 0.977 | 0.093 | 0.006 | 0.485 | 0.057 | |||
| >200 | 4277 | −0.123 | 0.001 | 0.076 | −0.020 | 0.028 | 0.089 | |||
| Milk yield (L/day) | ≤30 | 4590 | - | 0.295 | - | - | - | 0.224 | - | - |
| 31–40 | 7740 | −0.011 | 0.432 | 0.044 | −0.115 | 0.001 | 0.058 | |||
| 41–50 | 6642 | −0.036 | 0.009 | 0.052 | −0.145 | 0.001 | 0.069 | |||
| >50 | 3060 | −0.045 | 0.011 | 0.078 | −0.168 | 0.001 | 0.103 | |||
| Treatment × lactation | Control × 1 | 4642 | - | 0.301 | - | - | - | 0.041 | - | - |
| Treat × 1 | 336 | 0.025 | 0.363 | 0.129 | 0.048 | 0.001 | 0.178 | |||
| Control × 2 | 4009 | - | 0.321 | - | - | - | 0.068 | - | - | |
| Treat × 2 | 475 | 0.024 | 0.081 | 0.106 | 0.064 | 0.001 | 0.136 | |||
| Control × 3 | 4144 | - | 0.242 | - | - | - | 0.088 | - | - | |
| Treat × 3 | 543 | 0.028 | 0.157 | 0.099 | 0.062 | 0.001 | 0.122 | |||
| Control × 4+ | 6909 | - | 0.172 | - | - | - | 0.141 | - | - | |
| Treat × 4+ | 974 | 0.038 | 0.005 | 0.088 | 0.06 | 0.001 | 0.087 | |||
| Treatment × DIM | Control × ≤50 | 4027 | - | 0.295 | - | - | - | 0.077 | - | - |
| Treat × ≤50 | 463 | 0.029 | 0.226 | 0.105 | 0.055 | 0.001 | 0.135 | |||
| Control × 51–100 | 4831 | - | 0.283 | - | - | - | 0.101 | - | - | |
| Treat × 51–100 | 717 | 0.025 | 0.203 | 0.087 | 0.066 | 0.011 | 0.104 | |||
| Control × 101–200 | 6879 | - | 0.284 | - | - | - | 0.08 | - | - | |
| Treat × 101–200 | 838 | 0.05 | 0.006 | 0.082 | 0.062 | 0.001 | 0.105 | |||
| Control >200 | 3967 | - | 0.171 | - | - | - | 0.057 | - | - | |
| Treat × >200 | 310 | 0.032 | 0.164 | 0.145 | 0.059 | 0.001 | 0.168 | |||
| Treatment × milk yield (L/day) | Control × ≤30 | 3937 | - | 0.257 | - | - | - | 0.198 | - | - |
| Treat × ≤30 | 653 | 0.079 | 0.001 | 0.086 | 0.055 | 0.002 | 0.094 | |||
| Control × 31–40 | 6988 | - | 0.248 | - | - | - | 0.088 | - | - | |
| Treat × 31–40 | 752 | 0.076 | 0.001 | 0.082 | 0.046 | 0.001 | 0.108 | |||
| Control × 41–50 | 6018 | - | 0.245 | - | - | - | 0.054 | - | - | |
| Treat × 41–50 | 624 | 0.026 | 0.19 | 0.104 | 0.058 | 0.001 | 0.128 | |||
| Control × >50 | 2761 | - | 0.268 | - | - | - | 0.034 | - | - | |
| Treat × >50 | 299 | −0.036 | 0.225 | 0.149 | 0.056 | 0.001 | 0.188 | |||
1 Differences in parameters’ least-squares means (LSM) are deviations from the reference levels. 2 LSM values are deviations from the reference levels. Reference levels of the variables correspond to the probability of recovery or culling for each variable. 3 Recovery was set as decreased level of SCC on all three monthly test days or on the second and third test days to <250 × 103 cells/mL. 4 Cows that left the herd up to 90 days after first SCC elevation.
Table 5.
Number and percentage of culled cows for 90 days from first somatic cell count (SCC) elevation, cause and distribution of time of culling for SCC-cutoff level ≥1000 × 103 cells/mL (CL5), separately for non-treated (NT) and antibiotic-treated (AB) cows.
Table 5.
Number and percentage of culled cows for 90 days from first somatic cell count (SCC) elevation, cause and distribution of time of culling for SCC-cutoff level ≥1000 × 103 cells/mL (CL5), separately for non-treated (NT) and antibiotic-treated (AB) cows.
| Treatment | Time of Culling 1 (Days) | ||||
|---|---|---|---|---|---|
| NT | AB | NT | AB | ||
| Cows | 22,032 | 19,704 | 2328 | ||
| culled (by owner) | Total | 2018 (10.2%) | 419 (18.0%) | ||
| Reproduction | 107 (5.3%) | 13 (3.1%) | 47 | 54 | |
| Mastitis | 1229 (61.0%) | 259 (61.8%) | 47 | 49 | |
| Other | 682 (33.8%) | 147 (35.1%) | 45 | 39 | |
1 Average days from treatment to culling.
Publisher’s Note: MDPI stays neutral with regard to jurisdictional claims in published maps and institutional affiliations. |
© 2021 by the authors. Licensee MDPI, Basel, Switzerland. This article is an open access article distributed under the terms and conditions of the Creative Commons Attribution (CC BY) license (https://creativecommons.org/licenses/by/4.0/).
Share and Cite
MDPI and ACS Style
Lavon, Y.; Gilad, D.; Leitner, G. Recovery Rates of Treated vs. Non-Treated Dairy Cows with Subclinical Mastitis. Dairy 2021, 2, 576-584. https://doi.org/10.3390/dairy2040045
AMA Style
Lavon Y, Gilad D, Leitner G. Recovery Rates of Treated vs. Non-Treated Dairy Cows with Subclinical Mastitis. Dairy. 2021; 2(4):576-584. https://doi.org/10.3390/dairy2040045
Chicago/Turabian StyleLavon, Yaniv, Dan Gilad, and Gabriel Leitner. 2021. "Recovery Rates of Treated vs. Non-Treated Dairy Cows with Subclinical Mastitis" Dairy 2, no. 4: 576-584. https://doi.org/10.3390/dairy2040045