Dairy Cow Health and Greenhouse Gas Emission Intensity


Institute of Animal Nutrition, Friedrich-Loeffler-Institut (FLI), Federal Research Institute for Animal Health, Bundesallee 37, 38116 Braunschweig, Germany
*
Author to whom correspondence should be addressed.
Dairy 2020, 1(1), 20-29; https://doi.org/10.3390/dairy1010003
Submission received: 16 December 2019
/
Revised: 2 March 2020
/
Accepted: 12 March 2020
/
Published: 23 March 2020
Abstract
:The purpose of this review is to identify the main influencing factors related to dairy cow health as it impacts the intensity of greenhouse gas emissions considering known data presented in the literature. For this study, we define the emission intensity as CO2 equivalents per kilogram of milk. In dairy cows, a high dry matter (DM) intake (25 kg/d) leads to an higher absolute methane emission compared to a lower DM intake (10 kg/d). However, the emission intensity is decreased at a high performance level. The emissions caused by DM intake to cover the energy requirement for maintenance are distributed over a higher milk yield. Therefore, the emission intensity per kilogram of product is decreased for high-yielding animals with a high DM intake. Apart from that, animal diseases as well as poor environmental or nutritional conditions are responsible for a decreased DM intake and a compromised performance. As a result, animal diseases not only mean reduced productivity, but also increased emission intensity. The productive life-span of a dairy cow is closely related to animal health, and the impact on emission intensity is enormous. A model calculation shows that cows with five to eight lactations could have a reduced emission intensity of up to 40% compared to animals that have left the herd after their first lactation. This supports the general efforts to increase longevity of dairy cows by an improved health management including all measures to prevent diseases.
1. Background
The world population is projected to reach between 9 and 10 billion people in 2050. Further trade globalization, increased urbanization, and expected growth in global affluence will lead to a substantial increase in the consumption of foods of animal origin such as meat, dairy products, eggs, and fish [1,2,3]. According to the Committee on Considerations for the Future of Animal Science Research [4], the following three assumptions characterize the basic requirements for future developing conditions:
- Global consumption of animal protein will continue to increase because of population growth and taking into account per capita consumption of animal protein in many countries.
- Restricted resources (e.g., water, land, energy, capital) and environmental changes, including climate change, will drive complex agricultural decisions with impacts on research needs.
- Current and foreseeable rapid advances in basic biological sciences provide an unparalleled opportunity to maximize the yield of investments in animal science research and development.
Food, and especially protein of animal origin can be considered the main objective of animal husbandry, apart from other performances (power, fertilizer, skins, bones, sport, entertainment, etc.). On the one side, products of animal origin contribute substantially to meet human requirements of amino acids, minerals, and vitamins [5,6,7,8,9], and they have an important enjoyment value. For a better comparison of animal yields, Table 1 shows the yields of edible protein depending on animal species/production categories and performance of animals.
On the other side, animal production also needs to use some limited resources, such as arable land, water, and energy. It also causes emissions such as greenhouse gases (GHGs; e.g., carbon dioxide, CO2; methane, CH4; nitrous oxide, N2O), as well as nitrogen leaching and phosphorous losses with potential freshwater environmental impacts. At the Mauna Loa Observatory in Hawaii, for example, CO2 levels in the atmosphere increased from about 284 mg/kg in 1832 to 410 ppm in January 2019 [11]. A further increase is expected depending on how countries implement targets for the reduction of their greenhouse gas emissions, and consequently, the global mean temperature will probably be between 2 and 5 °C warmer at the end of the present century [12], with some further negative impacts. These are the reasons to look for all conceivable possibilities to reduce those GHG emissions that are of anthropogenic origin.
High consumption of food from ruminants and high meat consumption in general are in the focus of public criticism because of the resource inputs they require and the high emissions they produce [13,14,15,16]. Both are considered major drivers of greenhouse gas emissions from agriculture [16].
Food competition between humans and animals may also be considered a main challenge for both human and animal nutrition. Therefore, a reduction of the amount of human-edible feed in animal diets is also a key factor in view of more sustainable animal feeding systems [17,18,19]. The efficient and sustainable production of edible protein from ruminants means a low input of feed or rather limited non-renewable resources, such as fuel from fossil sources, water, arable land, and some minerals (such as P) in combination with low emissions [20].
Carbon footprints (CFs) per unit product are frequently calculated to evaluate the GHG loadings of various products considering the global warming potential of different GHGs (CO2: 1; CH4: about 23; N2O: about 296; [21]). In recent years, many papers were published and reviewed investigating the influence of animal species or category, different protein sources, as well as animal yields and other factors on the inputs of limited resources and emissions [16,22,23,24]. The authors agree that animal species or category, animal performance, and some other factors may influence the emissions per animal and day, per kilogram of product, or per kilogram of edible protein (Table 2). However, the studies did not pay much attention to the interaction between animal diseases and GHG emissions [25,26].
It is well known that large amounts of CH4 are produced in the digestive tract of ruminants, and that methane is a highly effective greenhouse gas. However, by and large, also in more recent papers no attention has been paid to consider animal health, animal diseases, or animal losses with regard to a more efficient production of food of animal origin [27,28]. Hristov [29] was one of the first authors who considered animal health and mortality important factors concerning productivity of animals and their implications on GHG emissions. Grace et al. [30] estimated that livestock diseases reduced productivity globally by 25%. Animal health can also be considered a very important topic for a more efficient conversion of feed into food of animal origin and low GHG emissions per product [31]. In order to be able to compare the emission intensity (GHG emitted per kilogram of product) between the animal species, the emission intensity should be described as CO2eq per kg of edible protein (Table 2). The high ranges of CF (Table 2) rest on many uncertainties, including diseases and mortality. Furthermore, different authors also use different measurements and methods.
The ruminants´ values per kilogram of body protein are much higher and mirror a higher range compared to milk protein and proteins from eggs and bodies of non-ruminants.
Low animal yields, poor fertility, and high animal losses cause livestock producers to manage more animals and keep more replacement animals to ensure the herd size is maintained. Consequently, the intensity of greenhouse gas emissions from livestock farming can be reduced through higher efficiency and production gains resulting from improved livestock health, reduced mortality, and, regarding cows, longevity.
Presently, two research streams concerning GHG emissions and animal health can be observed:
The objective of the present paper is to describe issues related to the first question. We wish to demonstrate the influence of animal diseases on the yields of lactating cows and on GHG emissions intensity (CO2eq per kg milk). Similar interactions were examined by the Global Research Alliance on Agricultural Greenhouse Gases [39].
2. Importance of Feed Intake in Conjunction with Animal Health
A high feed and energy intake is the most important prerequisite for a more efficient conversion of feed into food of animal origin, and therefore leads to high animal yields. Increased feed intake may contribute to a greater energy and nutrient intake and may improve the ratio between energy available for performance (animal yield) and maintenance, as demonstrated for dairy cows in Table 3.
Concerning dairy cows, the portion of energy that is “inefficiently“ used for maintenance decreased for cows which consumed 10 kg dry matter (DM)/day from about 54% to about 20% of their total energy intake when the cows consumed more than 25 kg DM (see Table 3). Furthermore, the CH4 emission per animal and day increased, but the emission per kilogram of milk decreased (Table 3). These changes are accompanied by changes in ration composition (increase in concentrate proportion); furthermore, high-yielding cows probably also have a higher risk for more metabolic diseases—especially during the transition period (e.g., ketosis and ruminal acidosis [42,43]). Not only high yields and feed intake play a role in the development of ketosis. High body condition scores for management reasons are a key driver for the development of that disease [44]. Humer et al. [45] described in their review that the ration formulation for high-yielding dairy cows was often characterized by high concentrate levels in the diet in order to meet the energy needs of milk production. The result is a high provision of easily fermentable carbohydrates in the rumen. These circumstances may lead to the development of subacute rumen acidosis (SARA) when they are accompanied by an insufficient supply of physically effective fiber. Inadequate adaptation during ration changes, especially in the transition period when dramatic changes in DM intake (DMI) occur, further promote acidotic conditions in the rumen. Consequences of the development of SARA can include laminitis, parakeratosis of the rumen mucosa, or a reduction in milk fat content [46]. In this context, and especially with regard to the emissions per kilogram of milk, the advantages of higher feed intake and higher milk yields are questionable, as they trigger diseases and a shorter life expectancy of high-yielding cows. Therefore, nutritionally induced diseases should be considered in models to calculate the carbon footprints of dairy products.
3. Animal Yield and Emissions
Higher animal yields also result in higher emissions per animal, but in lower emissions per animal product (Table 4). Food of non-ruminant origin can be produced with lower GHG emissions, as shown in Table 4. The reasons for this are the higher CH4 emissions caused by rumen fermentation. However, rumen fermentation enables ruminants to utilize roughages and by-products from agriculture (grain straw, etc.) and from the food industry (sugar beet pulp, etc.), which do not compete with nutritional supply for humans [47,48]. In a study by Zehetmeier et al. [49], GHG emissions from dairy cows were evaluated as a function of performance levels (6000, 8000, and 10,000 kilograms milk yield per cow per year) and interaction with beef production. This is necessary because at a higher milk production level there is a different output concerning beef, more precisely of culled cows and male calves. The data from the mentioned study show that GHG emissions per kg milk fall with an increase in milk yield from 6000 kg (1.06 kg CO2eq/kg milk) to 10,000 kg (0.89 kg CO2eq/kg milk). However, due to the reduced output of beef, viz. of male calves and culled cows from milk production, emissions per kilogram of produced beef will increase from 10.75 kg CO2eq to 16.24 kg CO2eq as more beef must be produced from suckler cow husbandry if beef consumption remains constant. Therefore, this consideration of systemic limits when assessing animal performance and GHG emissions should not be underestimated, and further studies are needed to better evaluate the impact of increased animal performance on GHG emissions.
4. Influence of Productive Life and Fertility on the CF of Lactating Cows
Animal fertility may also influence the GHG emissions from animal production systems [29]. Animal nutritionists have to find the balance between feed/energy intake and animal health. As an example, we assume a simple model for cows considering 27 months (820 days; daily body weight gain: 750 g) as the first calving age, lactation periods of 1, 2, 3, 5, or 8 years, and estimated early selections due to animal diseases. Emission data including the cows´ rearing period were calculated and are expressed as CF per cow and per kg milk in Table 5.
The total emissions per cow including their calf and heifer period increase with lactation numbers, but they decrease per kilogram of milk in consideration of the rearing period and the longer productive life of cows (Table 5). The decrease is dramatic up to the third lactation; more lactations also have an influence on the CF, but to a much lower extent than the first lactations. It can be concluded that animal losses may increase the CF per kg of milk. Animal breeding [50,51] and nutrition [29,31] may both influence animal health and may reduce the CF per kg milk or per kg edible protein. Poor fertility increases GHG emissions, as shown by some authors [45,51,52,53,54]. Garnsworthy [55] concluded that improvements in the fertility of cows could reduce CH4 emissions by 24%, primarily by reducing the number of replacements in the herd because of the longer productive life of the individual cow.
5. Dairy Cow Diseases and GHG Emissions
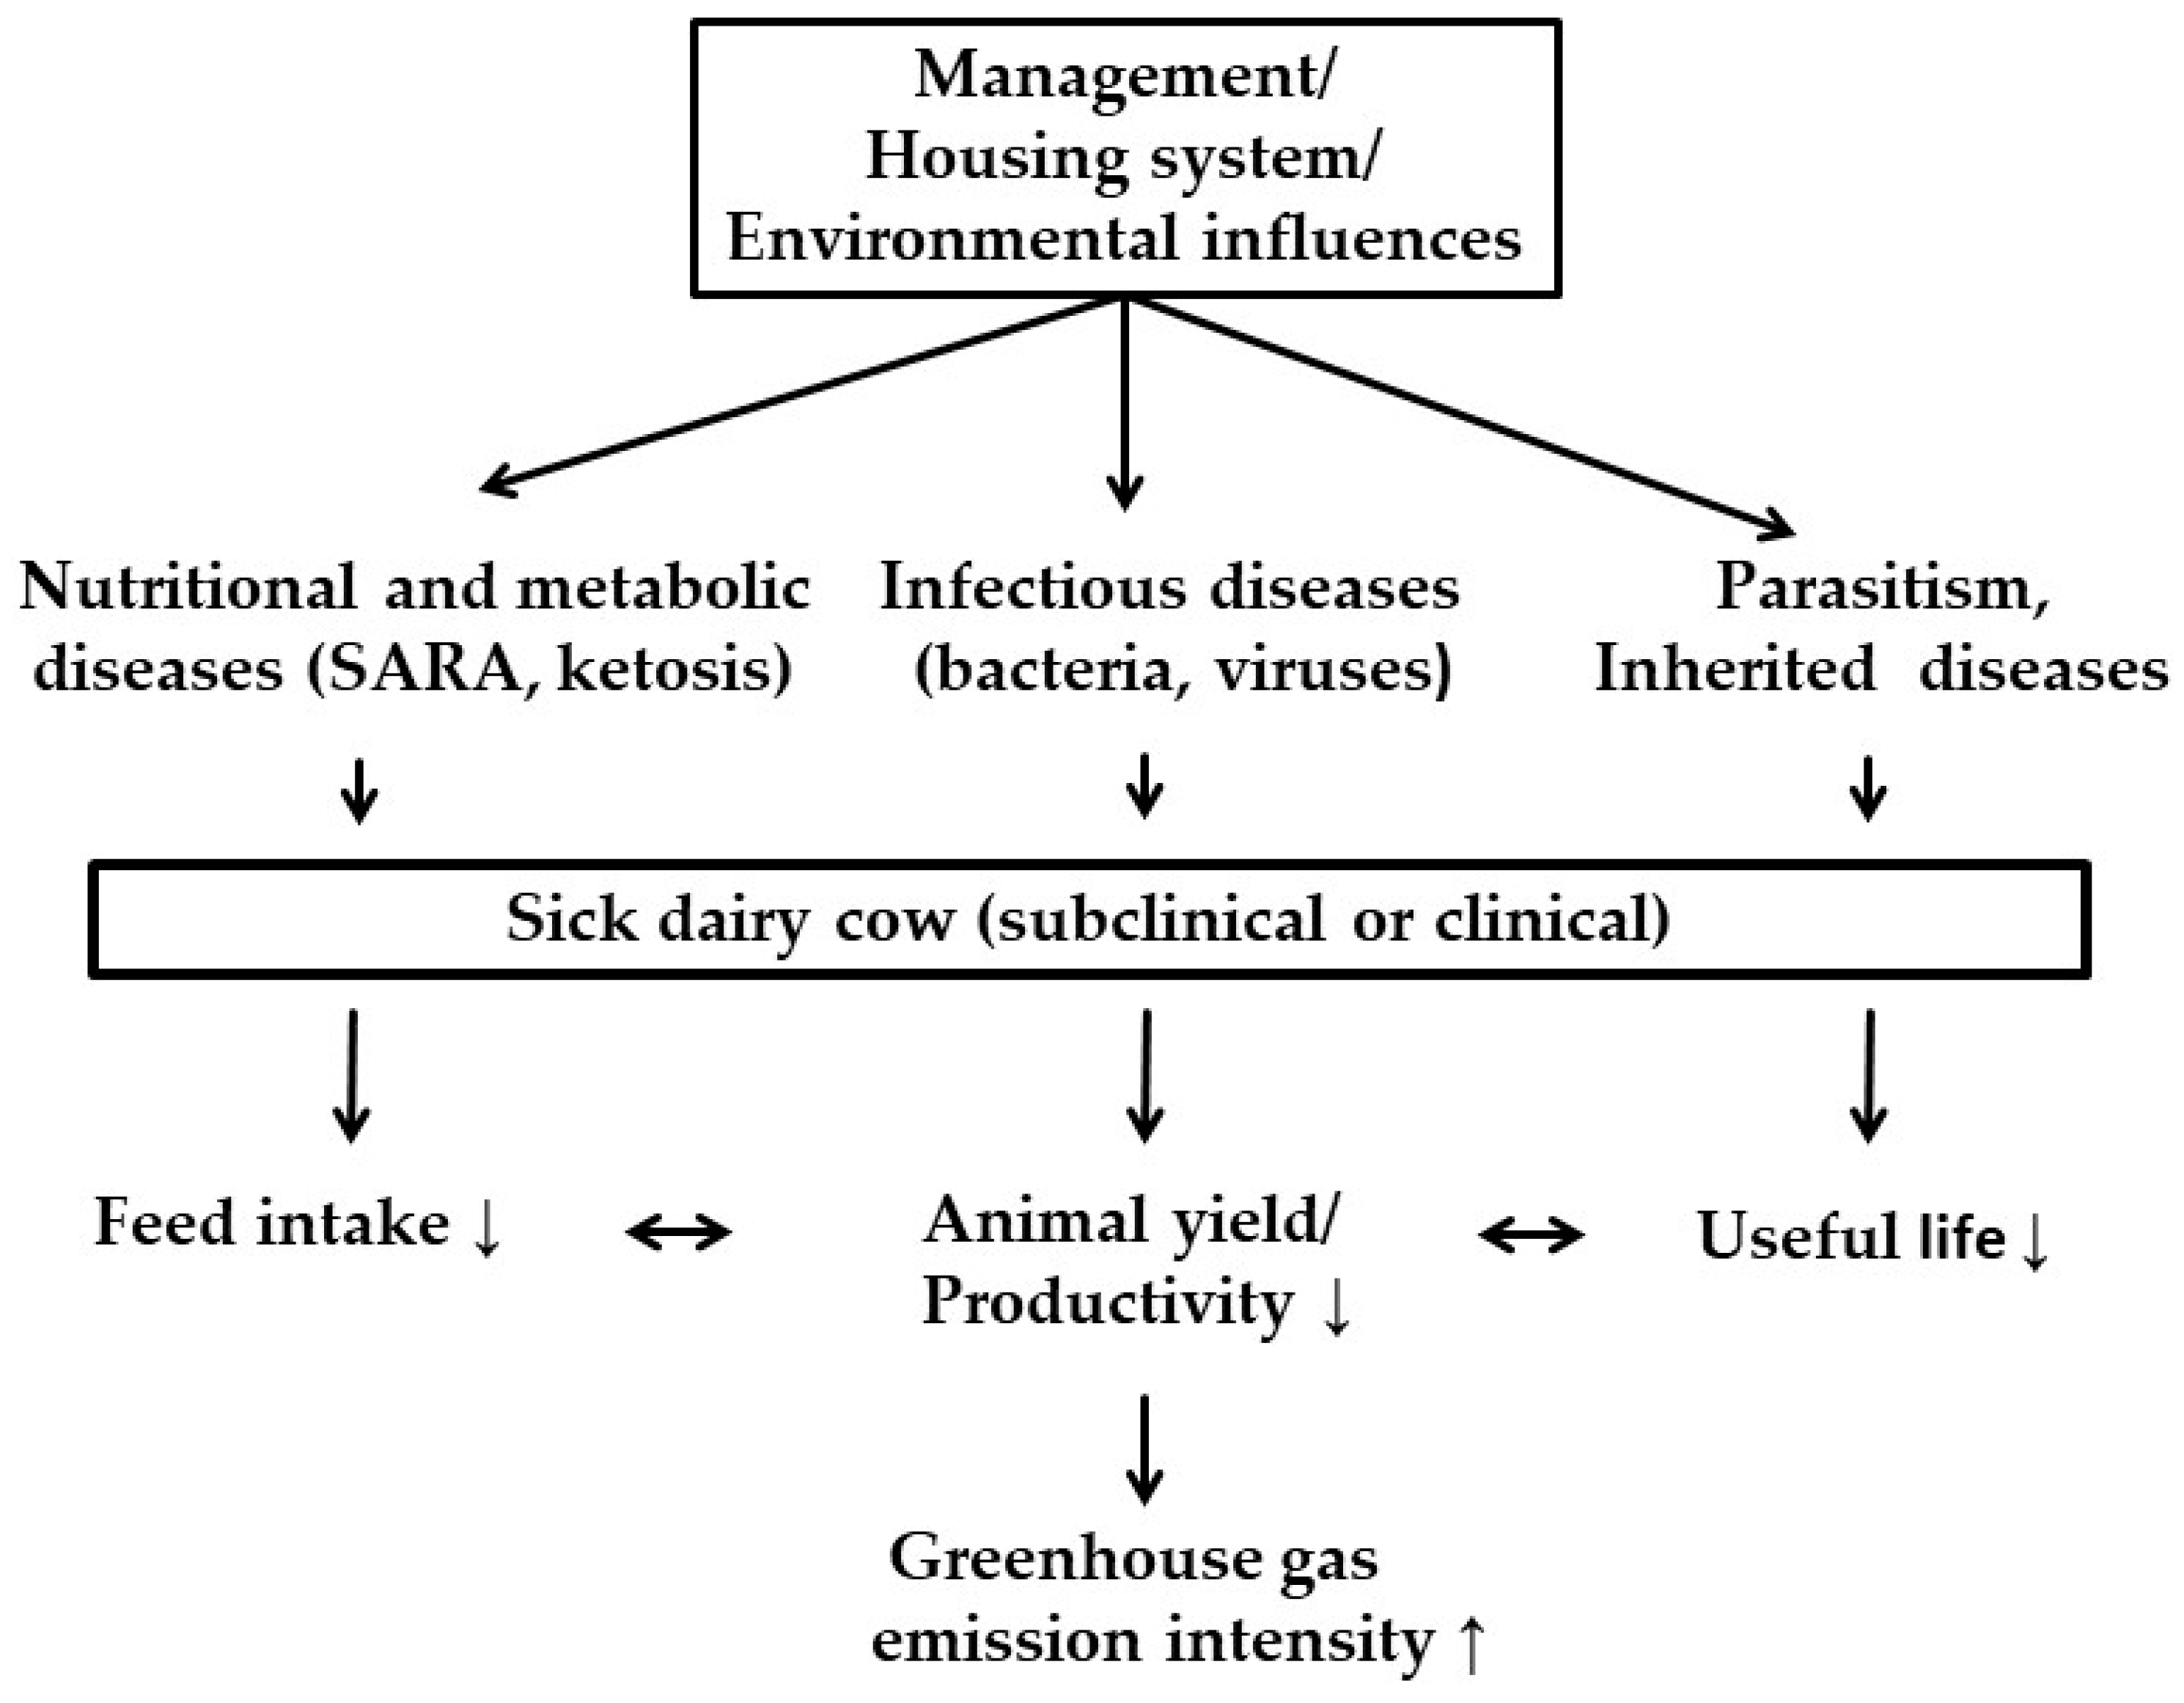
There are only a few other studies whose authors examined the effects of dairy cow health and their implications on GHG emissions. Figure 1 provides a summarized overview of the influencing factors concerning the emission intensity of dairy cows that are addressed in this review.
More than 75% of dairy cow diseases in the US occur within the first month of calving [56]. Dechow and Goodling [57] found that in Pennsylvania 26.2% of all culls of dairy cows occur from day 21 before until day 60 after calving. Metabolic disorders around the calving period seem to be a very important topic for cow losses, low productivity, and high GHG emissions per kilogram of milk (see Table 5). Dänicke et al. [58] described in a review the connection between negative energy balance in early lactation and the immune system as well as the resulting consequences for the health of the dairy cow. A consequence of the situation of the negative energy balance during early lactation could be subclinical ketosis. A recent study by Mostert et al. [59] showed the impact of subclinical ketosis on GHG emissions. The authors concluded from their calculations an increase of the emissions by 7.9 kg CO2eq per ton of fat- and protein-corrected milk. A similar connection between foot lesions in dairy cows and GHG emissions is described by Mostert et al. [60].
Mastitis can be a consequence of this connection; therefore, Özkan et al. [61] analyzed healthy and diseased cows (subclinical mastitis; high somatic cell count) and found a 2% higher GHG emission per kilogram of milk for diseased cows (increase from 3.05 to 3.12 kg CO2eq per kg milk). In a second study under production conditions in Norway, Özkan et al. [62] also showed the potential to reduce GHG emission intensity by 3.7% after a reduced somatic cell count from 800,000 cells/mL to 50,000 cells/mL.
In a study under conditions of the sub-Sahara region by Salomon et al. [63] it could be shown that the vaccination of dairy cows against lumpy skin disease or foot-and-mouth disease can be a very efficient and cost-effective method to reduce the emission intensity. In a recent study by Houdijk et al. [64] parasitism of rearing ewes (10,000 infective larvae of Teladorsagia circumcincta per animal) increased the calculated GHG intensity per kilogram of lamb weight gain for enteric methane by 11%, for manure methane by 32%, and for nitrous oxide by 30%. On average, parasitism increased the calculated global warming potential per kilogram of lamb weight gain by 16%. This is one of few studies with clear dose–response effects. More of this type of study should also be performed with dairy cows. For example, in dairy cows paratuberculosis is a latent problem worldwide. In a recent study by McAloon et al. [65] it was shown that positively tested dairy cows can have a milk yield that is reduced by 5.9%. Data on the emission intensity are not available, but it can be assumed that the nutrients would then no longer be adequately utilized and thus an effect on the emission intensity can be expected. Some more details of the interaction between animal health and GHG emissions are discussed by Hristov et al. [29].
6. Conclusions
To our knowledge, little or no attention has been spent on the effects of diminished yields and animal losses on GHG emission intensity with regard to health problems in dairy cows. In the case of illness in a dairy cow (clinical or subclinical), feed intake and milk yield are usually reduced. For this reason, GHG emissions then increase per kilogram of product. An extended productive life is desirable to achieve a reduction in emission intensity. It remains difficult to consider animal losses in terms of GHG emissions. Apart from the dead animal, we also have to consider the GHG emissions for the production of feed the dead animal had consumed during its life. More data that consider animal health up to animal losses seem to be necessary for a better quantification of GHG emission intensity.
Author Contributions
The idea for the manuscript was developed by G.F. He was the principal organizer of the work and conceptualized the manuscript. D.v.S., U.M., and S.D. contributed to the paper. All authors have read and agreed to the published version of the manuscript.
Funding
This research received no external funding.
Conflicts of Interest
The authors declare no conflicts of interest.
References
- Mottet, A.; de Haan, C.; Falcucci, A.; Tempio, G.; Opio, C.; Gerber, P. Livestock: On our plates or eating at our table? A new analysis of the feed/food debate. Glob. Food Secur. 2017, 14, 1–8. [Google Scholar] [CrossRef]
- Keyzer, M.A.; Merbis, M.D.; Pavel, I.F.P.W.; van Wesenbeeck, C.F.A. Diet shifts towards meat and the effects on cereal use: Can we feed the animals in 2030? Ecol. Econ. 2005, 55, 187–202. [Google Scholar] [CrossRef]
- Flachowsky, G.; Brade, W. Reduction potentials for methane emissions from ruminants. Züchtungskunde 2007, 79, 417–465. [Google Scholar]
- National Research Council of the National Academies (NRC). Critical Role of Animal Science Research in Food Security and Sustainability; The National Academies Press: Washington, DC, USA, 2015; p. 436. [Google Scholar]
- Souci, S.W.; Fachmann, W.; Kraut, H. Food Composition and Nutrition Tables, 8th ed.; Wissenschaftliche Verlagsgesellschaft: Stuttgart, Germany, 2016. [Google Scholar]
- Wennemer, H.; Flachowsky, G.; Hoffmann, V. Protein, Population, Politics—How Protein Can Be Supplied Sustainable in the 21st Century; Plexus Verlag: Milttenberg, Switzerland; Frankfurt/Main, Germany, 2006. [Google Scholar]
- Food and Agriculture Organization of the United Nations (FAO); World Health Organization (WHO) United Nations University (UNU). Protein and Amino Acid Requirements in Human Nutrition: Report of A Joint FAO/WHO/UNU Expert Consultation; World Health Organization: Geneva, Switzerland, 2007. [Google Scholar]
- Pillai, R.R.; Kurpad, A.V. Amino acid requirements: Quantitative estimates. In Amino Acids in Human Nutrition and Health; D’Mello, J.P.F., Ed.; CAB International: Wallingford, UK, 2011; pp. 267–290. [Google Scholar]
- Food and Agriculture Organisation of the United Nations (FAO). Improving Diets and Nutrition: Food-Based Approaches; Thompson, B., Amoroso, L., Eds.; CAB International and FAO: Rome, Italy, 2014. [Google Scholar]
- Flachowsky, G.; Kamphues, J. Carbon footprints for food of animal origin: What are the most preferable criteria to measure animal yields? Animals 2012, 2, 108–126. [Google Scholar] [CrossRef] [Green Version]
- Earth System Research Laboratory. Global Greenhouse Gas Reference Network: Trends in Atmospheric Carbon Dioxide. Available online: http://www.esrl.noaa.gov/gmd/ccgg/trends/?utm_source=www.uoota.com (accessed on 22 February 2019).
- Du Pont, Y.R.; Meinshausen, M. Warming assessment of the bottom-up paris agreement emissions pledges. Nat. Commun. 2018, 9, 4810. [Google Scholar] [CrossRef] [Green Version]
- Deckers, J. Should the consumption of farmed animal products be restricted, and if so, by how much? Food Policy 2010, 35, 497–503. [Google Scholar] [CrossRef]
- Godfray, H.C.; Beddington, J.R.; Crute, I.R.; Haddad, L.; Lawrence, D.; Muir, J.F.; Pretty, J.; Robinson, S.; Thomas, S.M.; Toulmin, C. Food security: The challenge of feeding 9 billion people. Science 2010, 327, 812–818. [Google Scholar] [CrossRef] [Green Version]
- Westhoek, H.; Lesschen, J.P.; Rood, T.; Wagner, S.; De Marco, A.; Murphy-Bokern, D.; Leip, A.; van Grinsven, H.; Sutton, M.A.; Oenema, O. Food choices, health and environment: Effects of cutting europe’s meat and dairy intake. Glob. Environ. Chang. Hum. Policy Dimens. 2014, 26, 196–205. [Google Scholar] [CrossRef] [Green Version]
- Food and Agriculture Organization of the United Nations (FAO). The Future of Food and Agriculture: Trends and Challenges; FAO: Rome, Italy, 2017. [Google Scholar]
- Eisler, M.C.; Lee, M.R.; Tarlton, J.F.; Martin, G.B.; Beddington, J.; Dungait, J.A.; Greathead, H.; Liu, J.; Mathew, S.; Miller, H.; et al. Agriculture: Steps to sustainable livestock. Nature 2014, 507, 32–34. [Google Scholar] [CrossRef] [Green Version]
- Schader, C.; Muller, A.; Scialabba Nel, H.; Hecht, J.; Isensee, A.; Erb, K.H.; Smith, P.; Makkar, H.P.; Klocke, P.; Leiber, F.; et al. Impacts of feeding less food-competing feedstuffs to livestock on global food system sustainability. J. R. Soc. Interface 2015, 12, 20150891. [Google Scholar] [CrossRef] [Green Version]
- Ertl, P.; Steinwidder, A.; Schönauer, M.; Krimberger, K.; Knaus, W.; Zollitsch, W. Net food production of different livestock: A national analysis for austria including relative occupation of different land categories. J. Land Manag. Food Environ. 2016, 67, 91. [Google Scholar]
- Flachowsky, G.; Meyer, U.; Südekum, K.H. Land use for edible protein of animal origin—A review. Animals 2017, 7, 25. [Google Scholar] [CrossRef] [PubMed]
- IPCC (Intergovernmental Panel on Climate Change). Guidelines for national greenhouse gas inventories; agriculture, forestry and other land use. In The National Greenhouse Gas Inventories Programme; Institute for Global Environmental Strategies (IGES): Hayama, Japan, 2006. [Google Scholar]
- Flachowsky, G. Carbon footprints of food of animal origin. In Livestock Production and Climate Change; Malik, P.K., Bhatta, R., Takahashi, J., Kohn, R.A., Prasad, C.S., Eds.; CAB International: Wallingford, UK, 2015; pp. 125–145. [Google Scholar]
- Gerber, P.J.; Steinfeld, H.; Henderson, B.; Mottet, A.; Opio, C.; Dijkman, J.; Falcucci, A.; Tempio, G. Tackling Climate Change through Livestock—A Global Assessment of Emissions and Mitigation Opportunities; Food and Agriculture Organization of the United Nations (FAO): Rome, Italy, 2013. [Google Scholar]
- Vigne, M.; Blanfort, V.; Vayssières, J.; Lecomte, P.; Steinmetz, P. Livestock farming constraints in developing countries—From adaptation to mitigation in ruminant production systems. In Climate Change and Agriculture Worldwide; Torquebiau, E., Ed.; Springer: Dordrecht, The Netherlands, 2016; pp. 127–141. [Google Scholar]
- Foley, J.A.; Ramankutty, N.; Brauman, K.A.; Cassidy, E.S.; Gerber, J.S.; Johnston, M.; Mueller, N.D.; O’Connell, C.; Ray, D.K.; West, P.C.; et al. Solutions for a cultivated planet. Nature 2011, 478, 337–342. [Google Scholar] [CrossRef] [Green Version]
- Powell, J.M.; MacLeod, M.; Vellinga, T.V.; Opio, C.; Falcucci, A.; Tempio, G.; Steinfeld, H.; Gerber, P. Feed-milk-manure nitrogen relationships in global dairy production systems. Livest. Sci. 2013, 152, 261–272. [Google Scholar] [CrossRef]
- Caro, D.; Kebreab, E.; Mitloehner, F.M. Mitigation of enteric methane emissions from global livestock systems through nutrition strategies. Clim. Chang. 2016, 137, 467–480. [Google Scholar] [CrossRef] [Green Version]
- Pandey, A.K.; Das, N.; Muthu, K.A.; Rao, S. Methanogens in the environment: An insight of methane yield and impact on global climate change. Int. Lett. Nat. Sci. 2015, 37, 51–60. [Google Scholar] [CrossRef] [Green Version]
- Hristov, A.N.; Ott, T.; Tricarico, J.; Rotz, A.; Waghorn, G.; Adesogan, A.; Dijkstra, J.; Montes, F.; Oh, J.; Kebreab, E.; et al. Special topics—Mitigation of methane and nitrous oxide emissions from animal operations: Iii. A review of animal management mitigation options. J. Anim. Sci. 2013, 91, 5095–5113. [Google Scholar] [CrossRef] [Green Version]
- Grace, D.; Bett, B.; Lindahl, J.; Robinson, T. Climate and Livestock Disease: Assessing the Vulnerability of Agricultural Systems to Livestock Pests under Climate Change Scenarios; CCAFS Working Paper; CGSpace: Copenhagen, Denmark, 2015; p. 29. [Google Scholar]
- Niemann, H.; Kuhla, B.; Flachowsky, G. Perspectives for feed-efficient animal production. J. Anim. Sci. 2011, 89, 4344–4363. [Google Scholar] [CrossRef]
- Nijdam, D.; Rood, T.; Westhoek, H. The price of protein: Review of land use and carbon footprints from life cycle assessments of animal food products and their substitutes. Food Policy 2012, 37, 760–770. [Google Scholar] [CrossRef]
- Carabano, M.J.; Logar, B.; Bormann, J.; Minet, J.; Vanrobays, M.L.; Diaz, C.; Tychon, B.; Gengler, N.; Hammami, H. Modeling heat stress under different environmental conditions. J. Dairy Sci. 2016, 99, 3798–3814. [Google Scholar] [CrossRef] [Green Version]
- Dahl, G.E.; Tao, S.; Monteiro, A.P.A. Effects of late-gestation heat stress on immunity and performance of calves. J. Dairy Sci. 2016, 99, 3193–3198. [Google Scholar] [CrossRef] [PubMed]
- Özkan, Ş.; Vitali, A.; Lacetera, N.; Amon, B.; Bannink, A.; Bartley, D.J.; Blanco-Penedo, I.; de Haas, Y.; Dufrasne, I.; Elliott, J.; et al. Challenges and priorities for modelling livestock health and pathogens in the context of climate change. Environ. Res. 2016, 151, 130–144. [Google Scholar] [CrossRef] [PubMed]
- Perano, K.M.; Usack, J.G.; Angenent, L.T.; Gebremedhin, K.G. Production and physiological responses of heat-stressed lactating dairy cattle to conductive cooling. J. Dairy Sci. 2015, 98, 5252–5261. [Google Scholar] [CrossRef] [Green Version]
- Polsky, L.; von Keyserlingk, M.A.G. Invited review: Effects of heat stress on dairy cattle welfare. J. Dairy Sci. 2017, 100, 8645–8657. [Google Scholar] [CrossRef] [Green Version]
- McIntyre, K.M.; Setzkorn, C.; Hepworth, P.J.; Morand, S.; Morse, A.P.; Baylis, M. Systematic assessment of the climate sensitivity of important human and domestic animals pathogens in europe. Sci. Rep. 2017, 7, 7134. [Google Scholar] [CrossRef] [PubMed] [Green Version]
- Global Research Alliance on Argriculture Greenhouse Gases (GRA). Animal Health and Greenhouse Gas Emission Intensity Network. Summary of Workshops 2013–2016. Available online: http://globalresearchalliance.org/wp-content/uploads/2017/05/Animal-Health-Summary-of-Workshops-2013-2016.pdf (accessed on 24 January 2019).
- GfE (Gesellschaft für Ernährungsphysiologie). Recommendations for Energy and Nutrient Requirements of Dairy Cattle and Heifers; DLG Verlag: Frankfurt am Main, Germany, 2001. [Google Scholar]
- Dämmgen, U.; Haenel, H.D. Emissions of greenhouse gases and gaseous air pollutants—A challenge for animal nutrition. In Proceedings of the Society of Nutrition Physiology, Göttingen, Germany, 1–4 April 2008; pp. 163–167. [Google Scholar]
- Herdt, T.H. Ruminant adaptation to negative energy balance: Influences on the etiology of ketosis and fatty liver. Vet. Clin. N. Am. Food Anim. Pract. 2000, 16, 215–230. [Google Scholar] [CrossRef]
- Kleen, J.L.; Cannizzo, C. Incidence, prevalence and impact of sara in dairy herds. Anim. Feed Sci. Technol. 2012, 172, 4–8. [Google Scholar] [CrossRef]
- Vanholder, T.; Papen, J.; Bemers, R.; Vertenten, G.; Berge, A.C. Risk factors for subclinical and clinical ketosis and association with production parameters in dairy cows in the netherlands. J. Dairy Sci. 2015, 98, 880–888. [Google Scholar] [CrossRef] [Green Version]
- Humer, E.; Petri, R.M.; Aschenbach, J.R.; Bradford, B.J.; Penner, G.B.; Tafaj, M.; Südekum, K.H.; Zebeli, Q. Invited review: Practical feeding management recommendations to mitigate the risk of subacute ruminal acidosis in dairy cattle. J. Dairy Sci. 2018, 101, 872–888. [Google Scholar] [CrossRef] [Green Version]
- Kleen, J.L.; Hooijer, G.A.; Rehage, J.; Noordhuizen, J.P. Subacute ruminal acidosis (sara): A review. J. Vet. Med. A Physiol. Pathol. Clin. Med. 2003, 50, 406–414. [Google Scholar] [CrossRef] [PubMed]
- Ertl, P.; Zebeli, Q.; Zollitsch, W.; Knaus, W. Feeding of by-products completely replaced cereals and pulses in dairy cows and enhanced edible feed conversion ratio. J. Dairy Sci. 2015, 98, 1225–1233. [Google Scholar] [CrossRef] [PubMed] [Green Version]
- Ertl, P.; Klocker, H.; Hortenhuber, S.; Knaus, W.; Zollitsch, W. The net contribution of dairy production to human food supply: The case of austrian dairy farms. Agric. Syst. 2015, 137, 119–125. [Google Scholar] [CrossRef]
- Zehetmeier, M.; Baudracco, J.; Hoffmann, H.; Heissenhuber, A. Does increasing milk yield per cow reduce greenhouse gas emissions? A system approach. Animal 2012, 6, 154–166. [Google Scholar] [CrossRef] [PubMed] [Green Version]
- Brade, W. Feed intake and efficiency of dairy cows: Opportunities and risks from the perspective of breeding and animal health. Tieraerztliche Umschau 2015, 70, 60. [Google Scholar]
- O’Brien, D.; Shalloo, L.; Grainger, C.; Buckley, F.; Horan, B.; Wallace, M. The influence of strain of holstein-friesian cow and feeding system on greenhouse gas emissions from pastoral dairy farms. J. Dairy Sci. 2010, 93, 3390–3402. [Google Scholar] [CrossRef] [PubMed] [Green Version]
- Bell, M.J.; Wall, E.; Russell, G.; Simm, G.; Stott, A.W. The effect of improving cow productivity, fertility, and longevity on the global warming potential of dairy systems. J. Dairy Sci. 2011, 94, 3662–3678. [Google Scholar] [CrossRef]
- Crosson, P.; Shalloo, L.; O’Brien, D.; Lanigan, G.J.; Foley, P.A.; Boland, T.M.; Kenny, D.A. A review of whole farm systems models of greenhouse gas emissions from beef and dairy cattle production systems. Anim. Feed Sci. Technol. 2011, 166–167, 29–45. [Google Scholar] [CrossRef]
- Wall, E.; Simm, G.; Moran, D. Developing breeding schemes to assist mitigation of greenhouse gas emissions. Animal 2010, 4, 366–376. [Google Scholar] [CrossRef] [Green Version]
- Garnsworthy, P.C. The environmental impact of fertility in dairy cows: A modelling approach to predict methane and ammonia emissions. Anim. Feed Sci. Technol. 2004, 112, 211–223. [Google Scholar] [CrossRef]
- LeBlanc, S.J.; Lissemore, K.D.; Kelton, D.F.; Duffield, T.F.; Leslie, K.E. Major advances in disease prevention in dairy cattle. J. Dairy Sci. 2006, 89, 1267–1279. [Google Scholar] [CrossRef] [Green Version]
- Dechow, C.D.; Goodling, R.C. Mortality, culling by sixty days in milk, and production profiles in high- and low-survival pennsylvania herds. J. Dairy Sci. 2008, 91, 4630–4639. [Google Scholar] [CrossRef] [PubMed]
- Dänicke, S.; Meyer, U.; Kersten, S.; Frahm, J. Animal models to study the impact of nutrition on the immune system of the transition cow. Res. Vet. Sci. 2018, 116, 15–27. [Google Scholar] [CrossRef]
- Mostert, P.F.; van Middelaar, C.E.; Bokkers, E.A.M.; de Boer, I.J.M. The impact of subclinical ketosis in dairy cows on greenhouse gas emissions of milk production. J. Clean. Prod. 2018, 171, 773–782. [Google Scholar] [CrossRef]
- Mostert, P.F.; van Middelaar, C.E.; de Boer, I.J.M.; Bokkers, E.A.M. The impact of foot lesions in dairy cows on greenhouse gas emissions of milk production. Agric. Syst. 2018, 167, 206–212. [Google Scholar] [CrossRef]
- Özkan, Ş.; Ahmadi, B.V.; Bonesmo, H.; Østerås, O.; Stott, A.; Harstad, O.M. Impact of animal health on greenhouse gas emissions. Adv. Anim. Biosci. 2015, 6, 24–25. [Google Scholar] [CrossRef]
- Özkan, Ş.; Ahmadi, B.V.; Stott, A.W. Impact of subclinical mastitis on greenhouse gas emissions intensity and profitability of dairy cows in norway. Prev. Vet. Med. 2018, 150, 19–29. [Google Scholar] [CrossRef]
- Salmon, G.R.; Marshall, K.; Tebug, S.F.; Missohou, A.; Robinson, T.P.; MacLeod, M. The greenhouse gas abatement potential of productivity improving measures applied to cattle systems in a developing region. Anim. Int. J. Anim. Biosci. 2017, 12, 844–852. [Google Scholar] [CrossRef] [Green Version]
- Houdijk, J.G.M.; Tolkamp, B.J.; Rooke, J.A.; Hutchings, M.R. Animal health and greenhouse gas intensity: The paradox of periparturient parasitism. Int. J. Parasitol. 2017, 47, 633–641. [Google Scholar] [CrossRef]
- McAloon, C.G.; Whyte, P.; More, S.J.; Green, M.J.; O’Grady, L.; Garcia, A.; Doherty, M.L. The effect of paratuberculosis on milk yield—A systematic review and meta-analysis. J. Dairy Sci. 2016, 99, 1449–1460. [Google Scholar] [CrossRef] [Green Version]
Figure 1.
Influencing factors in the context of dairy cow health on variables (feed intake, animal yield/productivity, productive life) affecting the emission intensity (g CO2 eq per kg milk) (↓ = decrease; ↑ = increase). SARA: subacute ruminal acidosis.
Figure 1.
Influencing factors in the context of dairy cow health on variables (feed intake, animal yield/productivity, productive life) affecting the emission intensity (g CO2 eq per kg milk) (↓ = decrease; ↑ = increase). SARA: subacute ruminal acidosis.


Table 1.
Effects of animal species, production categories, and performance on yields of edible protein per animal or per kilogram body weight (BW) and day [10].
Table 1.
Effects of animal species, production categories, and performance on yields of edible protein per animal or per kilogram body weight (BW) and day [10].
| Protein Source | Body Weight (kg) | Performance | Edible Fraction (% of Product or of Body Mass) | Protein in Edible Fraction (g/kg) | Edible Protein (g/d) | Edible Protein (g/kg of BW) |
|---|---|---|---|---|---|---|
| Milk (kg/d) | ||||||
| Dairy cow | 650 | 10 | 95 | 34 | 323 | 0.7 |
| 20 | 646 | 1.0 | ||||
| 40 | 1292 | 2.0 | ||||
| Dairy goat | 60 | 2 | 95 | 36 | 68 | 1.2 |
| 5 | 170 | 2.8 | ||||
| Body weight gain (g/d) | ||||||
| Beef cattle | 350 | 500 | 50 | 190 | 48 | 0.14 |
| 1000 | 95 | 0.27 | ||||
| 1500 | 143 | 0.41 | ||||
| Growing/Fattening pig | 80 | 500 | 60 | 150 | 45 | 0.56 |
| 700 | 63 | 0.8 | ||||
| 1000 | 90 | 1.1 | ||||
| Broiler chicken | 1.5 | 40 | 60 | 200 | 4.8 | 3.2 |
| 60 | 7.2 | 4.8 | ||||
| 80 | 9.6 | 6.4 | ||||
| Laying performance (%) | ||||||
| Laying hens | 1.8 | 50 | 95 | 120 | 3.4 | 1.9 |
| 70 | 4.8 | 2.7 | ||||
| 90 | 6.2 | 3.4 |
Table 2.
Ranges of the carbon footprints of food and protein of animal origin, summarized by Nijdam et al. [32].
Table 2.
Ranges of the carbon footprints of food and protein of animal origin, summarized by Nijdam et al. [32].
| Protein Source | Studies | kg CO2-eq/kg Product | kg CO2-eq/kg Protein |
|---|---|---|---|
| Cow milk | 14 | 1–2 | 28–43 |
| Beef, intensive systems | 11 | 9–42 | 45–210 |
| Meadow, suckler herds | 8 | 23–52 | 114–250 |
| Extensive pastoral systems | 4 | 12–129 | 58–643 |
| Mutton and lamb | 5 | 10–150 | 51–750 |
| Pork | 11 | 4–11 | 20–55 |
| Poultry meat | 5 | 2–6 | 10–30 |
| Eggs | 5 | 2–6 | 15–42 |
| Seafood from fisheries | 18 | 1–86 | 4–540 |
| Seafood from agriculture | 11 | 3–15 | 4–75 |
Table 3.
Model calculation to show the influence of dry matter (DM) intake (7.0 MJ of NEL/kg DM) of dairy cows (body weight: 650 kg; 4% milk fat; maintenance 37.7 MJ NEL/cow and day; [40] on energy intake, percentage of maintenance, milk yield, energy per kg of milk, as well as methane emissions and carbon footprints per kg of milk (without calf and heifer periods).
| Parameter | Dry Matter Intake (kg/d) | ||||
|---|---|---|---|---|---|
| 10 | 15 | 20 | 25 | 30 | |
| Energy intake (MJ NEL/d) | 70 | 105 | 140 | 175 | 210 |
| Energy maintenance (% of total NEL†-intake) | 53.9 | 35.9 | 26.9 | 21.5 | 18.0 |
| Theoretical milk yield (3.3 MJ NEL/kg milk) | 9.8 | 20.4 | 31.0 | 41.6 | 52.2 |
| MJ NEL/kg of milk including energy for maintenance | 7.1 | 5.1 | 4.5 | 4.2 | 4.0 |
| Protein yield (g/cow and day) | 333 | 694 | 1054 | 1414 | 1775 |
| Methane emission♦ | |||||
| (g/d) | 240 | 360 | 480 | 600 | 720 |
| (g/kg milk) | 24.5 | 17.6 | 15.5 | 14.4 | 13.8 |
| Carbon footprint (CF)§ (g of CO2eq/kg of milk) | 825 | 605 | 530 | 495 | 475 |
Table 4.
Effects of animal species/categories on performances and CF per kg edible protein (see Table 1 for some further parameters [31]).
| Protein Source | kg BW | Dry Matter Intake (kg/day) | Performance/Yield per Day | N-Excretion (% of intake) | Methane Emission; (g/d) | Emissions (kg/kg Edible Protein) | ||
|---|---|---|---|---|---|---|---|---|
| Milk (kg/d) | N | CH4 | CO2eq | |||||
| Dairy cow | 650 | 9 | 5 | 80 | 250 | 1.0 | 1.6 | 45 |
| 12 | 10 | 75 | 310 | 0.65 | 1.0 | 30 | ||
| 16 | 20 | 70 | 380 | 0.44 | 0.6 | 16 | ||
| 25 | 40 | 65 | 520 | 0.24 | 0.4 | 12 | ||
| Dairy goat | 60 | 2 | 2 | 75 | 50 | 0.5 | 0.8 | 20 |
| 2.5 | 5 | 65 | 60 | 0.2 | 0.4 | 10 | ||
| Body weight gain (g/d) | ||||||||
| Beef cattle | 350 | 6.5 | 500 | 90 | 170 | 2.3 | 3.5 | 110 |
| 7.0 | 1000 | 84 | 175 | 1.3 | 1.7 | 55 | ||
| 7.5 | 1500 | 80 | 180 | 1.0 | 1.2 | 33 | ||
| Growing/fattening pig | 80 | 1.8 | 500 | 85 | 5 | 1.0 | 0.12 | 16 |
| 2.0 | 700 | 80 | 5 | 0.7 | 0.08 | 12 | ||
| 2.2 | 900 | 75 | 5 | 0.55 | 0.05 | 10 | ||
| Broilers | 1.5 | 0.07 | 40 | 70 | Traces | 0.35 | 0.01 | 4 |
| 0.08 | 60 | 60 | 0.25 | 0.01 | 3 | |||
| Laying performance (%) | ||||||||
| Laying hens | 1.8 | 0.10 | 50 | 80 | Traces | 0.6 | 0.03 | 7 |
| 0.11 | 70 | 65 | 0.4 | 0.02 | 5 | |||
| 0.12 | 90 | 55 | 0.3 | 0.02 | 3 | |||
Table 5.
Model calculation of the influence of the number of lactations of dairy cows (8000 kg milk per lactation; 650 kg body weight) on the emissions per animal and per kilogram milk in consideration of the calf/heifer period (calculation data by [3,41]).
| Number of Lactations | 1 | 2 | 3 | 5 | 8 |
|---|---|---|---|---|---|
| kg CO2eq (CF1) per cow | 10,200 | 15,400 | 20,600 | 31,000 | 46,600 |
| g CO2eq (CF1) per kg milk | 1280 | 960 | 860 | 770 | 730 |
1CF = carbon footprint (CO2 × 1; CH4 × 23; N2O × about 296).
© 2020 by the authors. Licensee MDPI, Basel, Switzerland. This article is an open access article distributed under the terms and conditions of the Creative Commons Attribution (CC BY) license (http://creativecommons.org/licenses/by/4.0/).
Share and Cite
MDPI and ACS Style
von Soosten, D.; Meyer, U.; Flachowsky, G.; Dänicke, S. Dairy Cow Health and Greenhouse Gas Emission Intensity. Dairy 2020, 1, 20-29. https://doi.org/10.3390/dairy1010003
AMA Style
von Soosten D, Meyer U, Flachowsky G, Dänicke S. Dairy Cow Health and Greenhouse Gas Emission Intensity. Dairy. 2020; 1(1):20-29. https://doi.org/10.3390/dairy1010003
Chicago/Turabian Stylevon Soosten, Dirk, Ulrich Meyer, Gerhard Flachowsky, and Sven Dänicke. 2020. "Dairy Cow Health and Greenhouse Gas Emission Intensity" Dairy 1, no. 1: 20-29. https://doi.org/10.3390/dairy1010003