Article

Physical Properties of Moist, Fermented Corn Grain after Processing by Grinding or Milling

by
Keagan J. Blazer
1,
Kevin J. Shinners
1,*,
Zachary A. Kluge
1,
Mehari Z. Tekeste
2 and
Matthew F. Digman
1
1
Department of Biological Systems Engineering, University of Wisconsin, Madison, WI 53706, USA
2
Department of Agricultural and Biosystems Engineering, Iowa State University, Ames, IA 50011, USA
*
Author to whom correspondence should be addressed.
AgriEngineering 2024, 6(2), 908-924; https://doi.org/10.3390/agriengineering6020052
Submission received: 28 January 2024 / Revised: 16 March 2024 / Accepted: 29 March 2024 / Published: 3 April 2024
(This article belongs to the Section Pre and Post-Harvest Engineering in Agriculture)

Abstract

:
A novel biomass production system, integrating the co-harvesting and co-storage of moist corn grain and stover, promises a reduction in delivered feedstock costs. In this innovative method, the dry grain traditionally utilized for feed or biofuel production will now be processed at a considerably greater moisture content. The adoption of this approach may necessitate a substantial redesign of existing material handling infrastructure to effectively accommodate the handling and storage of moist grain after processing by milling or grinding. A comprehensive study was conducted to quantify the physical properties of this grain after processing with a knife processor or a hammermill. The geometric mean particle size, bulk and tapped density, sliding angle, material coefficient of friction, and discharged angle of repose were quantified. Five grain treatments, either fermented or unfermented, and having different moisture contents, were used. After processing, the moist, fermented ground grain exhibited a significantly smaller particle size compared to the dry grain. Additionally, both moist processed grains resulted in a decreased bulk density and increased material sliding angle, friction coefficient, and angle of repose. The examined metrics collectively suggest that handling, mixing, and storing moist ground grain will pose significant challenges compared to conventional dry ground grain. This increased difficulty may lead to substantially higher costs, a crucial factor that must be carefully considered when evaluating the overall economics of implementing this new biomass production system using combined harvesting and storage of corn grain and stover.

1. Introduction

A new approach to creating a biomass feedstock from corn stover has been investigated [1]. In this novel approach, corn grain and stover are co-harvested, anaerobically co-stored, co-transported, and, finally, separated at a biorefinery [1]. This process diverges from harvesting corn silage for ruminant animal feed in two key ways: first, harvester modifications are implemented to preserve the kernel integrity, and second, the overall crop moisture level is significantly lower [1]. Harvesting would occur at a typical grain moisture of less than 25% (w.b.), at which time the stover moisture would typically be from 30% to 45% (w.b.) [2]. Conservation of the co-stored fractions is facilitated by anaerobic storage and fermentation [1]. During anaerobic storage, the grain gains moisture from the moist stover and becomes lightly fermented [3]. Fermented corn kernels have been shown to have different physical properties than typical dry grain [4]. In particular, the moist, fermented kernels had a lower rupture strength, which may lead to different material properties as a result of processing by grinding or milling. While processing dried corn grain is commonplace, there was concern that the significant cost of drying moist kernels before processing would pose a challenge to the economics of this novel biomass system. Size reduction is a basic process operation when corn grain is used for animal feed or converted to biofuels or bioproducts. Post-size-reduction operations like storage, unloading, metering, and mixing are impacted by material properties like the moisture content, compressibility, critical orifice diameter, angle of repose, and particle size [5]. Poor granular flow can lead to bridging or ratholing, caking and agglomeration, erratic flow, and sifting segregation.
Information on physical properties exists for processed low-moisture corn grain (i.e., <25% w.b.) [6,7,8], but there is limited information concerning processed corn grain above this moisture range. The particle size distribution and moisture content contribute significantly to the flow characteristics of ground corn grain. A greater moisture content contributes to increased cohesion and adhesion of particles due to the formation of interparticle bonds [9,10], which can lead to decreased flowability [7,11]. As the granular material moisture increases, the bulk density decreases [6,12]. A smaller particle size can decrease the granular material flowability [8,13].
Material handling and storage systems are frequently overlooked in the design of grain processing facilities, as they are not considered value-added processes such as grinding, mixing, or pelletizing [14]. The use of gravity for granular flow, for instance from hoppers or bins, offers an economical means of transport [15]. However, materials with poor flow characteristics may struggle to effectively utilize gravity flow systems, resulting in potential blockages and interruptions that necessitate more costly mechanical systems such as vibratory feeders, pneumatic conveyors, or agitators [16].
The challenges associated with poor flowability extend beyond potential blockages, requiring additional equipment and energy to move material through handling systems and thereby contributing to higher operational costs. Furthermore, the accuracy of metering and mixing may be compromised, introducing variations in the delivered material quantities, and thus incurring additional costs. Granular material with inadequate flowability might demand larger storage spaces to accommodate potential flow issues, further inflating operational costs.
An understanding of the parameters influencing the flow characteristics of ground moist corn grain is imperative for the development of suitable handling and storage equipment. This knowledge is essential in mitigating challenges related to poor flowability and, consequently, reducing the associated material handling costs.
Moist, fermented corn kernels have been shown to have different physical properties than conventional dried grain [4]. Our hypothesis was that these differences will impact the flowability of this grain after processing by grinding or milling. Therefore, the objective of this research is to quantify important physical properties and flow characteristics of moist, fermented corn grain that has been size-reduced by grinding or milling.

2. Materials and Methods

2.1. Treatments, Material Preparation, and Parameters Quantified

Six grain treatments were investigated: conventional unfermented (U) grain at three different moistures (U–Low, U–Mid, and U–High), fermented (F) grain at two different moistures (F–Low and F–High), and fermented grain that had been dried (F–Dried). The two lowest-moisture unfermented treatments (U–Low and U–Mid) could be safely stored in typical grain storage structures without spoilage. The high-moisture grain (U–High) would likely undergo biological degradation if stored aerobically. Harvesting at different dates resulted in the unfermented and fermented treatments having different moisture contents (see below). The dried fermented treatment was created by oven-drying a mix of F–Low and F–High grain at 65 °C until sufficient mass was removed so that the estimated moisture content was approximately 10% (w.b.). The grain hybrid (dent variety) was Dairyland DS-4018AMXT (Dairyland Seed Co., Kewaskum, WI, USA) with a comparative relative maturity of 101 days.
The F–Low and F–High grains were co-stored with moist corn stover on 20 October and 5 November 2020, respectively. The co-mingled grain and stover was stored in 60 L sealed plastic containers lined with 3 mil plastic bags. At storage, a pressure of 140 kPa was applied on the top surface to compress the contents. The plastic bags were then tightly sealed to maintain anaerobic conditions and the containers were stored indoors at approximately 20 °C until being removed from storage on 18 May 2021. The total fermentation acids were 0.78% and 1.94% of DM for the F–Low and F–High treatments, respectively. There was no drying of the F–Low and F–High treatments prior to testing; thus, these treatments were tested at the moisture as removed from storage.
The following cleaning process was undertaken prior to testing to remove most of the foreign matter and broken grain from all treatments. An ASABE particle-size separator [17] was used to fractionate the grain by size. The grain on the 6.4 mm screen contained the majority of whole kernels, so this material was collected, and then any remaining foreign matter was hand-removed. The fermented treatments F–Low and F–High were then stored in vacuum-sealed bags until testing began. Each treatment was replicated four times, and the replicate tests were conducted in a random order. Moisture content was determined at the time of testing by oven-drying four random samples per treatment (each sample mass approximately 100 g) at 65 °C for 72 h.
To determine if differences in kernel physical properties would impact the post-processing handling characteristics of the moist, fermented kernels, two processing methods were investigated: grinding in a knife processor or milling in a hammermill. Physical properties quantified from the processed material included geometric mean particle size, bulk and tapped density, sliding angle, material coefficient of friction, and discharged angle of repose.

2.2. Grain Processing

Grain was processed by grinding with a knife processor or milling with a hammermill. A Robot Coupe (Ridgeland, MS, USA) model RSI 2Y-1 industrial rotary knife processor was used to process four replicate samples of approximately 320 g dry matter (DM) of each treatment. Each sample was delivered rapidly into the knife processor and then allowed to process for 30 s. A model 66 Myers-Sherman (Streator, IL, USA) hammermill operated at 2950 rpm and equipped with a screen featuring 3 mm-diameter holes and 40% open area was used. Four replicate samples per treatment of approximately 1700 g wet matter (WM) were processed in the hammermill. To conserve moisture and prevent spoilage, the two fermented treatments F–Low and F–High were stored in vacuum-sealed bags after processing by either method until subsequent property experiments described below were conducted. The remaining treatments were stored in paper bags and allowed to equilibrate with the environment prior to subsequent experiments.

2.3. Particle Size

Prior to fractionation by particle size, 300 g replicate samples of all processed treatments were oven-dried for 24 h at 65 °C and then allowed to equilibrate with the environment for at least 24 h. Samples processed in the knife processor were then fractionated by size using a cascade of sieves in a Ro-Tap model RX-29 screener (W.S. Tyler; Mentor, OH, USA) configured with seven sieves (2.36, 1.70, 1.18, 0.85, 0.60, 0.43, and 0.30 mm) and a bottom pan. Before processing, a bristle sieve cleaner, intended to mitigate blinding in the screens, and a 16 mm-diameter rubber ball, serving as a material agitator, were positioned on the surfaces of the five sieves. A similar process was used for the grain processed in the hammermill except the cascade of sieves was 1.18, 0.85, 0.43, 0.30, 0.15, 0.105, 0.088, and 0.075 mm and a bottom pan. The sieve agitators and bristle sieve cleaners described above were added to the bottom seven sieves. Prior to screening, 0.5 g of silicon dioxide dispersing agent was mixed into each replicate sample. As specified in ASAE S319.4 [18], the weight of the dispersing agent was considered inconsequential and was not considered in the particle size calculations. For both ground and milled material, the screener was operated for 10 min, the contents of each screen and the pan weighed to the nearest 0.001 g, and the material geometric mean particle size (GMPS) determined using equations found in ASABE Standard S319.4 [18].

2.4. Bulk and Tapped Density

Bulk density was determined using USDA standard [19] test weight apparatus (model 29, Seedburo Equipment Co., Des Plaines, IL, USA). The tare weight of the 473 mL container was determined using a digital scale with a 0.01 g resolution, then the container was placed under the hopper with the gate closed. Enough processed grain was poured into the funnel to ensure that the test container would overfill (Figure 1). Material was discharged from the container when the gate at the bottom of the funnel was removed. The processed grain in the funnel was gently agitated to facilitate flow if material bridged or ratholed. A gentle back and forth motion of a straight edge was used to level contents of the container. The container and its contents were weighed to the nearest 0.01 g. Wet-basis and dry-basis bulk density were calculated using the net mass of material, the container volume, and the moisture content of the treatment.
Tapped density was determined by tapping the rim of the container with a 340 g plastic mallet. Five impacts were applied in one location and then the container was rotated approximately 90 degrees and another five impacts applied (Figure 1). This process was repeated until 100 impacts had been applied. This procedure is similar to that used by Jadhav et al. [20]. Using a digital caliper, the distance from the container rim to the consolidated surface was measured to the nearest 1 mm at four locations. Wet-basis and dry-basis tapped bulk density were calculated using the consolidated volume, the net mass of the material, and the moisture content of the treatment.
The Hausner Ratio (HR) and Carr Index (CI) were calculated using the bulk (ρb) and tapped (ρt) densities:
H R = ρ t ρ b
C I = ρ t ρ b   ρ b × 100
Potential poor flowability is indicated if the Hausner Ratio is greater than 1.25 or the Carr Index is greater than 25 [21].

2.5. Sliding Angle and Friction Coefficient

The sliding angle device consisted of an adjustable tilting angle plate (part number 00675348, MSC Industrial, Melville, NY, USA) with a 13 × 18 cm stainless steel surface. Each sample consisted of approximately 60 g (dry basis) of processed grain poured into a 65 mm-diameter bottomless container (14.7 g mass). The container and its contents were placed on the center of the back edge of the horizontal surface, and then the container was lifted slightly so that only the processed material was in contact with the surface (Figure 2). Slowly tilting the table eventually caused the container and its contents to slide. When the container had moved at least 5 cm, the angular displacement was halted, and the table slope was measured to the nearest 0.1 degree with a digital inclinometer (model 360, Kell-Strom Tool Co., Wethersfield, CT, USA). In addition to the sliding angle, the friction coefficient was calculated from the inverse tangent of the table slope.

2.6. Discharge Angle of Repose

The angle of repose was determined using an acrylic rectangular container (200 mm height, 250 mm length, and 120 mm depth) with a sloped gate (Figure 3). The gate was configured 30 degrees below the horizontal. Processed grain was placed above the gate and the contents were gently leveled with the top of the container (approximately 790 mL of material per test). The gate was opened so the material could slide down and pass through a 25 mm opening. Material interacted with the rear wall of the container and then dropped into the container, forming a triangular-shaped pile. A sheet of acrylic was gently placed on top of the sloped pile and a digital inclinometer (Section 2.5) was used to measure the slope of the pile to the nearest 0.1 degree (Figure 3).

2.7. Effect of Hammermill Screen Size

Liu [22] reported that the GMPS of hammermilled corn particles collected from operating dry-grind ethanol plants averaged 0.48 mm (range of 0.43 to 0.52 mm). An experiment was conducted to determine how hammermill screen size might be used to achieve a target GMPS of less than 0.50 mm, similar to what is achieved in ethanol plants. The grain treatments considered were U–Mid, F—Low, and F–High. Three screen sizes (4.8, 6.4, and 9.5 mm holes with 32%, 33%, and 34% open area, respectively) were used. Three replicate samples per treatment and screen size were processed using the hammermill and procedures described in Section 2.2. The GMPS was determined using the procedures described in Section 2.3.

2.8. Hammermill Power Requirements

It was observed during the hammermill screen size experiment (Section 2.7) that the F–Low and F–High materials may have been recirculating prior to exiting the screens. However, the small batch sample mass of approximately 1.7 kg WM made it difficult to determine if this was in fact occurring. Therefore, an experiment was conducted to process material in a steady-state manner using the hammermill described in Section 2.2. Only two grain treatments were used: U–Mid and F–High. The U–Mid treatment was processed using 6.4 and 9.5 mm screens (33% and 34% open area, respectively) and the F–High treatment was processed using 9.5, 12.7, and 19.1 mm screens (33%, 43%, and 44% open area, respectively). Screens larger than 9.5 mm were not used with the U–Mid grain because previous results had shown that the GMPS was greater than the desired target of 0.5 mm. The 6.4 mm screen could not be used with the F–High grain because, at steady-state, the processed material would not flow through the screen holes. Evidence of recirculation was quantified by the duration that ground material continued to exit the hammermill after the flow of grain into the hammermill was stopped.
A steady-state flow of material was supplied to the hammermill using an E-Z Trail model 3500 grain cart (E-Z Trail, Arthor, IL, USA) equipped with a 125 mm-diameter unloading auger. Flow to the auger was regulated by gate height at the cart exit. Four replicate tests per treatment were conducted and the duration of each test was 45 s. The mass (from 30 to 85 kg WM) of processed material was determined to the nearest 5 kg after each test. Material was homogenized by hand and two random samples of approximately 500 g DM were collected. These samples were oven-dried for 24 h at 65 °C to determine moisture content. The samples were then used to determine GMPS using the procedures described in Section 2.3.
Processing power requirements were quantified by collecting torque and speed at the hammermill input shaft. A model MCRT 4961V torque transducer (S.Himmelstein & Co., Hoffman Estates, IL, USA) was used to record these parameters at 75 Hz. Mass flow rate into the hammermill was determined by dividing the mass of material processed by the test duration. The average torque and speed during the 45 s operating time were used to calculate the power requirements. Net specific energy requirements (SEnet) were determined from:
S E n e t = P g P n l m f ˙
where Pg is the gross power measured during a test, Pnl is the power required to operate the hammermill without processing material, and mf is the dry-basis material mass flow rate.

2.9. Statistical Analysis

The standard least squares method in the Fit Model platform of JMP Pro (ver. 15, SAS Institute Inc., Cary, NC, USA) was used to conduct the statistical analysis. All least square means were compared using the adjusted Tukey test. Significant differences were declared at p ≤ 0.05, and tendencies were considered at 0.05 < p ≤ 0.10.

3. Results

3.1. Moisture Content and Particle-Size

With one exception, the moisture contents of the treatments were statistically different (p < 0.05) (Table 1). The two moist, fermented treatments (F–Low and F–High) had the greatest moisture content of all the treatments considered. Although statistically different, the moisture contents of the F–Low and U–High treatments and the U–Mid and F–Dried treatments were within a few percentage points of each other. The USDA has established the standard test weight of corn based on a 15.5% moisture content [23], so the U–Mid treatment was considered as conventional dry grain in this research.
The moist, fermented grain processed using either the knife processor or the hammermill had a significantly smaller GMPS compared to the conventional dry grain (U–Mid) (Table 1). The F–Low and F–High treatments had 51% and 67% smaller GMPS values, respectively, than the U–Mid treatment when processed in the knife processor, and 35% and 49% smaller GMPS values, respectively, than the U–Mid treatment when processed in the hammermill. The GMPS was statistically greater for the F–Low processed grain than for the F–High grain. The moisture content of the F–Dried grain was between that of the U–Low and U–Mid grain, yet the GMPS of the former was significantly less than the two latter treatments when processed by either method. This indicates that fermentation affected the particle size reduction independently of the moisture content at processing.
For either method of processing, the cumulative undersized distributions indicate that the processed moist, fermented grain had a greater mass fraction of small particles than the dry grain (Figure 4 and Figure 5). For instance, when processing with the hammermill, the mass fraction less than 0.30 mm was 22%, 46%, and 50% for the U–Mid, F–Low, and F–High treatments, respectively (Figure 5).

3.2. Effect of Hammermill Screen Size

When processed in the hammermill equipped with three different screen sizes, the fermented grain consistently had statistically (p < 0.05) smaller GMPS values than the U–Low processed grain (Table 2). Averaged across all three screen sizes, the GMPS values of the F–Low and F–High grain were 51% and 65% smaller than the U–Low grain. In this experiment, there was no significant difference in GMPS between the F–Low and F–High treatments at each of the three screen sizes. Although the GMPS of the F–High grain increased with larger screen openings, the differences were small and not significantly different. The cumulative undersized distributions indicate that the processed unfermented U–Low grain had a smaller mass fraction of small particles than either of the fermented processed grains (Figure 6).

3.3. Bulk and Tapped Density

For both methods of processing, the F–Low and F–High treatments had statistically smaller bulk and tapped densities than all other treatments (Table 3 and Table 4). The F–Low and F–High treatments had 35% and 41% smaller dry basis bulk densities, respectively, than the U–Mid treatment when processed in the knife processor, and 36% and 37% smaller dry basis bulk densities, respectively, than the U–Mid treatment when processed in the hammermill. When processed with the knife processor, the Hausner Ratio and Carr Index were not statistically different between the F–Low, F–High, and U–Mid treatments. When processed with the hammermill, the Hausner Ratio and Carr Index were statistically lower for the F–High treatment compared to the U–Mid treatment. Across all treatments, the dry basis bulk and tapped densities were 10% and 8% lower when processed by the knife processor and hammermill, respectively. For both processing methods, the U–Low grain had the greatest bulk and tapped densities on both a wet and dry basis. Comparing each individual treatment, the wet and dry basis bulk and tapped densities were statistically (p < 0.05) lower when processed with the hammermill compared to the knife processor.
The bulk and tapped dry basis densities were predicted through a multiple regression analysis, incorporating moisture content and particle size as the independent variables (Table 5 and Figure 7). These two variables were effective predictors of both the bulk and tapped densities. The model coefficients for the moisture content consistently displayed negative values, signifying that increased moisture content resulted in a reduction in density. Conversely, the model coefficients for particle size consistently exhibited positive values, suggesting that larger particle sizes led to an increase in density.

3.4. Sliding Angle and Friction Coefficient

No statistical difference was found for the sliding angle or friction coefficient between the U–Low and F–Dried treatments processed with either the knife processor or hammermill (Table 6). The three treatments with moisture contents greater than 22% (w.b.) (U–High, F–Low, and F–High) had significantly greater sliding angles and friction coefficients than the two dry grain treatments (U–Low and U–Mid). The sliding angles and friction coefficients between the F–Low and F–High grain were not significantly different. Taken together, these results suggest that the moisture content, rather than fermentation, was the driver for differences in the sliding angle and friction coefficient.

3.5. Discharge Angle of Repose

There was no statistical difference in the discharge angle of repose between the F–Low and F–High grain for either processing method (Table 7). The three treatments with moisture contents greater than 22% (w.b.) (U–High, F–Low, and F–High) had significantly greater discharge angles of repose than the U–Mid treatment. Drying the fermented grain before processing (F–Dried) resulted in a smaller discharge angle of repose compared to the F–Low and F–High treatments.

3.6. Specific Energy Requirements

The amount of grain processed during a 45 s replicate test varied from 30 to 85 kg WM, more than an order of magnitude greater than the mass processed in the experiments described above. The longer duration and greater processed mass granted us an opportunity to observe potential material recirculation. Material recirculation was not observed with the U–Mid grain. It was observed that the F–High material was not exiting the 6.4 mm screen openings after several seconds of operation. After grain flow into the hammermill stopped, it was observed that material continued to exit the 9.5, 12.7, and 19.1 mm screens for averages of 22, 5, and 1 s, respectively. The material recirculation for the F–High grain was extensive with 9.5 and 12.7 mm screen sizes, which affected both the GMPS and SEnet.
The throughput was statistically lower for the F–High grain compared to the U–Mid grain (Table 8). In initial tests before data collection, it was observed that the F–High grain did not flow well into the hammermill entrance. To prevent plugging at the hammermill entrance, the flow from the grain cart to the feed auger was reduced until grain fed smoothly into the hammermill. Thus, the throughput was 47% lower with the F–High grain compared with the U–Mid grain.
The target GMPS of less than 0.5 mm was not met when processing the U–Mid grain with the 6.4 and 9.5 mm screens or the F–High grain with the 19.1 mm screen (Table 8). The GMPS of the F–High processed grain with the two smaller screens was less than this target, but this was partially due to over-processing from recirculation. The F–High grain processed with the 19.1 mm screen had a similar GMPS to the U–Mid grain processed with the 6.4 mm screen. However, the fraction of sample mass greater than 1.7 mm was similar for the F–High grain processed with the 19.1 mm screen and the U–Mid grain processed with either screen size (Figure 8). The cumulative undersized distributions indicate that the processed U–Mid grain had a smaller mass fraction of particles less than 0.84 mm than the F–High grain, even when the F–High grain was processed with larger screens (Figure 7).
The SEnet for processing the F–High grain with the 9.5 mm screen was more than twice that for processing the U–Mid grain with the same screen size (Table 8). This was likely due to the observed recirculation issues with the F–High grain. When a similar GMPS was achieved for the two grain treatments (6.4 mm screen for U–Mid and 19.1 mm screen for F–High), the SEnet for processing was similar. The estimated net specific energies (dry basis) to achieve a GMPS of 0.5 mm were 2.3 and 3.5 kW⋅h⋅Mg−1 for the F–High and U–Mid grains, respectively (Figure 9).

4. Discussion

Nearly all the investigated physical properties indicate that transporting, handling, mixing, blending, and storing ground grain processed at the moistures investigated here will present considerable challenges compared to conventional dry ground grain. Moist, processed grain exhibited lower bulk densities, higher friction coefficients, and greater angles of repose. Additionally, it demanded greater energy for processing and displayed issues such as screen blockage and material recirculation in the hammermill. Bridging and ratholing behavior were observed. In light of these findings, it can be inferred that the material produced from moist, fermented corn will possess more demanding flow characteristics. The majority of the identified challenges can be attributed to the combination of the small particle size and elevated moisture content compared to conventional dry, ground grain.
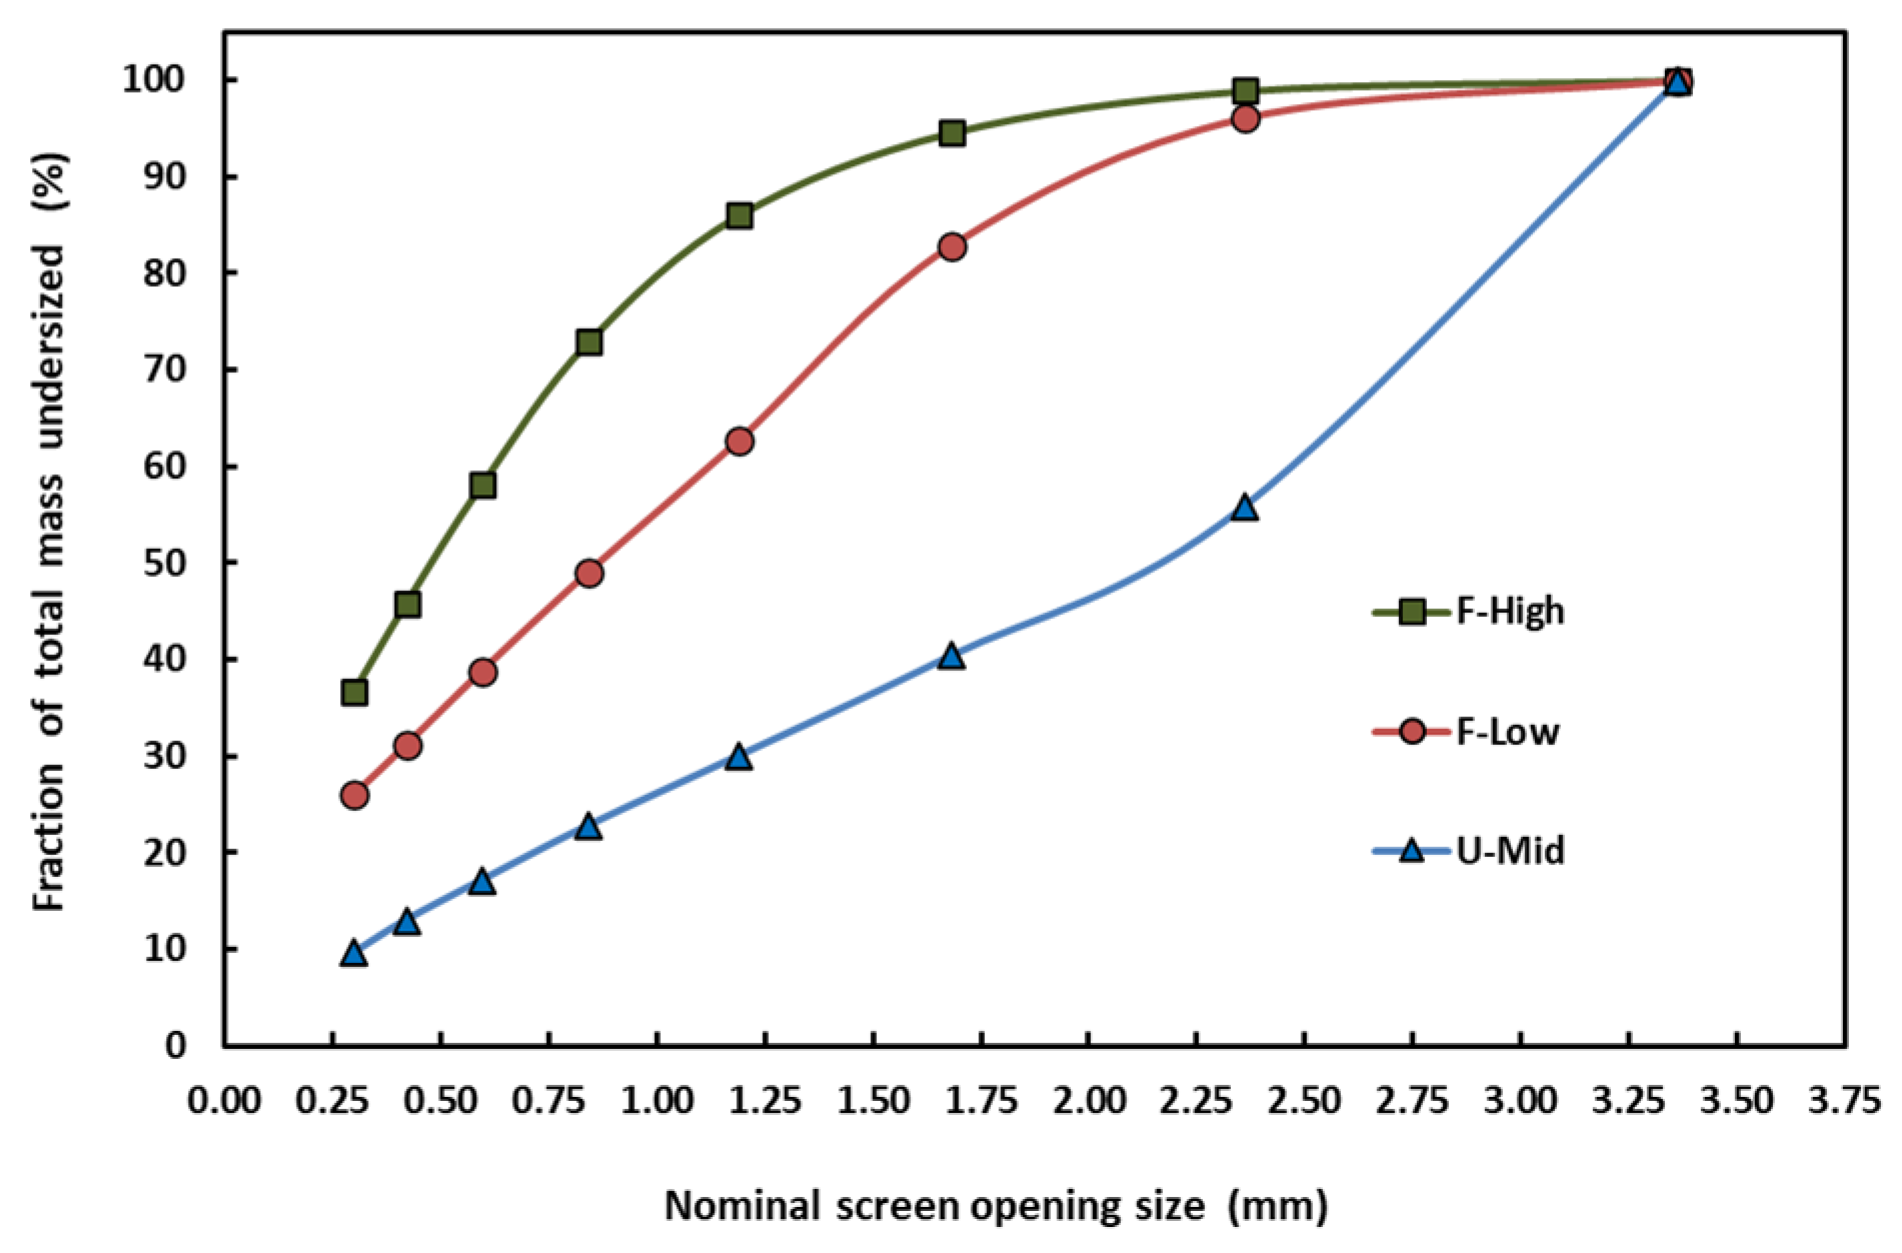
The F–Low, F–High, and F–Dried treatments exhibited significantly smaller GMPS values compared to the U–Low and U–Mid treatments (Table 1), likely attributable to three factors: a lower kernel rupture strength, a high moisture content, and over-processing caused by material recirculation. The kernels used to create the F–Low, F–High, and F–Dried treatments exhibited significantly lower rupture strengths compared to the U–Low and U–Mid treatments [4]. The lower rupture strength likely contributed to the observed reduction in particle size of the F–Low, F–High, and F–Dried treatments.
Milling with the knife processor was a batch process conducted for an equal duration across all treatments, mitigating recirculation issues associated with the hammermill. Despite the moisture content of the F-Dried grain falling between those of the U-Low and U–Mid grains, the GMPS of the former was significantly smaller than the two latter treatments when processed in the knife processor. This observation implies that low rupture strength played a crucial role in particle size reduction during milling with the knife processor.
Work by Bolaji et al. [24] reported that a decrease in grain hardness due to a higher moisture content resulted in a more substantial particle size reduction. In agreement with this finding, our research indicated a decrease in particle size with an increasing moisture content for both conventional and fermented treatments (Table 1). Additionally, the elevated moisture content likely played a role in the blocking of screen holes in the hammermill, contributing to over-processing through recirculation.
Hammermill screen sizes ranging from 4.8 to 9.5 mm showed minimal to no detectable impact on the GMPS values of the F–Low and F–High treatments (
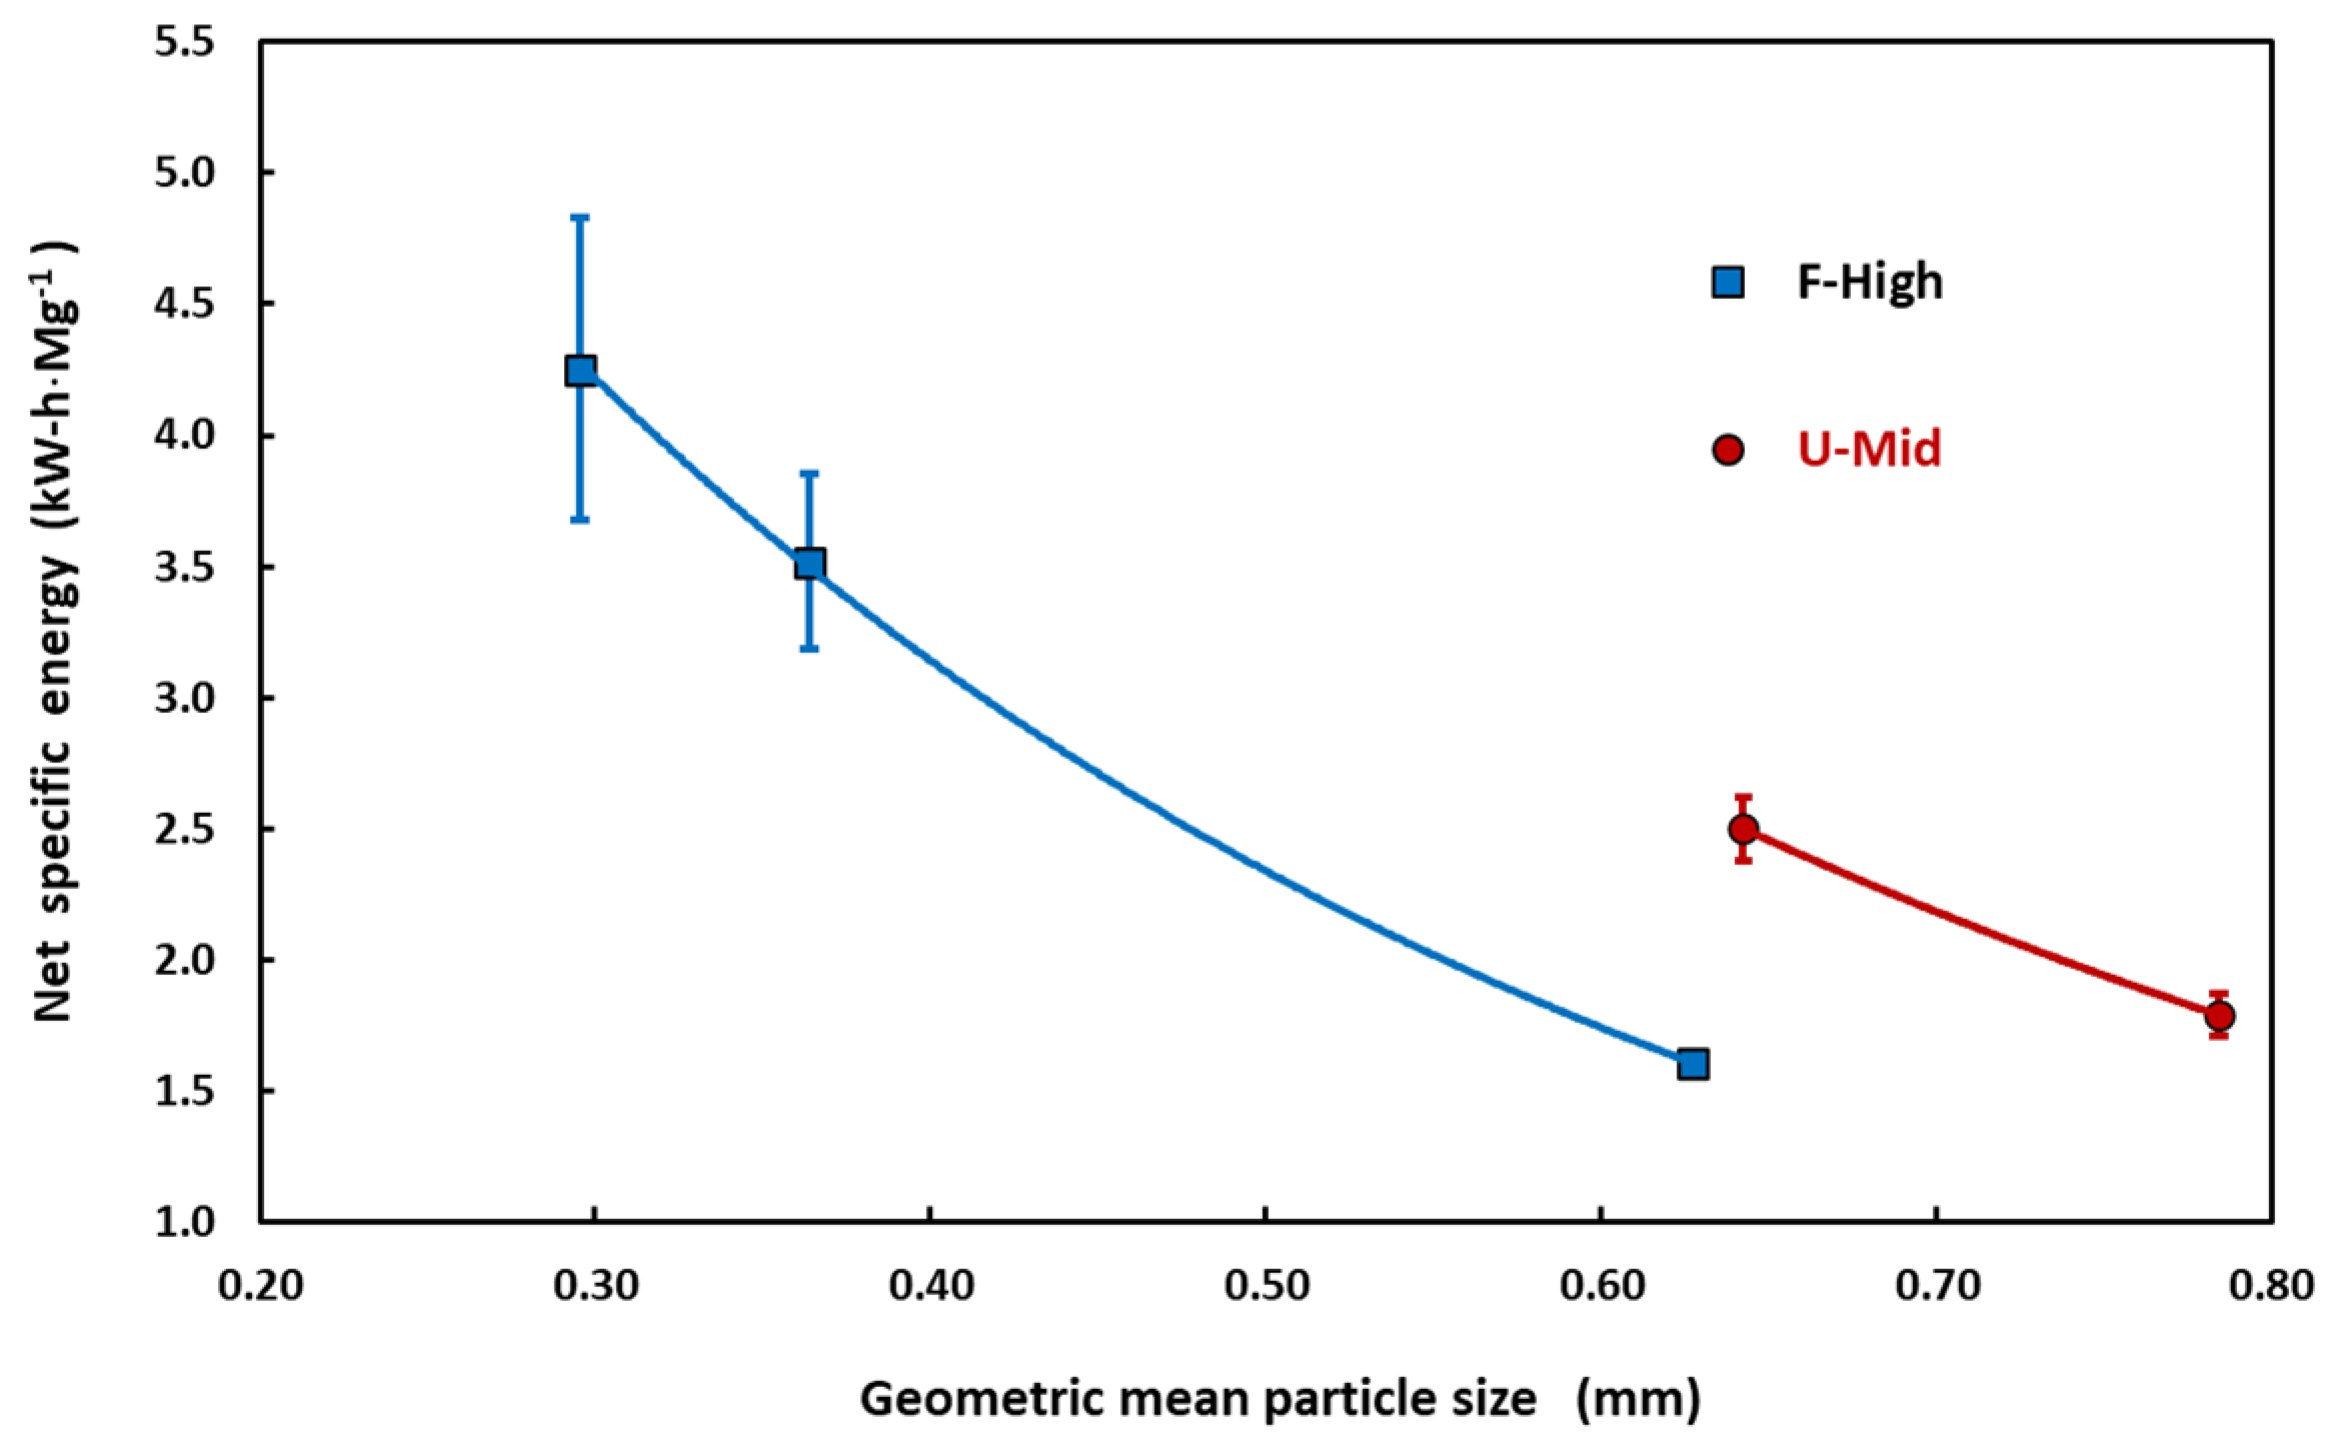
Table 2). This lack of effect could potentially be attributed to over-processing during material recirculation. The F–High grain processed with the 19.1 mm screen exhibited a GMPS comparable to the U–Mid grain processed with the 6.4 mm screen (Table 8), a phenomenon possibly influenced by the lower kernel rupture force of the moist, fermented kernels [4].
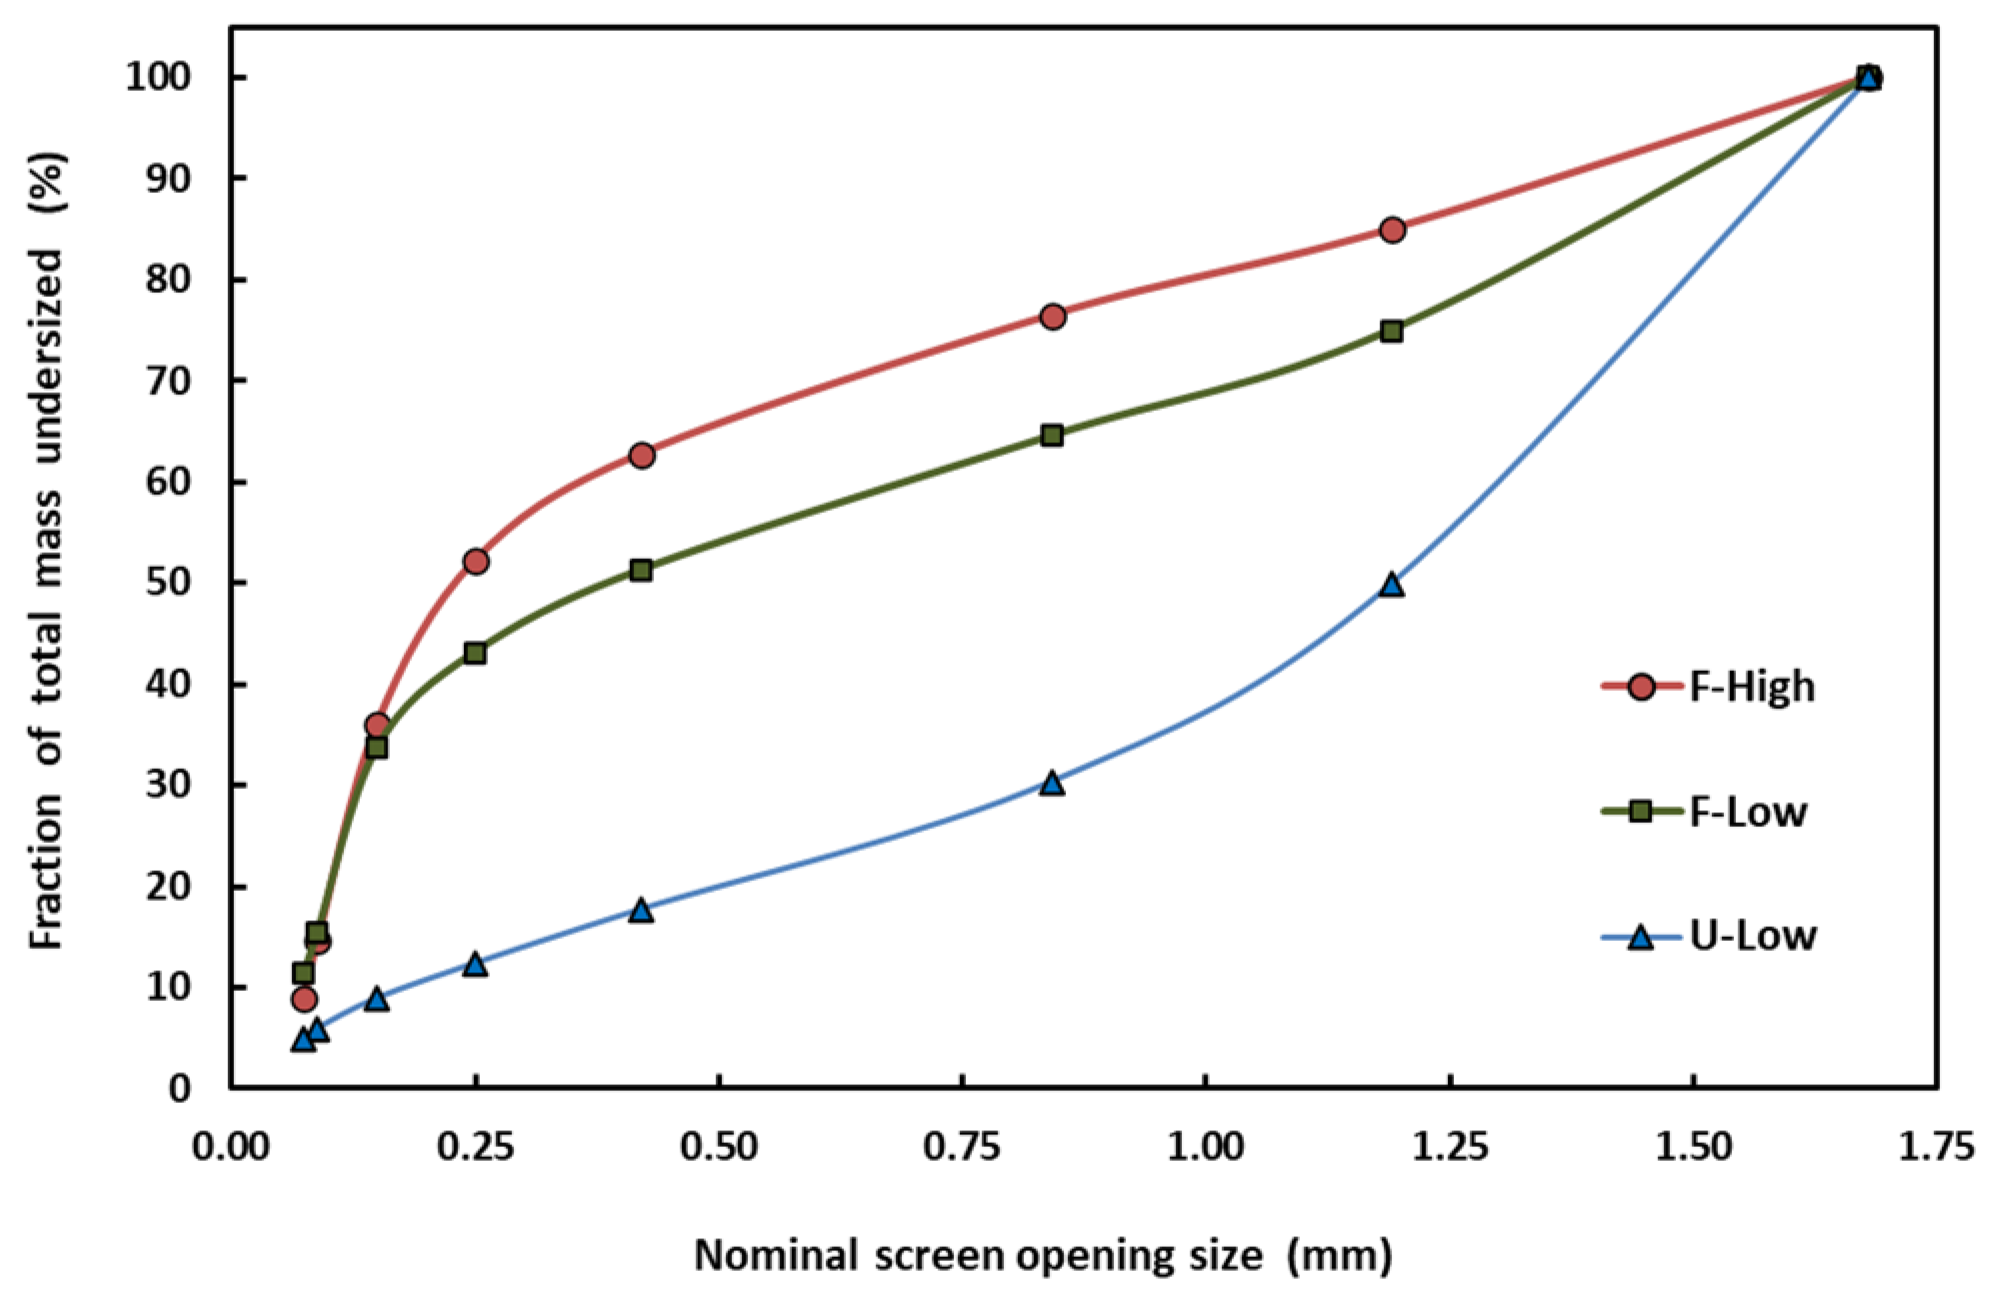
Using the 19.1 mm screen size to process F–High grain led to a reduction in observed material recirculation and a lower specific energy (Table 8). However, the milled material displayed numerous large particles, with 31% of the mass exceeding 1.7 mm (Figure 8). Processing with this screen size did not achieve the desired mean particle size of less than 0.5 mm. Drocas et al. [25] reported a 26% reduction in energy when increasing the hammermill screen opening from 4 to 8 mm. Similar energy requirement reductions with larger screen openings were documented by Ibrahim et al. [26]. Armstrong et al. [27] found that energy requirements for grinding increased with the moisture content, although the maximum moisture studied was less than 17% (w.b.), much lower than was studied here.
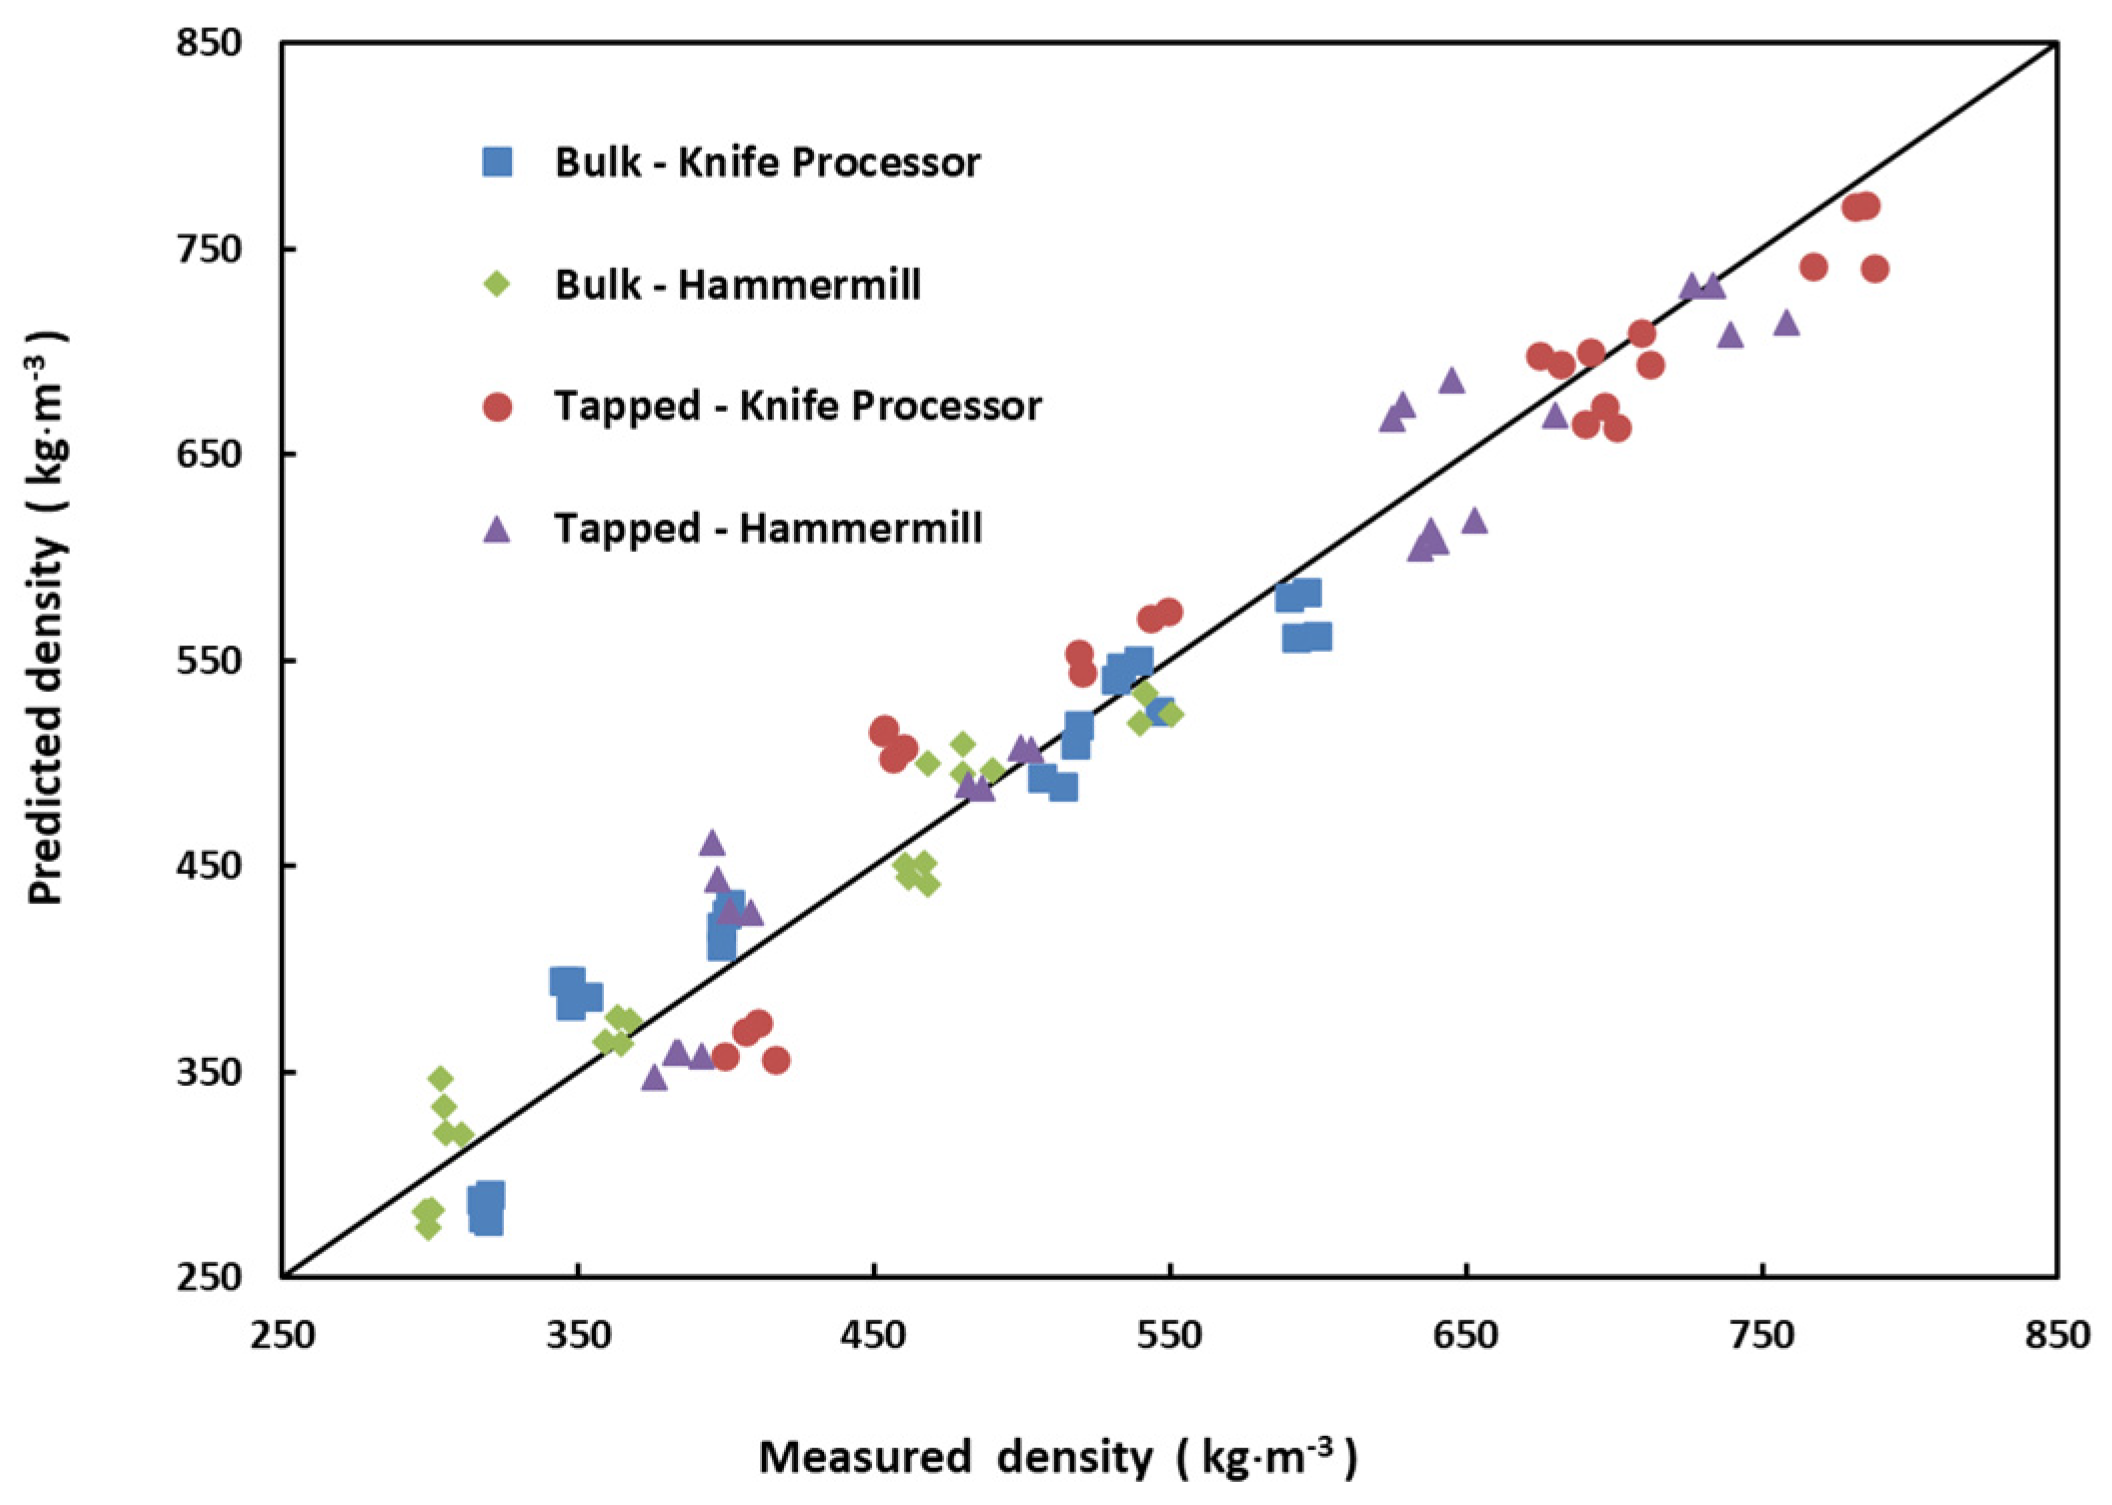
The bulk and tapped densities were very well-correlated with both the particle size and moisture content (Table 5 and Figure 7). The density decreased with a greater moisture content and smaller particle size, both characteristics of the moist, fermented processed grain. Probst et al. [7] and Jadhav et al. [20] observed no significant differences in bulk density when the grain moisture varied from 7.0% to 19.6%, but this range was much lower than moistures of the F–Low and F–High treatments. The higher moisture content in these treatments likely led to the increased cohesion and adhesion of particles, attributed to the formation of interparticle bonds [9,10]. Jadhav et al. [20] noted that both bulk and tapped densities increased with a greater particle size. Larger particles frequently have less adhesion and cohesion, resulting in a greater bulk density.
Poor flowability will often result if the Hausner Ratio is greater than 1.25 or the Carr Index is greater than 25 [21,28]. Lumay et al. [29] suggested that granular material with a Hausner Ratio falling within the range of 1.26–1.34 could only be deemed to possess passable’ flow characteristics. For all treatments investigated using both processors, the Hausner Ratio consistently fell within this range (Table 3 and 
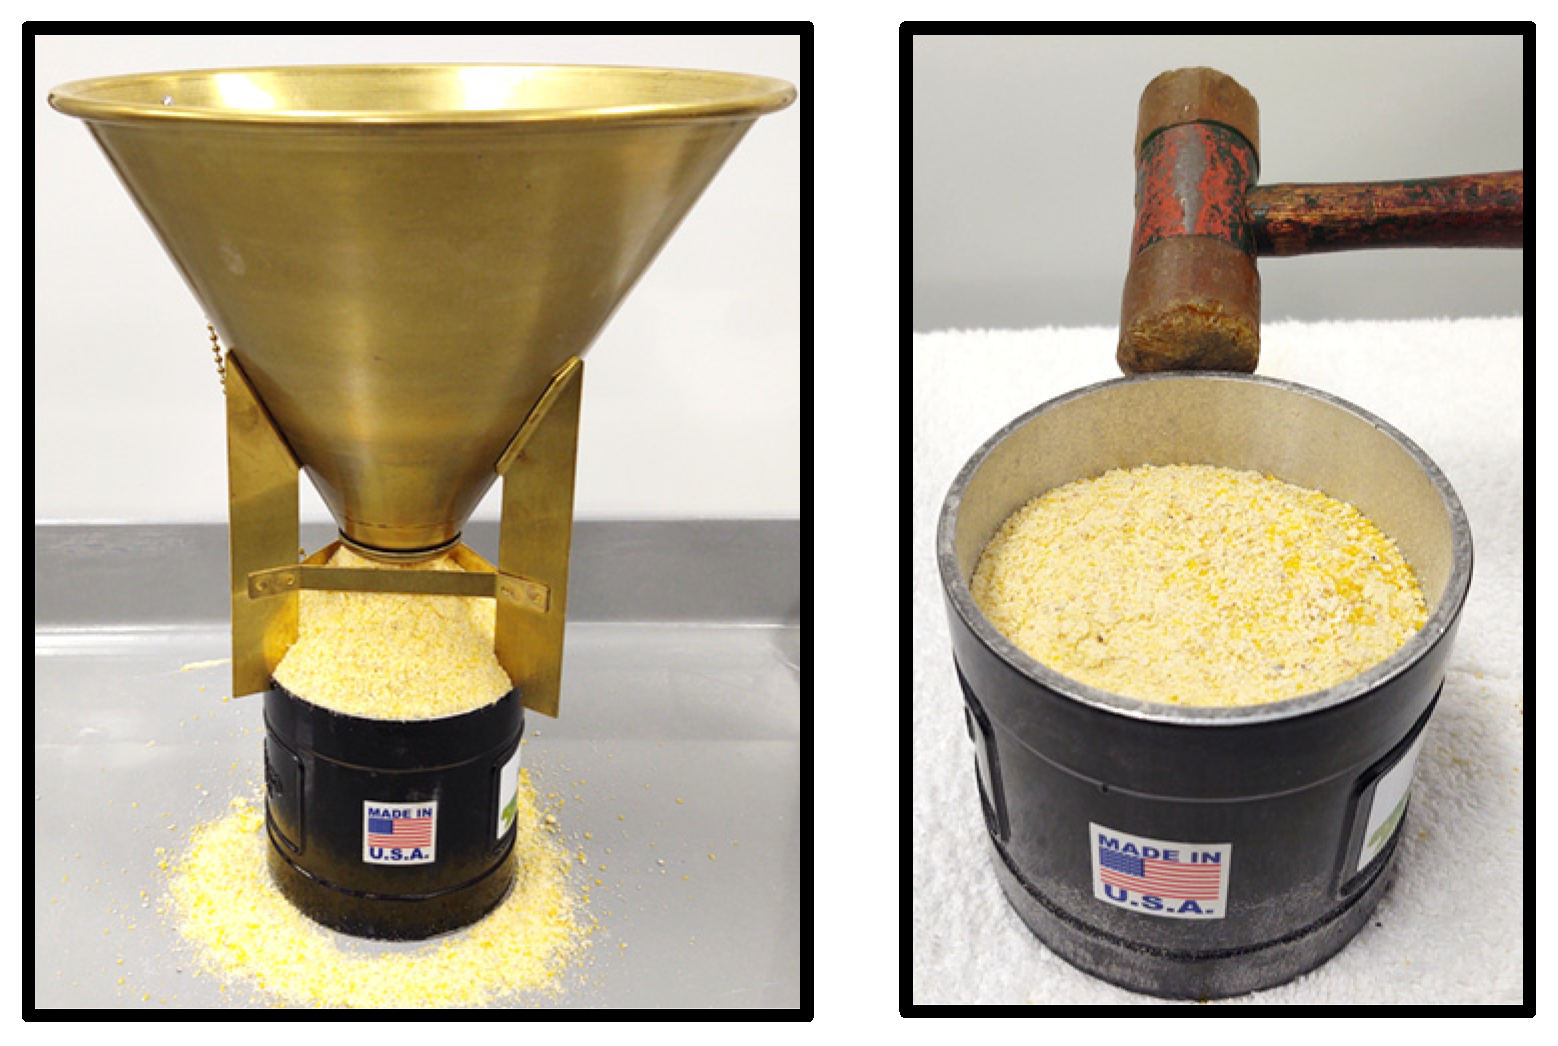
Table 4). However, in many instances, the Carr Index exceeded the recommended value of 25. The U–Dry, U–Mid, and F–Dried treatments demonstrated no flow issues in the bulk density apparatus funnel (Figure 1). However, all other treatments, particularly the F–High treatment, exhibited problems such as ratholing and impaired flow.
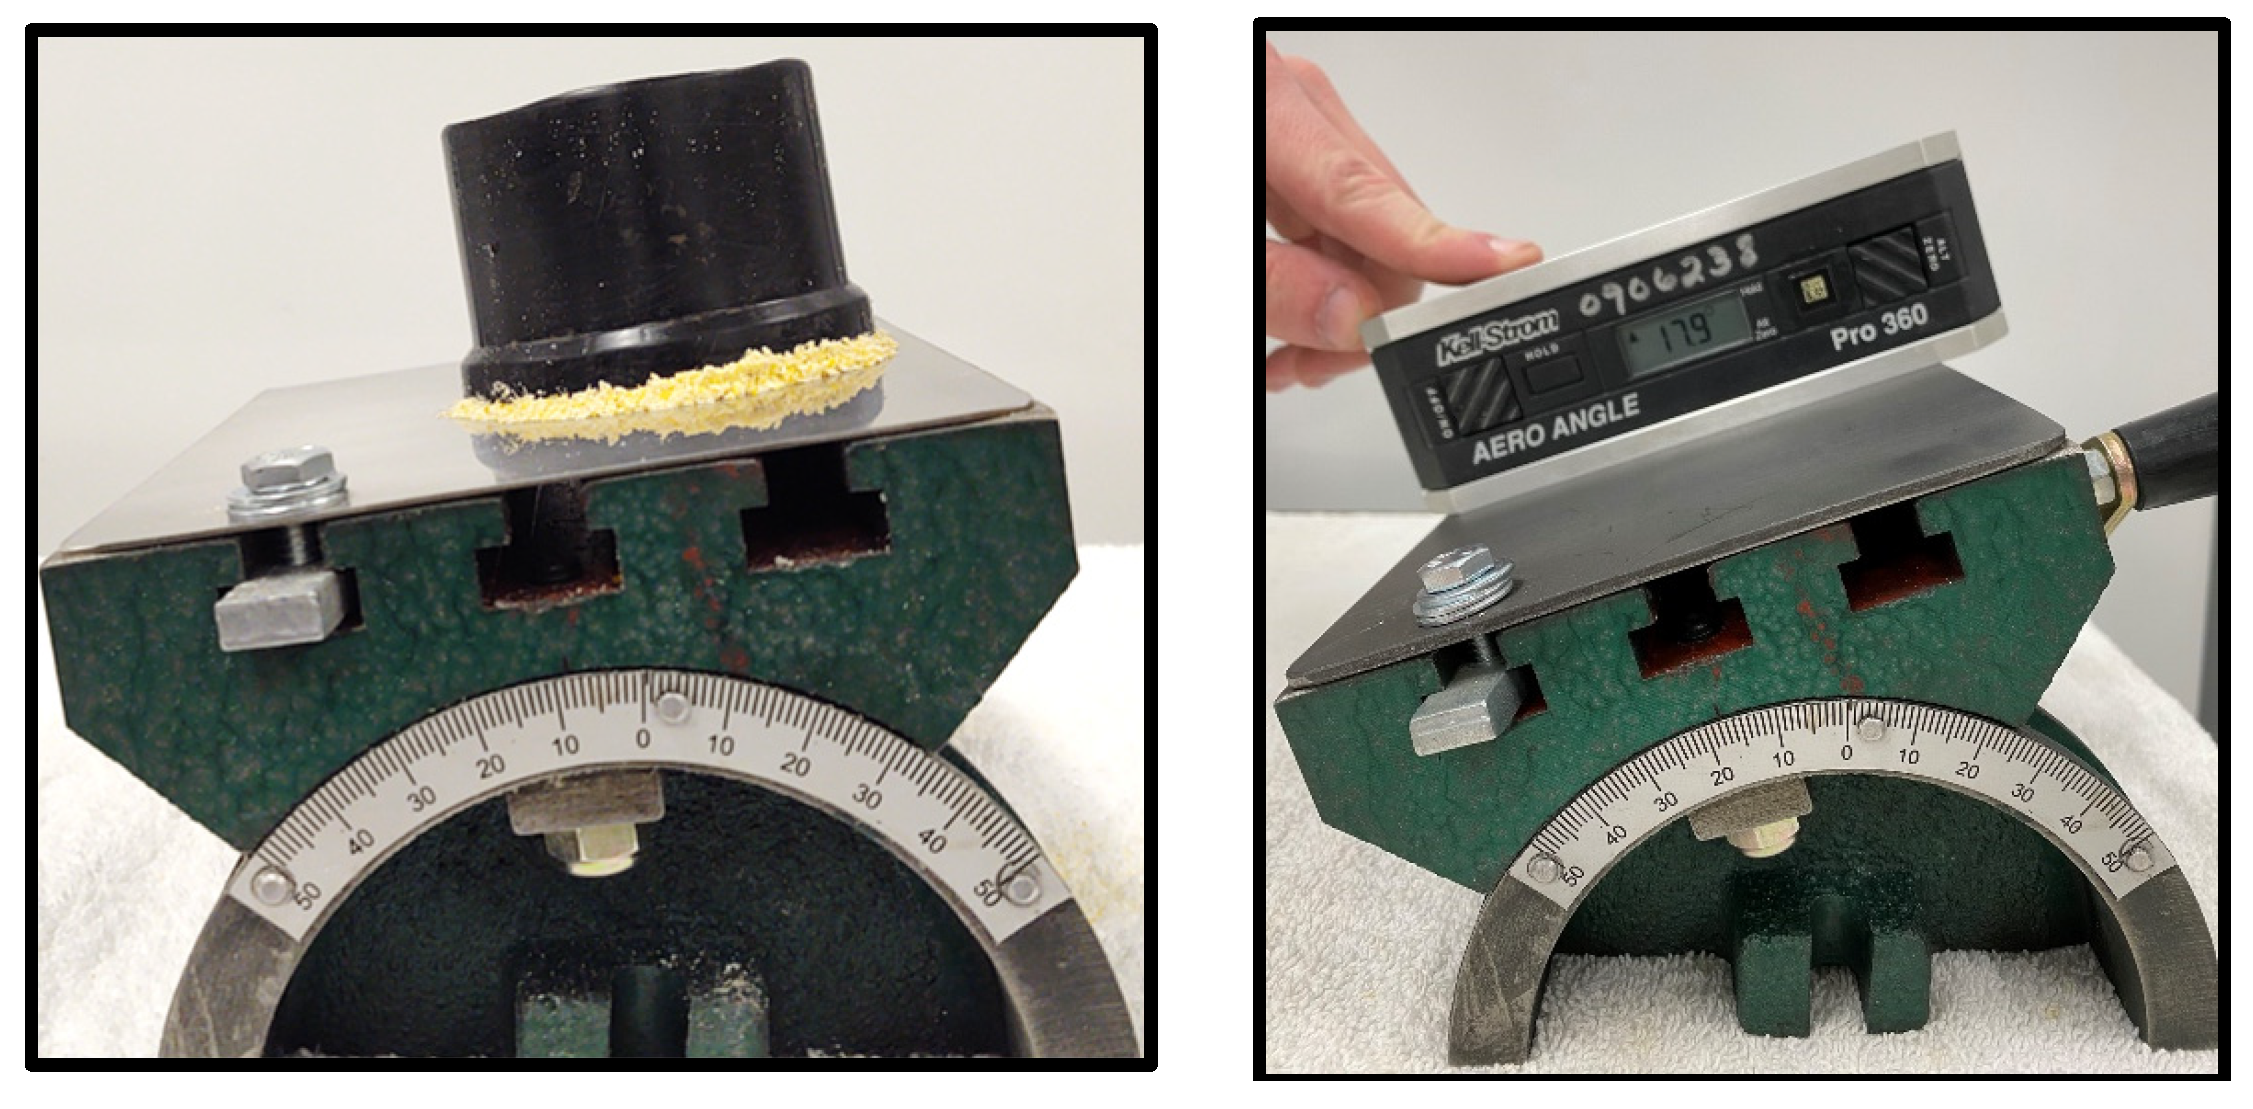
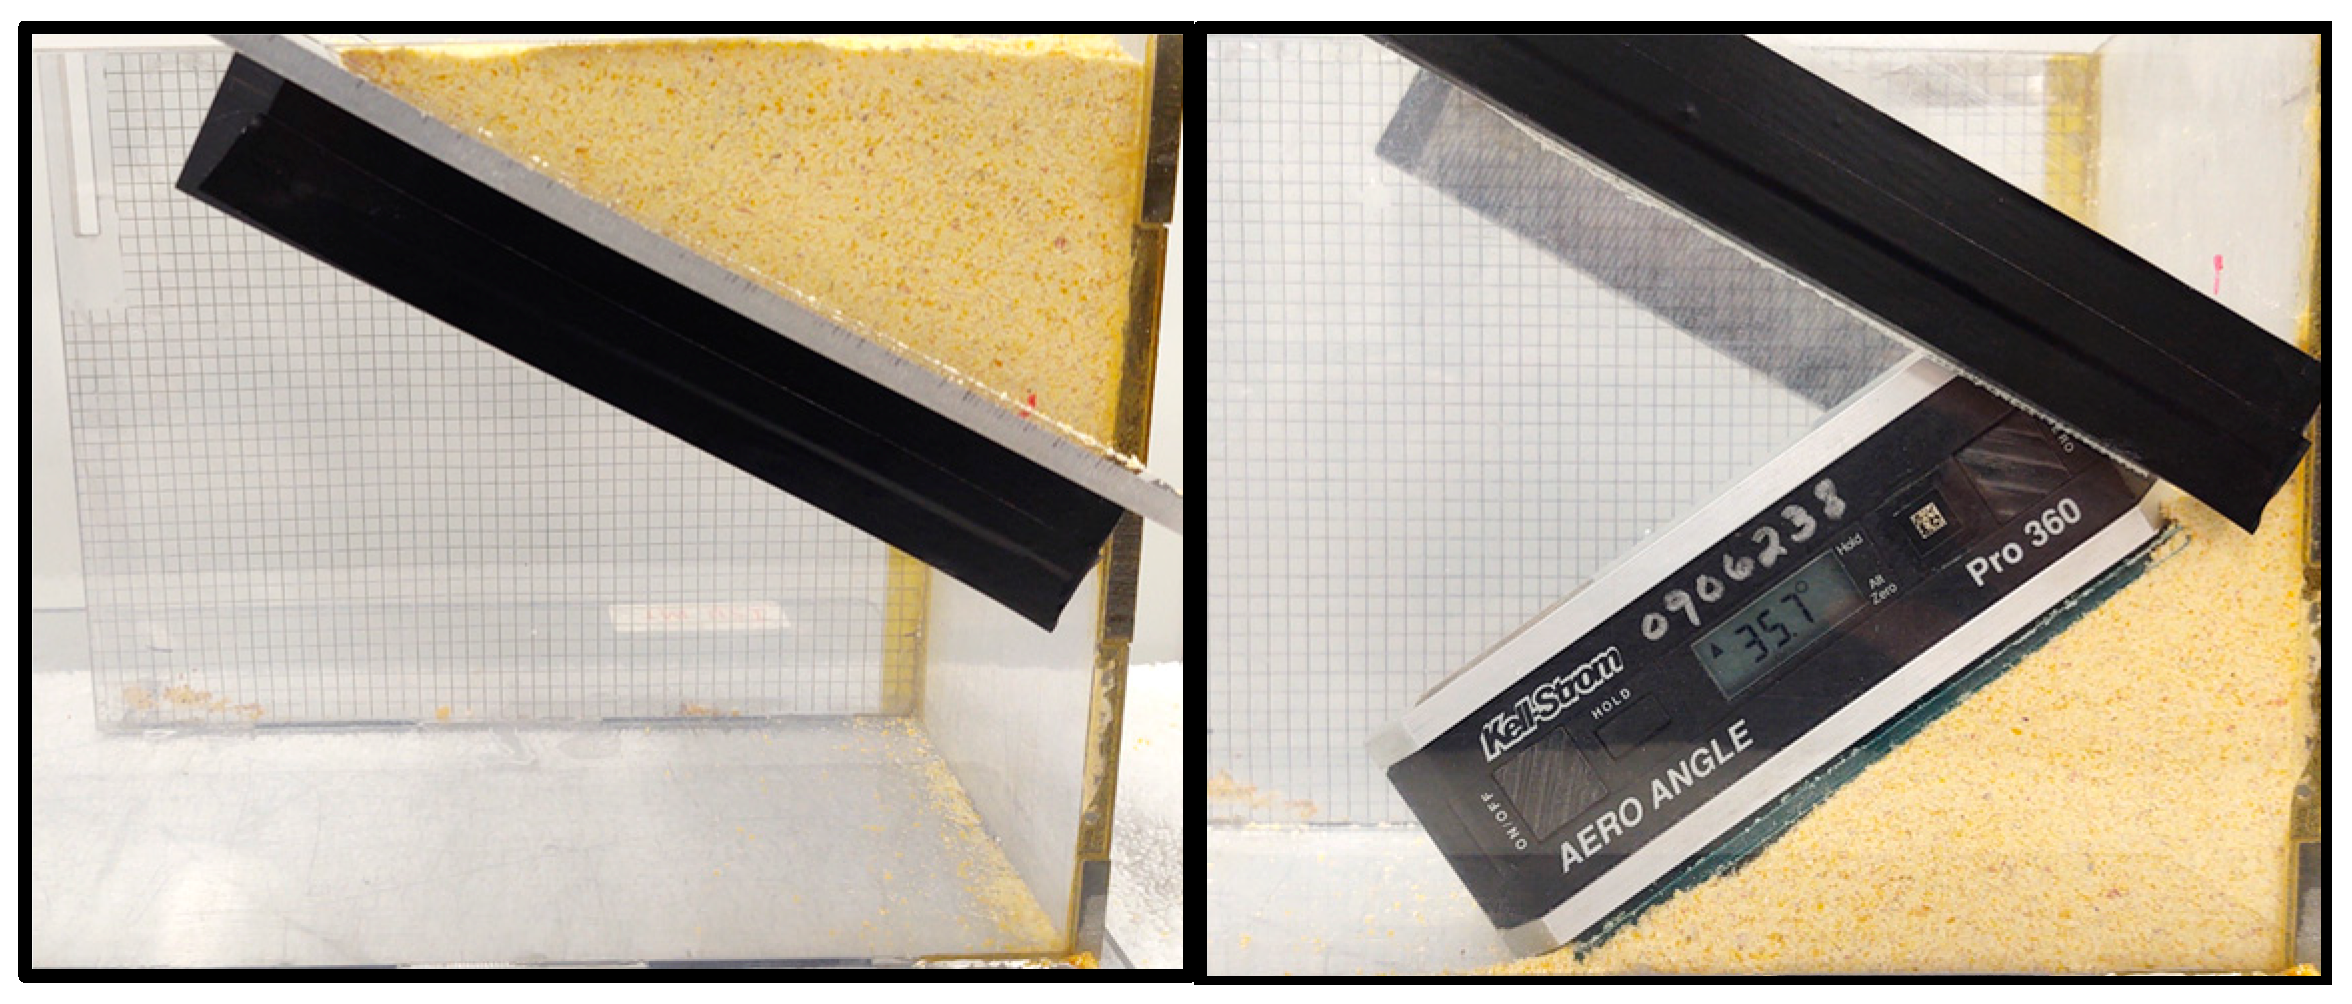
The sliding angle, friction coefficient, and angle of repose (Table 6 and Table 7) were all significantly greater for the F–Low and F–High treatments compared to the treatments with less than 20% (w.b.) moisture content (U–Low, U–Mid, and F–Dried). The latter two treatments not only had greater moisture contents but also smaller particle sizes (Table 1) than other treatments. Smaller particles provide a greater surface area for surface cohesive forces [5]. The slide angle is often closely related to the angle of repose [29] and that was the case here (r2 = 0.56). The slide angle is the minimum angle of incline relative to the horizontal at which a bulk solid will flow out from under its own weight. This angle is useful in designing chutes and other unpowered handling devices. However, the discharge angle of repose and sliding friction were measured only using a stainless-steel surface, and the surface roughness and adhesion properties of other surfaces will affect these properties. The forces opposing flow include, but are not limited to, the friction, cohesive attraction between particles, adhesive attraction between the particles and other surfaces, and mechanical resistance or interlocking [5].
The design, operation, and quality control in many agri-industrial processes involving granular material rely on the ability of the material to flow, a characteristic called flowability [28]. Granular flowability is a complex phenomenon that is impacted by many of the physical properties measured here. The moist processed grain displayed a lower bulk density, a higher friction coefficient, and a greater angle of repose. Material possessing these characteristics will require larger storage volumes, demonstrate inefficient gravity flow from bins and silos, and be susceptible to issues such as bridging and ratholing. Consequently, these challenges will result in an unpredictable delivery rate. Segregation, irregular metering, and poor blending can also result, potentially compromising the quality of the end product. Based on the physical properties measured here, the moist ground grain would likely exhibit many of these material handling and processing issues.
Processing moist corn kernels with a hammermill resulted in a low throughput, material recirculation, and high energy requirements (Table 8). Future size reduction research should prioritize improving the throughput, minimizing material recirculation, and reducing energy demands. These new investigations should encompass diverse processing techniques such as hammermills, roller mills, and disk grinders. The latter two options might prove more effective than hammermills as they lack screens, which were found to be prone to material blockage. Although most corn grain ethanol biorefineries use a dry grind practice, there are many facilities that use a wet milling process [30]. Steeped corn kernels are typically processed by a series of progressively more aggressive disk-type, coarse grind, attrition mills [31]. Techniques from the wet milling of corn could be applied to processing the moist, fermented grain derived from this new biomass system. Enhancements to the equipment feeding the size-reduction mechanisms, such as integrating an air-assisted system to facilitate material movement through an auger, could be explored for improved efficiency.
An alternative strategy to enhance the processing performance involves drying the moist, fermented grain before processing. Dried corn kernels, previously stored in a moist and fermented state, exhibited significantly lower rupture strengths compared to conventional dry kernels [4]. This characteristic makes them more readily size-reduced. The F–Dried grain processed by either method had a statistically smaller particle size than the U–Mid grain at a similar moisture content (Table 1). Prolonged anaerobic storage and fermentation evidently changes the structure of the kernel starch, making it easier to process. Prolamin-zein proteins encapsulating starch were found to be partially degraded by fermentation [32]. Processing the dried fermented grain in a hammermill would reduce the risk of screen-hole blockage. Moreover, issues related to flowability may be alleviated due to its low moisture content. The F–Dried material had physical properties similar to the processed conventional grain. The friction coefficient (Table 6) and angle of repose (Table 7) were similar for these treatments. While drying the grain is a potential solution to mitigate such issues as cohesion and adhesion, it is essential to carefully weigh the substantial cost associated with drying moist kernels in the overall economic analysis.
A common method for the simulation and optimization of cohesive bulk material handling systems and processes is the discrete element method (DEM) [33]. The angle of repose, friction coefficient, and bulk density of cohesive material like that studied here are important parameters in DEM modeling of the flow behavior of these materials [34]. The physical properties presented here can be used when DEM tools are used to design solutions that overcome the flow problems associated with moist, ground grain.

5. Conclusions

Raw agricultural materials commonly exist in a granular form. A comprehensive understanding of the bulk flows of these materials in silos, hoppers, conveyors, mixers, and size-reduction machines is critical for effective equipment and system design. Milled, ground grain processed from moist, fermented corn kernels displayed cohesive behavior with unique physical properties that differentiate it from typical cohesionless ground grain. This research strongly suggests that this material will pose distinctive challenges in both processing and handling. The physical properties of moist, ground corn grain provide valuable information that can be utilized in the design of efficient storage, processing, and material-handling systems. Consideration should be given to alternative methods of processing moist, fermented grain, such as drying before processing. Post-processing, moist corn grain might have a limited storage lifespan before spoilage, potentially complicating the effectiveness of this grain-processing approach. Further investigations into the spoilage characteristics of post-processed grain are warranted.

Author Contributions

Conceptualization, K.J.B. and K.J.S.; methodology, K.J.B., K.J.S. and M.F.D.; formal analysis, K.J.B. and K.J.S.; investigation, K.J.B., Z.A.K. and K.J.S.; resources, K.J.S., M.Z.T. and Z.A.K.; writing—original draft preparation, K.J.B. and K.J.S.; writing—review and editing, K.J.B., K.J.S., M.Z.T. and M.F.D.; supervision, K.J.S. and M.F.D.; project administration, M.F.D. and K.J.S. All authors have read and agreed to the published version of the manuscript.

Funding

This research was supported by the U.S. Department of Energy (DOE), Office of Energy Efficiency and Renewable Energy (EERE), Bioenergy Technologies Office (BETO), under Award No. DE-EE0008908. The views expressed in this chapter do not necessarily represent the views of the U.S. Department of Energy or the United States Government.

Data Availability Statement

Raw data is not publicly available, although the data may be made available on request from the corresponding author.

Acknowledgments

This research could not have been completed without the assistance of the staff of the University of Wisconsin Arlington Agricultural Research Station.

Conflicts of Interest

The authors declare no conflicts of interest.

References

  1. Cook, D.E.; Shinners, K.J.; Weimer, P.J.; Muck, R.E. High dry matter whole-plant corn as a biomass feedstock. Biomass Bioenergy 2014, 64, 230–236. [Google Scholar] [CrossRef]
  2. Walters, C.P.; Dietsche, S.C.; Keene, J.R.; Friede, J.C.; Shinners, K.J. Increasing single-pass corn stover yield by combine header modifications. Trans. ASABE 2020, 63, 923–932. [Google Scholar] [CrossRef]
  3. Pike, B.C.; Shinners, K.J.; Timm, A.J.; Friede, J.C.; Digman, M.F. Co-harvest and anaerobic co-storage of corn grain and stover as biomass feedstocks. J. ASABE 2023, 66, 423–430. [Google Scholar] [CrossRef]
  4. Blazer, K.J.; Shinners, K.J.; Kluge, Z.A.; Tekeste, M.Z.; Digman, M.F. Physical properties of moist, fermented corn kernels. Processes 2023, 11, 1351. [Google Scholar] [CrossRef]
  5. Juliano, P.; Barbosa-Cánovas, G.V. Food powders flowability characterization: Theory, methods, and applications. Annu. Rev. Food Sci. Technol. 2010, 1, 211–239. [Google Scholar] [CrossRef] [PubMed]
  6. McNeill, S.G.; Thompson, S.A.; Montross, M.D. Effect of moisture content and broken kernels on the bulk density and packing of corn. Appl. Eng. Agric. 2004, 20, 475. [Google Scholar] [CrossRef]
  7. Probst, K.V.; Ambrose, R.P.K.; Pinto, R.L.; Bali, R.; Krishnakumar, P.; Ileleji, K.E. The effect of moisture content on the grinding performance of corn and corncobs by hammermilling. Trans. ASABE 2013, 56, 1025–1033. [Google Scholar] [CrossRef]
  8. Kalivoda, J.R.; Jones, C.K.; Stark, C.R. Effect of ground corn fractionation on flowability. Appl. Eng. Agric. 2017, 33, 927. [Google Scholar] [CrossRef]
  9. Fitzpatrick, J.J.; Barringer, S.A.; Iqbal, T. Flow property measurement of food powders and sensitivity of Jenike’s hopper design methodology to the measured values. J. Food Eng. 2004, 61, 399–405. [Google Scholar] [CrossRef]
  10. Boukouvalas, C.J.; Krokida, M.K.; Maroulis, Z.B.; Marinos-Kouris, D. Density and porosity: Literature data compilation for foodstuffs. Int. J. Food Prop. 2006, 9, 715–746. [Google Scholar] [CrossRef]
  11. Ganesan, V.; Rosentrater, K.A.; Muthukumarappan, K. Flowability and handling characteristics of bulk solids and powders—A review with implications for DDGS. Biosyst. Eng. 2008, 101, 425–435. [Google Scholar] [CrossRef]
  12. Moreyra, R.; Peleg, M. Effect of equilibrium water activity on the bulk properties of selected food powders. J. Food Sci. 1981, 46, 1918–1922. [Google Scholar] [CrossRef]
  13. Braun, M.; Dunmire, K.; Evans, C.; Stark, C.; Woodworth, J.; Paulk, C. Effects of grinding corn with different moisture content on subsequent particle size and flowability. Processes 2021, 9, 1372. [Google Scholar] [CrossRef]
  14. Schulze, D. Powders and Bulk Solids; Springer International Publishing: Berlin/Heidelberg, Germany, 2021. [Google Scholar]
  15. Campbell, C.S. Granular material flows—An overview. Powder Technol. 2006, 162, 208–222. [Google Scholar] [CrossRef]
  16. Levy, A.; Kalman, C.J. Handbook of Conveying and Handling of Particulate Solids; Elsevier: Amsterdam, The Netherlands, 2001. [Google Scholar]
  17. Standard S424.1; Method of Determining and Expressing Particle Size of Chopped Forage Materials by Screening. ASABE: St. Joseph, MI, USA, 2017.
  18. Standard S319.4; Method of Determining and Expressing Fineness of Feed Materials by Sieving. ASABE: St. Joseph, MI, USA, 2017.
  19. USDA. Practical Inspection Procedures for Grain Handlers. 2016. Available online: https://www.ams.usda.gov/sites/default/files/media/PracticalProceduresBook2017.pdf (accessed on 28 March 2024).
  20. Jadhav, H.T.; Ozoh, C.; Marripudi, S.T.; Cao, X.; Rosentrater, K.A. Studies on Ground Corn Flowability as Affected by Particle Size and Moisture Content; ASABE Technical Paper No. 1701175; ASABE: St. Joseph, MI, USA, 2017. [Google Scholar] [CrossRef]
  21. Abdullah, E.C.; Geldart, D. The use of bulk density measurements as flowability indicators. Powder Technol. 1999, 102, 151–165. [Google Scholar] [CrossRef]
  22. Liu, K. Effects of particle size distribution, compositional and color properties of ground corn on quality of distillers dried grains with solubles (DDGS). Bioresour. Technol. 2009, 100, 4433–4440. [Google Scholar] [CrossRef] [PubMed]
  23. Bitzer, M.J.; Riddell, D.O. Corn Grades and Feed Value. Agriculture and Natural Resources Publications No. 35. 1984. Available online: https://uknowledge.uky.edu/anr_reports/35 (accessed on 28 March 2024).
  24. Bolaji, O.T.; Awonorin, S.O.; Sanni, L.O.; Shittu, T.A.; Adewumi, J.K. Modeling of particle size distribution and energy consumption of wet milled maize at varying soaking period and method in the production of Ogi. Part. Sci. Technol. 2019, 37, 94–102. [Google Scholar] [CrossRef]
  25. Drocas, I.; Marian, O.; Ranata, O.; Molnar, A.; Muntean, M. Determination of Specific Energy Consumption and Grain Size for Corn Grinding Using the Hammer Mill MB7, 5. Bulletin of University of Agricultural Sciences and Veterinary Medicine Cluj-Napoca. Agriculture 2014, 71, 381–382. [Google Scholar]
  26. Ibrahim, M.; Omran, M.; Abd EL-Rhman, E. Design and evaluation of crushing hammer mill. Misr J. Agric. Eng. 2019, 36, 1–24. [Google Scholar] [CrossRef]
  27. Armstrong, P.R.; Lingenfelser, J.E.; McKinney, L.E.L.A.N.D. The effect of moisture content on determining corn hardness from grinding time, grinding energy, and near-infrared spectroscopy. Appl. Eng. Agric. 2007, 23, 793–799. [Google Scholar] [CrossRef]
  28. Santomaso, A.; Lazzaro, P.; Canu, P. Powder flowability and density ratios: The impact of granules packing. Chem. Eng. Sci. 2003, 58, 2857–2874. [Google Scholar] [CrossRef]
  29. Lumay, G.; Boschini, F.; Traina, K.; Bontempi, S.; Remy, J.C.; Cllots, R.; Vandewalle, N. Measuring the flowing properties of powders and grains. Powder Technol. 2012, 224, 19–27. [Google Scholar] [CrossRef]
  30. Hoang, T.D.; Nghiem, N. Recent developments and current status of commercial production of fuel ethanol. Fermentation 2021, 7, 314. [Google Scholar] [CrossRef]
  31. Rausch, K.D.; Hummel, D.; Johnson, L.A.; May, J.B. Wet milling: The basis for corn biorefineries. In Corn; AACC International Press: St. Paul, MN, USA, 2019; pp. 501–535. [Google Scholar] [CrossRef]
  32. Hoffman, P.C.; Esser, N.M.; Shaver, R.D.; Coblentz, W.; Scott, M.P.; Bodnar, A.L.; Schmidt, R.; Charely, B. Influence of inoculation and storage time on alteration of the starch-protein matrix in high moisture corn. J. Dairy Sci. 2010, 93 (Suppl. 1), 726. [Google Scholar]
  33. Roessler, T.; Katterfeld, A. DEM parameter calibration of cohesive bulk materials using a simple angle of repose test. Particuology 2019, 45, 105–115. [Google Scholar] [CrossRef]
  34. Pachón-Morales, J.; Do, H.; Colin, J.; Puel, F.; Perré, P.; Schott, D. DEM modelling for flow of cohesive lignocellulosic biomass powders: Model calibration using bulk tests. Adv. Powder Technol. 2019, 30, 732–750. [Google Scholar] [CrossRef]
Figure 1. Ground grain emptying into standard container from the discharge funnel (left). Tapping procedure to achieve tapped density (right).
Agriengineering 06 00052 g001
Figure 2. Apparatus used to determine sliding angle and friction coefficient. Note that container was lifted so only processed grain was in contact with the surface (left). Measuring sliding angle using a digital inclinometer (right).
Agriengineering 06 00052 g002
Figure 3. Processed grain used to fill the space above the gate (left). Measuring the angle of repose for sloped pile (right).
Agriengineering 06 00052 g003
Figure 4. Cumulative undersize distribution for three treatments processed in the knife processor.
Agriengineering 06 00052 g004
Figure 5. Cumulative undersize distribution for three treatments processed in the hammermill with 3 mm openings and 40% open area.
Agriengineering 06 00052 g005
Figure 6. Cumulative undersize distribution for three treatments processed in the hammermill with 9.5 mm openings and 34% open area.
Agriengineering 06 00052 g006
Figure 7. Measured versus predicted bulk or tapped density (dry basis) for grain processed in the knife processor or hammermill.
Agriengineering 06 00052 g007
Figure 8. Cumulative undersize distribution for two grain treatments (F–High and U–Mid) processed in the hammermill using 6.4, 9.5, 12.7, or 19.1 mm screens during power requirement experiments.
Agriengineering 06 00052 g008
Figure 9. Geometric mean particle size versus net specific energy (dry basis) for processing two grain treatments (F–High and U–Mid) in a hammermill with various screen sizes. Error bars represent the standard error of the mean (n = 4).
Agriengineering 06 00052 g009
Table 1. Moisture content and geometric mean particle size for grain processed in knife processor or hammermill (average, n = 4).
TreatmentsMoisture Content (% w.b.)Geometric Mean Particle Size (mm)
Knife HammermillKnife Hammermill
ProcessorProcessor
Unfermented (U)
U–Low8.7 f8.7 e1.20 b0.45 a
U–Mid15.3 d14.7 d1.44 a0.49 a
U–High22.3 c22.4 c0.73 c0.29 cd
Fermented (F)
F–Low26.3 b26.5 b0.71 c0.32 bc
F–High37.1 a37.0 a0.48 d0.25 d
F–Dried12.2 e14.0 d0.72 c0.33 b
SEM [a]0.580.420.0150.008
p-value [a]<0.001<0.001<0.001<0.001
LSD [a]2.51.80.060.03
[a] Standard error of the mean. Within each column, lowercase markers indicate significant differences at p < 0.05 using Tukey’s comparisons. Least square difference (LSD) for p = 0.05.
Table 2. Geometric mean particle size (GMPS) for grain processed in a hammermill equipped with three different screen sizes (average, n = 4).
Treatment [a]MoistureGeometric Mean Particle Size [c] (mm)
Content [b]Hammermill Screen Size (mm)
(% w.b.)4.86.49.5
U–Low8.5 c0.62 b0.65 b0.81 a
F–Low23.7 b0.24 d0.26 cd0.35 c
F–High33.2 a0.21 d0.23 d0.28 cd
[a] Treatments were unfermented dry grain (U–Low), and moist, fermented grain (F–Low and F–High). [b] Lower case markers in this column indicate significant differences at p < 0.05 using Tukey’s comparisons. The SEM, p-value, and LSD were 0.06, <0.001, and 0.3, respectively. [c] Data analyzed as a full factorial. Across both columns and rows, lowercase markers indicate significant differences at p < 0.05 using Tukey’s comparisons. The SEM, p-value, and LSD were 0.020, <0.001, and 0.09, respectively.
Table 3. Bulk and tapped density on both a wet and dry basis for grain processed in the knife processor (average, n = 4).
Treatments [a]Density (kg⋅m−3)
BulkTappedHausnerCarr
Wet BasisDry BasisWet BasisDry BasisRatioIndex
Unfermented (U)
U–Low650 a594 a853 a780 a1.31 bc23.8 bc
U–Mid629 b537 b805 b697 b1.28 c21.8 c
U–High521 d400 d696 c533 c1.33 ab25.0 ab
Fermented (F)
F–Low475 f348 e621 e456 d1.31 bc23.5 bc
F–High510 e319 f654 d408 e1.28 c21.9 c
F–Dried570 c514 c779 b702 b1.37 a26.7 a
SEM [b]2.32.26.05.10.0100.58
p-value [b]<0.001<0.001<0.001<0.001<0.001<0.001
LSD [b]8826220.062.4
[a] Moisture content of the six treatments is found in Table 1. [b] Standard error of the mean. Within each column, lowercase markers indicate significant differences at p < 0.05 using Tukey’s comparisons. Least square difference (LSD) for p = 0.05.
Table 4. Bulk and tapped density on both a wet and dry basis for grain processed in the hammermill (average, n = 4).
Treatments [a]Density (kg⋅m−3)
BulkTappedHausnerCarr
Wet BasisDry BasisWet BasisDry BasisRatioIndex
Unfermented (U)
U–Low593 a543 a808 a739 a1.36 a26.5 a
U–Mid564 b479 b756 b645 b1.34 ab25.6 ab
U–High475 d364 d643 c492 c1.35 ab26.1 ab
Fermented (F)
F–Low418 e306 e546 d400 d1.31 bc23.5 bc
F–High480 d300 e614 c384 d1.28 c21.9 c
F–Dried536 c464 c741 b641 b1.38 a27.6 a
SEM [b]2.82.58.06.60.0100.58
p-value [b]<0.001<0.001<0.001<0.001<0.001<0.001
LSD [b]121034260.042.6
[a] Moisture content of the six treatments is found in Table 1. [b] Standard error of the mean. Within each column, lowercase markers indicate significant differences at p < 0.05 using Tukey’s comparisons. Least square difference (LSD) for p = 0.05.
Table 5. Coefficients from multiple regression with moisture content and particle size as independent variables predicting bulk or tapped density (dry basis) for grain processed in the knife processor or hammermill.
VariableKnife ProcessorHammermill
Bulk DensityTapped DensityBulk DensityTapped Density
Moisture Content Coef. [a]−8.0−12.4−6.9−10.7
S.E. [b]0.881.130.600.95
Particle Size Coef. [c]87.157.8381.1464.6
S.E.[b]25.4632.6665.4102.71
Intercept Coef.536.7794.3416.2605.2
S.E. [b]37.6448.2932.9051.66
R-Squared0.96250.96570.97660.9726
S.E. [c] of Regression29.6938.0921.1833.24
[a] Moisture content units were percent wet basis. [b] Standard error. The p-value for all coefficients was less than 0.001. [c] Geometric mean particle size units were in mm.
Table 6. Sliding angle and friction coefficient on stainless steel surface for grain processed in knife processor or hammermill (average, n = 4).
Treatments [a]Knife ProcessorHammermill
SlidingFrictionSlidingFriction
AngleCoefficientAngleCoefficient
(Deg) (Deg)
Unfermented (U)
U–Low 20.7 b0.38 b21.1 c0.39 c
U–Mid 17.8 b0.32 b17.8 d0.32 d
U–High 30.6 a0.59 a28.0 b0.53 b
Fermented (F)
F–Low 29.6 a0.57 a31.0 ab0.60 a
F–High 30.5 a0.59 a31.4 a0.61 a
F–Dried 19.7 b0.36 b19.6 cd0.36 cd
SEM [b]0.690.0150.680.014
p-value [b]<0.001<0.001<0.001<0.001
LSD [b]2.80.062.80.06
[a] Moisture content of the six treatments is found in Table 1. [b] Standard error of the mean. Within each column, lowercase markers indicate significant differences at p < 0.05 using Tukey’s comparisons. Least square difference (LSD) for p = 0.05.
Table 7. Discharge angle of repose for grain processed in knife processor or hammermill (average, n = 4).
Treatments [a]Discharge Angle of Repose (Deg)
KnifeHammermill
Processor
Unfermented (U)
U–Low 36.0 bc33.3 d
U–Mid 33.1 c33.7 cd
U–High 36.3 b39.7 ab
Fermented (F)
F–Low 40.8 a40.7 ab
F–High 43.4 a42.8 a
F–Dried 37.7 b37.2 bc
SEM [b]0.670.80
p-value [b]<0.001<0.001
LSD [b]3.03.4
[a] Moisture content of the six treatments is found in Table 1. [b] Standard error of the mean. Within each column, lowercase markers indicate significant differences at p < 0.05 using Tukey’s comparisons. Least square difference (LSD) for p = 0.05.
Table 8. Net specific energy requirements (dry basis) for processing two grain treatments in a hammermill configured with different screen sizes (average, n = 4).
Grain Treatments and Hammermill Screen Sizes [a]ThroughputNet Specific
Energy
Geometric Mean
Particle Size
(Mg DM/h)(kW-h/Mg DM)(mm)
U–Mid
6.4 mm4.94 a2.50 bc0.64 a
9.5 mm 4.36 a1.79 c0.78 a
F–High
9.5 mm2.19 b4.25 a0.30 b
12.7 mm 2.57 b3.51 ab0.36 b
19.1 mm 2.70 b1.61 c0.63 a
SEM [b]0.3420.3060.034
p-value [b]<0.001<0.001<0.001
LSD [b]1.461.300.10
[a] Moisture content of the U–Mid and F–High treatments was 14.9% and 34.6% (w.b.), respectively. [b] Standard error of the mean. Within each column, lowercase markers indicate significant differences at p < 0.05 using Tukey’s comparisons. Least square difference (LSD) for p = 0.05.
Disclaimer/Publisher’s Note: The statements, opinions and data contained in all publications are solely those of the individual author(s) and contributor(s) and not of MDPI and/or the editor(s). MDPI and/or the editor(s) disclaim responsibility for any injury to people or property resulting from any ideas, methods, instructions or products referred to in the content.

