1. Introduction
The global demand for food and agricultural products continues to surge, propelled by the expanding human population, posing significant challenges to soil health, atmospheric balance, and water resources [
1]. Meeting this demand sustainably necessitates solutions that not only bolster agricultural productivity in terms of land use but also optimize resource allocation. One effective strategy to enhance productivity involves the cultivation of high-vigor seeds [
2,
3,
4]. The quality of these seeds, influenced by genetic, physical, sanitary, and physiological factors, profoundly impacts crop development, thereby directly affecting yield potential across plant species [
5,
6].
Despite the reliability of traditional germination and vigor tests in meeting seed production standards, they often fall short in predicting seedling emergence under less favorable environmental conditions [
7]. Moreover, these tests can be time-consuming, costly, and offer limited insights into the internal state of the seed [
8]. Addressing this challenge, the assessment of internal seed morphology has emerged as a crucial approach for identifying issues related to seed physiological potential [
6,
9].
Recent research in the literature has explored various computational methods that correlate image-derived parameters with seed quality standards [
5,
10,
11]. Image analysis techniques provide non-destructive means to comprehend various aspects of seed development, establishing a connection between internal morphology and structural integrity [
8,
12,
13,
14]. This approach enables the determination of the physiological potential of seed lots. A well-established method for image acquisition relies on X-ray differential absorption by seed tissues, which varies with tissue thickness, density, composition, and radiation wavelength [
15]. This process involves exposing seeds to X-rays, creating a latent image on a photosensitive film [
6,
11]. However, despite the assistance of computational tools, the manual measurement of parameters contributing to seed vigor remains a challenge in seed image analysis.
In the pursuit of automation solutions, the recent literature has explored various computational methods for seed quality assessment. Cheng et al. [
7] combined low-field nuclear magnetic resonance (LF-NMR) spectral data and machine learning algorithms like Fisher’s linear discriminant (FLD) to accurately distinguish high- and low-vigor rice seeds. Cioccia et al. [
12] used laser-induced breakdown spectroscopy (LIBS) and machine learning algorithms like linear discriminant analysis (LDA) to evaluate the vigor of
Brachiaria brizantha seeds, achieving 100% accuracy in distinguishing high- and low-vigor seeds.
Moreover, recent advancements in computer vision, machine learning, and deep learning have gained considerable attention for seed quality evaluation [
4,
14,
16]. Convolutional neural networks (CNNs) have shown particular promise for image-based seed assessment by learning complex patterns from seed images which are difficult to discern by traditional methods [
11,
14,
16]. Wu et al. [
16] used a CNN model with a weighted loss function to detect rice seed vigor from hyperspectral images, achieving an impressive accuracy of 97.69%. Xu et al. [
14] introduced two CNN models (CNN-FES and CNN-ATM) for maize seed defect detection using hyperspectral imaging, outperforming traditional methods with over 90% accuracy and reaching 98.21% accuracy with feature wavelength modeling.
Here, we propose a method to automate the analysis of X-ray images of Brachiaria seeds (
Urochloa brizantha cv.
Xaraés) using YOLOv8 [
17], which employs Darknet53 as the CNN backbone feature extractor. We implement a post-processing method to make YOLOv8 robust to variations in rotation and scale. By subsequently processing the Darknet53-extracted features, the model can directly analyze X-ray images with multiple seed instances. We implement YOLOv8 with a post-segmentation module to segment seed images and derive quality descriptors based on internal morphology, providing a quick and non-destructive estimate of seed germination potential. The method is compared to traditional seed quality assessment techniques as well as recent advancements in computer vision and deep learning for comprehensive evaluation.
2. Materials and Methods
This section provides a comprehensive overview of the procedures undertaken to establish the seed image database and train the computer vision model employed for segmentation and classification.
2.1. Seeds
Brachiaria (
Urochloa brizantha cv.
Xaraés) stands out as an extensively cultivated forage grass globally [
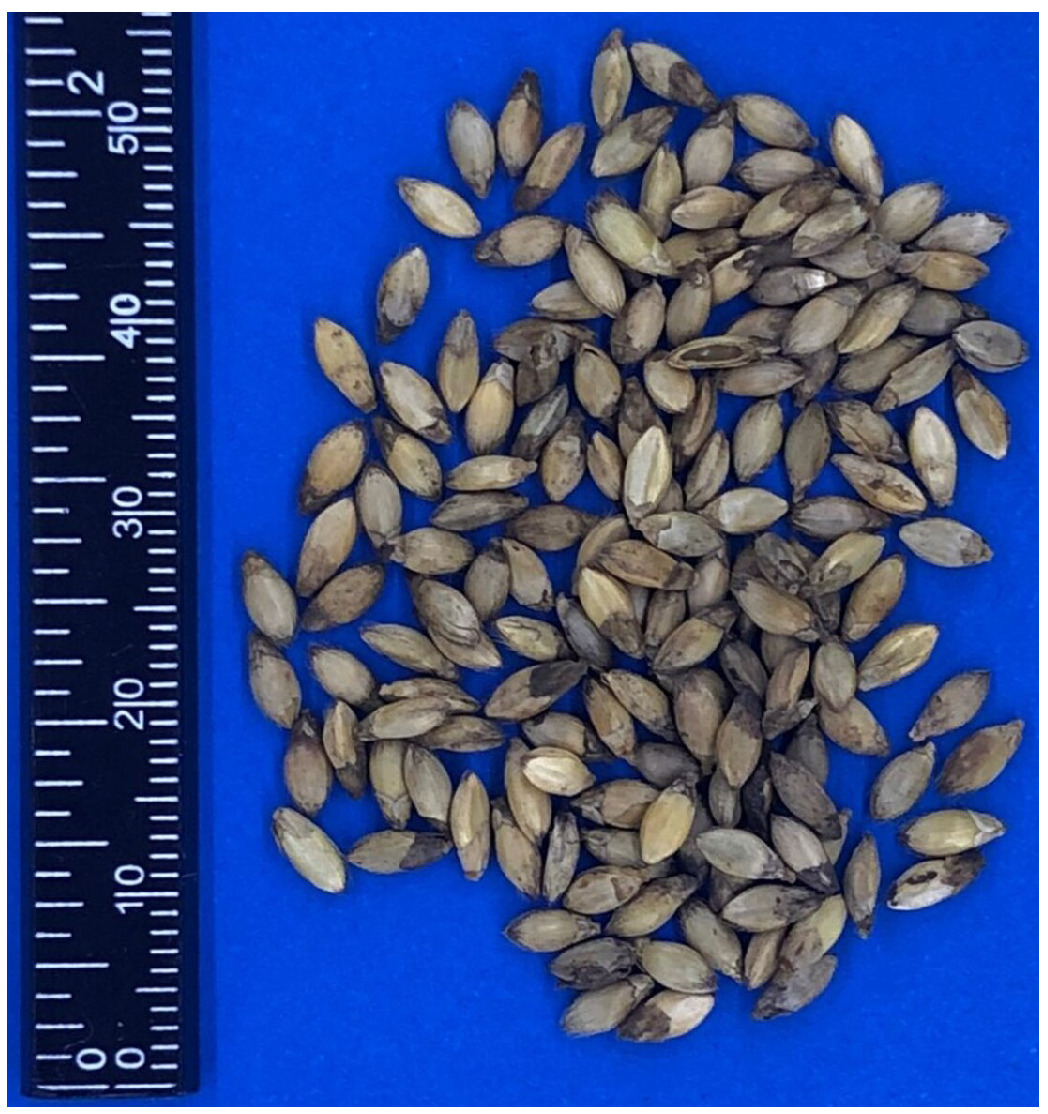
11], underscoring the substantial interest in automated seed quality assessment within the agricultural sector. In this study, random samples of Brachiaria seeds were utilized to capture radiographic images.
Figure 1 shows the modest size of these seeds during the inspection, emphasizing the necessity for an automated evaluation approach.
2.2. Dataset
For each set, we used ten sets of 20 seeds. These seeds were arranged on transparent plastic sheets and secured in place with double-sided adhesive tape. This setup ensured clear visualization of seed parts, including the embryo, endosperm, seed coat, and empty spaces. Subsequently, 30 images (each containing 20 seeds, as shown in
Figure 2) were saved on an external storage device for subsequent batch processing, resulting in a total dataset size of 600 radiographic images of seeds. We used Roboflow (
https://roboflow.com, accessed on 1 March 2024), a computer vision platform for dataset management, to prepare the training data. Additionally, traditional data augmentation techniques such as rotation and blur were applied to the bounding boxes of each seed.
In
Figure 2, radiographic images of
Urochloa brizantha seeds, cv.
Xaraes reveal crucial details of internal morphology. This allows for the assessment of characteristics such as low quality (#5, #15 and #19), poor formation (#4 and #11), and the presence of embryo damage (#17). These factors significantly impact seed lot quality, directly influencing germination.
For seed segmentation, a supervised training approach was employed. Using the Labelme (
https://github.com/labelmeai/labelme, accessed on 1 March 2024) tool, we labeled the 20 seeds in each image into two categories: seed and endosperm.
2.3. YOLOv8
To address the segmentation of regions of interest, we opted to employ the YOLOv8 model, renowned for its practical training approach and high accuracy. Developed by Ultralytics in late 2022, YOLOv8 is a member of the YOLO (You Only Look Once) series of object detection algorithms [
17], representing an improvement over its predecessor, YOLOv5. The architectural enhancements introduced in YOLOv8 focus on boosting both speed and accuracy, featuring a novel C2F module that replaces YOLOv5’s C3 module. This alteration results in the generation of more precise feature maps crucial for object detection.
The YOLOv8 architecture comprises three main components: the backbone network, neck network, and detection head. The backbone, based on CSPDarknet53, is responsible for extracting feature maps from the input image. The YOLOv8 model backbone network down-samples the image five times to obtain five layers of feature expressions (P1, P2, P3, P4, and P5), with Pi denoting a resolution of 1/2i of the original image. These feature expressions capture hierarchical representations of the input image at different scales, contributing to the model’s ability to detect objects of varying sizes. Concurrently, the neck network and main network leverage these feature expression maps to infer bounding boxes and object labels.
YOLOv8 offers various model sizes, such as yolov8n (nano), yolov8s (small), yolov8m (medium), yolov8l (large), and yolov8x (extra large). The size is directly proportional to mAP and inversely proportional to inference time. Additionally, YOLOv8 provides variations tailored for different tasks, including classification (cls), segmentation (seg), pose estimation (pose), and oriented object detection (obb). In our study, we utilized the yolov8n-seg version, designed for segmentation applications with a nano size.
During the training phase, our model utilized an augmented dataset, randomly split into 70% for training and 30% for testing. K-fold cross-validation was employed, dividing the image dataset into five sets for robust evaluation. The Ultralytics’ version X implementation of the model incorporated measures to prevent overfitting, including dropout for balancing network weights, early stopping at 50 training epochs, and weight transfer from pre-training on the COCO image dataset (
https://cocodataset.org, accessed on 1 March 2024). Training occurred at different epochs (500, 1500, and 3000) using the SGD optimizer, a learning rate of 0.01, and dynamic weight decay.
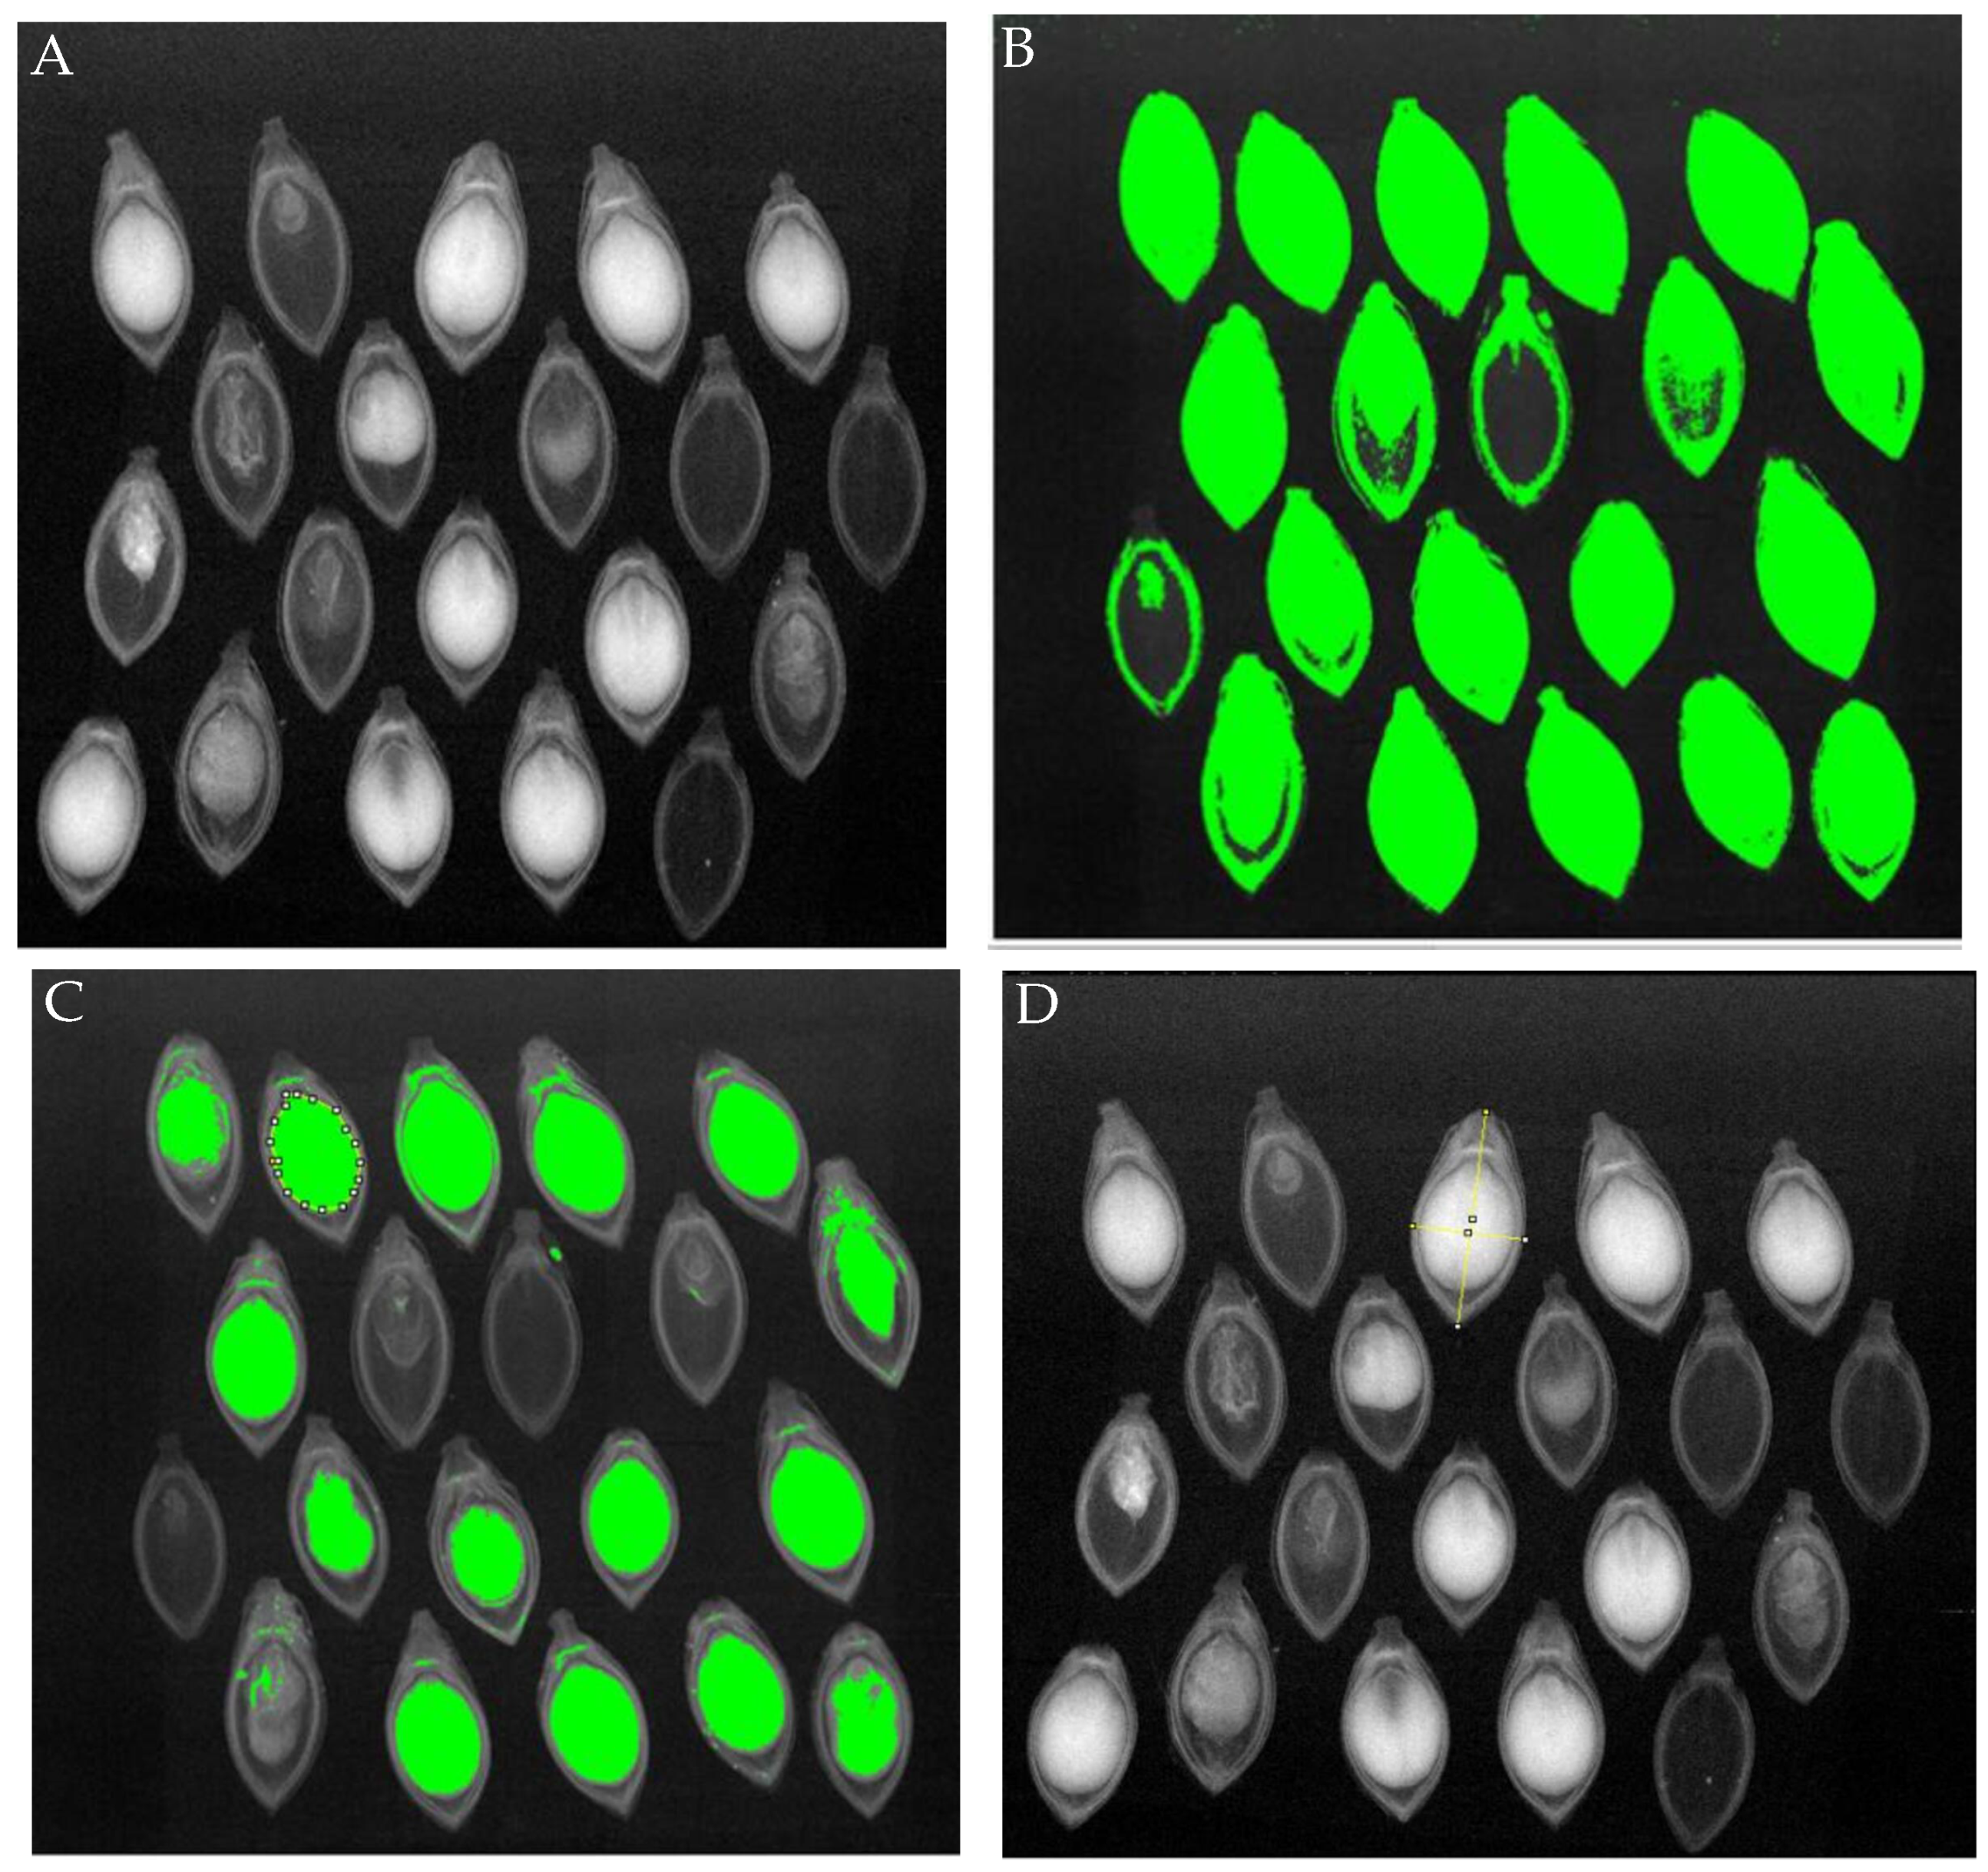
2.4. Human Analysis of Seed Vigor
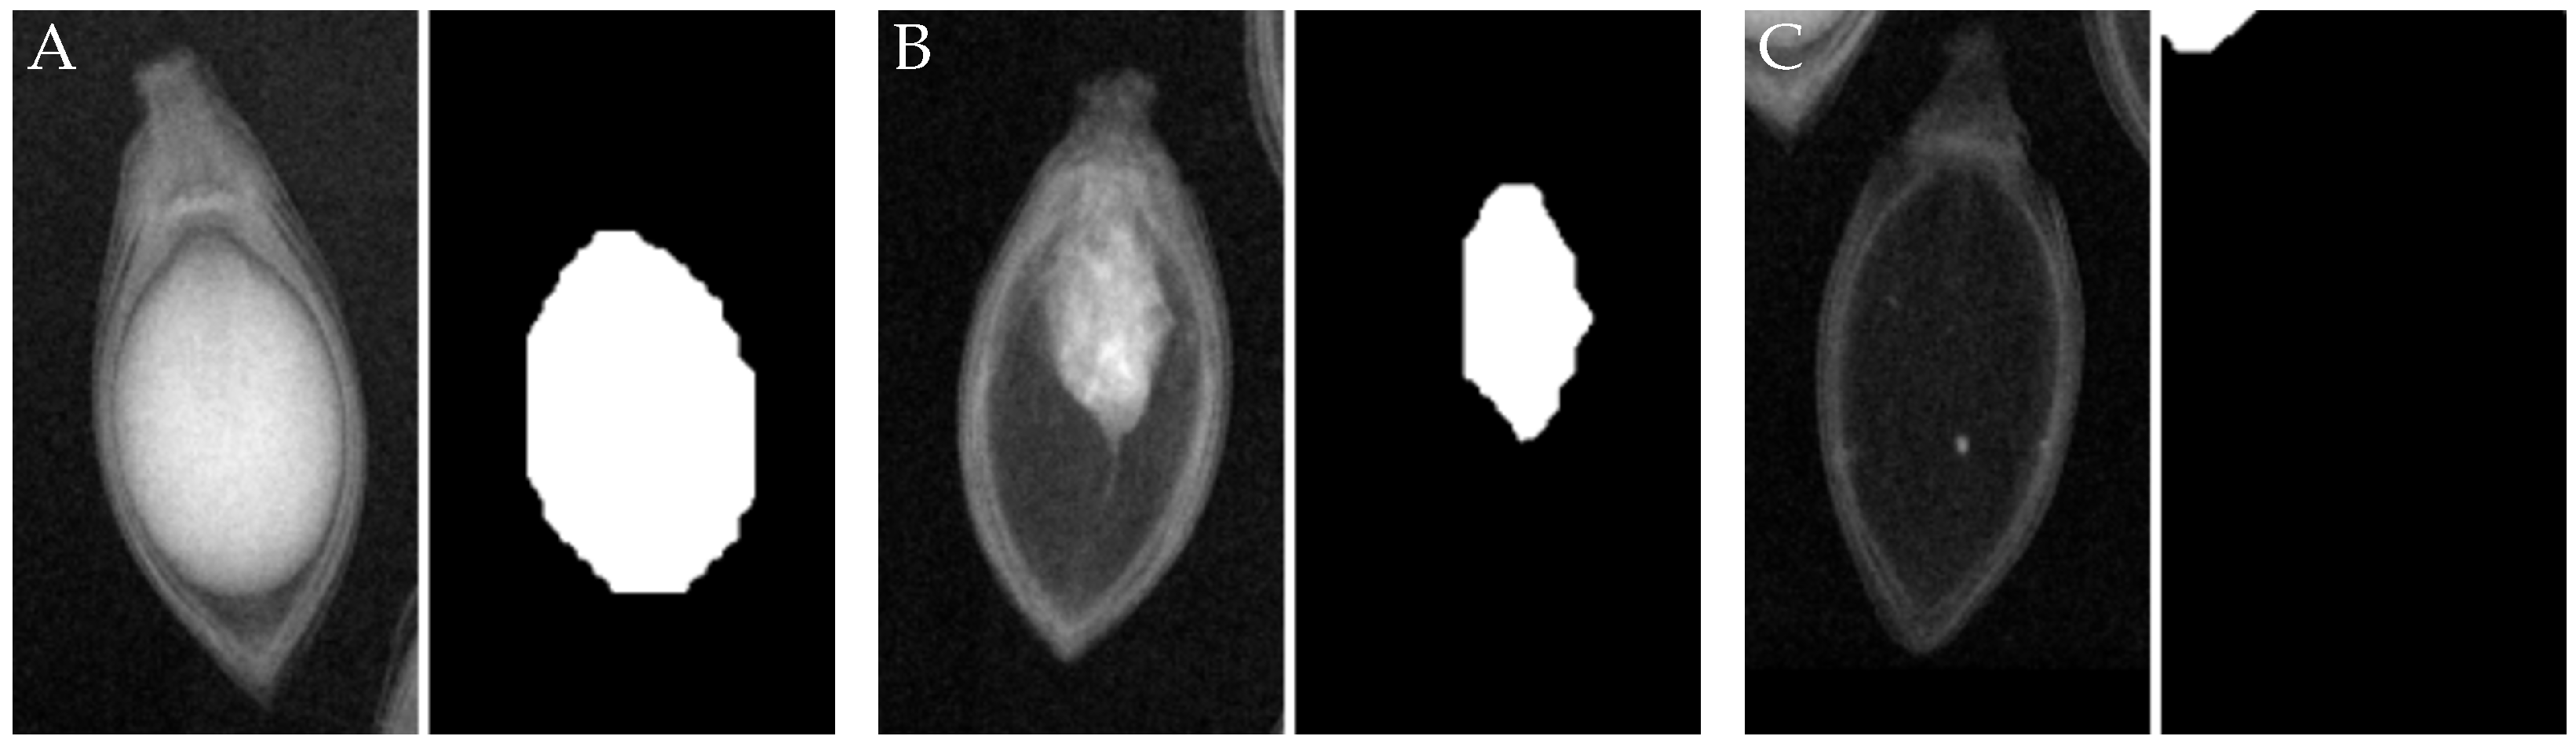
To validate the data obtained from our proposed method, images from the dataset (
Figure 3A) underwent human visual analysis. This analysis focused on studying the internal morphology of the seeds, identifying areas occupied by the seed (
Figure 3B) and endosperm (
Figure 3C), the internal area/total area ratio (mm
2), and the length and width of the seeds (
Figure 3D). Additionally, it included the detection of deteriorated tissues and malformations, characteristics that can lead to reduced germination.
Following the visual analysis, the germination test was conducted using the same seeds utilized in the X-ray test, maintaining the seed distribution order. Each batch underwent ten repetitions of 20 seeds. The germination test employed paper sheets premoistened with distilled water, equivalent to 2.5 times the mass of the dry substrate. Seed-containing paper rolls were placed in a BOD-type germinator with alternating temperatures of 15–35 °C and a photoperiod of 8 h of light and 16 h of darkness. Evaluations were conducted seven days after sowing, which is the established date for the first germination count [
18].
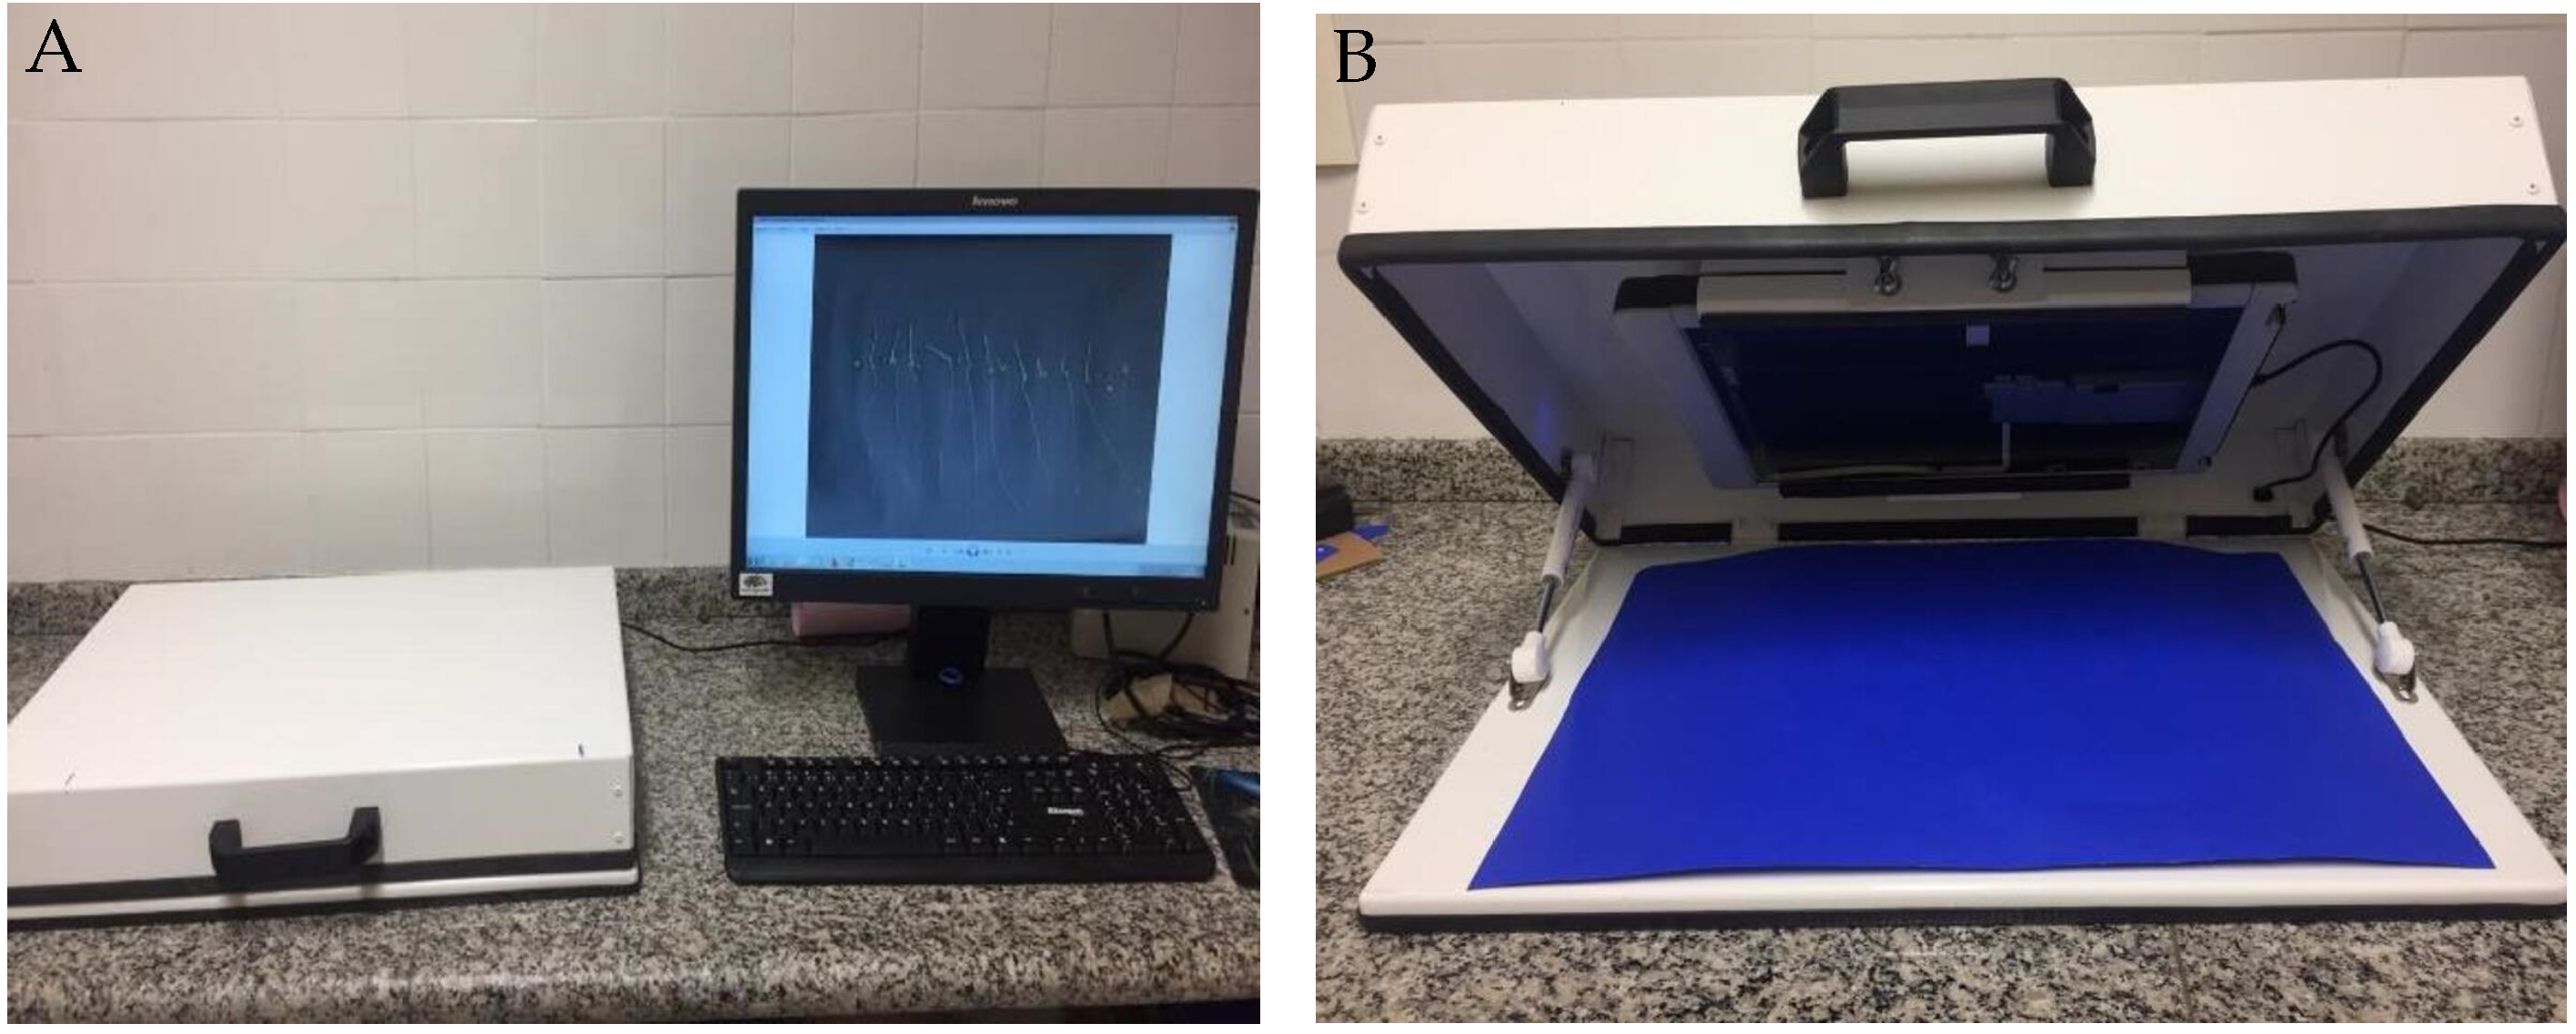
After seven days post-sowing, we transferred normal and abnormal seedlings, along with dead seeds, onto black A3 paper. We captured images using an HP Scanjet 2004 scanner, which was adapted in an inverted position within an aluminum box (refer to
Figure 4). The images were scanned at 300 dpi and stored for subsequent analysis.
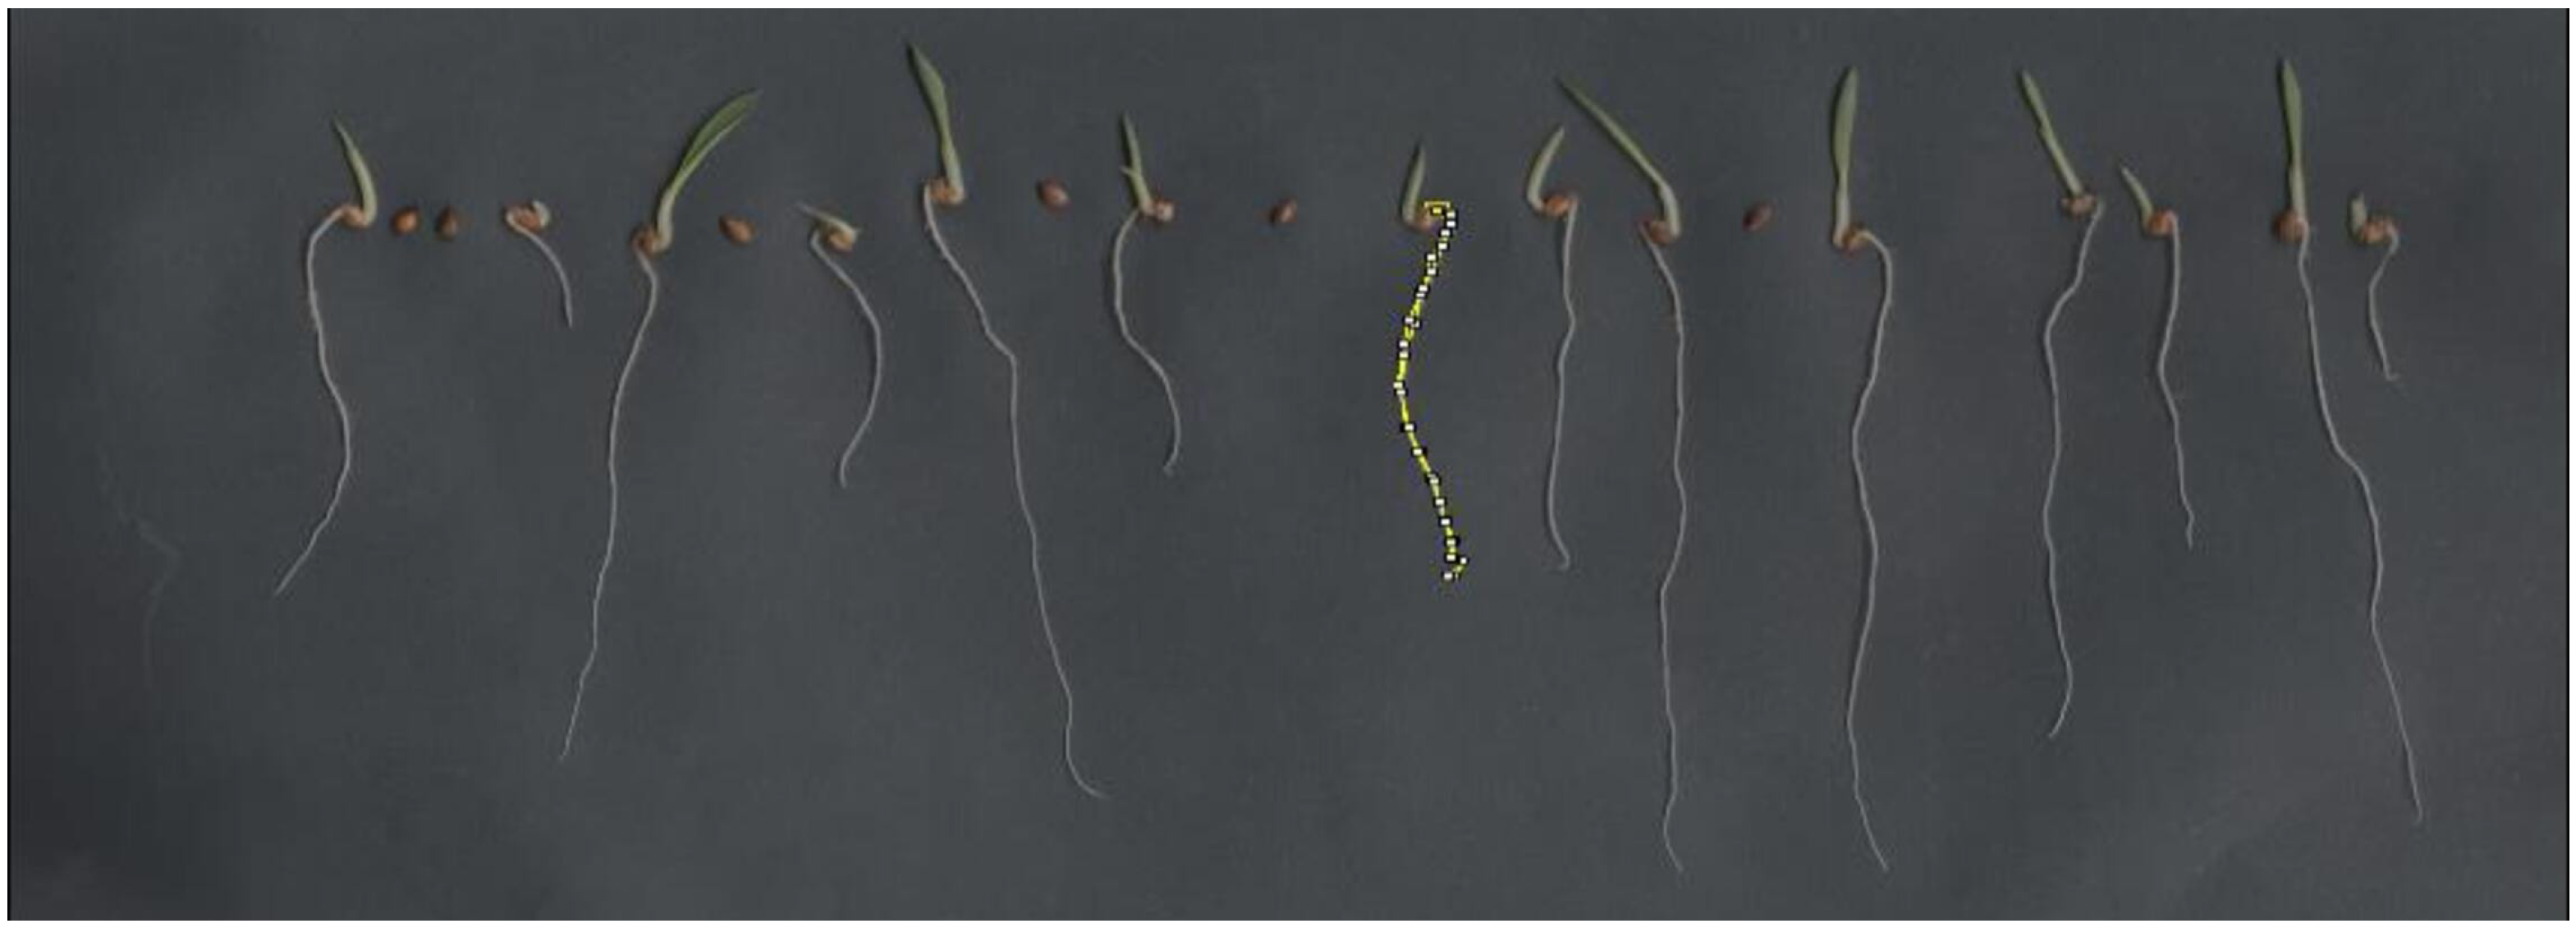
We individually measured the length of each seedling in millimeters (mm) using the ImageJ 1.8.0 software tool. This tool allowed us to outline specific parts of the analyzed material, highlighted in yellow at the center of
Figure 5.
Based on the frequency distribution of seed internal area, we established four classes, as follows:
Class I: Seeds with an internal area ranging from 0.391 to 1.667 mm2;
Class II: Seeds with an internal area ranging from 1.668 to 2.944 mm2;
Class III: Seeds with an internal area ranging from 2.945 to 4.221 mm2;
Class IV: Seeds with an internal area ranging from 4.222 to 5.497 mm2.
We used a dataset from an experimental design with an unbalanced completely randomized design (UCRD). For a seedling length variable
y, the data underwent transformation by applying
. This transformation was deemed necessary to facilitate parametric analysis of variance, especially if the homoscedasticity assumption was not met [
19]. The variables were subsequently analyzed using analysis of variance (ANOVA) at a 5% significance level. Variables exhibiting significant differences underwent Tukey’s test for mean comparison.
Table 1 presents the morphological characteristics of Brachiaria seeds, where means followed by the same letter (
a,
b,
c, or
d) in the same column are statistically similar to each other. The total seed area indicates that Class IV significantly differs from the other three classes in the Tukey test at a 5% significance level, with a value of 8.50 mm
2. Larger seeds can accommodate a greater endosperm area due to their size. A larger endosperm area provides more reserves for the germination process, thereby increasing the likelihood of germination.
The ratio of internal area to total area exhibited an increasing trend based on seed class. Class I had the smallest ratio, while Class IV had the largest. Seed length reached its peak in Class I (
Table 1), while the other classes had statistically similar seed lengths.
Examining seed length revealed that Class I had smaller seedlings, as the endosperm is the primary supplier of reserves needed for germination in Brachiaria seeds. The other classes did not differ significantly from each other. In summary, vigor increased with endosperm area classes. Larger endosperm areas indicate greater vigor, as reflected in seed length. Analyzing seed images through X-ray morphological studies and classifying seeds into different filling levels allows for the correlation of morphological characteristics with physiological potential. This highlights the importance of methods that automate this process, providing significant contributions to the seed industry.
2.5. Proposed Method
To evaluate the robustness of Brachiaria brizantha cv. Xaraés seeds using X-ray images, we introduced a post-segmentation module to the YOLO model. This module, known as the morphological analysis module (MAM), employs a digital image processing algorithm to compute various variables: total area (mm2), embryo and endosperm area (mm2), internal area/total area ratio (mm2), length (mm), and width of the seeds (mm).
The area is determined using Green’s theorem, implemented numerically in the OpenCV library (
https://opencv.org, accessed on 1 March 2024). Length and width are derived from the seed’s angle and the extreme limits of the rotated bounding box, obtained through OpenCV methods based on algorithms proposed by O’Rourke et al. [
20] and Klee and Laskowski [
21].
Since the measurements are initially in pixels or pixels2, the MAM converts these values to mm and mm2, respectively, by calibrating the measurement system with a reference measurement. In this calibration process, a known measurement of 3.5 mm is precisely marked on the X-ray images using a razor blade, serving as an object of reference. By precisely counting the pixels along this reference measurement, we establish the mm/pixels ratio for the images.
To obtain the mm/pixels ratio, the following formula is applied:
Subsequently, the ratio defined in Equation (
1) serves as a conversion factor, allowing us to determine the corresponding physical dimensions by simply multiplying the pixel count of a given measurement by the established mm/pixels ratio.
2.6. Experiment Analysis
For the experiment analysis, we adopted a randomized block design based on the divisions within the X-ray database. This approach aims to reduce bias or confounding factors that might influence our findings. Initially, we assessed the overall model performance by blocking based on the fold factor. However, for a more detailed evaluation at the class level, we maintained the randomized block design, still considering the fold, but this time stratifying by class.
To check the normality of the residuals, we conducted the Shapiro–Wilk test [
22]. For assessing the homogeneity of variances, we used the O’Neill–Mathews test [
23]. While the majority of the analyses in
Section 3 met the assumptions of normality and homogeneity of variances at the 5% significance level, a few did not comply with one or both assumptions. Therefore, for these cases, a non-parametric approach, specifically the Wilcoxon test [
24], was employed.
3. Results
We selected the YOLOv8 architecture due to its balanced performance in segmentation accuracy and efficient training times. Training the model on the seed X-ray dataset involved 500, 1500, and 3000 epochs, covering dataset sizes of 5, 15, and 30 combinations, respectively. This training was conducted utilizing an NVIDIA Tesla T4 GPU with the PyTorch framework.
3.1. Segmentation Performance
The YOLOv8 model achieved an impressive overall Average Precision (AP) of 97.3% in accurately segmenting seeds and endosperm in the X-ray images (refer to
Table 2). This signifies the correct delineation and classification of seed and endosperm regions in 97.3% of instances. For comprehensive insights into segmentation performance across training epochs and dataset sizes, please refer to
Table 2 and
Table 3.
On a per class basis, seeds exhibited a higher Average Precision (AP) compared to endosperm, achieving 98.9% versus 95.5%, respectively, after 3000 epochs (refer to
Table 3). Despite this slight discrepancy, the inference performance for endosperm remained notably high, with a minimum AP of 91.7% even after just 500 training epochs. This underscores the model’s adaptability in handling variability and visual ambiguities inherent in seed X-rays, particularly within the endosperm area, which tends to exhibit greater variability compared to the seed area (see
Figure 6).
Furthermore, the Tukey multiple comparison test revealed no statistically significant differences in AP metrics across varying epoch levels (), while maintaining a fixed dataset size. This observation indicates a stable performance and suggests appropriate convergence without overfitting, even when dealing with smaller training set sizes.
3.2. Seed Classification and Vigor Prediction
The segmented seed and endosperm areas obtained through the YOLOv8 model lay the foundation for an automated classification system for seed vigor levels, relying on internal morphology. The size of the endosperm, a crucial nutrient reserve for the embryo, serves as an indicator of germination potential.
Figure 6 shows the relationship between segmented seed and endosperm areas, with contour levels representing endosperm/seed area ratios—a potential indicator of seed quality. The majority of points fall within the 50–60% ratio range. Notably, no points surpass 70%, establishing an initial benchmark for high vigor classification.
Upon qualitative visual inspection (refer to
Figure 7), a clear and accurate alignment is evident between true seed/endosperm boundaries in X-ray images and segmentation masks predicted by YOLOv8. The model demonstrates proficiency in handling high appearance variation arising from internal structural ambiguities, rotations, and varying endosperm densities.
4. Discussion
The YOLOv8 model demonstrates impressive segmentation and classification performance even with limited dataset sizes. Given the challenges of compiling specialized agricultural data, the statistical similarity between 500, 1500, and 3000 training epochs suggests robust models that avoid overfitting. Notably, segmentation still reached 97.2% Average Precision (AP) when trained on just five seed X-ray images (refer to
Table 2).
This finding is comparable to a computer vision approach used to assess the viability of guavira treated seeds with tetrazolium salt [
25], which achieved better precision with 97.90% correct recognition for mucilage and 96.71% for lime. However, it relied on destructive tests. In a vigor test for rice seeds using computer vision techniques [
26], a new prediction model was introduced for non-destructive germination forecasting, achieving a high accuracy of 94.17%. This demonstrates that our results outperform other deep learning methods.
The 50–60% endosperm/seed area ratio range encompassing over 50% of samples (see
Figure 6) offers a clear indication for assessing the viability of seed lots. Although further physiochemical testing can refine categorical boundaries, this morphological indicator facilitates quick sorting and selective harvesting.
Deep learning, by automatically extracting spatial features predictive of germination, circumvents the need for extensive manual measurement while enhancing consistency compared to subjective human visual assessments.
Table 3 highlights the accuracy of endosperm identification and segmentation, reaching a maximum of 95.6% in 1500 epochs with 15 training images. The automatic extraction of interpretable morphological features from X-ray scans through deep learning enables swift and reproducible seed sorting without requiring specialized image analysis expertise. This method generalizes well across varying appearances, orientations, and shapes compared to template-matching approaches. Additionally, easy retraining allows for updates in biological classifications as expert knowledge evolves.
Our proposed approach offers several advancements over existing methods for seed quality assessment. Firstly, we utilize a deep learning-based model, YOLOv8, for automated seed segmentation and classification. As shown in
Table 4, most prior works rely on traditional machine learning techniques [
3,
13,
25,
27] without leveraging the representation learning capabilities of deep neural networks. By using the Darknet53 CNN backbone, our method can extract robust spatial features predictive of seed vigor levels.
Additionally, our solution provides a low-cost alternative suitable for batch analysis of seed lots, addressing limitations in techniques requiring expensive hyperspectral cameras [
3,
13,
16,
25,
28] or destructive biochemical testing [
27]. The use of widely accessible X-ray RGB imagery, correctly segmented over 95% of the time by YOLOv8, offers an affordable option for seed producers compared to hyperspectral imaging utilized in several related papers.
Finally, the non-destructive real-time assessment facilitated by our approach enables the rapid sorting of seed batches into categorical vigor levels with morphological indicators like endosperm size. This allows for selective harvesting and quality control prior to sowing. The automated measurement of morphological features through post-segmentation analysis demonstrates comparable or higher accuracy than existing methods, underlining the viability of our proposed computer vision pipeline for practical applications in the seed industry.
5. Conclusions
We recommend employing YOLOv8 for the study of the internal structure of Brachiaria brizantha cv. Xaraés seeds through X-ray images to evaluate seed vigor. YOLOv8, with an added post-segmentation module, facilitates obtaining quality descriptors for seed batches based on their internal morphology. This process automates the analysis of segmented images, replicating human visual analysis.
Our findings suggest that the proposed model performs well in segmenting and classifying despite having a relatively small dataset. It achieved up to 95.6% accuracy in identifying and segmenting the endosperm over 1500 epochs with just 15 training images. The endosperm/seed area ratio, specifically in the 50–60% range, which covers over 50% of the samples, offers a meaningful measure for assessing the viability of seed batches.
As a future step, we plan to develop a user-friendly web application. This application aims to be a valuable tool in agricultural engineering post-harvest processes. It will assist seed production companies by automatically categorizing seed batches, providing the market with options based on cost-effectiveness.

 ,
, 


