

An Effective and Affordable Internet of Things (IoT) Scale System to Measure Crop Water Use

Edisto Research and Education Center, Clemson University, Clemson, SC 29634, USA
AgriEngineering 2024, 6(1), 823-840; https://doi.org/10.3390/agriengineering6010047
Submission received: 24 December 2023
/
Revised: 20 February 2024
/
Accepted: 27 February 2024
/
Published: 13 March 2024
(This article belongs to the Topic Current Research on Intelligent Equipment for Agriculture)
Abstract
:Scales are widely used in many agricultural applications, ranging from weighing crops at harvest to determine crop yields to regularly weighing animals to determine growth rate. In agricultural research applications, there is a long history of measuring crop water use (evapotranspiration [ET]) using a particular type of scale called weighing lysimeters. Typically, weighing lysimeters require very accurate data logging systems that tend to be expensive. Recent developments in open-source technologies, such as micro-controllers and Internet of Things (IoT) platforms, have created opportunities for developing effective and affordable ways to monitor crop water use and transmit the data to the Internet in near real-time. Therefore, this study aimed to create an affordable Internet of Things (IoT) scale system to measure crop ET. A scale system to monitor crop ET was developed using an Arduino-compatible microcontroller with cell phone communication, electronic load cells, an Inter-Integrated Circuit (I2C) multiplexer, and analog-to-digital converters (ADCs). The system was powered by a LiPo battery, charged by a small (6 W) solar panel. The IoT scale system was programmed to collect data from the load cells at regular time intervals and send the data to the ThingSpeak IoT platform. The system performed successfully during indoor and outdoor experiments conducted in 2023 at the Clemson University Edisto Research and Education Center, Blackville, SC. Calibrations relating the measured output of the scale load cells to changes in mass resulted in excellent linear relationships during the indoor (r2 = 1.0) and outdoor experiments (r2 = 0.9994). The results of the outdoor experiments showed that the IoT scale system could accurately measure changes in lysimeter mass during several months (Feb to Jun) without failure in data collection or transmission. The changes in lysimeter mass measured during that period reflected the same trend as concurrent soil moisture data measured at a nearby weather station. The changes in lysimeter mass measured with the IoT scale system during the outdoor experiment were accurate enough to derive daily and hourly crop ET and even detect what appeared to be dew formation during the morning hours. The IoT scale system can be built using open-source, off-the-shelf electronic components which can be purchased online and easily replaced or substituted. The system can also be developed at a fraction of the cost of data logging, communication, and visualization systems typically used for lysimeter and scale applications.
1. Introduction
Different scales are used in agricultural applications for measuring crop yield, animal weight gain, crop inputs (i.e., fertilizer applications), etc. Weighing lysimeters, a particular type of scale system, are widely used in agricultural and hydrological research to measure crop evapotranspiration (ET). ET is the combined process of water evaporation from the soil surface and transpiration from plants, which is an essential component of the water cycle and plays a crucial role in the overall water balance of an ecosystem. There are many other ways to measure or estimate ET [1,2,3,4,5,6,7,8,9], but weighing lysimeters has long been considered the most accurate method [10] since lysimeters can accurately measure the changes in the total water mass of a fixed soil volume during a given time. A weighing lysimeter typically consists of a container with a known area equipped with electronic load cells or other weighing devices to measure changes in the lysimeter mass over time [11]. The container is typically buried in the ground, maintaining the soil and vegetation inside the container to simulate natural conditions as closely as possible. Weighing lysimeters are utilized under the working principle that changes in the lysimeter mass predominantly reflect the amount of water lost through ET. The water loss and ET rate during a given time can be obtained by continuously monitoring the total lysimeter mass. This method provides a direct and accurate measurement of ET, considering both the soil evaporation and plant transpiration processes.
Over the years, many lysimeters have been installed worldwide using various designs and installation systems [12,13,14,15,16,17,18,19,20,21,22,23]. ET data derived from lysimeter experiments have been used for many applications, such as studying the water requirements of different crops, evaluating the effectiveness of irrigation strategies, assessing the impact of climate change on ET patterns, and calibrating other methods and techniques for measuring and estimating ET [10,24]. However, one of the primary purposes of utilizing weighing lysimeters in agriculture has been to derive the crop coefficient (Kc) curves needed to estimate daily ET from weather data [2,25,26].
Although there is a long history of using weighing lysimeters for measuring ET, typically, the electronics for reading the lysimeter load cells include a data logger [21] that collects and stores the data onsite, requiring researchers to visit the site regularly to download and visualize the data stored in the data logger. However, data loggers that are accurate enough to collect lysimeter data tend to be expensive, and equipping them with data communication capabilities adds additional initial and ongoing costs. New developments in open-source microelectronics (i.e., Arduino, Raspberry Pi) and data communication systems (i.e., radio, cellular, Wi-Fi) provide new opportunities for enhancing data collection and data communication for lysimeters and other scale systems used in agricultural applications [27,28]. The availability of Internet-connected devices via developing and applying Internet of Things (IoT) systems can make weighing lysimeters more affordable and convenient [29,30]. IoT systems enable the collection and transmission of real-time information accessible from anywhere in the world via the Internet using a computer or smartphone.
The International Telecommunication Union (ITU) [31] regarded the IoT as a global infrastructure for the information society, enabling advanced services by interconnecting (physical and virtual) things based on existing and evolving interoperable information and communication technologies. The ITU also defined a device as a piece of equipment with the mandatory capabilities of communication and the optional capabilities of sensing, actuation, data capture, data storage, and data processing. In addition, other researchers [32] have suggested that in its simplest form, an IoT device is built around a microcontroller, a radio transceiver located above ground and with a more or less high communication range, a power source eventually recharged by a solar panel, and one or several connected sensors. Also, an additional component of an IoT system is the need for an Internet service to receive, store, organize, and display collected data. Initially, the IoT concept referred to devices and data transmission occurring above ground. The idea, however, has been expanded, and many researchers have been investigating applications with buried devices, giving rise to the Internet of Underground Things (IoUT) and wireless underground sensor network (WUSN) applications [32,33,34].
Interest is growing in technologies based on the Internet of Things (IoT) that provide means for researchers and farmers to find solutions for the better management of crop inputs (e.g., reducing the quantity and rate of fertilizers without sacrificing food production) [35]. A bibliometric review of the number of scientific publications relating IoT technologies and irrigation [36] found a steady increase in the number of publications on this subject from 2010 to 2016. This steady increase was followed by a rapid (i.e., exponential) increase in publications from 2016 to 2020. For example, a group of researchers in Portugal [35] developed an IoT system to monitor soil nutrients in horticulture, and another group [37] developed an IoT system to combine digital phenotyping with crop growth models. Their digital phenotyping included collecting data from a small lysimeter using an IoT system. Researchers in Brazil [38] developed an IoT system to monitor reference evapotranspiration (ETo) using a weighing lysimeter. Researchers in Pakistan [39] used derived reference evapotranspiration (ETo), combining machine learning with weather data collected with an IoT system. Researchers in India [30] developed an IoT system for monitoring a micro-lysimeter for a greenhouse application. Similarly, a group of researchers in Australia [40] developed an IoT system for monitoring Nitrate in water, and another group [41] developed an IoT system for automating irrigation using real-time weather and soil moisture data.
Although many researchers worldwide have used open-source electronics and the IoT for various applications in agriculture, including lysimetry, most of these applications have been developed utilizing Wi-Fi communication. However, the lack of Wi-Fi communication is an essential problem in many rural agricultural areas, which would limit the widespread application of IoT technologies in agriculture. In previous studies, our research team in the USA used open-source electronics to develop IoT systems for monitoring properties relevant to agricultural soil and water management and making the data available online in real-time using cell phone communication. For example, we designed three IoT systems for soil moisture monitoring [42,43,44] to assist growers in making more accurate and timely irrigation scheduling decisions based on real-time sensor data. Similarly, our team developed another IoT system to monitor agricultural runoff and collect water-quality samples from an agricultural field [45]. Therefore, building on our previous experience, this study aimed to create an affordable Internet of Things (IoT) scale system to measure crop ET. This study focused on building, testing, and describing the electronics needed for data collection and transmission. Although the IoT system was developed to measure crop ET in agriculture, the system could also be used for other types of scales used in domestic, agriculture, industry, and many other applications.
2. Materials and Methods
2.1. Design Requirements and General Functionality of the IoT Scale System
The basic design requirements for the IoT scale system were defined to (a) be relatively low cost (i.e., <USD 500); (b) be accurate (i.e., 24-bit resolution); (c) have low power requirements to continuously operate with a small LiPo battery (i.e., ≤2500 mAh), recharged by a small (i.e., ≤6 Watts) solar panel; (d) use cell-phone communication that could transmit data to the Internet even when deployed in remote locations; (e) use open-source electronics and off-the-shelf components that would be easy to obtain and substitute; (f) use an existing open-source IoT Internet platform to receive, store, and display the data in real time; and (g) be robust and reliable for long-term operation in outdoor applications.
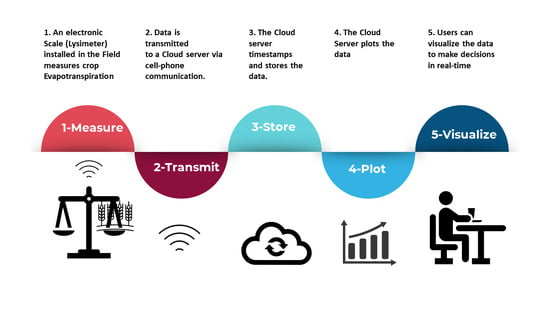
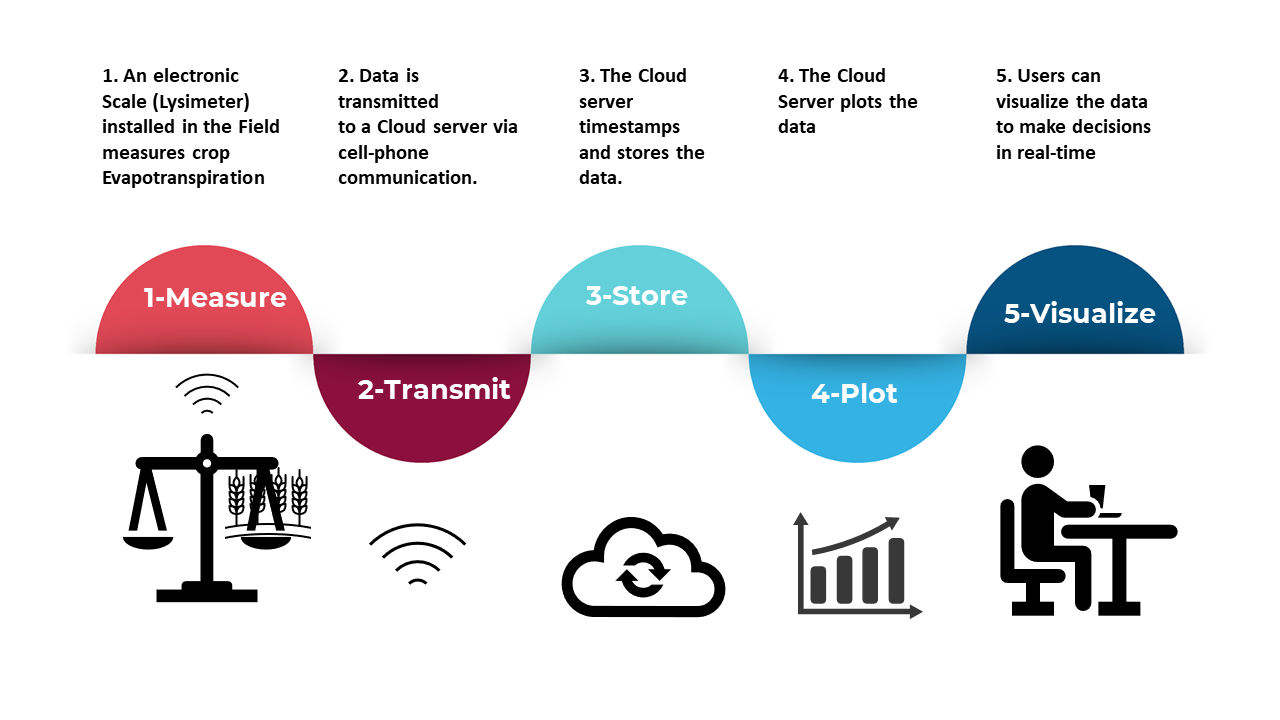
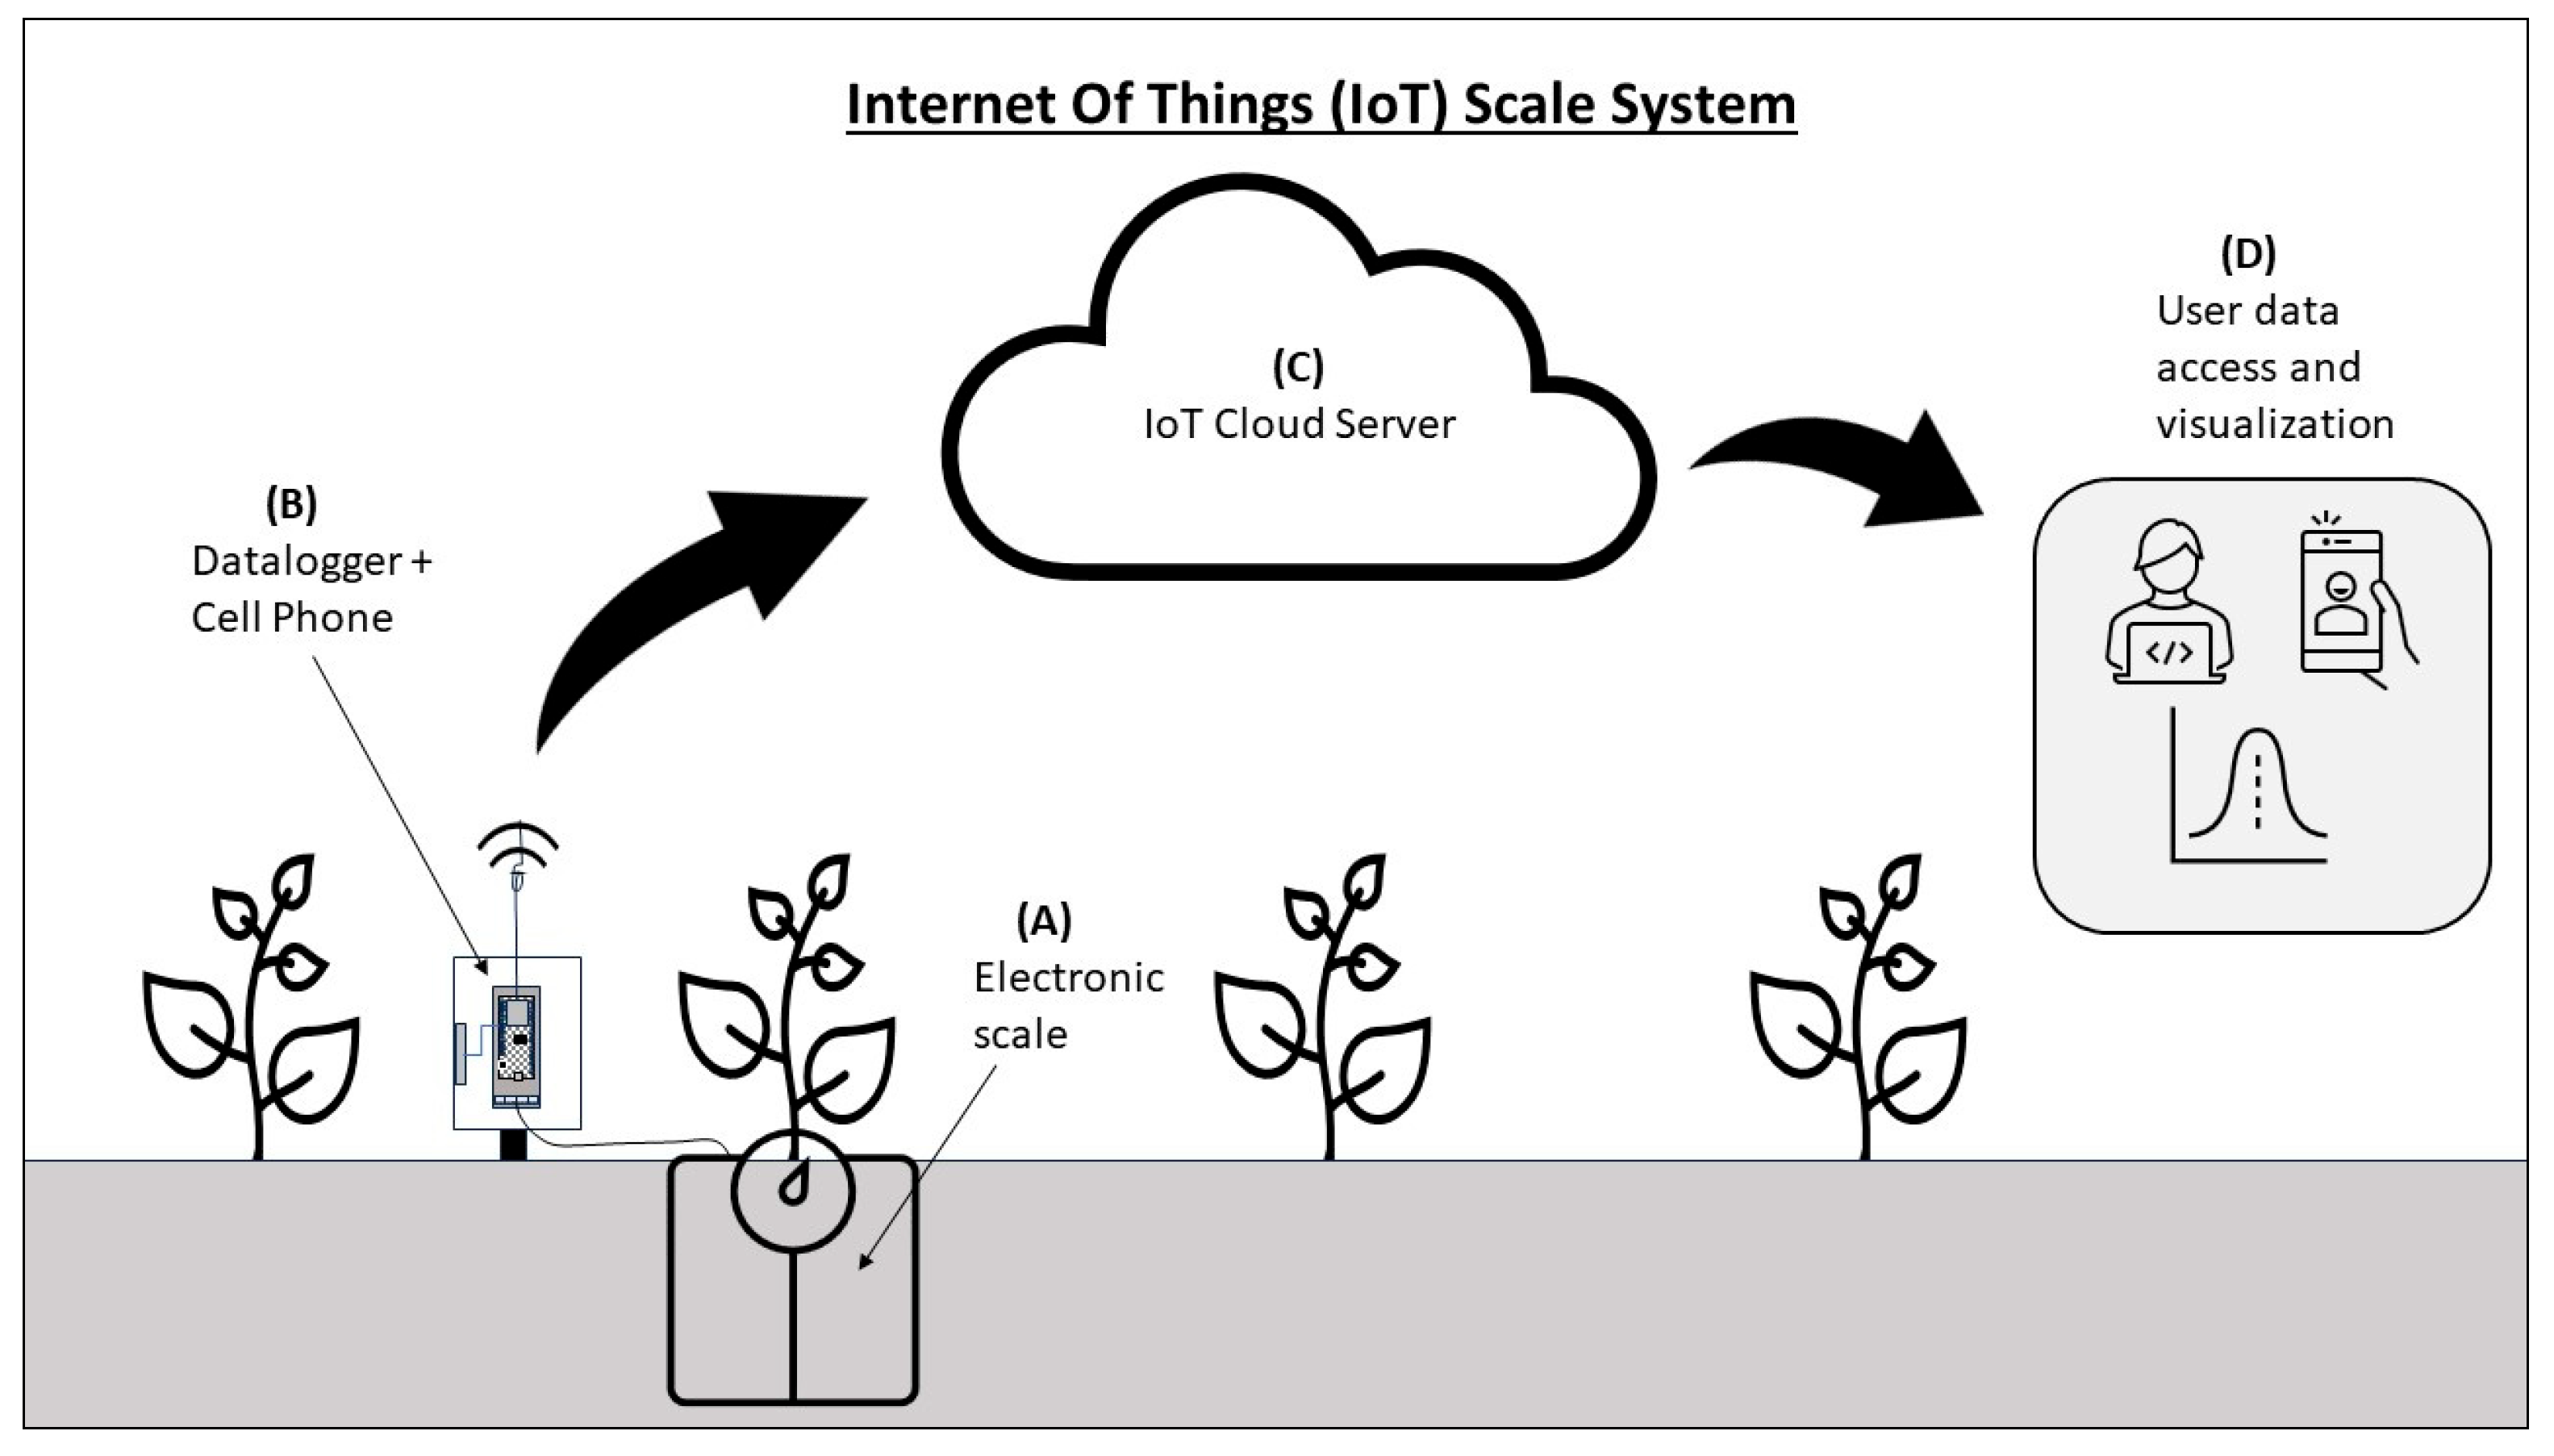
The general functionality of the IoT scale system is outlined in the diagram illustrated in Figure 1. It shows that the IoT scale system consisted of (A) an electronic scale, (B) a datalogger with cell phone communication, (C) an IoT Cloud server, and (D) user data access and visualization. The electronic scale was used to measure the mass of interest automatically. In the case of a lysimeter system, the scale would measure the changes in soil mass at regular time intervals. Changes in soil mass predominantly represented changes in soil water content, which could be used to calculate crop water use. Electronic scales typically use electronic load cells to measure mass. Electronic load cells produce a voltage output proportional to changes in the force or mass supported by the load cells, either in tension or compression. The datalogger was used to read the electronic scale at regular intervals (i.e., every 10 min), analyze and process the data, and send the data to an IoT Cloud server using cell phone communication. The IoT Cloud server was needed to receive, organize, timestamp, and store the data in a database. The user can access the data stored in the IoT server, which can be downloaded in “.CSV” format and visualized in graphical format.
2.2. Electronic Components
An IoT scale system was designed, constructed, and tested to meet the above requirements. The essential components for the IoT scale system consisted of four electronic load cells, a microcontroller, an Inter-Integrated Circuit (I2C) multiplexer, four analog-to-digital converters (ADCs), a terminal block breakout, a solar panel, a LiPo battery, and an instrument enclosure (Figure 2).
A Particle Boron LTE CAT-M1 (BRN404X) (Particle, San Francisco, CA, USA) device was used as the microcontroller to collect and transmit the data from the load cells to the Internet. The Particle Boron device combines a microcontroller (ARM Cortex-M4F 32-bit processor @ 64 MHz) with embedded cellular (LTE) and Bluetooth communication capabilities. The Particle Boron device also features, among other specifications, 20 mixed-signal GPIO pins (6 x Analog, 8 x PWM), UART, I2C, SPI, and an integrated LiPo battery charging circuity and connector. The Particle Boron device was mounted on an Adafruit terminal block breakout (Adafruit.com, Assembled Terminal Block Breakout FeatherWing for all Feathers, accessed on 20 October 2023) to facilitate connection to the GPIO, power, and data communication pins.
Four 100 kg capacity S-type load cells (Phidgets.com, accessed on 15 August 2023) with the technical specifications shown in Table 1 were used to measure changes in the mass of the scale system. Load cells convert changes in the mass of the scale into an analog voltage signal using a bridge circuit. There is usually an excellent linear relationship between the mass and the combined voltage output of the load cells [17]. Free-standing scale systems are typically designed using several load cells to account for imbalances and differences in load cell outputs resulting from differences in mass placement within the scale system.
An Adafruit NAU7802 24-Bit ADC-STEMMA QT/Qwiic was used for each load cell (www.adafruit.com, accessed on 10 January 2024) to provide regulated voltage excitation to the load cell and accurately convert the analog voltage output of the load cell into a digital output. STEMMA QT/Qwiic refers to a particular type of connector the ADC and other electronics use to facilitate connecting to external devices, like a microcontroller. The accuracy of conversion from the analog to digital signal is greatly affected by the number of bits of the ADC; the higher the number of bits, the higher the accuracy. The 24-bit ADC used here can divide the analog signal into 224 = 16,777,216 divisions. The digital output is transmitted to the microcontroller using an I2C serial communication protocol. The I2C protocol allows multiple slave devices (i.e., the NAU7802 24-Bit ADC) to be connected to a single master device (i.e., a microcontroller), and multiple masters can control a single or multiple slave devices. Connecting multiple slaves to a single master depends on each slave having a unique address. However, all the NAU7802 ADCs were manufactured with the same default I2C address (0x2A), which could not be changed, and the Boron device had only one I2C channel. This setup would only allow one NAU7802 ADC to be connected to the single I2C channel of the Particle Boron device. Therefore, an I2C multiplexer was used to expand the number of I2C channels on the Particle Boron device from one to eight (Adafruit PCA9548 8-Channel STEMMA QT/Qwiic I2C Multiplexer–TCA9548A Compatible). This arrangement allowed up to eight ADCs to be read sequentially with the same I2C address.
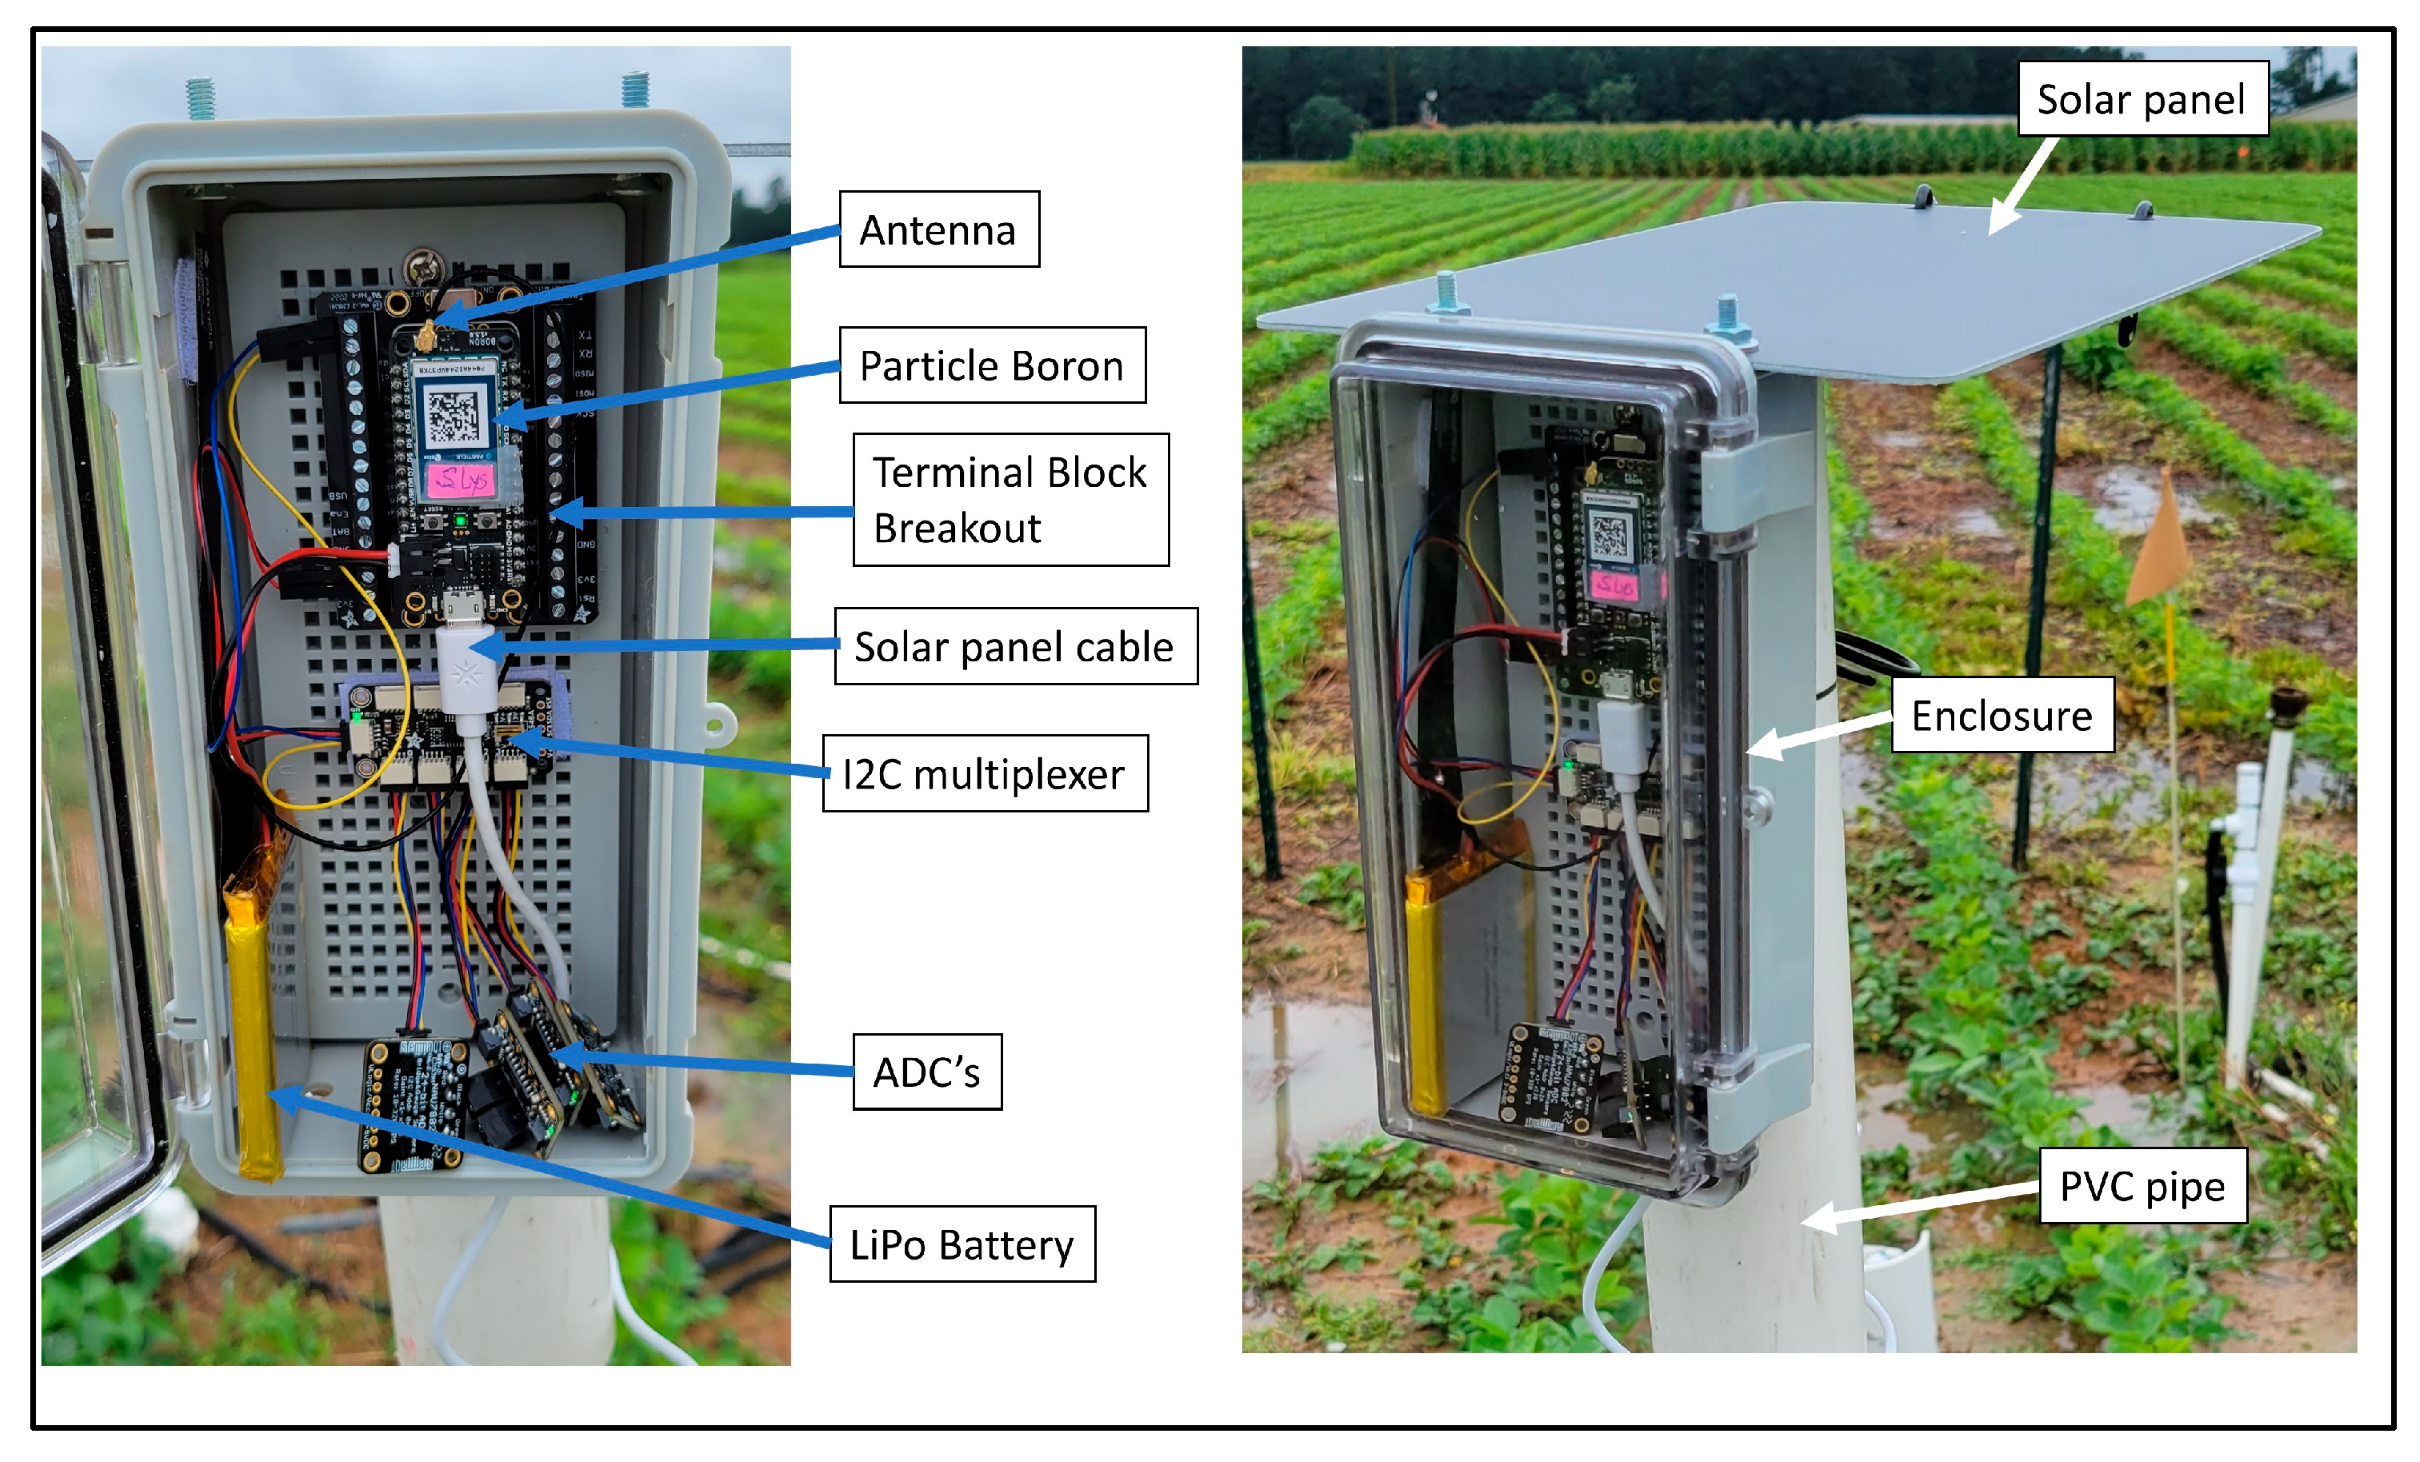
Power to the electronic components was supplied using a 3.7 V and 2500 mAh Lithium-ion polymer (LiPo) battery (Adafruit.com, accessed on 10 January 2024). The battery was charged using a monocrystalline mini solar panel (5 volts, 6 Watts). All the electronic components, except for the load cells and the solar panel, were housed in a plastic IP65 waterproof enclosure with dimensions of 200 × 100 × 70 mm (LMioEtool ABS). Images of the different components of the IoT scale system are shown in Figure 3.
Figure 4 and Figure 5 show the connections of the various electronic components and a view of the field installation of the IoT scale system, respectively. The I2C multiplexer was connected to the Particle Boron device via the terminal block breakout using a STEMMA cable. The STEMMA cable had a 4-pin connector at one end connected to the I2C multiplexer. The other end of the STEMMA cable had four wires with male headers connected to the Particle Boron device. Two wires were connected to the power supply (3V and GND) of the Particle Boron, and the other two were connected to the I2C pins (SCL and SDA). STEMMA cables with 4-pin connectors at both ends connected the four ADCs to channels 0 to 4 of the I2C multiplexer. Each of the load cells was connected directly to one of the ADCs. The LiPo battery was connected to the battery port, and the solar panel was connected to the micro-USB port of the Particle Boron (Figure 4 and Figure 5).
2.3. Internet of Things (IoT) System
The Particle Boron device was programmed to sample the four load cells at regular time intervals, make a few calculations, and send the data to the Cloud. The data were sent to the IoT Cloud server, ThingSpeak.com. ThingSpeak.com is an IoT analytics platform service that allows users to aggregate, visualize, and analyze live data streams in the Cloud. We selected ThingSpeak.com because we had already used this service for previous applications [42,43,44,45], we were familiar with it, and it offered all the needed features. Other researchers, such as [30,40], also used ThingsSpeak.com. However, other IoT services are available, and other researchers have used other services for similar projects. For example, ref. [38] used Google-sheet as the IoT Cloud service. Similarly, ref. [35] reported using the Kotlin Multiplatform Framework (KMM) and refs. [37,41] reported using the IoT application Node-RED.
The Particle Boron device was programmed using Particle Workbench, a professional tool built into Visual Studio Code to facilitate IoT development (https://www.particle.io/blog/particle-workbench-ga/, accessed on 15 October 2023). The code for the Particle Boron device included several external library files such as “Particle.h”, “Wire.h”, “Adafruit_NAU7802.h”, and “ThingSpeak.h.” The first three library files were needed for the Particle Boron device to communicate with and control the I2C multiplexer and the ADCs. The “ThingSpeak.h” library was needed to send the data to ThingSpeak™ (ThingSpeak.com). The Particle Boron was programmed to sample the four load cells and send the data to ThingSpeak.com every minute during the indoor part of the experiment and every 10 min during the outdoor experiment.
2.4. Indoor and Outdoor Experiments
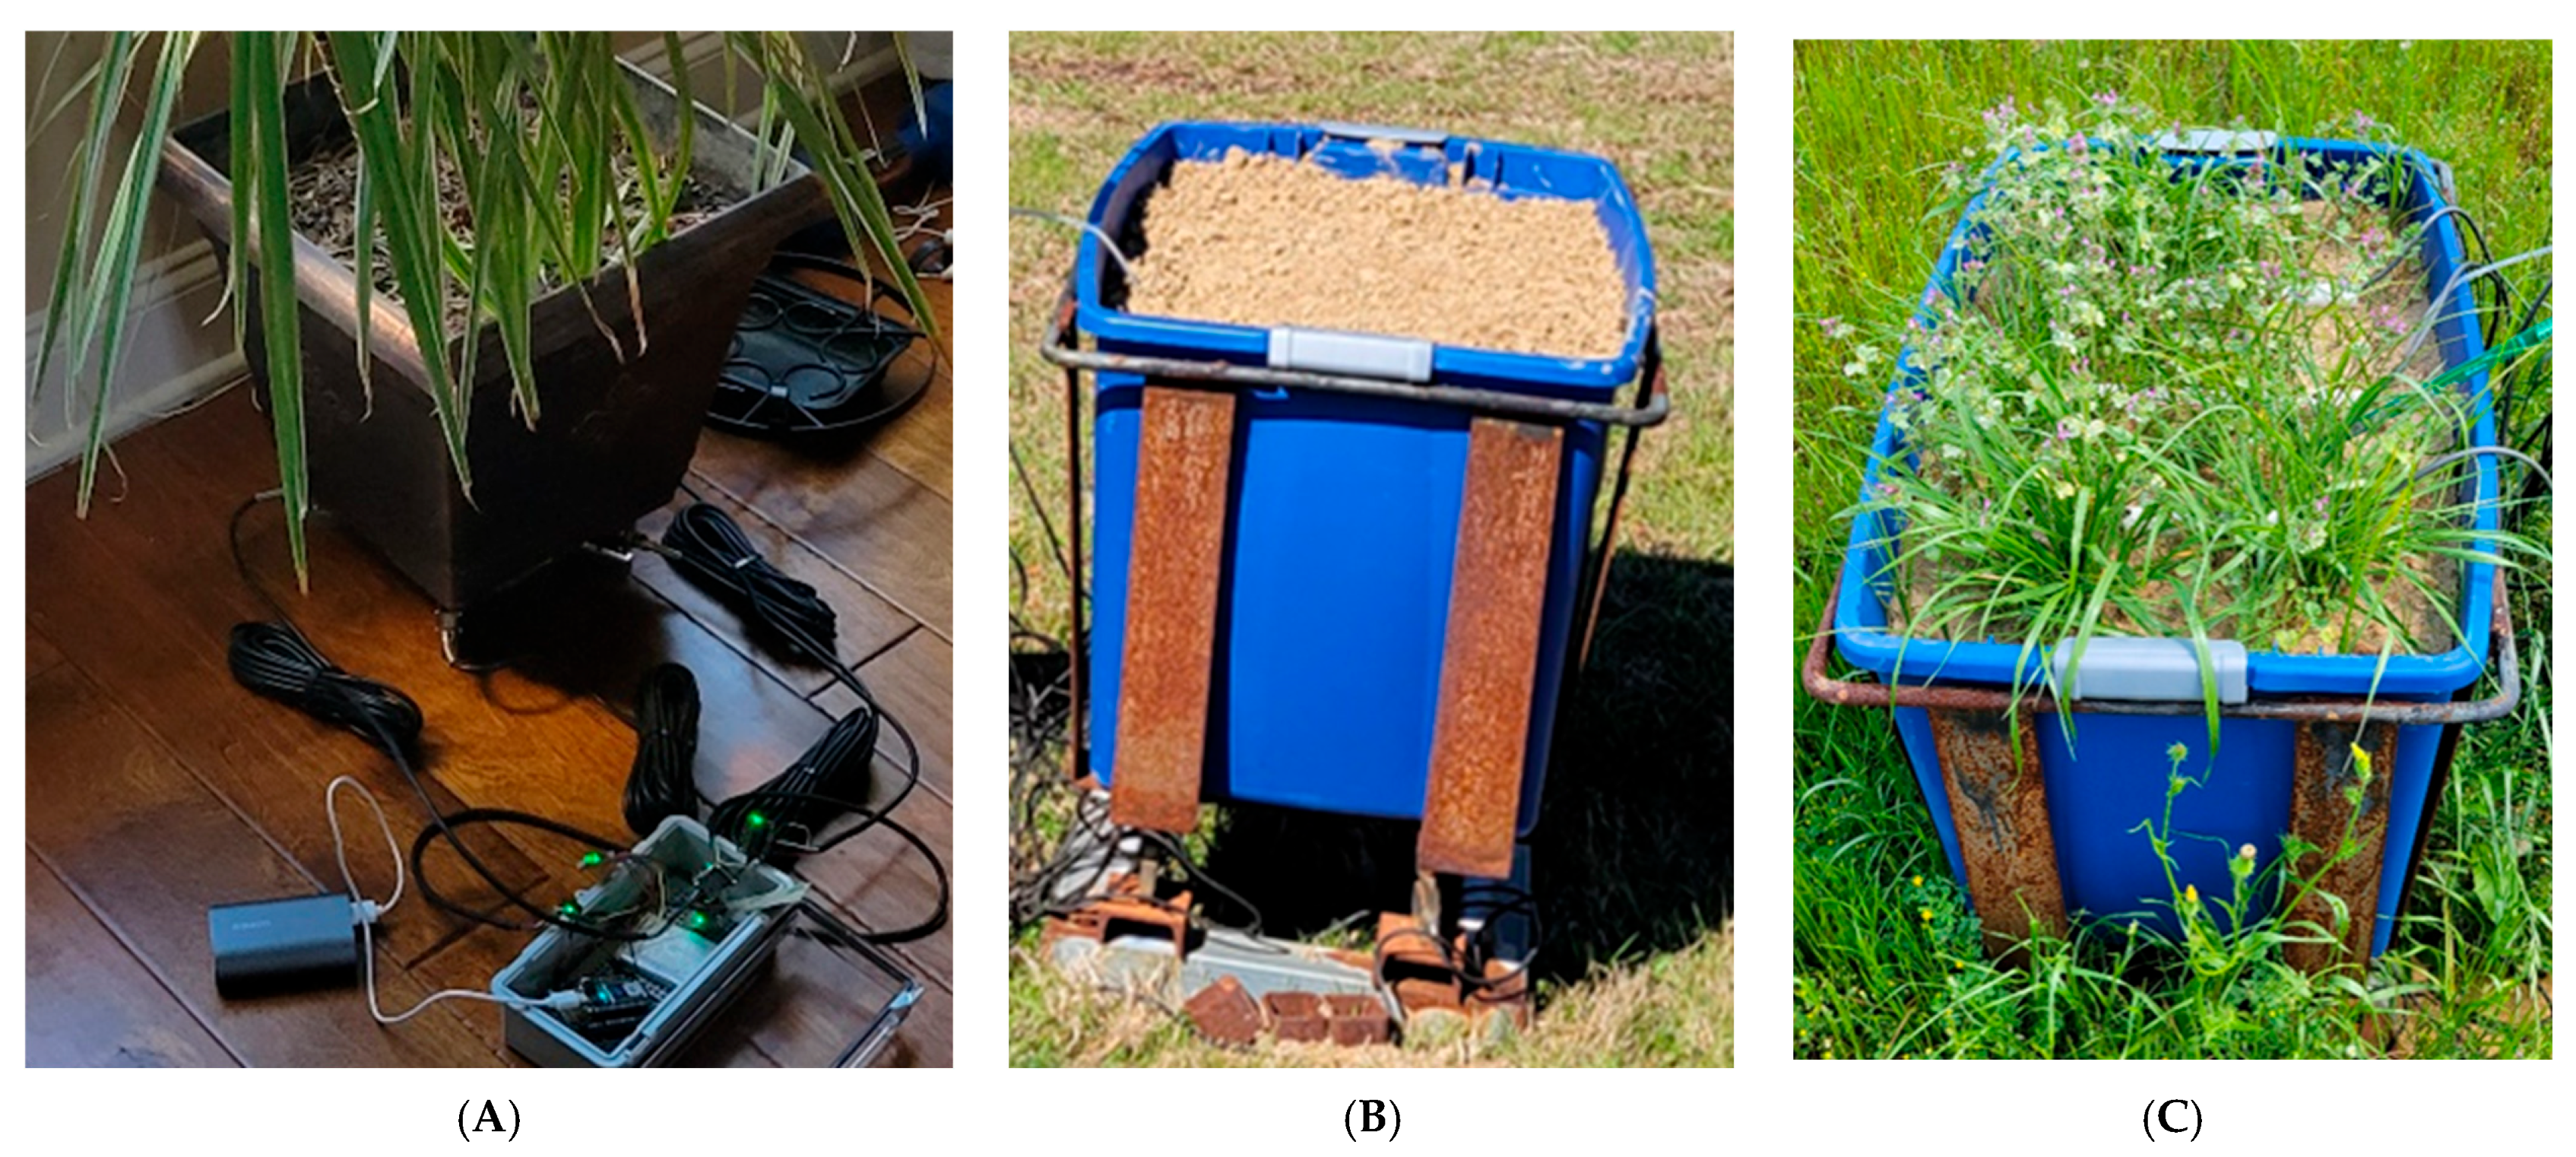
The performance of the IoT scale system was initially tested during an indoor experiment by placing the four load cells in each corner underneath a flowerpot (Figure 6A). The IoT system was used to measure the mass of the flowerpot every minute for two days. The indoor experiment was conducted to test the hardware, software, and data communication. Another purpose of this experiment was to evaluate if the scale system responded adequately to changes in mass by performing a calibration experiment and collecting data from the flowerpot.
Once the indoor experiment proved successful, a scale system was built to be deployed outdoors (Figure 6B) to continuously monitor soil water evaporation, simulating a weighing lysimeter’s operation. The system consisted of a steel frame supported by four load cells (one underneath each corner) containing a soil-filled plastic storage bin. The outdoor experiment was installed on 21 January 2023 in a grassy area at the edge of an agricultural field at the Clemson University Edisto Research and Education Center, Blackville, South Carolina. The IoT scale system was programmed to collect data every 10 min and send the data to ThingSpeak.com. The collected data included the output of each load cell, the total output (summing the output of the four load cells), and the total mass of the soil container (kg). The soil in the container was initially bare (Figure 6B), but weeds were allowed to grow inside the container (Figure 6C).
2.5. System Calibration
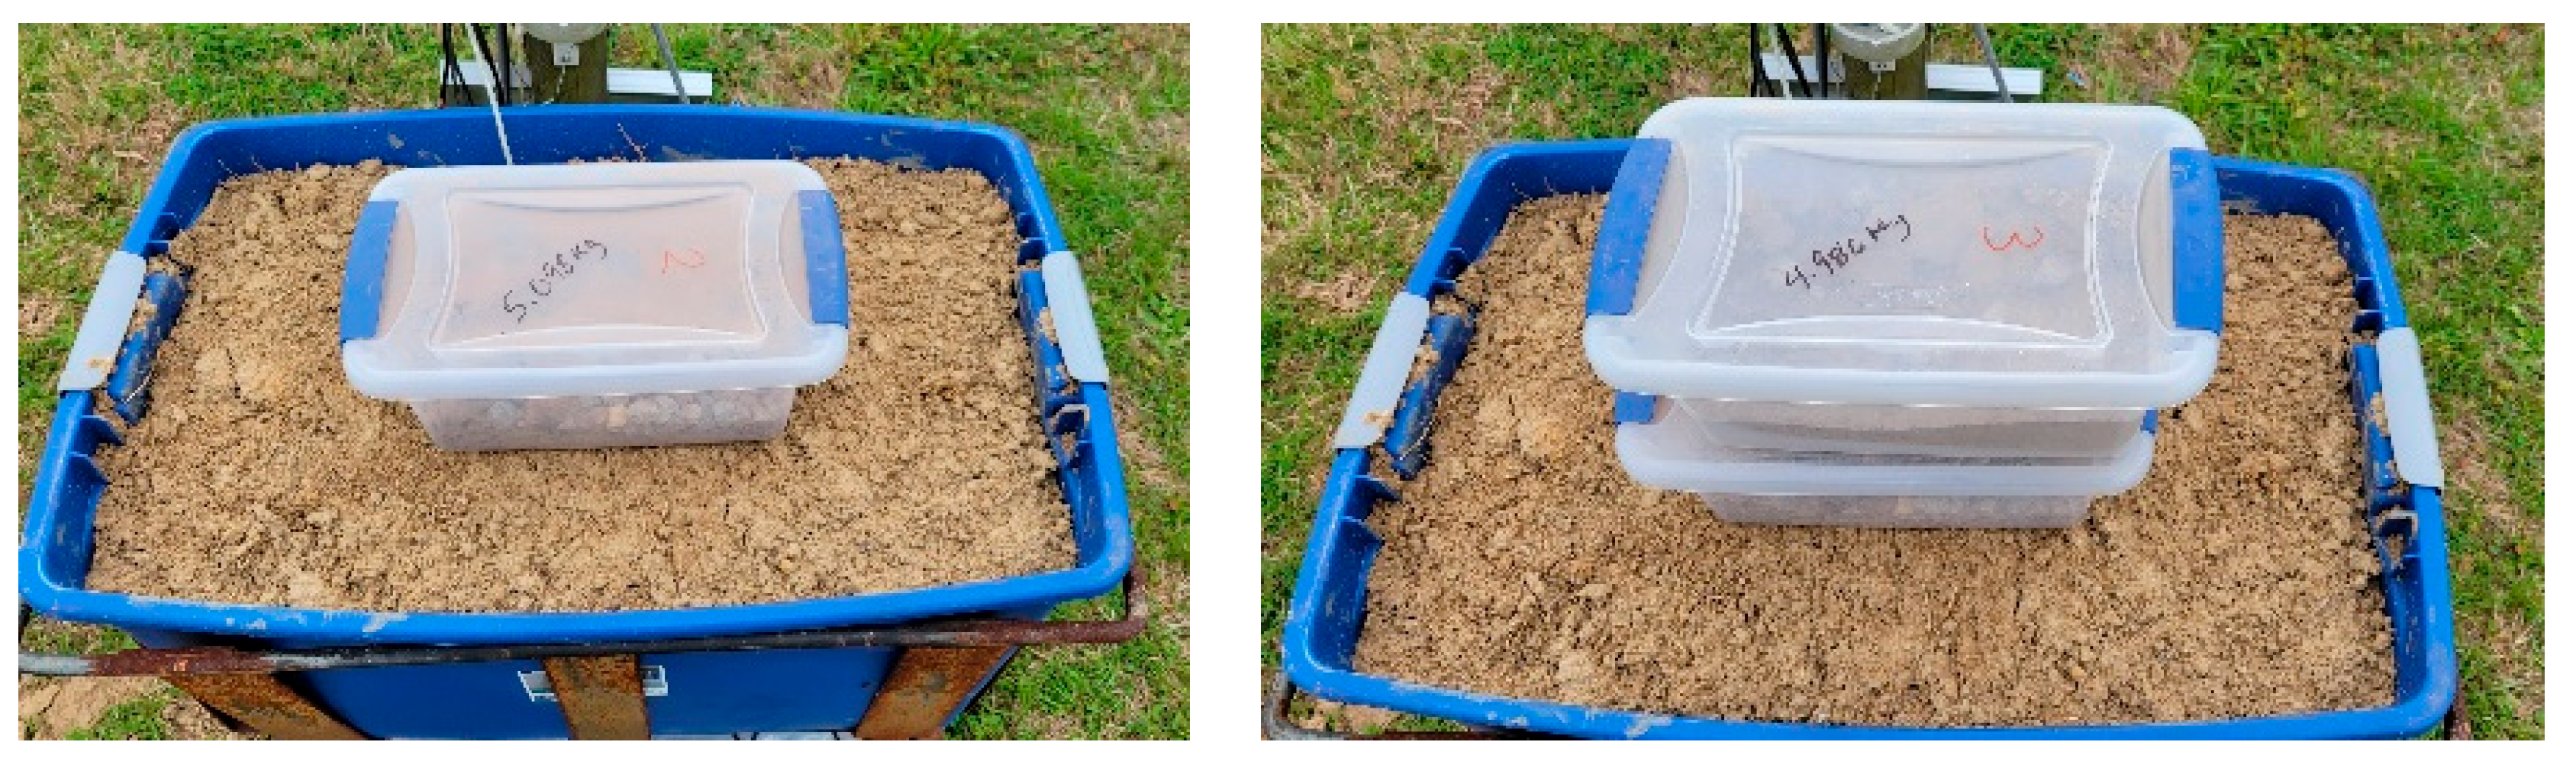
Load cells produce a very small voltage output that the ADC converts into an integer value. In this application, this integer had no intrinsic meaning and needed to be converted into mass (kg) to be useful. A calibration was conducted to convert the output of the ADC to mass (kg). The calibration consisted of sequentially adding objects of known mass (kg) to the scale system and recording the corresponding ADC output. The aim was to empirically develop an equation to convert the output into mass (kg). The initial calibration was conducted during the indoor experiment phase on 15 January 2023. A similar calibration was also performed during the outdoor experiment on 24 February 2023 (Figure 7). For the indoor calibration, the objects of known mass were books previously weighed using an electronic kitchen scale (Model EK9710, 5 kg capacity). For the outdoor calibration, sealed plastic containers were filled with dry sand and weighed using an electronic compact bench scale (Ohaus, Model Ranger 3000, 30 kg capacity). Each container was filled to weigh around 5 kg. The linear regression equation resulting from the calibration was used to convert the load cell output to mass (kg). The lysimeter mass was converted into its equivalent depth of evapotranspiration water (mm) based on the surface area of the lysimeter container (Figure 7) (mm of water = kg of water/m2).
2.6. Weather and Soil Moisture Data
Daily weather and soil moisture data for the research site were obtained from a weather station at the Edisto Research and Education Center. The station is part of the National Oceanic and Atmospheric Administration (NOAA) National Weather Service. It is located at a linear distance of around 800 m from where the outdoor experiment was conducted. The data obtained from the weather station for this study included precipitation, air temperature (maximum and minimum), mean relative humidity, solar radiation, and soil moisture at three soil depths (5, 10, and 20 cm).
3. Results and Discussion
3.1. Calibration Results
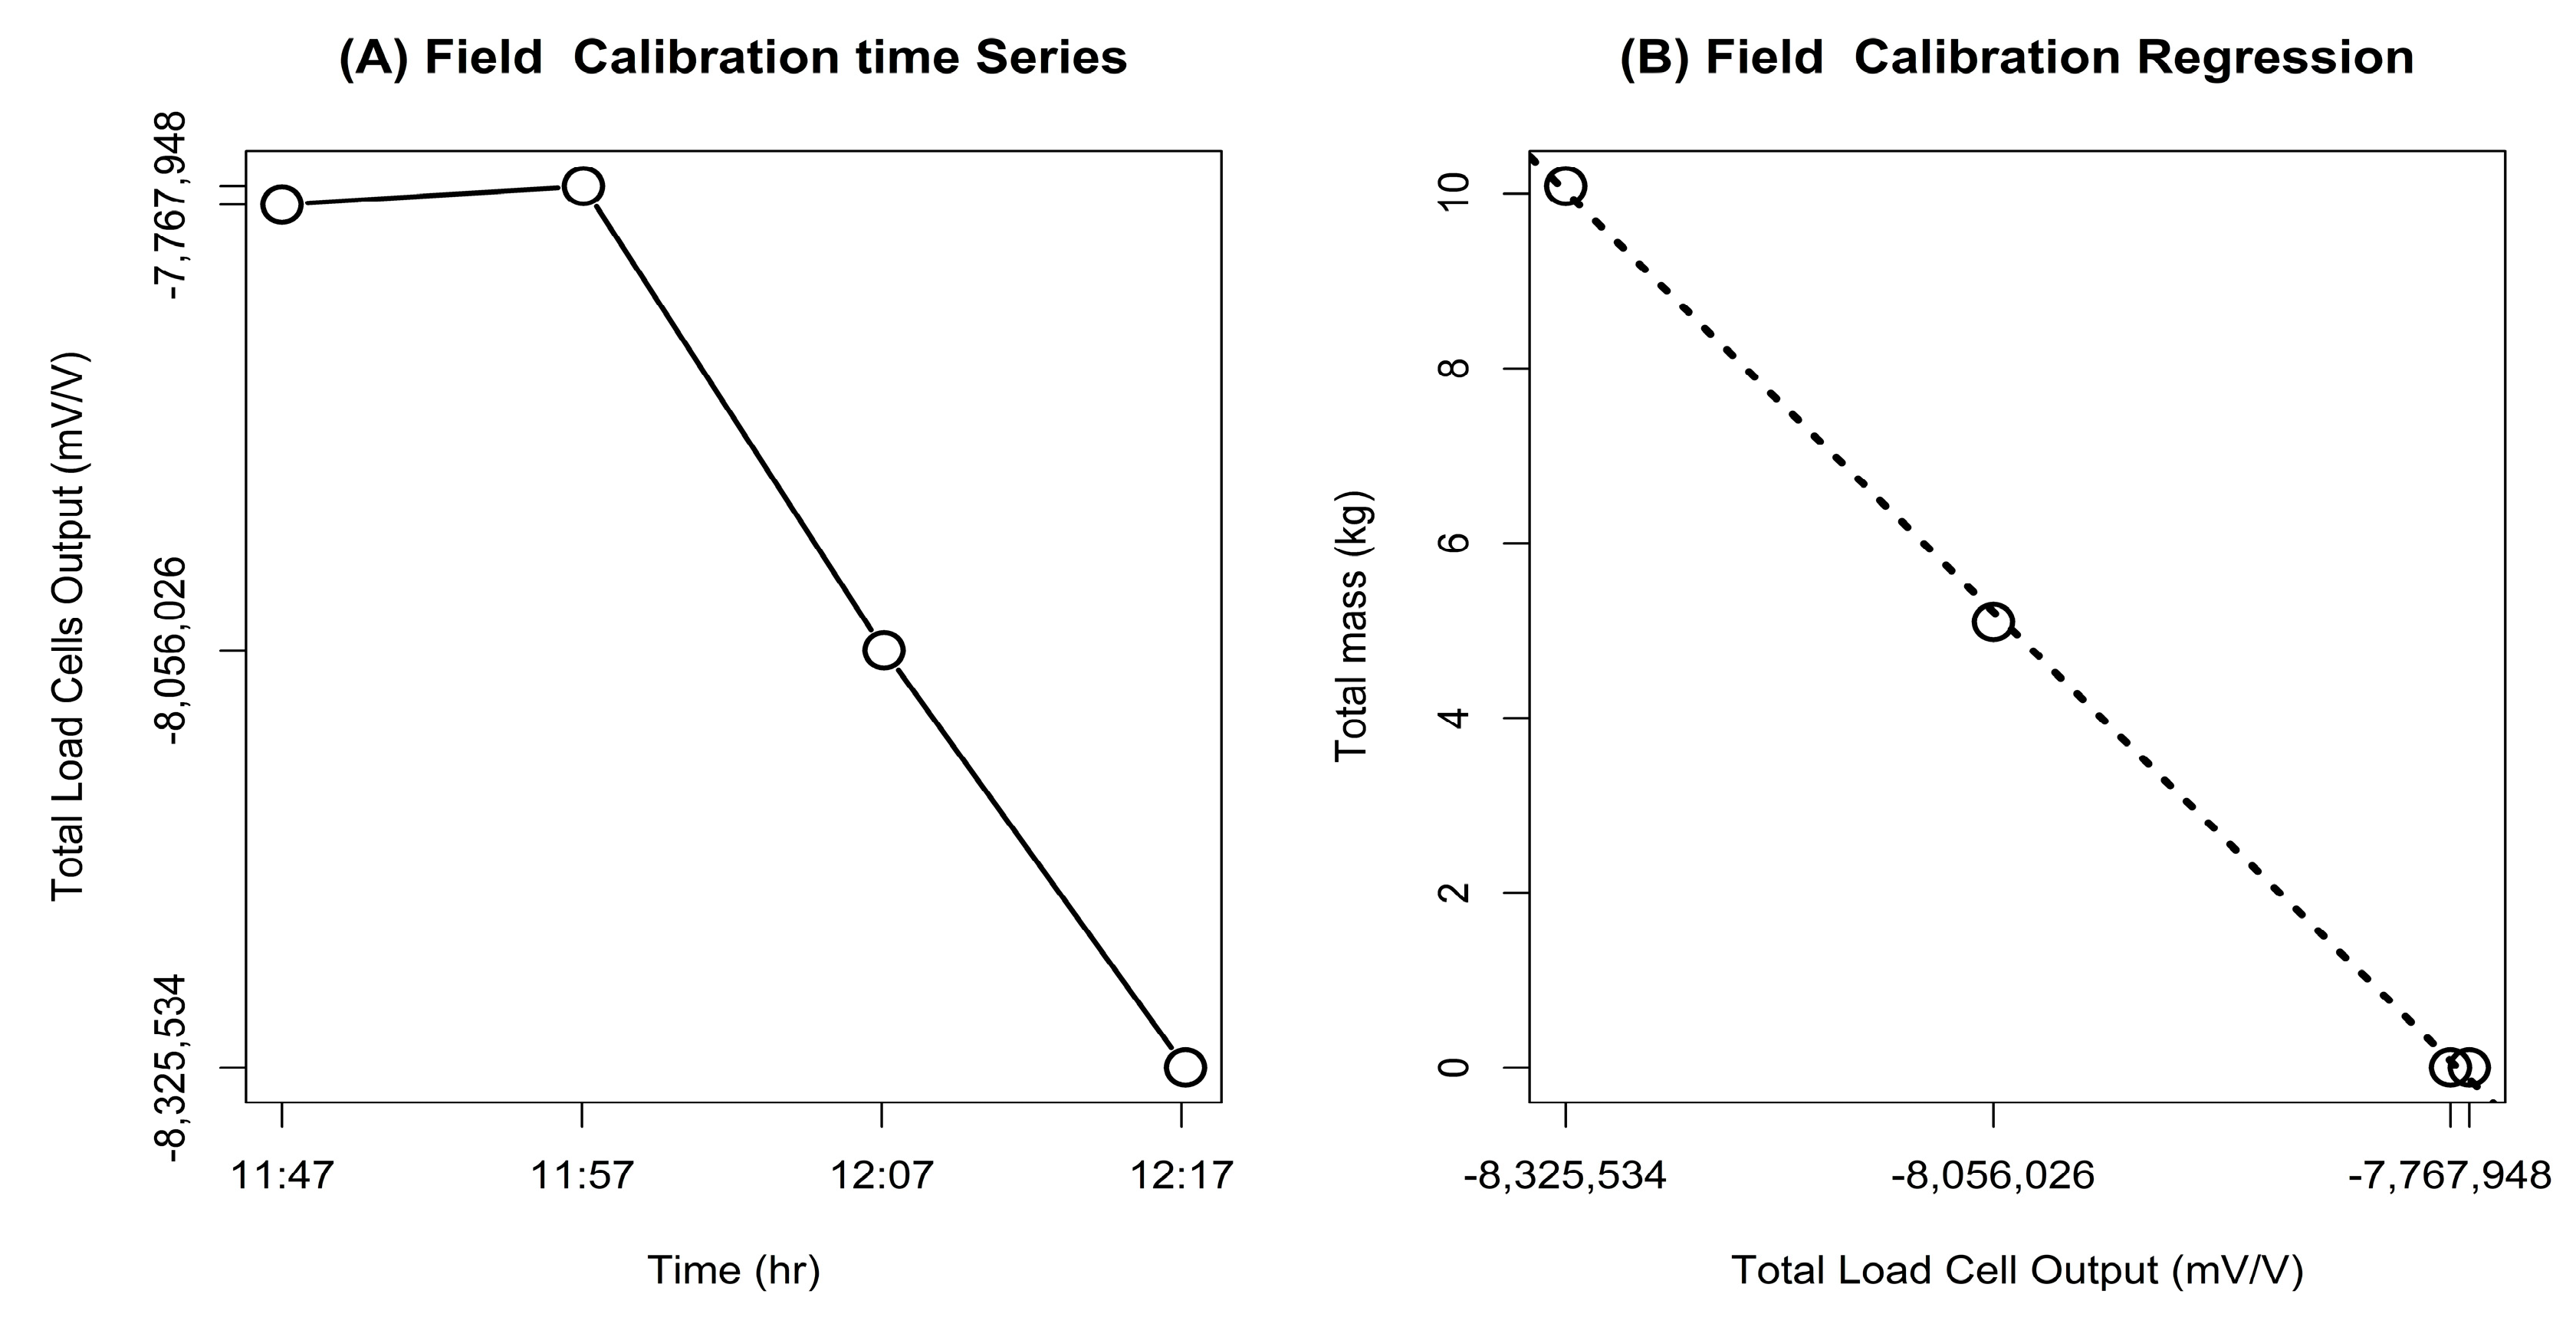
The results of the indoor calibration are shown in Figure 8. Figure 8A shows the changes in the total load cell output over time resulting from adding three masses to the scale system. The output collected every minute for each mass indicates that the signal was very stable, with no noticeable noise. The regression analysis (Figure 8B) yielded a perfect correlation (r2 = 1.0) between the total load cell output and the mass. Figure 8B shows a negative relationship, which could result from the type of load cell used in this study, which can operate in tension or compression modes. The negative relationship also depends on how the two signal wires of the load cell are connected to the ADC positive and negative pins, which will result in either a positive or negative output. Similarly, the outdoor calibration (Figure 9) resulted in an excellent negative linear correlation (r2 = 0.9994).
3.2. Weather and Soil Moisture
Information on daily precipitation, maximum (Max) and minimum (Min) air temperature, soil moisture at three soil depths, solar radiation, and relative humidity from February to June 2023 at the study site are shown in Figure 10. The daily precipitation data (Figure 10A) show frequent precipitation events typical of the study area during spring. The soil moisture data in Figure 10E reflect various wetting and drying cycles in response to the recurring rainfall events.
3.3. Results of the Outdoor Experiment
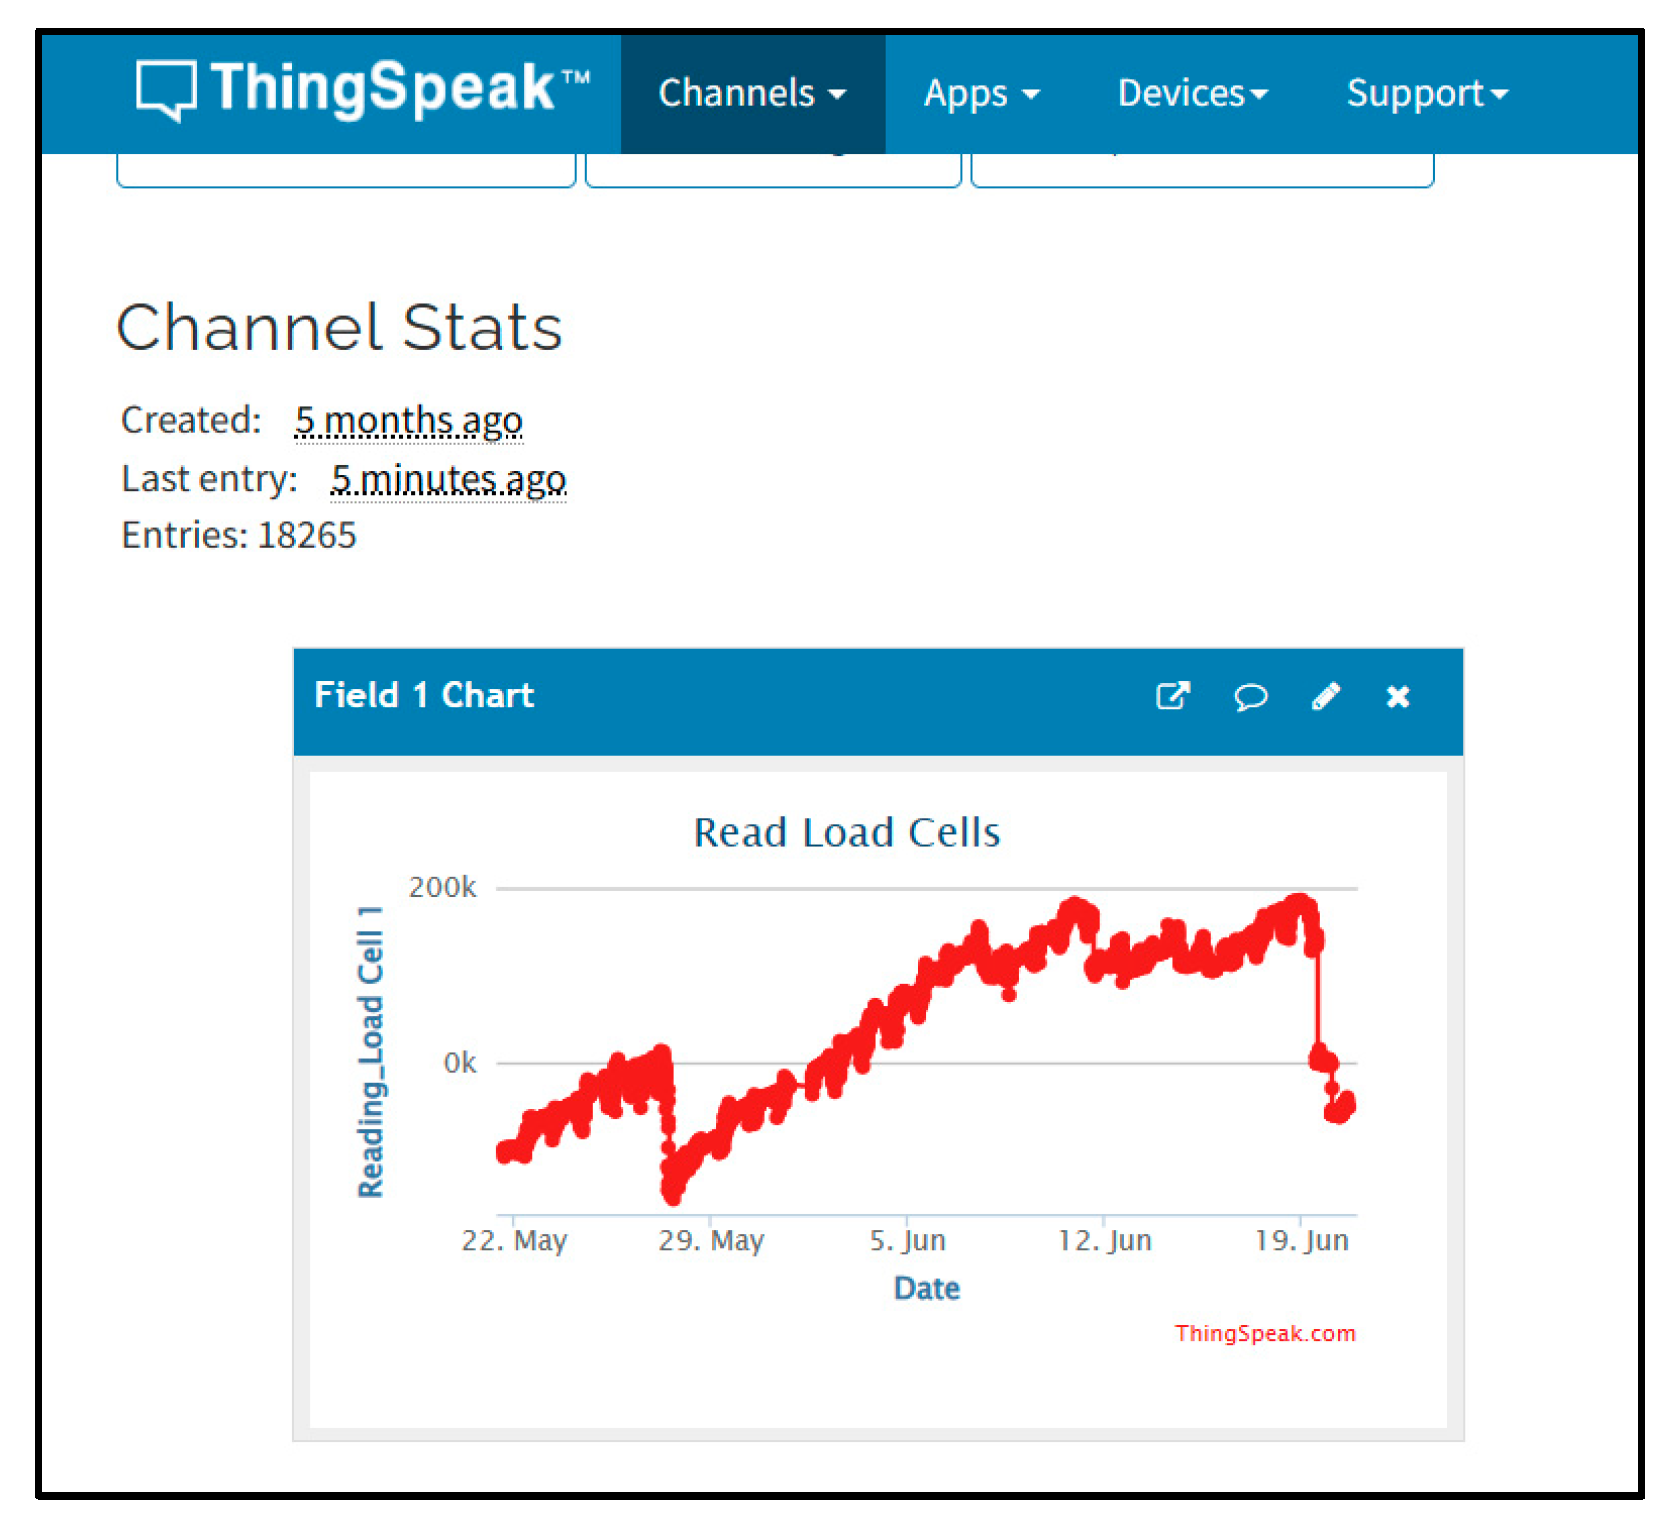
Figure 11 shows an example of the output of one of the load cells displayed in ThingSpeak.com from 22 May to 19 June 2023 during the outdoor experiment. The ThingSpeak.com tool allows one to display up to eight charts per channel, and the data can be visualized using a computer. The data on ThinkSpeak.com can be private, shared with specific people, or made public for anyone to see. The data sent to ThingSpeak.com is given a timestamp when received, is stored in a database, and can be downloaded as a CSV file. Although the data in ThingSpeak.com is meant to be visualized using a computer, several cell phone Apps (i.e., ThingView, ThingShow for ThingSpeak) are available for iOS and Android that can be used to visualize ThingSpeak data using a cell phone and other mobile devices.
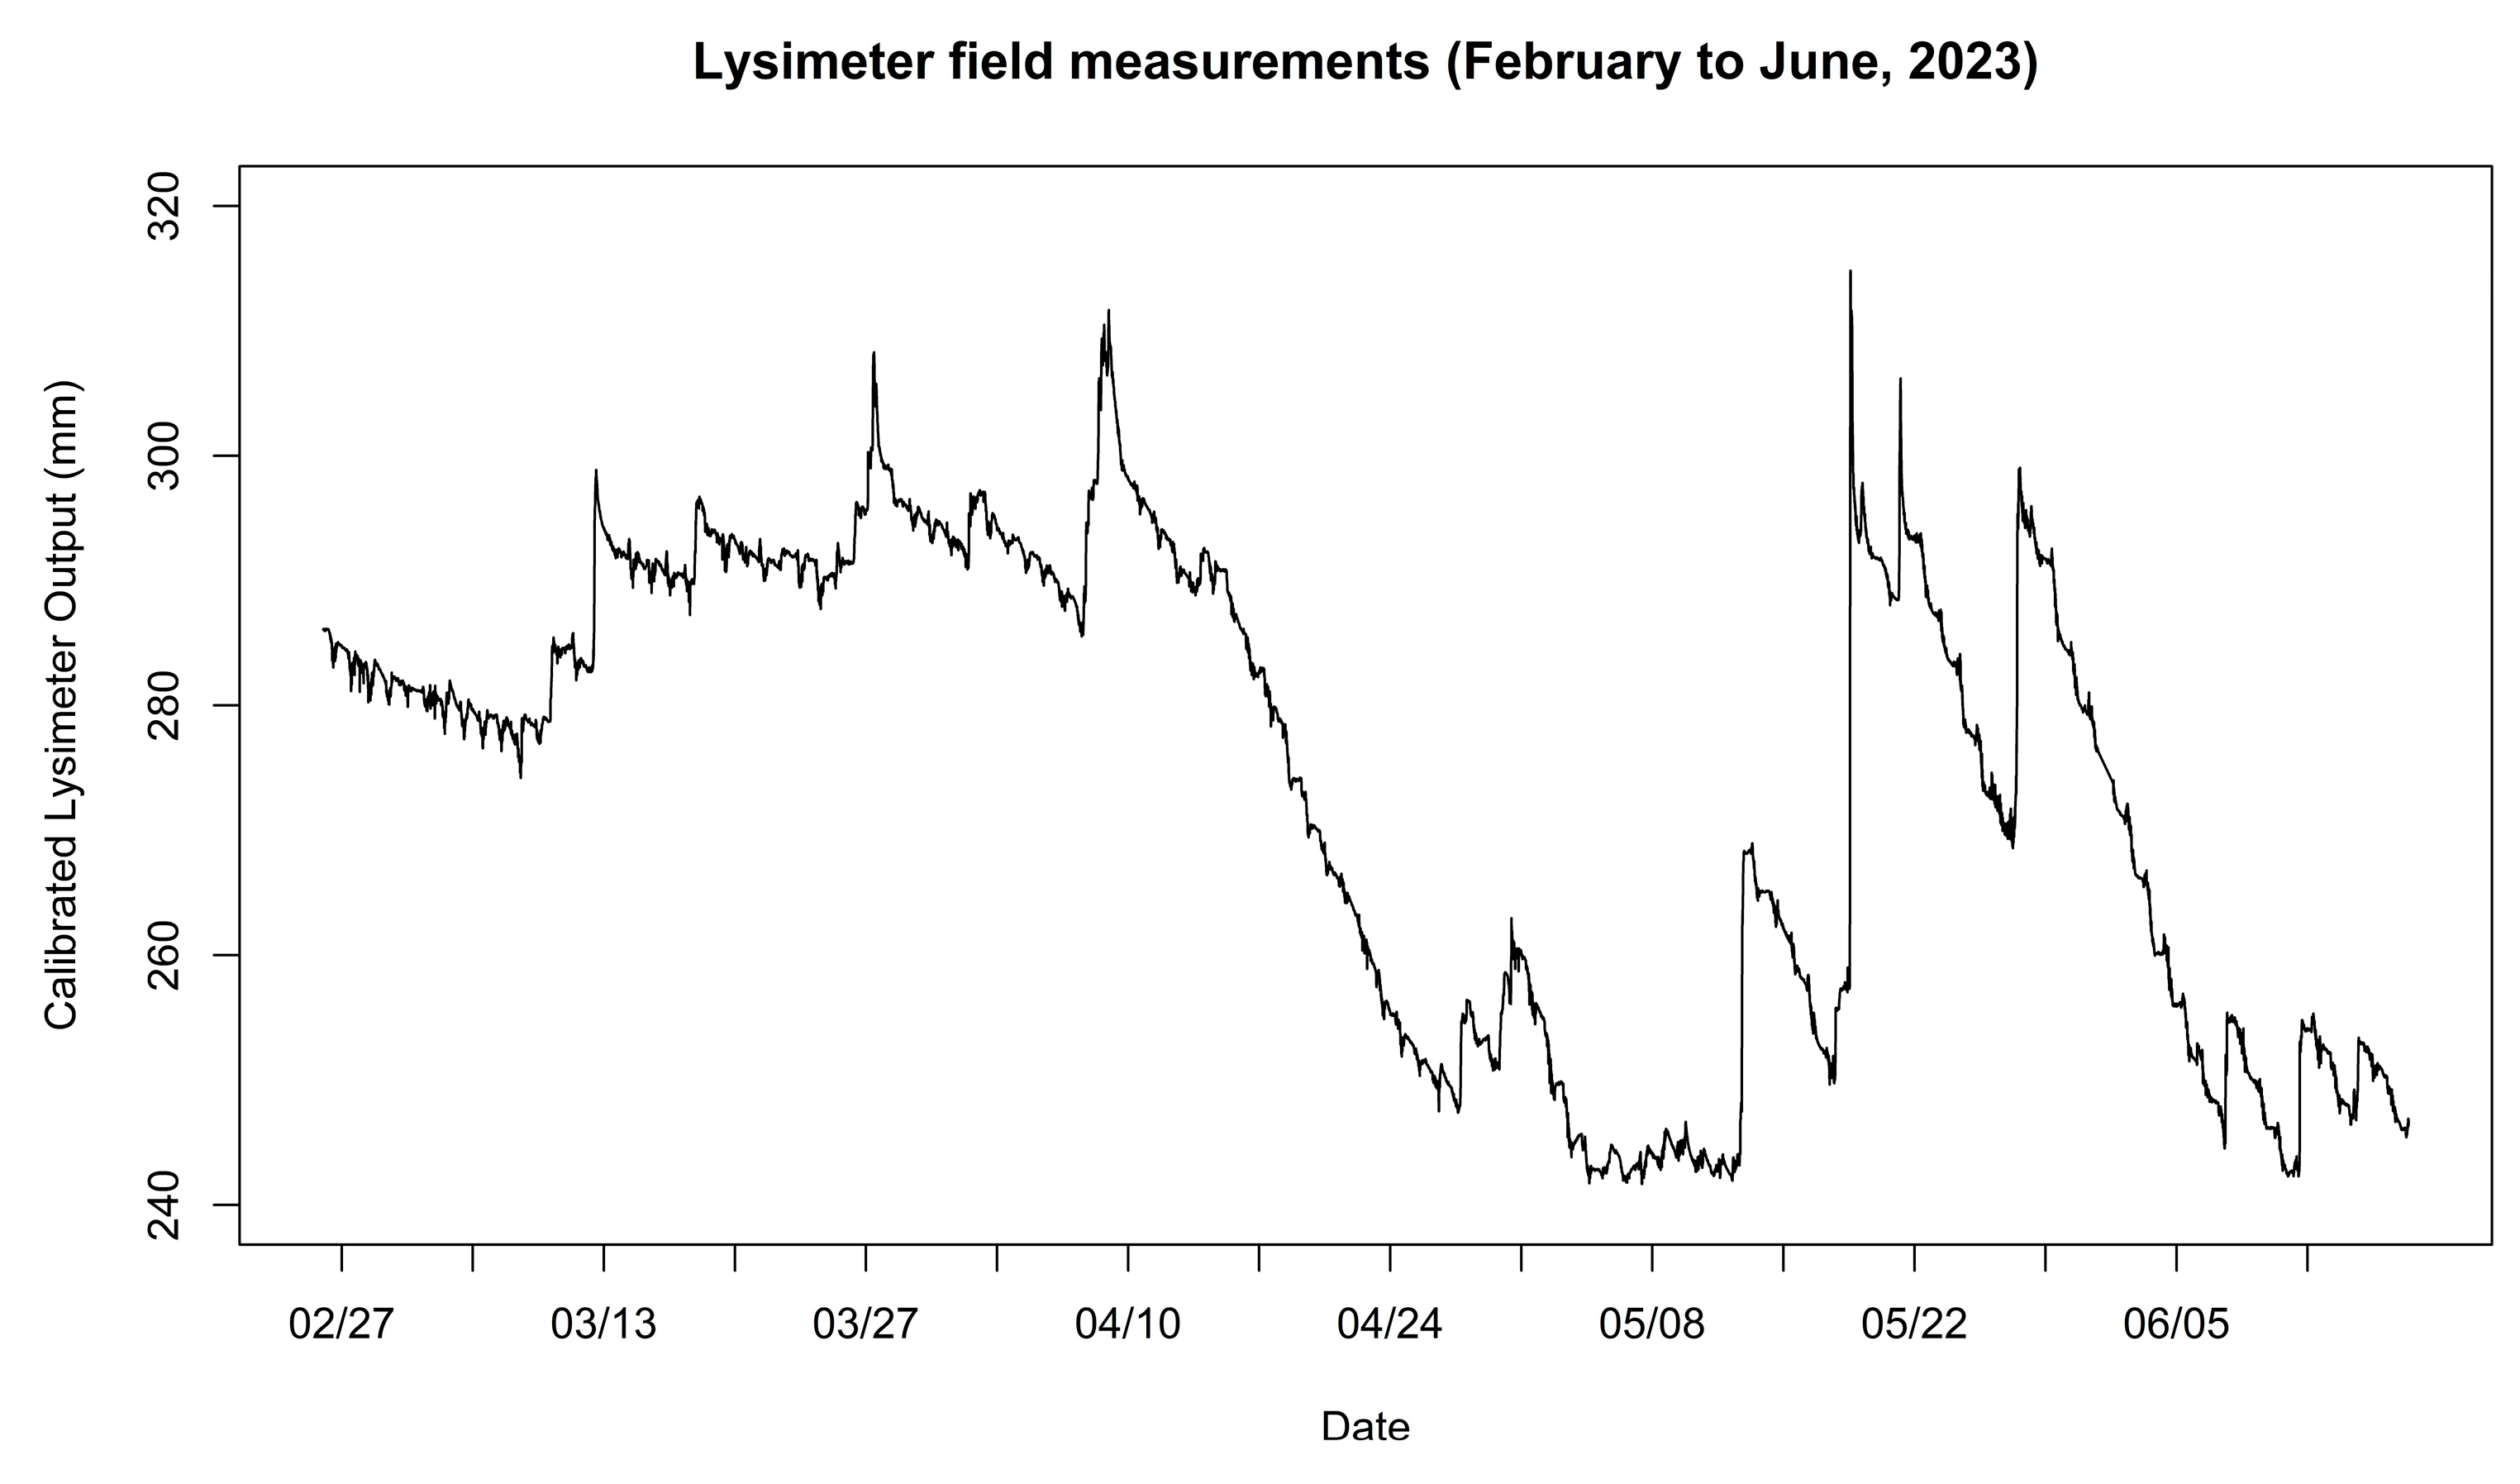
The data collected every 10 min during the outdoor experiment are shown in Figure 12 for the entire study period from February to June 2023. The data collection and communication system did not fail during this period, indicating that the IoT scale system was reliable. However, the reliability of the communication system depends on cell phone coverage and quality of coverage, which vary by site and local conditions. It should be noted that the lysimeter mass data shown in Figure 12 followed the same pattern as the soil moisture data previously shown in Figure 10E, indicating that the IoT scale system accurately responded to the local changes in soil wetting and drying cycles.
The 10 min data in Figure 12 were filtered to retain only the values measured at midnight each day. The midnight lysimeter mass values were used to calculate the daily evapotranspiration by subtracting the midnight value for the current day from that of the previous day. Since rainy days would result in negative ET values, the negative values were removed. The resulting daily and cumulative ET values for the study period are shown in Figure 13. As expected, the daily ET values were variable, reflecting the normal day-to-day variability in weather and soil moisture conditions. The daily ET rate depends on several weather variables, such as solar radiation, temperature, relative humidity, and wind speed. For a cropped surface, crop type, crop development stage, percent crop cover, and level of water stress also play an essential role. Despite the variability in daily ET, the tendency was for the daily ET values to increase with time as the weather got warmer as spring moved towards summer.
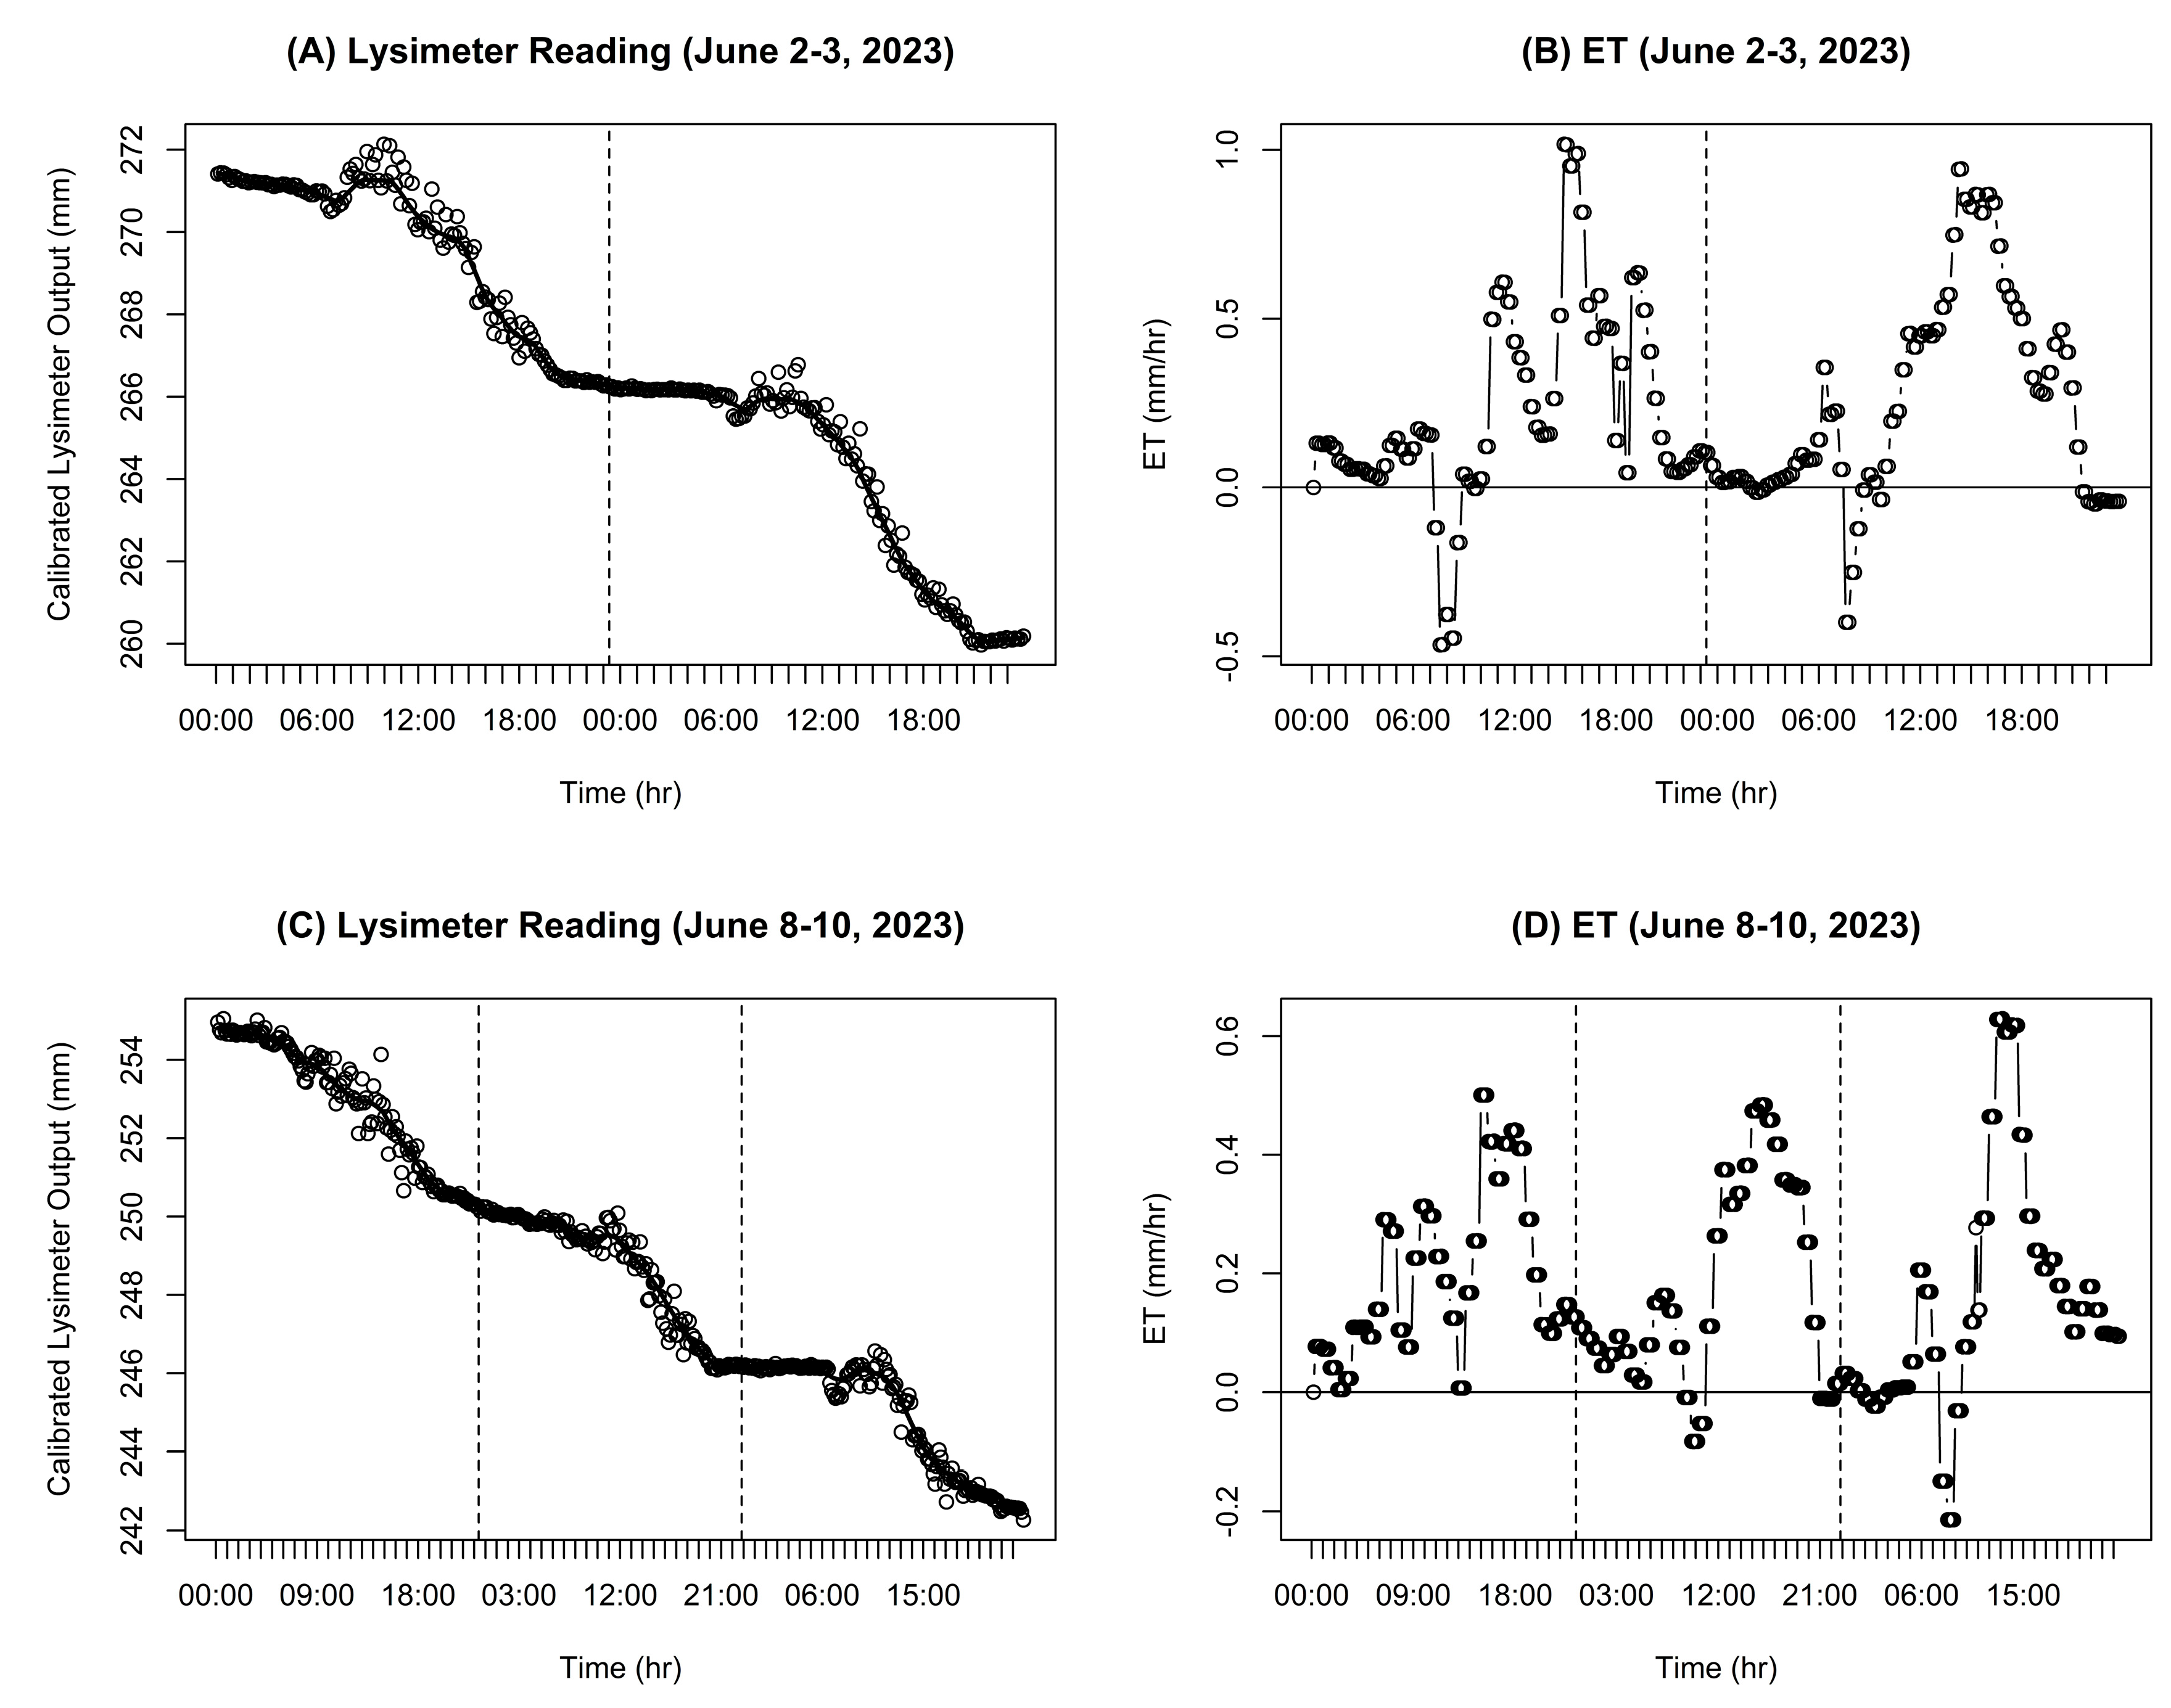
Figure 14 shows the lysimeter mass and ET measured every 10 min during 2–3 June and 8–10 June 2023, which provides a closer look to appreciate the accuracy of the IoT scale system. It shows the daily pattern of crop water use, with the rate of water use increasing during the daytime compared to nighttime hours. In general, more noise in the signal is observed during the day compared to nighttime. During the daytime, more noise could result from the effect of clouds on solar radiation and the usual tendency of wind speed to increase during the day [46]. It is possible that our field experiment setup, with the soil container above ground, could have been more severely impacted by changes in wind speed than a normal lysimeter, which is typically buried.
An interesting observation from Figure 14A is that there was a mass increase during the morning hours for June 2 and 3 instead of the expected decrease, since no rain occurred during those days. Natural water inputs to the soil coming from sources other than rain (such as dew) are often not considered in ecohydrological studies since they are typically believed to be small and, therefore, difficult to measure. However, some researchers have recognized that these water inputs could form under different environmental conditions and be a relevant source for plants and ecosystems, especially during summer drought. For example, ref. [11] reported that non-rainfall water inputs occurred frequently in Switzerland, and they measured 127 non-rainfall water input events over 12 months using micro lysimeters.
Similarly, researchers in Spain [47] used a precision weighing lysimeter to measure ET from a dune belt in a coastal environment. They found that during periods without rainfall, the daily pattern of the lysimeter readings showed increasing mass from sunset to morning hours and a subsequent decrease. However, they observed that the increasing mass concurred with hours of zero or only minor temperature differences to the dewpoint, which led them to attribute the increase in mass to vapor adsorption rather than dew. At our study site, dew accumulation during the early morning hours is a common occurrence based on visual observations of wet plant leaves during non-rainy periods. Therefore, we speculate that the increase observed in the lysimeter mass during the daytime could be due to dew accumulation.
Figure 14C shows that considerable nighttime ET occurred from June 8 to June 9, but ET was minimal during the night from June 9 to June 10. These results show that the IoT scale system was accurate enough to detect the daily ET and even ET rates during shorter periods (i.e., 10 min). However, it would be advisable to remove noise for periods shorter than daily by smoothing the data before calculating ET. Other researchers have observed that the noise visible in lysimeter data originated mainly from fluctuations in electrical noise, wind speed, and atmospheric pressure [11].
Some of the short-term noise could be removed by programming the microcontroller to oversample and time-average during data collection. Additional smoothing can be applied in post-processing using various data-smoothing techniques that can be applied to time series (i.e., moving average, lowess). Researchers in Switzerland [11] described a procedure to remove noise from load cell data using low-pass filtering. The data in Figure 14A,C were first smoothed using the lowess () function in R (using f = 0.05) before the ET values in Figure 14B,D were calculated. As indicated earlier, Figure 14B,D show that negative ET values resulted during the morning hours in most of the five days shown, probably due to dew formation.
3.4. Cost of the IoT Scale System
Electronic supplies to build the IoT scale system (Table 3) cost USD 343.32, excluding taxes and shipping and handling. But the four load cells represented 52.4% (USD 180.00) of the total cost, and all the other supplies were purchased for USD 163.32. However, this work focused on building and testing the electronics for the scale or lysimeter system. The cost of building a field lysimeter for actual evapotranspiration monitoring can be significant. Under their current pricing policy, non-commercial users have no ongoing monthly cost or data plan for using the Particle Boron to transmit data using the cellular network. Also, there is no cost for non-commercial users to use the ThingSpeak.com IoT platform.
3.5. Advantages and Disadvantages of the IoT Scale System
The IoT scale system has many advantages. For example, it can be built using open-source electronics and an existing IoT platform. The system has low power requirements and can operate with a small battery and solar panel, which is especially important in remote agricultural locations. Lysimeters are typically installed in the middle of an agricultural field; therefore, a bulky solar panel and battery system often obstruct farming operations. The system offers connectivity to the Internet, allowing users to see the data in real time. Internet connectivity enables users to monitor the system remotely to ensure that the lysimeter is working correctly without needing to visit the site to download and visualize the data manually. The system has a 24-bit ADC, which is the same accuracy as the flagship Campbell Scientific data loggers (i.e., models CR1000X or CR6), commonly used for lysimeter applications in agriculture, but at a small fraction of the cost.
On the other hand, one of the main disadvantages of the IoT scale system is that it is not equipped to timestamp and save the data locally. It relies on timestamping and saving the data in the Cloud, which depends on the availability and reliability of the cellular network. Our field experiment did not have problems with the cellular network. Still, our experience with other applications is that cellular communication could fail, depending on the site and weather conditions. Therefore, the IoT system presented here could still be improved by adding the capability of saving the collected data locally, such as using a micro-SD card, which can be accomplished in various ways.
4. Conclusions
The IoT scale system was designed and constructed to be relatively low cost; be accurate; have low power requirements to continuously operate with a small battery; be recharged by a small solar panel; use cell phone communication that could be deployed in remote locations; use open-source electronics and off-the-shelf components that would be easy to obtain and substitute; use an existing open-source IoT Internet platform to receive, store, and display the data in real time; and be robust and reliable for long-term operation in outdoor applications.
Although the IoT system was explicitly designed for a scale application by measuring the output of four load cells, the Particle Boron device also has 20 mixed-signal GPIO pins (6 x Analog, 8 x PWM), UART, I2C, and SPI. Only the I2C connection to the Particle Boron was utilized in this application, and all its other connections and capabilities were still available for other applications. Other applications could include reading other analog sensors (i.e., temperature sensors, soil moisture sensors), activating relays, powering devices (i.e., turning LEDs on and off), communicating with other digital devices (i.e., Arduino, micro-SD card breakout, GPS, radio transceiver), etc. A logical next application would be to utilize the available resources in the microcontroller to integrate sensors to measure soil moisture and the weather variables needed to determine reference evapotranspiration (ETo). Concurrent soil moisture, ETo, and ETc data would enable the calculation of crop coefficients to understand the soil–plant–atmosphere dynamic processes in real time.
Also, in this application, the system was designed to measure one scale or lysimeter, which requires only four load cells to be read. However, the I2C multiplexer has eight channels for four additional ADCs and four additional load cells. The availability of four additional channels means this IoT scale system can easily be expanded to read two scales or two lysimeters if they are not too far apart. The technical specifications of the I2C multiplexer indicate that the multiplexer comes with an address of 0x70. Still, this address can be adjusted from 0x70 to 0x77 (using jumpers on the back of the device), which, in theory, would enable having eight of these multiplexers on each of the 0x70 to 0x77 addresses. This arrangement would allow 64 ADCs (or other I2C devices) to be controlled, which could be used to read 64 load cells.
Once constructed, the IoT scale system was tested during indoor and outdoor experiments, showing excellent results. Although the indoor experiment lasted only a few days, the outdoor experiment lasted for around five months (from February to June). The field experiment to measure ET using an aboveground lysimeter exposed the IoT scale system to the changes in environmental conditions prevalent in the humid Southeast USA. The system proved to be robust and dependable for data collection and data communication under the conditions of the study. It also accurately measured changes in the lysimeter mass at a 24-bit ADC resolution, which enabled the determination of ET during daily and shorter periods.
The results of the outdoor experiment showed that the changes in the lysimeter mass during five months (Feb to Jun) had the same tendency as the changes in soil moisture measured concurrently at a nearby weather station. Both the lysimeter and soil moisture measurements reflected the expected changes in soil conditions due to wetting and drying soil cycles driven by local weather conditions. The results of the outdoor experiment also showed that the system could detect a considerable gain in lysimeter mass, rather than the expected loss in mass, during the morning hours. We speculated that this gain in mass could be due to dew formation. However, the process of dew formation, its magnitude, and its importance in agricultural water management still need further investigation.
Although the IoT scale system performed without fail in data collection and transmission during the field experiment, it is recognized that it would be important to improve the system by adding the capability of recording the collected data locally before sending them to the Internet. In future work, a new version of the system will be created to address this shortcoming, making the system more reliable and valuable, especially in places without stable cellular service.
One of the main advantages of the IoT scale system is that it can be built for a fraction of the cost of popular data logging systems commonly used for lysimeter and scale applications in agriculture, which typically require an investment of several thousand USD for data logging and data communication. Also, the IoT scale system can be built using open-source, off-the-shelf components that are easy to purchase online and can be easily replaced or substituted, providing freedom from proprietary systems. In fact, most, if not all, of the components of the IoT scale system described here could be replaced or substituted. The possibility of replacing or substituting components applies to the electronic components, enclosure, battery, solar panel, and even the ThingSpeak.com IoT platform. Also, the fact that the system is connected to the Internet via the cellular network not only enables users to download and visualize the data using the ThingSpeak.com IoT platform, but the user can also remotely change the program in the microcontroller by flashing code via the Cloud Flash option provided by the Particle Workbench tool.
Funding
Technical Contribution No. 7281 of the Clemson University Experiment Station. This material is based upon work supported by NIFA/USDA, under project number SC-1700593. Additional funding was provided by USDA-NRCS Project number 69-3A75-17-274. Names of commercial products are solely provided as information to the reader and do not imply an endorsement or recommendation by the authors or their organizations.
Data Availability Statement
The data presented in this study are available on request from the corresponding author. The data are not publicly available since some of the datasets presented (i.e., soil and weather data) were obtained from a third party.
Acknowledgments
The author acknowledges the technical support provided by Dana Turner, Anna Sara Hill, and Ali Mirzakhani Nafchi.
Conflicts of Interest
The author declares no conflicts of interest.
References
- Allen, R.G.; Jensen, M.E.; Wright, J.L.; Burman, R.D. Operational estimates of reference evapotranspiration. Agron. J. 1989, 81, 650–662. [Google Scholar] [CrossRef]
- Allen, R.G.; Pereira, L.S.; Raes, D.; Smith, M. Crop Evapotranspiration—Guidelines for Computing Crop Water Requirements—FAO Irrigation and Drainage Paper 56; FAO: Rome, Italy, 1998; Volume 300, p. D05109. [Google Scholar]
- Castellvi, F.; Snyder, R.L.; Baldocchi, D.D. Surface energy-balance closure over rangeland grass using the eddy covariance method and surface renewal analysis. Agric. For. Meteorol. 2008, 148, 1147–1160. [Google Scholar] [CrossRef]
- Holmes, J.W. Measuring evapotranspiration by hydrological methods. Agric. Water Manag. 1984, 8, 29–40. [Google Scholar] [CrossRef]
- Kizer, M.A.; Elliot, R.L. Eddy correlation systems for measuring evapotranspiration. Trans. ASAE 1991, 34, 387–392. [Google Scholar] [CrossRef]
- Payero, J.O.; Neale, C.M.U.; Wright, J.L.; Allen, R.G. Guidelines for validating Bowen ratio data. Trans. ASAE 2003, 46, 1051–1060. [Google Scholar] [CrossRef]
- Paw, U.K.T.; Qiu, J.; Su, H.; Watanabe, T.; Brunet, Y. Surface renewal analysis: A new method to obtain scalar fluxes. Agric. For. Meteorol. 1995, 74, 119–137. [Google Scholar]
- Todd, R.W.; Evett, S.R.; Howell, T.A. The Bowen ratio-energy balance method for estimating latent heat flux of irrigated alfalfa evaluated in a semi-arid, advective environment. Agric. For. Meteorol. 2000, 103, 335–348. [Google Scholar] [CrossRef]
- Niu, H.; Hollenbeck, D.; Zhao, T.; Wang, D.; Chen, Y. Evapotranspiration estimation with small UAVs in precision agriculture. Sensors 2020, 22, 6427. [Google Scholar] [CrossRef] [PubMed]
- Moorhead, J.; Marek, G.; Gowda, P.; Lin, X.; Colaizzi, P.; Evett, S.; Kutikoff, S. Evaluation of evapotranspiration from eddy covariance using large weighing lysimeters. Agronomy 2019, 2, 99. [Google Scholar] [CrossRef]
- Riedl, A.; Li, Y.; Eugster, J.; Buchmann, N.; Eugster, W. Technical note: High-accuracy weighing micro-lysimeter system for long-term measurements of non-rainfall water inputs to grasslands. Hydrol. Earth Syst. Sci. 2022, 26, 91–116. [Google Scholar] [CrossRef]
- Pruitt, W.O.; Angus, D.E. Large weighing lysimeter for measuring evapotranspiration. Trans. ASAE 1960, 3, 13–18. [Google Scholar]
- McFarland, M.J.; Worthington, J.W.; Newman, J.S. Design, installation, and operation of a twin weighing lysimeter for fruit trees. Trans. ASAE 1983, 26, 1717–1721. [Google Scholar] [CrossRef]
- Howell, T.A.; McCormick, R.L.; Phene, C.J. Design and installation of large weighing lysimeters. Trans. ASAE 1985, 28, 106–112. [Google Scholar] [CrossRef]
- Allen, R.G.; Fisher, D.K. Low-cost electronic weighing lysimeters. Trans. ASAE 1990, 33, 1823–1832. [Google Scholar] [CrossRef]
- Schneider, A.D.; Howell, T.A.; Moustafa, A.T.A.; Evett, S.R.; Abou-Zeid, W. A simplified weighing lysimeter for monolithic or reconstructed soils. Appl. Eng. Agric. 1998, 14, 267–274. [Google Scholar] [CrossRef]
- Payero, J.O.; Irmak, S. Construction, installation, and performance of two repacked weighing lysimeters. Irrig. Sci. 2008, 26, 191–202. [Google Scholar] [CrossRef]
- Evett, S.R.; Mazahrih, N.T.; Jitan, M.A.; Sawalha, M.H.; Colaizzi, P.D.; Ayars, J.E. A weighing lysimeter for crop water use determination in the Jordan Valley, Jordan. Trans. ASABE 2009, 52, 155–169. [Google Scholar] [CrossRef]
- Fisher, D.K. Simple weighing lysimeters for measuring evapotranspiration and developing crop coefficients. Int. J. Agric. Biol. Eng. 2012, 5, 35–43. [Google Scholar]
- Mariano, D.D.C.; Faria, R.T.D.; Freitas, P.S.L.D.; Lena, B.P.; Johann, A.L. Construction and calibration of a bar weighing lysimeter. Acta Sci. Agron. 2015, 37, 271–278. [Google Scholar] [CrossRef]
- Fenner, W.; Dallacort, R.; Junior, C.; Freitas, P.; Queiroz, T.; Santi, A. Development, calibration and validation of weighing lysimeters for measurement of evapotranspiration of crops. Rev. Bras. Eng. Agrícola Ambient. 2019, 4, 297–302. [Google Scholar] [CrossRef]
- Nicolás-Cuevas, J.; Parras-Burgos, D.; Soler-Méndez, M.; Ruiz-Canales, A.; Martínez, J. Removable weighing lysimeter for use in horticultural crops. Appl. Sci. 2020, 14, 4865. [Google Scholar] [CrossRef]
- Clark, J.; Tape, K.; Young-Robertson, J. Quantifying evapotranspiration from dominant arctic vegetation types using lysimeters. Ecohydrology 2022, 16, e2484. [Google Scholar] [CrossRef]
- Karam, F.; Mounzer, O.; Sarkis, F.; Lahoud, R.; Amara, T.; Karam, F. Yield and nitrogen recovery of lettuce under different irrigation regimes. J. Appl. Hortic. 2002, 2, 70–76. [Google Scholar] [CrossRef]
- Wright, J.L. New evapotranspiration crop coefficients. J. Irrig. Drain. Div. ASCE 1982, 108, 57–74. [Google Scholar] [CrossRef]
- Oke, A.; Omotosho, O.; Ogedengbe, K. Determination of crop coefficient and water use of SUWAN-1-SR with a mini lysimeter in Ibadan, Nigeria. FUOYE J. Eng. Technol. 2019, 4, 116–121. [Google Scholar] [CrossRef]
- de Melo, D.A.; Silva, P.C.; da Costa, A.R.; Delmond, J.G.; Ferreira, A.F.A.; de Souza, J.A.; de Oliveira-Júnior, J.F.; da Silva, J.L.B.; da Rosa Ferraz Jardim, A.M.; Giongo, P.R.; et al. Development and Automation of a Photovoltaic-Powered Soil Moisture Sensor for Water Management. Hydrology 2023, 10, 166. [Google Scholar] [CrossRef]
- dos Santos Freitas, M.J.; Moraes, A.; Cardoso Marques, J.; Rodrigues, F. A contribution to real-time space weather monitoring based on scintillation observations and IoT. Adv. Space Res. 2022, 70, 456–469. [Google Scholar] [CrossRef]
- Oliveira, G.; Almeida, C.; Santos, J.; Martins, J.; Caeiro, J. IoT Lysimeter system with enhanced data security. In Proceedings of the APCA International Conference on Automatic Control and Soft Computing, CONTROLO 2022, Caparica, Portugal, 6–8 July 2022; pp. 119–129. [Google Scholar] [CrossRef]
- Goyal, P.; Sharda, R.; Siag, M.; Singh, K. Development of an IoT based weighing type micro-lysimeter for soilless cultivation. Indian J. Agric. Sci. 2020, 10, 1980–1987. [Google Scholar] [CrossRef]
- International Telecommunication Union. Overview of the Internet of Things. In Global Information Infrastructure, Internet Protocol Aspects and Next-Generation Networks; ITU-T Y-Series Recommendations (Y.2060); International Telecommunication Union: Geneva, Switzerland, 2013; 22p, Available online: https://www.itu.int/rec/T-REC-Y.2060-201206-I (accessed on 26 February 2024).
- Cariou, C.; Moiroux-Arvis, L.; Pinet, F.; Chanet, J. Internet of Underground Things in Agriculture 4.0: Challenges, Applications and Perspectives. Sensors 2023, 23, 84058. [Google Scholar] [CrossRef]
- Cariou, C.; Moiroux-Arvis, L.; Pinet, F.; Chanet, J. Data collection from buried sensor nodes by means of an unmanned aerial vehicle. Sensors 2022, 22, 5926. [Google Scholar] [CrossRef]
- Bertocco, M.; Parrino, S.; Peruzzi, G.; Pozzebon, A. Estimating volumetric water content in soil for IoUT contexts by exploiting RSSI-based augmented sensors via machine learning. Sensors 2023, 23, 2033. [Google Scholar] [CrossRef] [PubMed]
- Postolache, S.; Sebastião, P.; Viegas, V.; Postolache, O.; Cercas, F. IoT-Based systems for soil nutrients assessment in horticulture. Sensors 2023, 23, 403. [Google Scholar] [CrossRef] [PubMed]
- Jusoh, M.F.; Muttalib, M.F.A.; Krishnan, K.T.; Katimon, A. An overview of the internet of things (IoT) and irrigation approach through bibliometric analysis. IOP Conf. Ser. Earth Environ. Sci. 2021, 756, 012041. [Google Scholar] [CrossRef]
- Rodrigues, L.; Moura, P.; Terra, F.; Carvalho, A.M.; Sarmento, J.; dos Santos, F.N.; Cunha, M. Synergizing crop growth models and digital phenotyping: The design of a cost-effective Internet of Things-based sensing network. Biol. Life Sci. Forum 2023, 27, 41. [Google Scholar] [CrossRef]
- Junior, A.A.; Araújo da Silva, T.J.; Andrade, S.P. Smart IoT lysimetry system by weighing with automatic cloud data storage. Smart Agric. Technol. 2023, 4, 100177. [Google Scholar] [CrossRef]
- Bashir, R.N.; Saeed, M.; Al-Sarem, M.; Marie, R.; Faheem, M.; Karrar, A.E.; Elhussein, B. Smart reference evapotranspiration using Internet of Things and hybrid ensemble machine learning approach. Internet Things 2023, 24, 100962. [Google Scholar] [CrossRef]
- Alahi, E.E.; Mukhopathyay, S.C. An Internet-of-Things enabled smart sensing system for nitrate monitoring. IEEE Internet Things J. 2018, 5, 4409–4417. [Google Scholar] [CrossRef]
- Chandrappa, V.Y.; Ray, B.; Ashwath, N.; Shrestha, P. Application of Internet of Things (IoT) to develop a smart watering system for Cairns parklands—A case study. In Proceedings of the 2020 IEEE Region 10 Symposium (TENSYMP), Dhaka, Bangladesh, 5–7 June 2020. [Google Scholar]
- Payero, J.O.; Mirzakhani Nafchi, A.; Davis, R.; Khalilian, A. An Arduino-based wireless sensor network for soil moisture monitoring using Decagon EC-5 sensors. Open J. Soil Sci. 2017, 7, 288–300. [Google Scholar] [CrossRef]
- Payero, J.O.; Mirzakhani-Nafchi, A.; Khalilian, A.; Qiao, X.; Davis, R. Development of a low-cost Internet-of-Things (IoT) system for monitoring soil water potential using Watermark 200SS sensors. Adv. Internet Things 2017, 7, 71–86. [Google Scholar] [CrossRef]
- Payero, J.O.; Marshall, M.W.; Davis, R.; Nafchi, A.M. Development and application of cell-phone-based Internet of Things (IoT) systems for soil moisture monitoring. Agric. Sci. 2021, 12, 549–564. [Google Scholar] [CrossRef]
- Payero, J.O.; Marshall, M.W.; Nafchi, A.M.; Khalilian, A.; Farmaha, B.S.; Davis, R.; Porter, W.; Vellidis, G. Development of an Internet of Things (IoT) system for measuring agricultural runoff quantity and quality. Agric. Sci. 2021, 12, 584–601. [Google Scholar] [CrossRef]
- Nolz, R.; Kammerer, G.; Cepuder, P. Interpretation of lysimeter weighing data affected by wind. J. Plant Nutr. Soil Sci. 2013, 176, 200–208. [Google Scholar] [CrossRef]
- Kohfahl, C.; Molano-Leno, L.; Martínez, G.; Vanderlinden, K.; Guardiola-Albert, C.; Moreno, L. Determining groundwater recharge and vapor flow in dune sediments using a weighable precision meteo lysimeter. Sci. Total Environ. 2019, 656, 550–557. [Google Scholar] [CrossRef]
Figure 1.
General diagram of the IoT scale system, which includes (A) an electronic scale, (B) a datalogger with cell phone communication, (C) an IoT Cloud server, and (D) user data access and visualization.
Figure 1.
General diagram of the IoT scale system, which includes (A) an electronic scale, (B) a datalogger with cell phone communication, (C) an IoT Cloud server, and (D) user data access and visualization.

Figure 2.
Diagram showing the layout of the different components of the IoT scale system.

Figure 3.
Electronic components for IoT scale system.

Figure 4.
Connections of the different electronic components of the IoT scale system.

Figure 5.
View of field installation of the IoT scale system.

Figure 6.
Experimental setup for the indoor and outdoor experiments. (A) Flowerpot with four load cells underneath. (B) Soil container with four load cells underneath. (C) Soil container with weeds.
Figure 6.
Experimental setup for the indoor and outdoor experiments. (A) Flowerpot with four load cells underneath. (B) Soil container with four load cells underneath. (C) Soil container with weeds.
Figure 7.
Calibration during the outdoor experiment (24 February 2023).
Figure 8.
Time series (A) and regression (B) results of load cell calibration conducted on 15 January 2023 (y = −0.01505x − 0.216; r2 = 1.0).
Figure 8.
Time series (A) and regression (B) results of load cell calibration conducted on 15 January 2023 (y = −0.01505x − 0.216; r2 = 1.0).
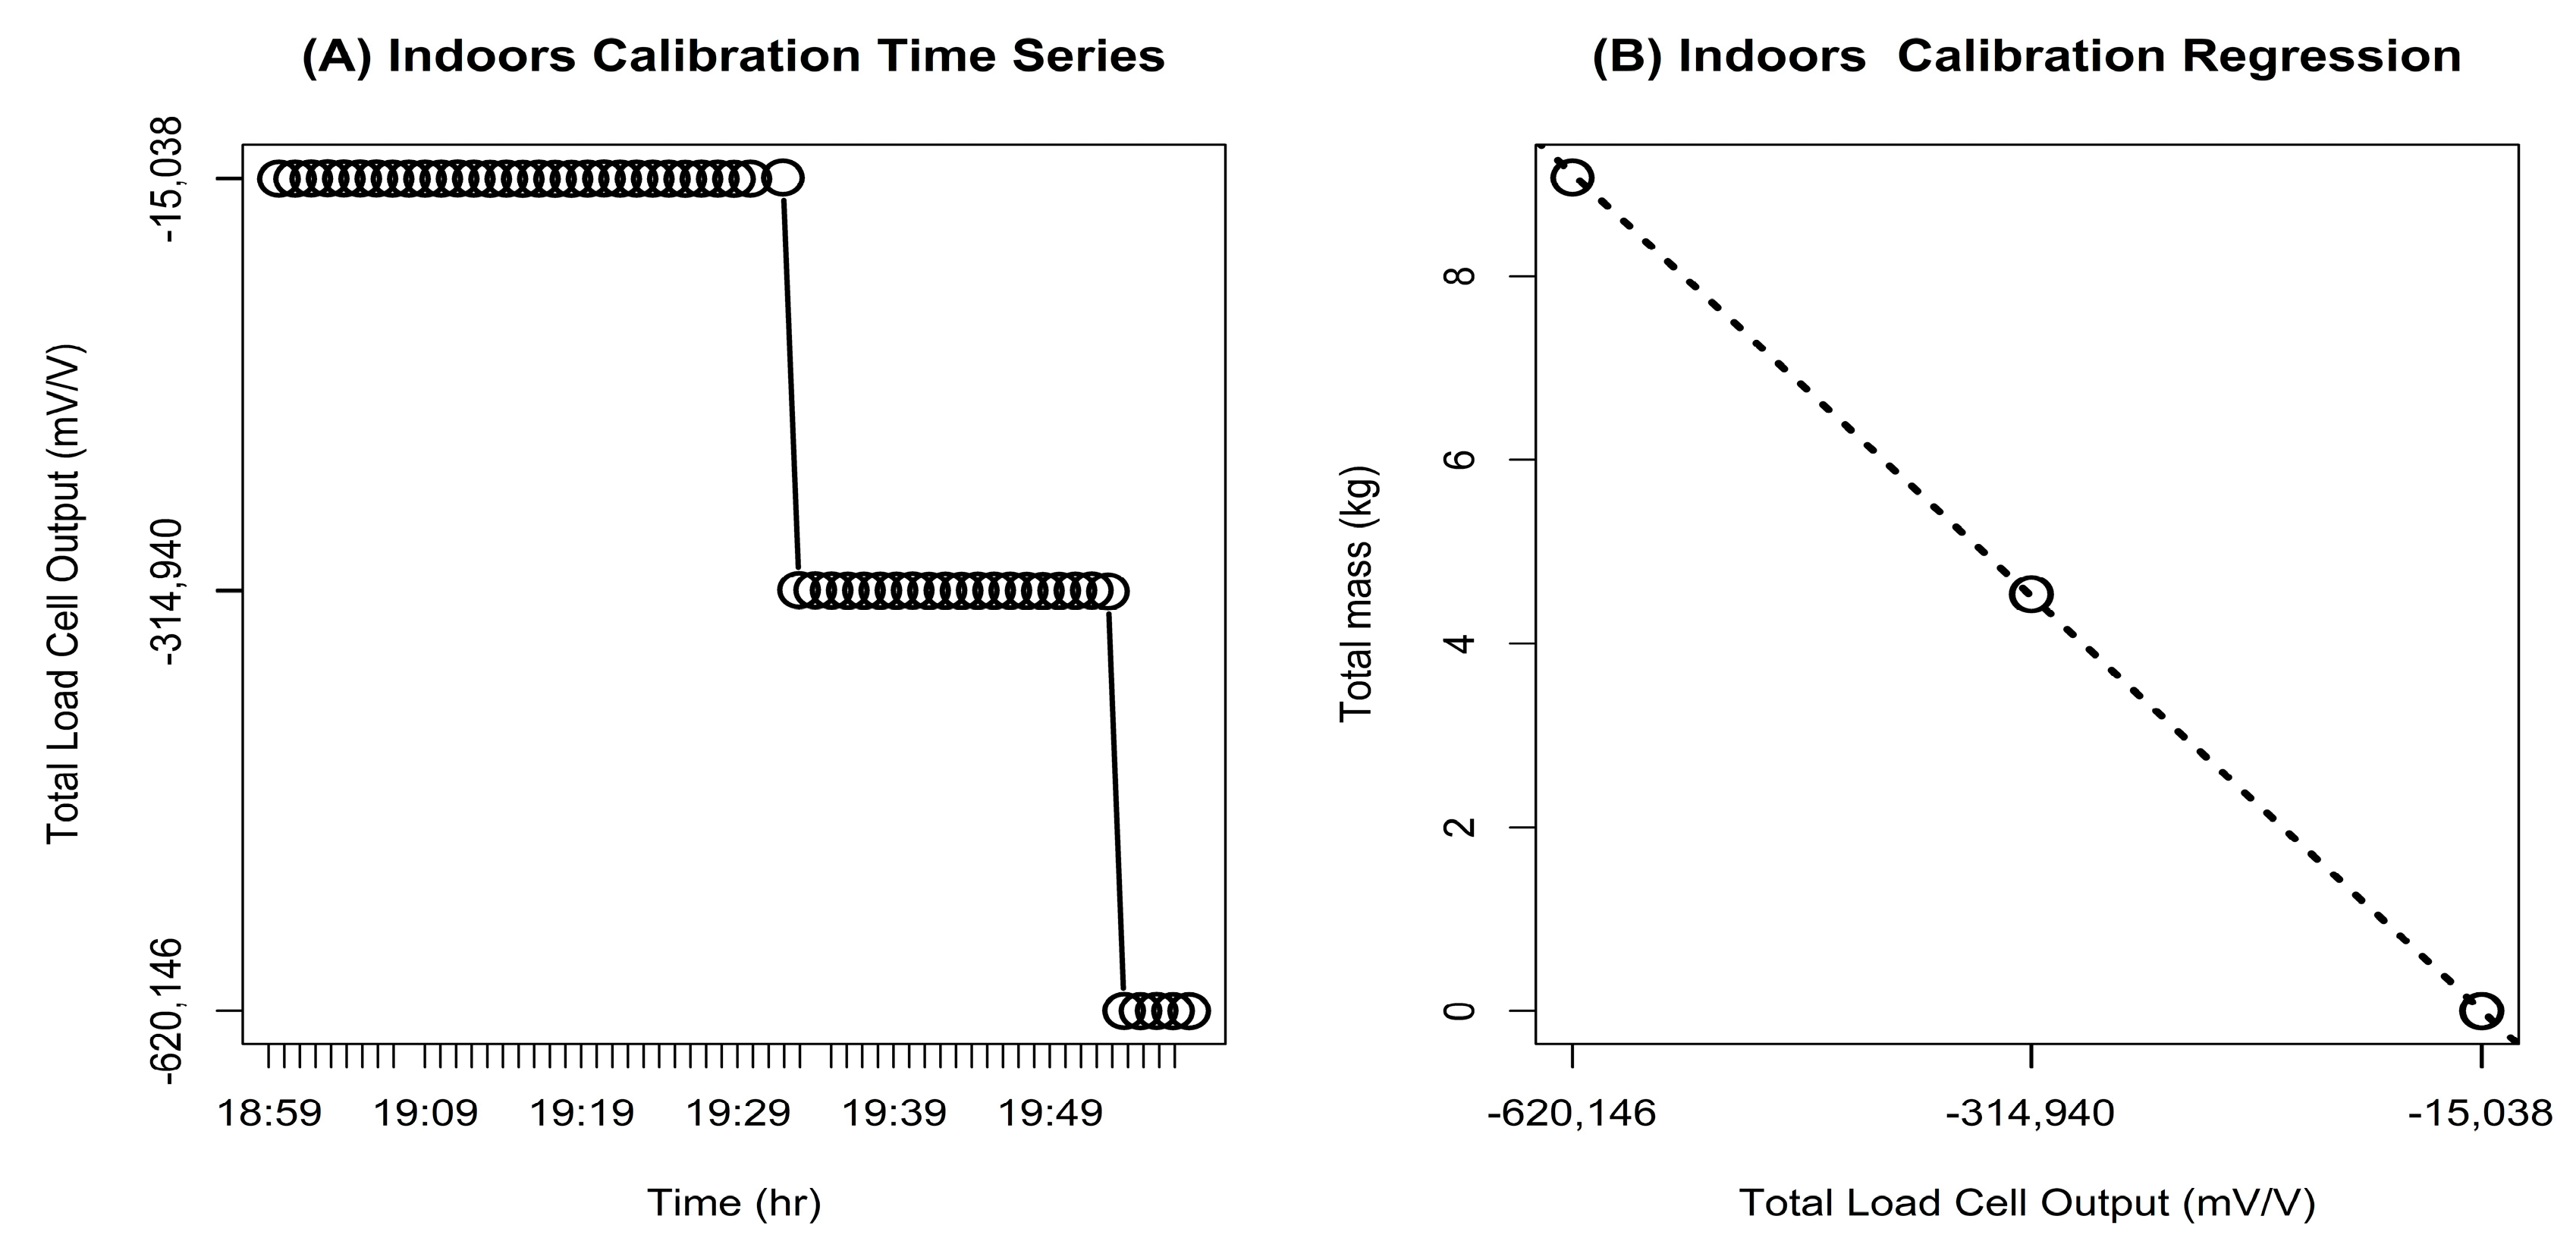
Figure 9.
Time series (A) and regression (B) results of lysimeter load cell calibration conducted in the field on 24 February 2023 (y = −0.01785x − 0.01384; r2 = 0.9994).
Figure 9.
Time series (A) and regression (B) results of lysimeter load cell calibration conducted in the field on 24 February 2023 (y = −0.01785x − 0.01384; r2 = 0.9994).
Figure 10.
Daily (A) precipitation, (B) maximum (Max) and minimum (Min) air temperature, (C) solar radiation, (D) relative humidity, and (E) soil moisture at three soil depths (5, 10, and 20 cm) from February to June 2023 at the study site.
Figure 10.
Daily (A) precipitation, (B) maximum (Max) and minimum (Min) air temperature, (C) solar radiation, (D) relative humidity, and (E) soil moisture at three soil depths (5, 10, and 20 cm) from February to June 2023 at the study site.
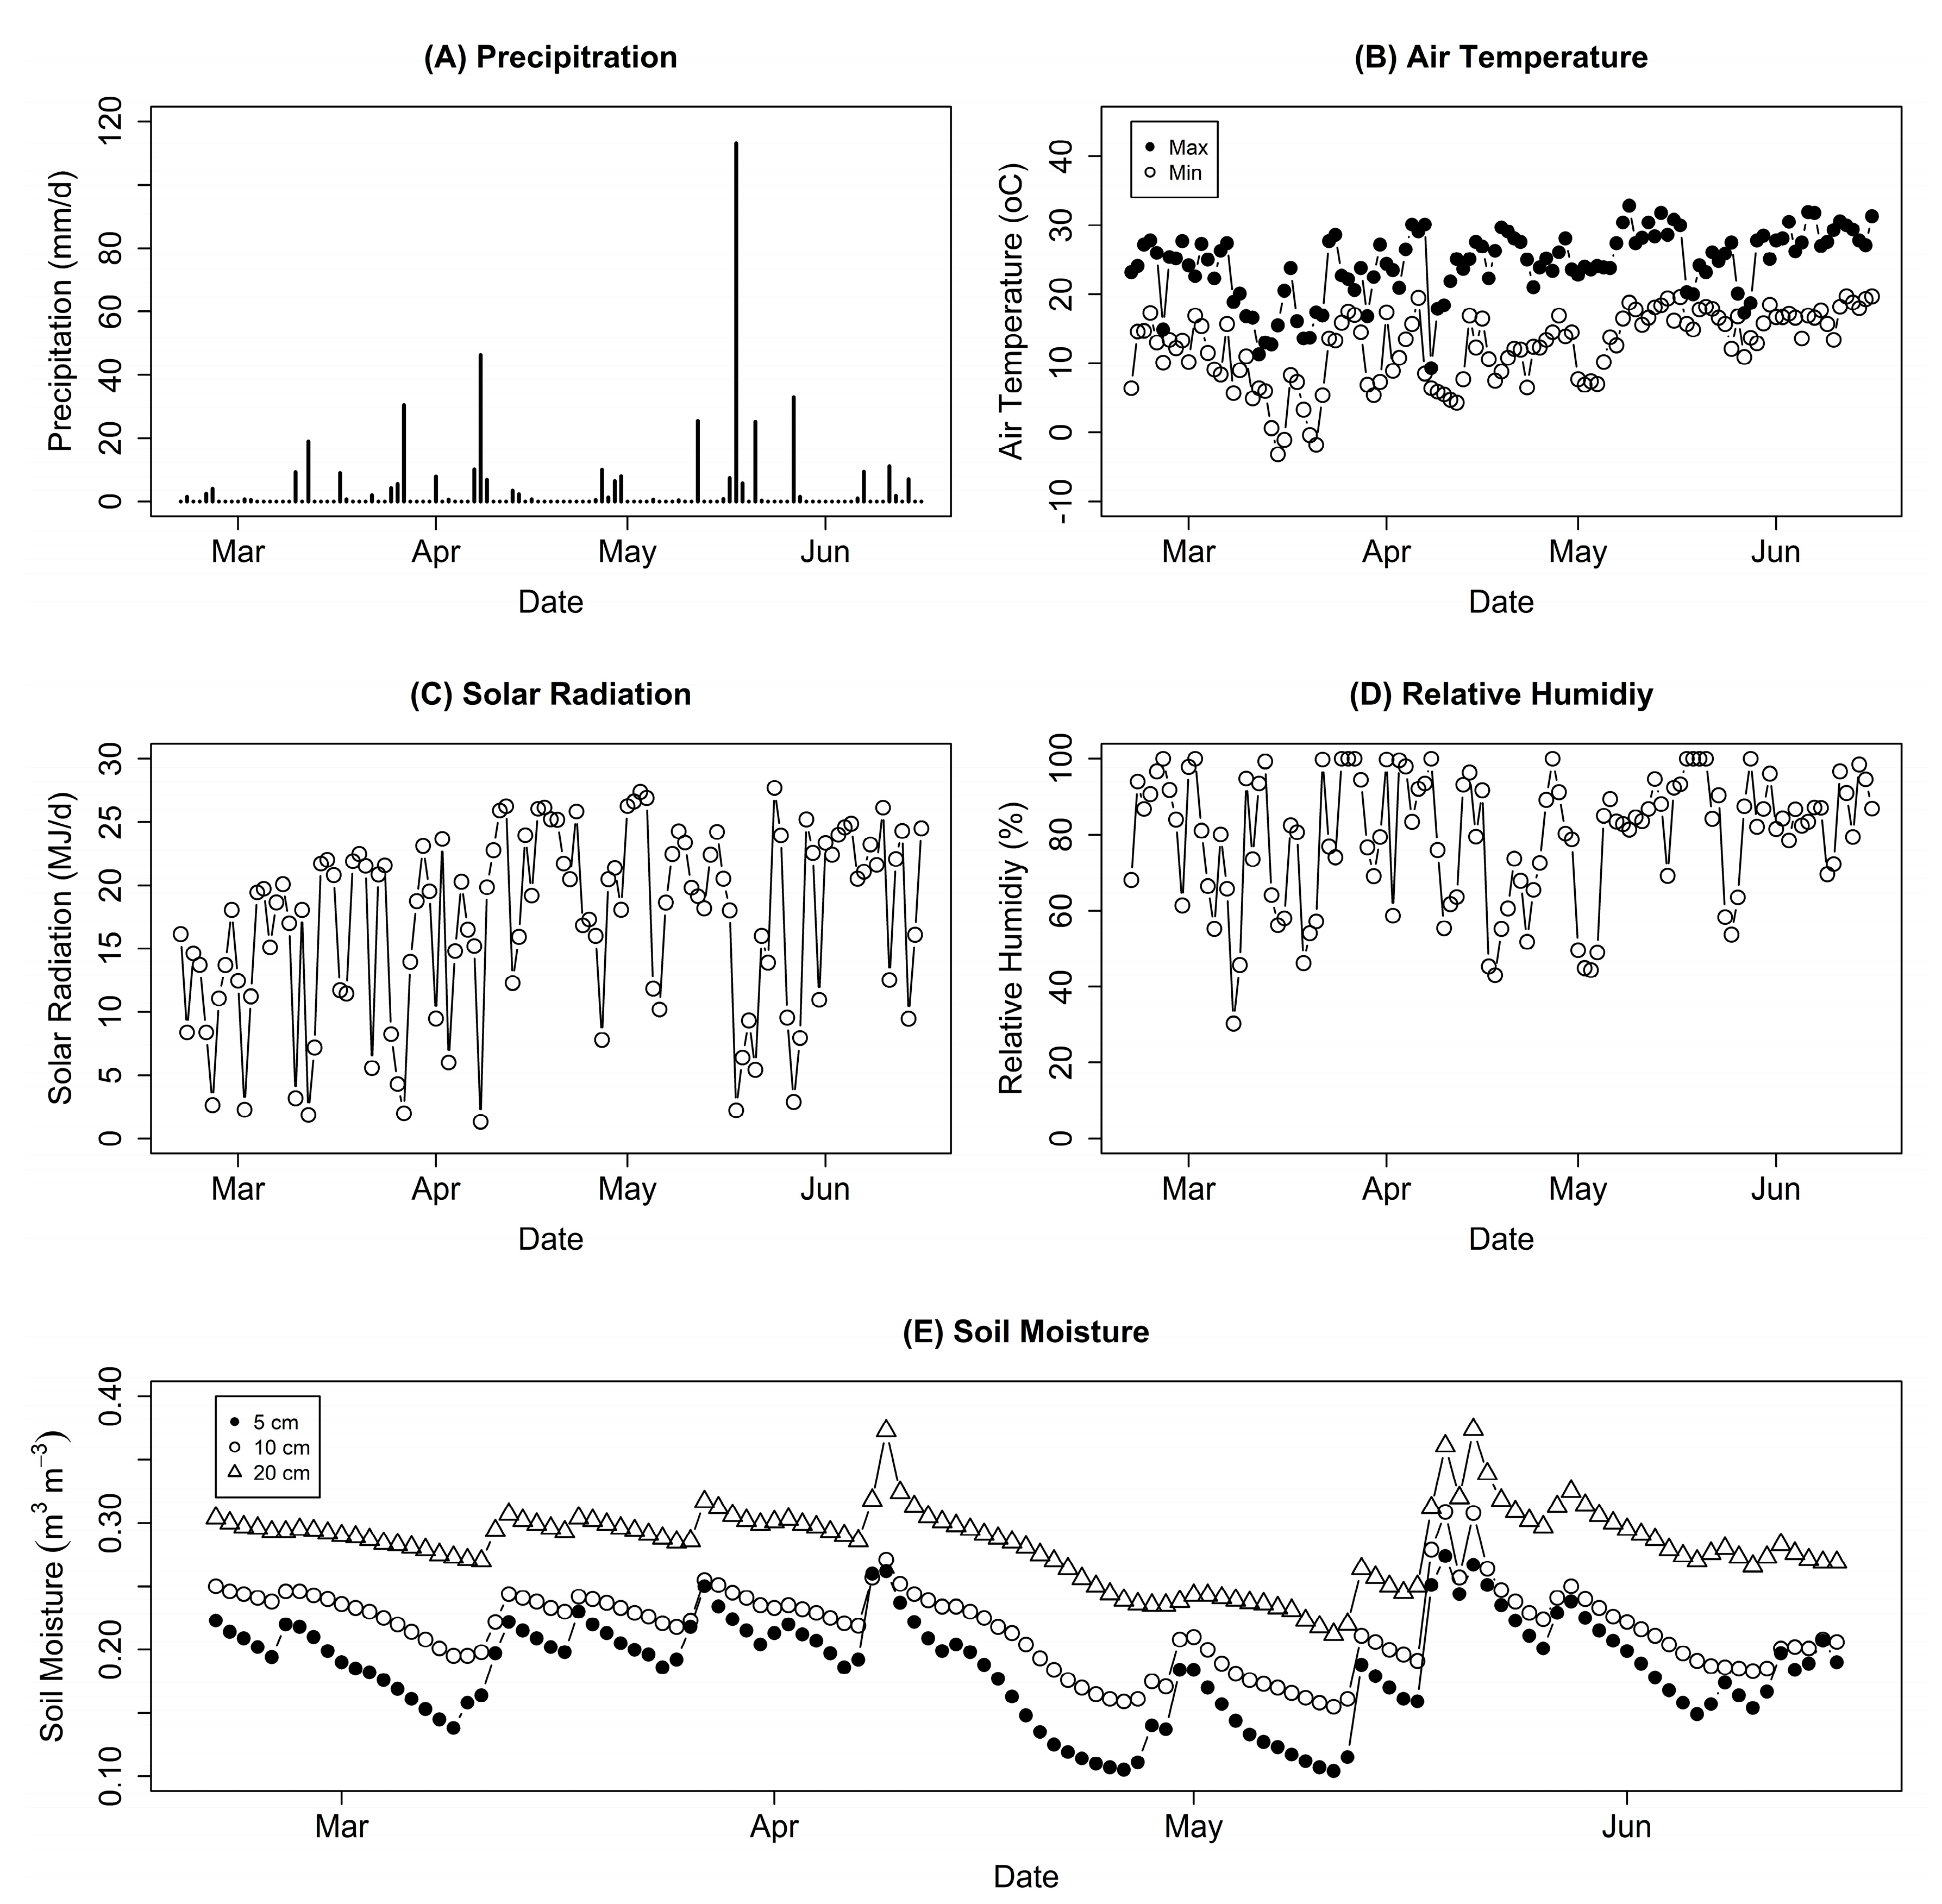
Figure 11.
Data from one of the load cells as shown in ThingSpeak between 22 May and 19 June 2023.
Figure 12.
Lysimeter field data measured every ten minutes from February to June 2023.

Figure 13.
Daily and cumulative evapotranspiration (ET) derived from lysimeter measurements from February to June 2023. The bars represent daily ET, and the solid line represents cumulative ET.
Figure 13.
Daily and cumulative evapotranspiration (ET) derived from lysimeter measurements from February to June 2023. The bars represent daily ET, and the solid line represents cumulative ET.
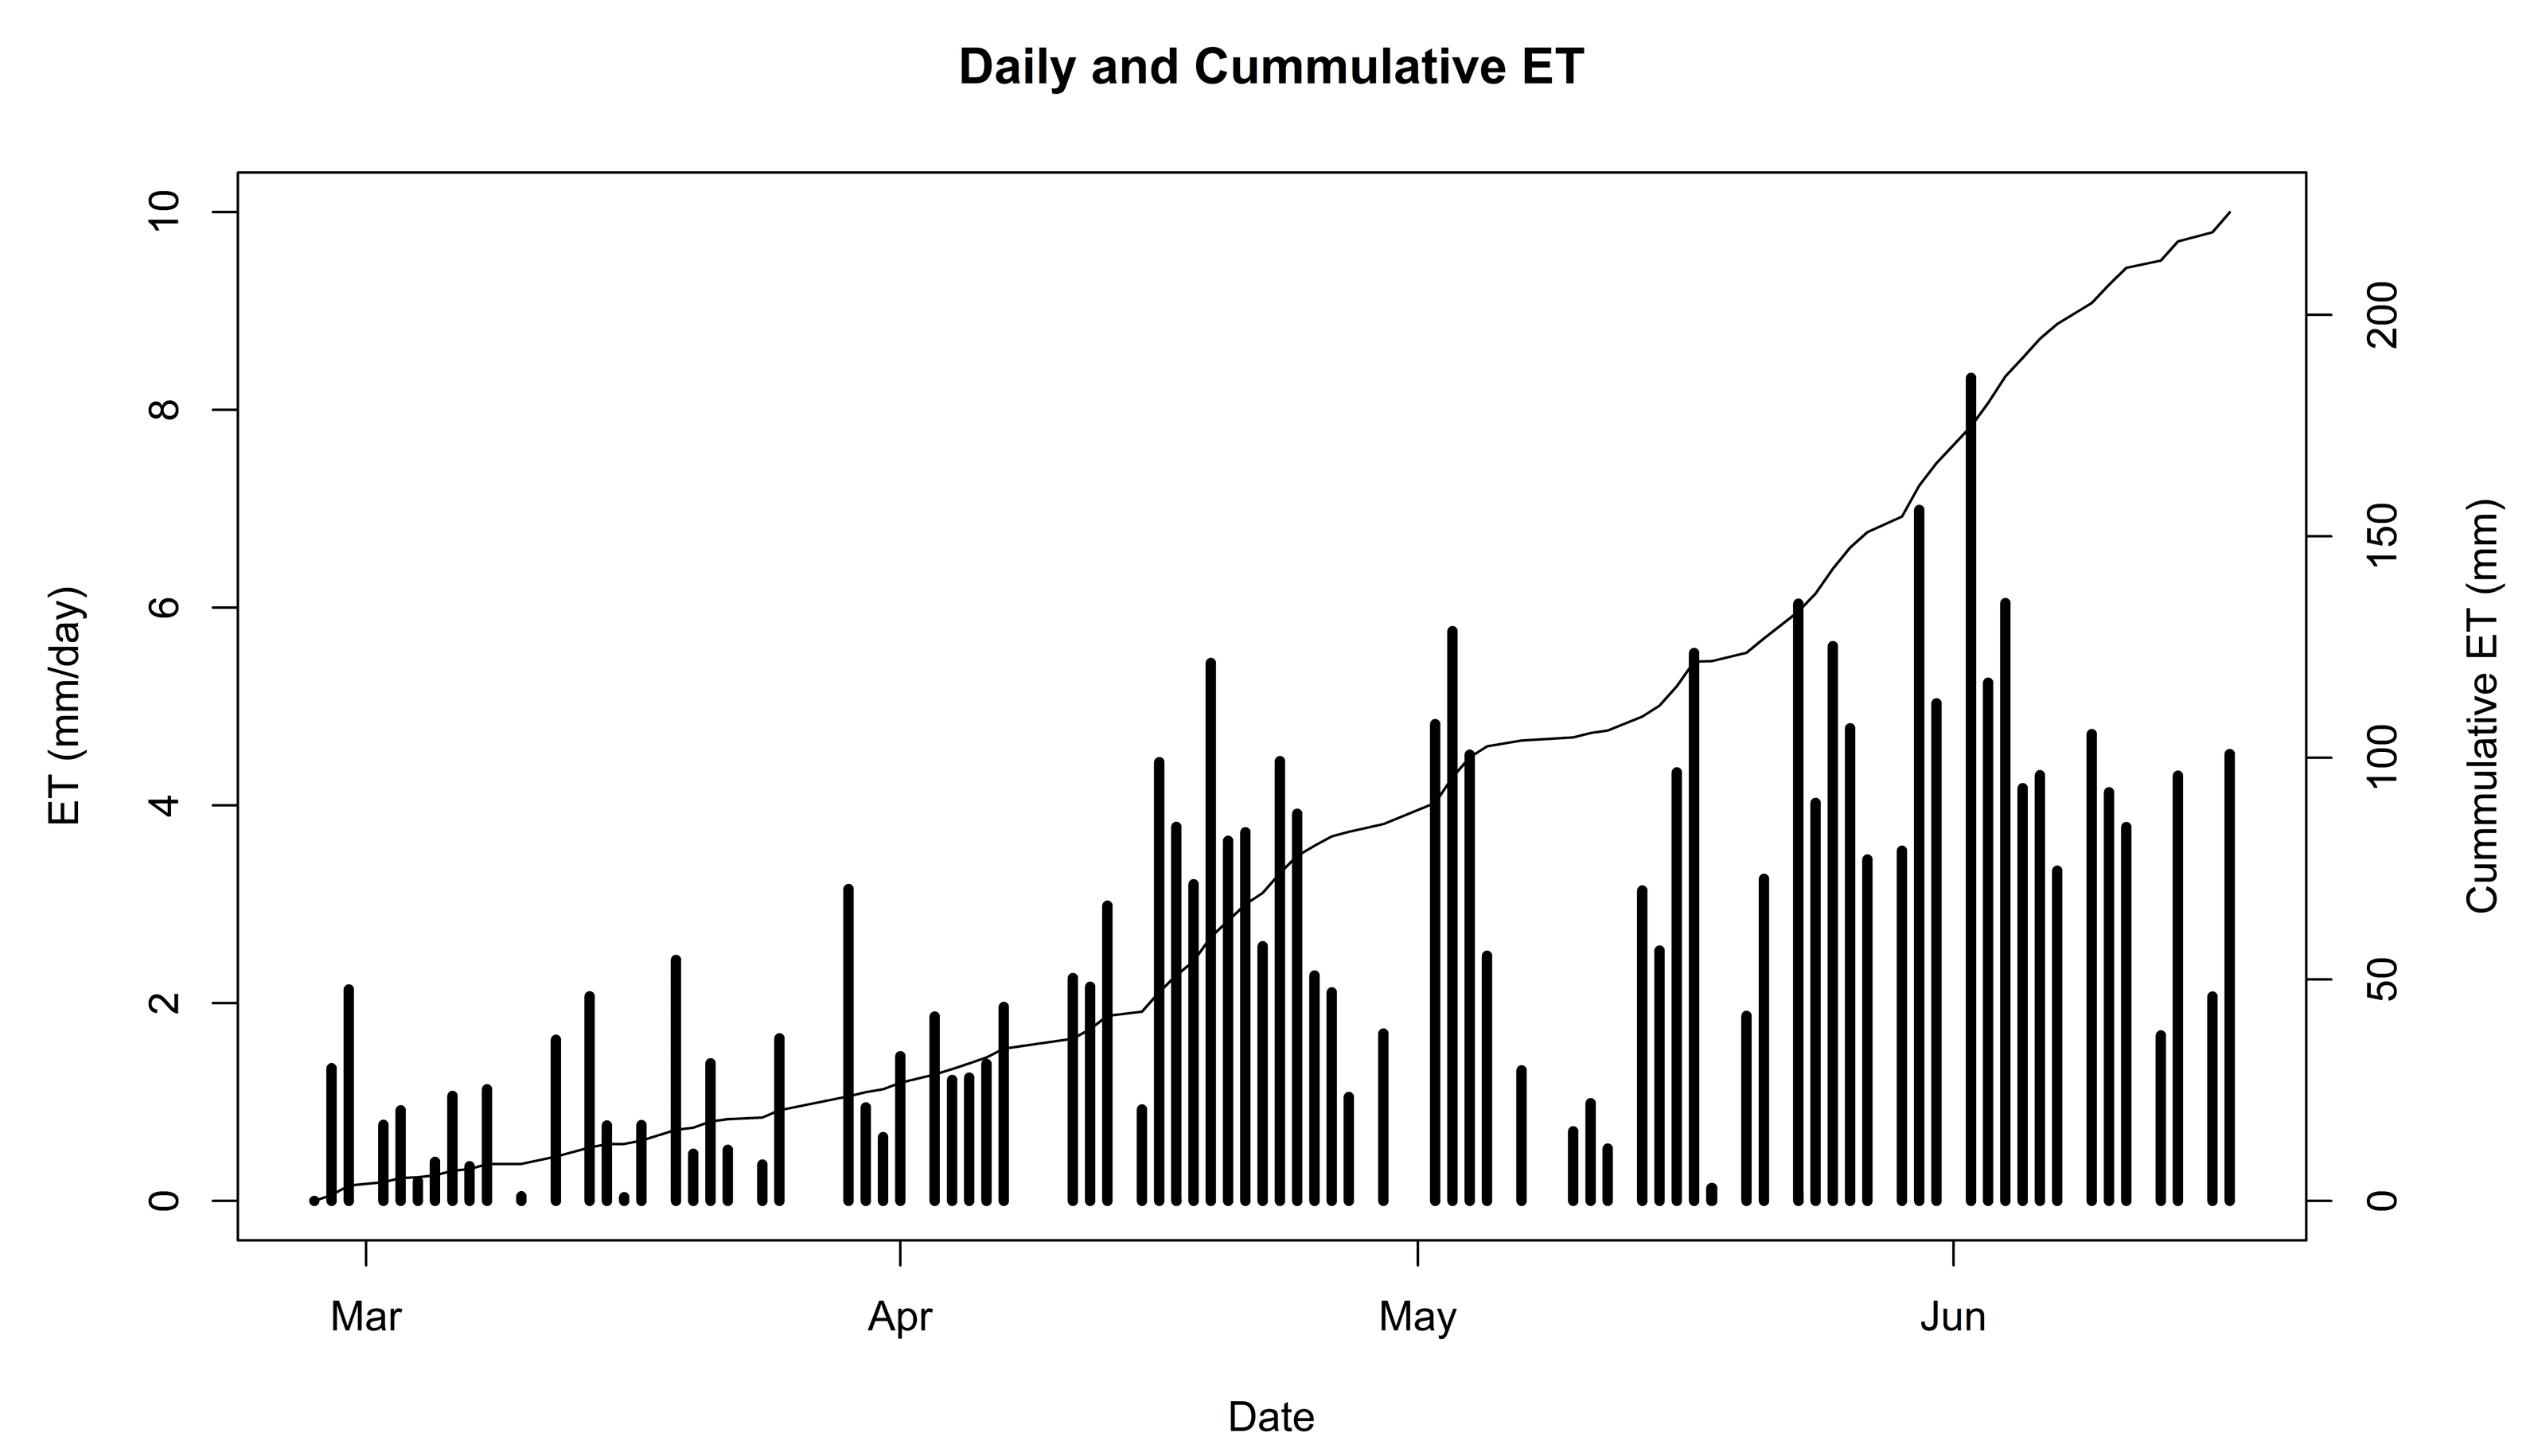
Figure 14.
Lysimeter mass (A,C) measured every ten minutes during 2–3 June and 8–10 June 2023, and calculated hourly evapotranspiration rate (B,D). The vertical lines indicate the end of each day.
Figure 14.
Lysimeter mass (A,C) measured every ten minutes during 2–3 June and 8–10 June 2023, and calculated hourly evapotranspiration rate (B,D). The vertical lines indicate the end of each day.

Table 1.
Technical specifications for the load cells.
| Sensor Properties | Type/Value |
|---|---|
| Sensor Type | Compression/Tension Load Cell |
| Controlled By | Bridge Input |
| Weight Capacity Max | 100 kg |
| Maximum Overload | 120 kg |
| Electrical Properties | |
| Output Impedance | 350 Ω |
| Supply Voltage Min | 5 V DC |
| Supply Voltage Max | 18 V DC |
| Physical Properties | |
| Compensated Temperature Min | −10 °C |
| Compensated Temperature Max | 40 °C |
| Operating Temperature Min | −20 °C |
| Operating Temperature Max | 55 °C |
| Cable Length | 3 m |
| Cable Gauge | 20 AWG |
| Material | Alloy Steel |
| Screw Thread Size | M6 |
Source: https://www.phidgets.com/?tier=3&catid=9&pcid=7&prodid=229#Tab_Specifications (accessed 12 August 2023).
Table 2.
Web link to information about each component.
| Components | Web Link (accessed on 20 October 2023) |
|---|---|
| Microcontroller | https://docs.particle.io/reference/datasheets/b-series/brn404x-datasheet/ |
| Terminal block | https://www.adafruit.com/product/2926 |
| Multiplexer | https://www.adafruit.com/product/5626 |
| ADC | https://www.adafruit.com/product/4538 |
| Load cells | https://www.phidgets.com/?tier=3&catid=9&pcid=7&prodid=229 |
| Li-Po battery | https://www.adafruit.com/product/328 |
| Solar panel | https://www.amazon.com/gp/product/B099RSLNZ4/ |
| Instrument enclosure | https://www.amazon.com/gp/product/B07YBXSG1J/ |
| STEMMA cable | https://www.adafruit.com/product/4210 |
| STEMMA male header cable | https://www.adafruit.com/product/4209 |
Table 3.
Cost of components for the IoT scale system.
| Components | Quantity | Unit Price (USD) | Total | % Total Cost |
|---|---|---|---|---|
| Microcontroller | 1 | USD 65.31 | USD 65.31 | 19.0% |
| Terminal block | 1 | USD 14.95 | USD 14.95 | 4.4% |
| Multiplexer | 1 | USD 6.95 | USD 6.95 | 2.0% |
| ADC | 4 | USD 5.95 | USD 23.80 | 6.9% |
| Load cells | 4 | USD 45.00 | USD 180.00 | 52.4% |
| Li-Po battery | 1 | USD 14.95 | USD 14.95 | 4.4% |
| Solar panel | 1 | USD 13.99 | USD 13.99 | 4.1% |
| Instrument enclosure | 1 | USD 18.62 | USD 18.62 | 5.4% |
| STEMMA cable | 4 | USD 0.95 | USD 3.80 | 1.1% |
| STEMMA male headers cable | 1 | USD 0.95 | USD 0.95 | 0.3% |
| Total | USD 343.32 |
Disclaimer/Publisher’s Note: The statements, opinions and data contained in all publications are solely those of the individual author(s) and contributor(s) and not of MDPI and/or the editor(s). MDPI and/or the editor(s) disclaim responsibility for any injury to people or property resulting from any ideas, methods, instructions or products referred to in the content. |
© 2024 by the author. Licensee MDPI, Basel, Switzerland. This article is an open access article distributed under the terms and conditions of the Creative Commons Attribution (CC BY) license (https://creativecommons.org/licenses/by/4.0/).
Share and Cite
MDPI and ACS Style
Payero, J.O. An Effective and Affordable Internet of Things (IoT) Scale System to Measure Crop Water Use. AgriEngineering 2024, 6, 823-840. https://doi.org/10.3390/agriengineering6010047
AMA Style
Payero JO. An Effective and Affordable Internet of Things (IoT) Scale System to Measure Crop Water Use. AgriEngineering. 2024; 6(1):823-840. https://doi.org/10.3390/agriengineering6010047
Chicago/Turabian StylePayero, José O. 2024. "An Effective and Affordable Internet of Things (IoT) Scale System to Measure Crop Water Use" AgriEngineering 6, no. 1: 823-840. https://doi.org/10.3390/agriengineering6010047