

An Incident Detection Model Using Random Forest Classifier

College of Engineering, American University of Sharjah, Sharjah P.O. Box 26666, United Arab Emirates
*
Author to whom correspondence should be addressed.
Smart Cities 2023, 6(4), 1786-1813; https://doi.org/10.3390/smartcities6040083
Submission received: 16 June 2023
/
Revised: 10 July 2023
/
Accepted: 11 July 2023
/
Published: 17 July 2023
(This article belongs to the Topic Artificial Intelligence Models, Tools and Applications)
Abstract
:Traffic incidents have adverse effects on traffic operations, safety, and the economy. Efficient Automatic Incident Detection (AID) systems are crucial for timely and accurate incident detection. This paper develops a realistic AID model using the Random Forest (RF), which is a machine learning technique. The model is trained and tested on simulated data from VISSIM traffic simulation software. The model considers the variations in four critical factors: congestion levels, incident severity, incident location, and detector distance. Comparative evaluation with existing AID models, in the literature, demonstrates the superiority of the developed model, exhibiting higher Detection Rate (DR), lower Mean Time to Detect (MTTD), and lower False Alarm Rate (FAR). During training, the RF model achieved a DR of 96.97%, MTTD of 1.05 min, and FAR of 0.62%. During testing, it achieved a DR of 100%, MTTD of 1.17 min, and FAR of 0.862%. Findings indicate that detecting minor incidents during low traffic volumes is challenging. FAR decreases with the increase in Demand to Capacity ratio (D/C), while MTTD increases with D/C. Higher incident severity leads to lower MTTD values, while greater distance between an incident and upstream detector has the opposite effect. The FAR is inversely proportional to the incident’s location from the upstream detector, while being directly proportional to the distance between detectors. Larger detector spacings result in longer detection times.
1. Introduction
As part of smart cities, traffic management is a major operational component. Modern traffic management systems depend on advanced technologies as the main drive for their functions. In most cases, traffic management is operated through a traffic management center (TMC) that includes several modules including incident management. Traffic incidents refer to any unexpected events or situations that occur on the road network, including accidents, breakdowns, and debris on the road [1,2,3,4,5]. These incidents can have severe negative impacts on traffic operations, the economy, Gross Domestic Product (GDP), injuries, and fatalities [4,6]. The causes of traffic incidents vary and can include human factors such as driver error, distracted driving, speeding, driving under the influence of drugs or alcohol, and fatigue [7]. Other causes include vehicle malfunctions, poor road conditions, weather, and infrastructure issues [8]. Traffic incidents often result in traffic congestion, delays, reduced capacity, increased travel time, lost productivity, and increased fuel consumption [8,9]. Traffic crashes cause more than one million deaths every year, between 20 and 50 million people suffer non-fatal injuries and disabilities, and costing around 3% loss of the gross domestic product [10]. In addition, road traffic injuries are the leading cause of death for children and young adults aged 5–29 years as approximately 1.3 million people die each year as a result of road traffic crashes [10]. Researchers have attempted to analyze the causes, contributing and determinant factors, and effects of road traffic accidents with regard to their overall linkage with human security [11]. Thus, early incident detection and management is one of the crucial functions in any Traffic Management Center (TMC), to apply timely and effective response such as dispatching of emergency services and incident management crews, control and re-routing the traffic around incident locations and provision of real-time traffic information for road users [5,12,13,14]. In 2011, the United Nations released the Global Plan for the Decade of Action for Road Safety to reduce the number of road traffic deaths and injuries [15]. Recently, incident detection systems have been developed utilizing artificial intelligence and machine learning due to their ability to differentiate the patterns of normal and abnormal traffic conditions, and to classify traffic data as either normal, abnormal, or incident conditions. In contrast to previous research focusing on individual factors, overlooking the simultaneous consideration of multiple critical factors. This study aims to address this gap by developing an AID model that considers four interrelated critical factors, which significantly impact the performance of AID systems. The primary contribution of this study lies in the development of AID model that integrates all these critical factors, surpassing the limitations of existing approaches. This model is designed to improve the accuracy, speed, and reliability of incident detection, while maintaining its applicability across different transportation contexts. This research aims to contribute to the field of transportation management, fostering a safer and more efficient road network through the consideration of all possible factors known or believed to impact the performance of AID systems. Ultimately, the improved incident detection capabilities have the potential to mitigate the negative impacts of traffic incidents on the economy, safety, and traffic operations. In addition to its impact on transportation management, incident detection plays a crucial role in the development of smart cities. As cities strive to become more intelligent and interconnected, efficient incident detection systems become essential components. By leveraging advanced technologies such as artificial intelligence and machine learning, incident detection systems contribute to creating safer and more efficient urban environments. These systems enable proactive response strategies, real-time traffic management, and the provision of accurate information to road users. The integration of incident detection into the broader context of smart city initiatives allows for the optimization of resource allocation, improvement of emergency response times, and enhancement of overall urban mobility. The alignment with the vision of smart cities, which aim to leverage technology and data for the creation of sustainable, livable, and resilient urban environments, is facilitated by this integration.
2. Literature Review
The incident detection systems have evolved from non-automatic detection systems that relied on receiving phone calls from eyewitnesses or reports from traffic operators upon observing incidents [16] to Automatic Incident Detection (AID) systems. Such systems consider traffic data collected from the road continuously or simulated by traffic simulator software and analyze them to extract traffic patterns as either normal or abnormal [17]. The development of these AID systems has been ongoing since 1970’s and continues to the present day [18,19,20,21,22,23]. The main premise of these systems is that when an incident occurs, it typically blocks one or more lanes on the road, reducing its capacity. This bottleneck can create queues of vehicles at the location of the incident, propagating to the upstream section of the road, disrupting normal traffic [24,25]. Within a congested traffic stream, the traffic flow and speed of vehicles at the upstream section of the road decrease, while the occupancy or density of this section increases [24,26,27,28]. On the other hand, at the downstream section, the speed of the vehicles increases, while the density, occupancy, and traffic volume decrease [29]. Therefore, there is an anomaly in traffic between the upstream and downstream sections on the road. The AID systems synchronously monitor these traffic anomalies to detect the occurrence of traffic incidents and automatically trigger incident alarms when the input traffic data meet certain preset conditions [30].
AID systems can be categorized based on the method they collect traffic data, with fixed sensors such as surveillance cameras, radars or loop detectors [31,32,33], or moving sensors such as probe vehicles, drones or divers’ smartphones being used [1,30]. Alternatively, AID systems can also be categorized based on the data processing and detection algorithms they use to detect incidents [34,35]. These algorithms can be grouped into four categories: comparative, statistical, artificial intelligence-based, and video image processing algorithms [36].
2.1. Performance Measures
The performance of an AID algorithm is usually evaluated by three measures; Detection Rate (DR), False Alarm Rate (FAR) and Mean Time to Detect (MTTD) [37]. The three measures can be defined as:
The FAR quantifies the number of false alarms generated by the system. Two methods exist in the literature for calculating the FAR [39]. The first method calculates FAR as the ratio of the number of false alarms generated by the algorithm to the total number of alarms generated by the algorithm [38,40]. The second method calculates FAR as the ratio of the number of false alarms generated by the algorithm to the total number of times the algorithm was applied [39,41].
MTTD is a measure of the time it takes for an AID system to correctly detect an incident after it has occurred [40]. MTTD is a measure of the responsiveness and accuracy of the system in detecting incidents.
The DR, FAR, and MTTD reflect the effectiveness, reliability, and efficiency of AID algorithms, with trade-offs between them. Increasing DR may lead to higher FAR, requiring a balance between accurate incident detection and minimizing false alarms [35,42,43]. On the other hand, to shorten MTTD, it may increase the FAR. However, a persistence test can be used to reduce the false alarms, where an incident alarm triggers only after an incident pattern is observed and lasts for a number of consecutive intervals [39,44].
Incident detection is a binary classification problem, where there are two classes, class 1 (no incident) and class 2 (incident). As mentioned before, incidents are non-recurring events therefore the first binary class is the majority class, and the second class is the minority class thus this is imbalanced binary classification problem. In the imbalanced classification problems, the majority class is referred to as the negative outcome while the minority class is referred to as the positive outcome [45,46]. The confusion matrix, shown in Table 1, is used to provide insight into the performance of the classification model by showing which class was classified correctly and which was classified incorrectly.
The accuracy of the model is measured as the ratio between the true predictions to the total number of evaluated cases. It is argued that accuracy is not a suitable measure in imbalanced datasets as it does not distinguish between the numbers of correctly classified cases of different classes, leading to erroneous conclusions. In the context of incident detection, it is possible for an AID model to exhibit high accuracy. This high accuracy is primarily attributed to the model’s proficient classification of majority class instances, which represent no incident conditions and are numerically dominant. However, the emphasis on accuracy can obscure the model’s limited ability to detect actual incidents, resulting in a significant percentage of undetected incidents going unnoticed. These observations shed light on the limitations of accuracy as a reliable metric for incident detection because it does not provide a comprehensive assessment of the model’s performance in identifying incidents. Consequently, there is a clear need to explore and incorporate alternative evaluation metrics that can effectively capture the model’s capability to detect incidents, irrespective of the class imbalance. Such metrics can offer a more accurate evaluation of the model’s overall effectiveness in incident detection tasks.
The precision of the model is a metric that measures how many positive instances were classified correctly among the total number of positive instances classified by the model [45,46]. Although precision is a useful performance metric, it doesn’t indicate how many real positive instances were misclassified as false negative instances. Another metric that is often used to evaluate the performance of the model is the recall, which quantifies the number of positive instances that were classified correctly among all positive instances in the dataset [45,46]. It is challenging to obtain a model with high precision and high recall as increasing the recall comes at the expense of a reduction in precision. Nonetheless, the F-score is a new metric that is widely used to capture the properties of both the precision and recall of the model [34]. The F-score represents the harmonic mean of the two metrics and can be calculated as follows:
When relating the incident detection measures to the binary classification measures, the DR represents the recall of the incident detection algorithm that was discussed previously. Also, the FAR can be calculated as (1-precision).
The four main categories of incident detection algorithms are discussed in the following subsections. These categories are comparative, statistical, artificial intelligence-based, and video image processing algorithms, highlighting their detection logic, strengths, and limitations.
2.2. Comparative Algorithms
These algorithms collect traffic parameters, such as traffic volume, traffic speed, and occupancy, from the road and compare them against preset thresholds that are defined based on historical data, which represents normal traffic conditions. If the collected or observed traffic data exceeds these thresholds, it can be an indication of the occurrence of incidents [30,35]. The most commonly used algorithms in this category include the California algorithm series [21,22,35,47,48,49,50,51], the Pattern Recognition (PATREG) algorithm [52], and the All-Purpose Incident Detection (APID) algorithm [51,53]. However, there are some limitations to the use of comparative algorithms. Obtaining the thresholds is difficult and time-consuming as they are calibrated from historical incident data and vary for each location, where the detectors are installed [35]. Additionally, these thresholds depend on road geometries, which require extensive calculation and computational time. If the thresholds are too high, the algorithm may fail to detect certain types of incidents, while if the thresholds are too low, the algorithm may generate a large number of false alarms, which can lead to wasted resources and a loss of trust in the system. Moreover, false alarms can be initiated because of some factors such as grade changes, lane drops, ramps between detector stations, frequent bottlenecks during peak periods, or failures of the detectors. These factors may cause natural changes in traffic parameters between the upstream and downstream sections that are similar to the patterns recognized by the algorithm as potential incidents [26,54,55].
2.3. Statistical Algorithms
These algorithms analyze the collected/observed traffic data using various statistical analyses to determine the difference between actual or observed data obtained from the road and the predicted or estimated traffic parameters from the statistical model. If the difference is statistically significant, an incident condition is identified [56,57]. The Standard Normal Deviate (SND) algorithm [19], smoothing algorithms [18], Bayesian algorithm [23,58], and time series [35,37,52,56,59,60,61,62] are some of the most common algorithms in this category. However, statistical algorithms can be sensitive to the presence of outliers [63,64,65,66], and this can affect their performance. In addition, these algorithms can require extensive computational efforts [35], particularly when dealing with large datasets. Moreover, the time series algorithms assume that normal traffic follows a predictable pattern over time, which is not necessarily true because of the random nature of traffic [28,36]. Therefore, these algorithms may generate false alarms or fail to detect some incidents that occur at unexpected times or locations [28].
2.4. Artificial Intelligence Based Algorithms
Artificial Intelligence (AI) based algorithms have gained popularity in the field of incident detection systems [64,65,66,67,68]. These algorithms leverage AI to classify traffic data as either normal or incident conditions. To achieve this, Machine Learning (ML), a subset of AI, is used, which models the optimal mapping between a set of inputs and a set of outputs [69]. The ML algorithms used in AID systems include Random Forest (RF) [40,70], Artificial Neural Networks (ANN) [44,71,72,73,74,75,76,77,78,79], Fuzzy Logic (FL) [80,81,82,83,84,85], Support Vector Machine (SVM) [28,86,87], or a combination of multiple models [17,29,30,35]. These algorithms have shown promising and superior performance in AID systems by learning from the input data and deducing the pattern without relying on a predefined mathematical models [65,66,67,68]. However, the performance of these algorithms depends on their parameters and hyperparameters, which require proper selection and fine-tuning or optimization. Unfortunately, there are no set rules to determine the optimal values for these hyperparameters, so they are often determined based on trial and error.
The Random Forest (RF) classifier is an ensemble learning algorithm that is widely used in machine learning models [88,89,90]. RF operates by constructing a forest of several decision trees that operate as an ensemble. These decision trees can be either classification trees or regression trees, hence RF can be used for both classification and regression problems. During the training phase, the RF uses sampling with replacement (bootstrap sampling) from the original data to create multiple subsets with the same number of observations as that of the original data [89]. Bootstrap sampling helps to improve the classification performance and the depths of the decision trees. At the testing phase, RF gets class prediction from each individual decision tree, and the final prediction output is based on majority voting. This step is called bagging.
The advantage of RF is that it creates uncorrelated (or relatively low correlated) individual decision tree classifiers, so it has superior performance than any of the individual constituent decision trees [89,90]. The higher the number of decision trees in RF, the higher accuracy and robustness of the algorithm. However, it is important to note that a higher number of decision trees can also cause an increase in computational time and complexity. The RF model has been utilized to develop various artificial intelligence systems, including traffic incident detection models. Dogru and Subasi [70] used RF to develop a traffic incident detection model. The performance of the model was assessed in terms of DR and FAR. The RF model achieved a DR of 94% and FAR of 0.203%. However, the MTTD of this model was not measured in this study. Similarly, Ahuja [40] used the RF model to detect congestion and incidents using the sensor speed and occupancy data. The performance of the developed model was measured in terms of DR and FAR. The DR of the RF algorithm ranged from 94% to 97%, and the FAR of the RF algorithm ranged from 1% to 3%. The RF algorithm proved to be effective in detecting congestion and incidents.
2.5. Video Image Processing Algorithms
Video image processing algorithms have been widely used in detecting traffic incidents. These algorithms make use of video feeds of traffic collected from surveillance cameras or Closed-Circuit Television (CCTV) installed on roads, which are then broken into frames [30,34,56]. The road segments and lanes, as well as moving vehicles, are extracted from these frames using image processing techniques. The algorithms then track these vehicles to create time-space trajectory diagrams, which are used to extract traffic parameters of the vehicles [91,92,93,94,95]. These parameters are analyzed to determine normal and abnormal traffic conditions. By detecting anomalies in the traffic flow, such as stopped vehicles or sudden changes in speed, the algorithms can alert authorities to potential incidents. These algorithms can also be used to monitor traffic flow, detect congestion, and optimize traffic operations, making them valuable tools in improving road safety and efficiency. However, the lighting conditions, extreme weather conditions and coverage range of the camera that is used to capture traffic video are the main limitations of when using this procedure [95].
Based on the extensive literature review conducted, it becomes evident that most of the existing AID models have primarily focused on one or two factors, while neglecting the comprehensive consideration of multiple factors that can impact the efficiency of incident detection algorithms. These factors include, but are not limited to, the severity of the incident, the distance between detectors or sensors, the incident location in relation to the detectors, and the traffic condition or congestion level [96]. Recognizing the complexity and challenges associated with incorporating all these factors into a single model, none of the existing models has been designed to consider all of these factors together [80]. Therefore, this study aims to address this research gap by developing a generic and effective incident detection model that can simultaneously take multiple variables into account. Additionally, the impact of these variables on incident detectability will be thoroughly investigated, contributing to a deeper understanding of the interplay between these factors and the performance of AID systems.
3. Methodology
This paper considered a section of a major freeway in Dubai, United Arab Emirates. This freeway section includes varying numbers of lanes and different types of junctions, posing challenges for the developed AID model.
3.1. Experimental Design
Two main sources of traffic data are available: real data collected from sensors and cameras, and simulated data generated by traffic simulators. Real data has limitations such as high cost, limited coverage, and weather sensitivity. Additionally, detailed incident information may not always be available. The aim of this paper is not only to develop an accurate and efficient AID model but also to examine the impact of various factors on its performance. Simulated data offers benefits including cost-effectiveness, flexibility, control over variables, privacy protection, known incident occurrence time, and detailed analysis capabilities. However, simulated data is not a perfect substitute for real data, and situations may arise where real-world data is more useful or accurate. Therefore, this paper utilizes simulated data to develop the proposed models, while acknowledging the importance of real-world data.
The simulation software VISSIM [97] is employed to create a microscopic model of the considered section, allowing for the simulation of normal and incident scenarios.
Four factors are taken into account to generate a diverse dataset, including congestion level, distance between counting stations, incident location, and incident severity. The Volume-to-Capacity ratio (V/C) is typically the primary performance measure used for highways or freeways, representing the comparison between roadway demand (vehicle volumes) and roadway supply (carrying capacity) [98]. However, it is important to note that the conventional V/C ratio may not accurately reflect true congestion levels in cases where vehicle demand exceeds freeway capacity. To address this, the Demand to Capacity ratio (D/C) is used as an alternative measure in this paper. Four D/C ratios are considered to represent different traffic congestion levels: 0.6, 0.8, 1.0, and 1.2, which correspond to uncongested, congested, very congested, and oversaturated conditions, respectively. Each D/C ratio is tested with three detector spacings (500 m, 1000 m, and 1500 m) and three incident location cases. These locations correspond to 0.25, 0.5, and 0.75 of the detectors spacing. Three incident severities are simulated as well, representing light, medium, and extreme blockage by blocking one, three, and five lanes out of the seven lanes, respectively. To enhance the diversity of the dataset, four additional D/C ratios (0.4, 0.5, 0.9, and 1.1) are included. In these scenarios, variations are introduced either in the spacing scenarios, incident location, severity of incidents, or a combination of these factors compared to the previous four D/C ratios. For the D/C ratios of 0.4 and 0.5, the incident location is fixed at 250 m from the upstream station, while the three detector spacings (500 m, 1000 m, and 1500 m) are used. Two lane blockage patterns (blocking three and four lanes) are considered for these ratios. For the D/C ratios of 0.9 and 1.1, two detector spacings (750 m and 1250 m) are utilized, and the incident location is simulated at 250, 375, and 625 m from the upstream station. Three lane blockage patterns (blocking two, three, and four lanes) represent light, medium, and high blockage. By varying the detector spacing pattern, incident severity, and incident location, a diverse dataset is created to challenge the RF model. The goal is to develop a generic incident detection model capable of distinguishing between normal and abnormal traffic patterns in various scenarios. Each run is simulated for 5400 s, with the first 900 s serving as a warm-up period to load the vehicles into the network and establish normal traffic flow. The traffic parameters are collected at 30-s intervals over the following hour, while the last 900 s ensure a stable traffic flow during the middle 3600 s (one hour), allowing for representative data collection under normal traffic conditions.
3.2. Generation of Normal Conditions
To simulate normal traffic scenarios, combinations of D/C ratios and detector spacing mentioned earlier are used, without any incidents. To ensure reliable results, each scenario is simulated multiple times with different seed numbers due to the stochastic nature of microsimulation. Normal scenarios are simulated for ten runs to establish a baseline and capture a broad range of stable and predictable traffic conditions [99,100,101,102,103,104,105,106]. The results from the simulation runs are averaged using a trimmed average approach to reduce the impact of randomness and eliminate outliers [101,107]. For these scenarios, traffic parameters such as speed, flow, and occupancy of the upstream and downstream stations are collected.
3.3. Generation of Incident Conditions
As VISSIM is a collision-free traffic simulator and does not directly support creating traffic incidents [108], incidents are generated by scheduling vehicles to make full stops in predetermined locations for 20 min (1200 s) from the 1800th s to the 3000th s. These stopped vehicles block one or more lanes, creating different lane blockage patterns and severity cases. By varying the blockage pattern across different D/C ratios, the model is exposed to a wide range of incident scenarios, facilitating robust and accurate performance during training and testing. Multiple scenarios are simulated, each combining one D/C ratio, one distance between detectors, one incident location case, and one incident severity case. Five simulation runs with different random seed numbers are conducted for each scenario. The traffic parameters collected from the upstream and downstream detectors represent both incident and normal conditions. The data collected before and after the occurrence of an incident is considered normal conditions. Training the model with disturbed data also enhances their adaptability to real-world scenarios with incomplete or noisy data. A total of 150 scenarios are simulated, with 22 scenarios excluding any incidents and the remaining 128 scenarios including incidents. Traffic parameters are collected at 30-s intervals, resulting in 120 intervals per scenario and a total of 18,000 intervals across all 150 scenarios. The data includes intervals representing normal conditions (12,880 intervals) and incident conditions (5120 intervals). In this paper, a 5-fold cross-validation method is employed to evaluate the model’s fitness, tune parameters, and avoid bias [109,110,111]. The full dataset was split into cross-validation dataset and testing dataset, by allocating 80% of the intervals to the cross-validation set and the remaining 20% to the testing set [112]. This approach ensures that the selected scenarios represent a comprehensive range of incident scenarios and facilitates a thorough evaluation of the model’s performance. The incident scenarios are grouped based on their D/C ratios, with each group including incident scenarios with one D/C ratio, various incident locations, station spacings, and incident locations relative to the upstream stations. A subset of scenarios from each group is selected as a testing dataset, incorporating variations in D/C ratios, lane blockage, incident locations, and station spacing. This selection approach ensures the dataset represents a wide range of incident scenarios and enables a comprehensive evaluation of the model’s performance.
3.4. Model Development
The RF is known for its effectiveness in various classification tasks, including traffic incident detection. It can handle high-dimensional datasets and is robust against outliers and noise. The RF model employs 16 input variables that encompass flow rate, speed, and occupancy at both upstream and downstream stations. Additionally, they include differences in flow rate, speed, and occupancy between stations, as well as relative differences in these parameters. Relative differences refer to the comparison of measurements between the upstream and downstream stations. Two types of relative differences were considered: the difference relative to the upstream station and the difference relative to the downstream station. Another considered variable is the distance between upstream and downstream counting stations. For the implementation of the RF model, RapidMiner, an open-source data science platform, is utilized. RapidMiner provides a user-friendly interface that facilitates the development and optimization of machine learning model [113].
3.5. Tunning of Hyperparameters of Random Forest Model
As mentioned earlier, the hyperparameters play a crucial role in determining the performance of the RF model. Hyperparameters are essential parameters that are set before the training process and cannot be learned from the data [114]. Setting hyperparameters too high can lead to overfitting, while setting them too low can cause underfitting. Hyperparameter optimization is the process of identifying the optimal values for hyperparameters, typically through trial and error. One widely used method is grid search, where a predefined set of values is tested for each hyperparameter to determine the best combination [115]. This exhaustive search allows for the identification of optimal hyperparameter values. To evaluate the RF model’s performance and prevent overfitting or underfitting, cross-validation is employed [115,116,117,118]. It divides the data into subsets, trains the model on some subsets, and evaluates it on the remaining subsets. This approach helps assessing the model’s generalization capability. In the RF model, the main hyperparameters that are optimized include the number of trees, maximal depth, subset ratio, and confidence parameter of pruning. Each of these hyperparameters has a distinct impact on the RF model. For instance, the number of trees determines the number of decision trees created and used in the final prediction [89]. The maximal depth controls the depth of each decision tree, influencing the complexity and interpretability of the model [119]. The subset ratio determines the proportion of data samples used for training each tree, affecting the diversity and randomness of the ensemble [88]. The confidence parameter of pruning determines the threshold for pruning decision tree branches, impacting the trade-off between model complexity and prediction accuracy [89]. Given the computational expense, the optimization of hyperparameters in the RF model is approached in a stepwise manner. Instead of optimizing all hyperparameters simultaneously, they are optimized one at a time.
4. Results and Discussion
To better understand the developed model performance, the confusion matrices of the cross-validation and testing processes are presented and discussed in detail. Additionally, a comparison is made between the performance of the developed model and some of the existing AID models. Finally, the analysis is carried out to examine the impacts of the factors considered in this research on the model’s efficacy.
4.1. Optimization Results of Random Forest Model Hyperparameters
At the end of the optimization process used to fine-tune the hyperparameters of the RF model, the local optimal values of the hyperparameters were determined as follows: the number of trees was set to 380, maximal depth was set to 27, subset ratio was set to 0.8, and confidence was set to 2 × 10⁻⁷. Table 2 and Table 3 show the confusion matrices of the optimized RF model during cross-validation and testing phases. The process for tuning the hyperparameters for the Random Forest model was extensively discussed in a previous publication [120].
4.2. Results of Cross-Validation Phase of Random Forest
In this section, the details of incident scenarios in the cross-validation dataset are presented. The calculations of DR, FAR, and MTTD of this dataset are illustrated. The confusion matrices presented in Table 2 and Table 3 from the cross-validation and testing phases require further analysis to calculate the three performance measures: DR, FAR, and MTTD. During both the cross-validation and testing phases, the model’s predictions are compared against the actual status of the traffic for each interval in both datasets. Based on this comparison, the model’s prediction is classified as true, false alarm, or missed. A sample of this comparison during one of the scenarios used in the cross-validation dataset is shown in Table 4.
The observations made during this analysis are as follows:
- Fluctuations in the incident alarm are observed after the incident had occurred (at the 30th interval) until the 70th interval (20 min) as illustrated in Table 4. The algorithm sometimes labels intervals as normal despite them being incidents. This fluctuation arises from differences in volume, speed, and occupancy between upstream and downstream stations, which are input variables used for incident detection. Initially, significant differences between stations allow the model to detect incidents easily. However, as the incident persists, these differences diminish, potentially leading to incorrect labeling as a normal condition. Therefore, it is important to note that the detection is counted at the first alarm produced by the model, as once the operators receive an alarm, they will check the cameras to verify its authenticity.
- In one of the scenarios, some false alarms occurred at consecutive intervals, as shown in Table 5.
Treating these consecutive false alarms as separate alarms is unrealistic and affect the reliability of the model. An assumption regarding false alarms has been made in this paper to consider real-life conditions when calculating the FAR, consecutive false alarms are treated as a single false alarm if they persist for four intervals or less, representing real-life conditions. If there is a gap of more than four intervals, they are considered separate false alarms. This assumption aligns with operational scenarios and aids in estimating the real false alarms. When an incident alarm is received, its authenticity is verified, and appropriate action is taken. Keeping in mind that the interval is 30 s, the check of authenticity may consume more than one interval, therefore, consequtive alarms are considered as one alarm. It is important to note that this assumption may affect the detection time of an incident.
Based on these observations, it can be concluded that calculating DR and FAR from confusion matrices alone can be inaccurate. Further analysis is needed to obtain realistic DR, MTTD, and FAR values. Time to Detect (TTD) is calculated for each incident scenario, focusing on the first interval of incident detection. The DR and FAR are calculated by evaluating the successful incident detection and the number of false alarms, respectively. In this analysis, FAR is calculated as the ratio of the number of false alarms generated by the algorithm to the total number of times the algorithm was applied, which provides a more accurate measure. Analyzing these results provides a comprehensive understanding of the model’s performance.
The cross-validation dataset utilized in this analysis consists of 121 scenarios, comprising 22 normal conditions and 99 incident scenarios. It should be noted that the incident in each scenario starts at the 30th intervals and ends at the 70th interval (i.e., it lasts for 20 min) and the intervals before and after the incident are normal conditions. Accordingly, the total number intervals for incidents is 3960 while the number of intervals for normal conditions is 10,560. In Table 6, the number of false alarms for both sets of scenarios is presented, alongside the number of detected incidents and the MTTD required to identify these incidents.
As shown in Table 6, out of the 99 incident cases included in the dataset, the model is unable to detect 3 incidents (DR of 96.97%). The cross-validation dataset consists of 121 h of traffic data, with traffic state checked every 30 s, resulting in 14,520 model’s applications. During these applications, the model generated a total of 90 false alarms, which resulted in an FAR of 0.62%. In addition, the MTTD = 1.05 min. In order to provide a more comprehensive analysis of the model’s performance in detecting incidents of varying severity levels, Table 7 summarizes its DR, FAR, and MTTD for each level of incident severity.
The results in Table 7 reveal some interesting insights. The severity of an incident, measured by the number of lanes blocked, affects the model’s performance in detecting incidents. When the incident severity is medium to high (two or more lanes are blocked), the model consistently detects all incidents with a DR of 100%. However, incidents with minor severity (only one lane blocked) have a lower DR, possibly because their minor impact on traffic flow makes them less noticeable to the model, especially at low traffic volumes. The highest FAR value was observed in the scenario where four lanes were blocked, reaching 0.972. This indicates that the model is more prone to generating false alarms when a greater number of lanes are blocked. Conversely, the lowest FAR value of 0.613 was recorded when three lanes were blocked. In this scenario, the model demonstrated relatively better performance in detecting incidents, with fewer false alarms. However, there does not appear to be a clear increasing or decreasing trend in the FAR as the number of lanes blocked varies. The FAR values fluctuate across different incident scenarios, suggesting that the severity of incidents, as indicated by the number of blocked lanes, does not consistently correlate with the model’s performance in terms of false alarms. Regarding the MTTD, the MTTD decreases as the severity increases. Incidents with one lane blocked have the longest MTTD at 2.5 min. In contrast, incidents with four or five lanes blocked are detected much faster, with MTTD of 0.5 min and 0.565 min, respectively. This trend can be attributed to the fact that as the severity of the incident increases, its impact on various traffic parameters becomes more significant. Incidents involving the blocking of multiple lanes tend to create larger disruptions in the traffic flow, leading to more noticeable disturbances that can be detected and identified more quickly by the model. Hence, incidents with a higher severity level are detected at a faster rate, resulting in shorter MTTD values. It is important to consider that factors such as D/C ratios, spacing between detectors, and incident locations were not standardized or kept consistent across these incident severity scenarios. These variations in factors can contribute to the observed fluctuations in the FAR values. To obtain a more accurate understanding of the impact of incident severity on the model’s performance, a sensitivity analysis should be conducted. By controlling and standardizing the D/C ratios, detector spacing, and incident locations, the effects of the number of lanes blocked can be isolated, providing clearer insights into its direct influence on the model’s accuracy in detecting incidents without the confounding factors affecting the results.
Next, a sensitivity analysis is conducted to assess the impact of four factors, namely D/C ratio, incident severity, location of the incident, and distance between detectors, on DR, FAR, and MTTD. Each factor is analyzed individually to evaluate its effect on the performance metrics. It should be noted that the 0.4 and 0.5 D/C ratios use different blockage levels (2 or 4 lanes) and have constant incident location relative to the upstream detector. Also, the 0.9 and 1.1 D/C ratios are applied for different spacing between the detectors, different severity of the incident (2, 3, or 4 lane blockage), and different location of the incident. Therefore, these D/C ratios (0.4, 0.5, 0.9, and 1.1) are not considered in the sensitivity analysis. To ensure a fair comparison, incident scenarios with the same severity levels, locations, and detector spacings are selected for the analysis. Specifically, incident scenarios with D/C ratios of 0.6, 0.8, 1.0, and 1.2 are chosen for the analysis.
4.2.1. Impact of D/C Ratio on Performance Metrics
To investigate the impact of D/C ratio on the performance metrics of the incident detection model. The variation in DR, FAR, and MTTD, when the D/C ratio is varied between four ratios (0.6, 0.8, 1.0 and 1.2) is analyzed.
Figure 1 shows that the DR reached 100% for all D/C ratios, except for 0.6, where it reached 85.71%. The low DR at D/C of 0.6 can be attributed to the fact that three incidents out of the total are not detected by the model. These three incidents occurred at low traffic volume (D/C = 0.6), and one lane blockage out of the seven lanes of the road. Therefore, such minor incidents do not have significant effect on the traffic performance and are harder to detect, which resulted in a reduced DR of the model. To confirm this justification for low DR at D/C ratio of 0.6, the DR is calculated for all D/C ratios without the one lane blockage incidents that occurred at 0.6 D/C ratio, and it was consistently 100%. This suggests that the model’s performance can be influenced by the occurrence of minor incidents during low traffic volume, and excluding such incidents can lead to a significantly higher DR. Therefore, it is important to take into account the severity of incidents and the volume of traffic at the time of their occurrence, when assessing the performance of the model in detecting incidents.
Figure 2 shows that there is a variation in FAR with respect to D/C ratio. While the FAR values show some fluctuations, there is an overall trend of decreasing FAR with an increase in D/C ratio from 0.8 to 1.2.
To further understand the impact of minor incidents during low traffic volume on the FAR, Figure 3 shows the relationship between FAR and D/C ratio excluding the one lane blockage incidents that occurred at 0.6 D/C ratio.
After excluding the minor incidents during low traffic volume, it becomes evident that the FAR decreases with the increase in D/C ratio. Specifically, the FAR remains relatively stable for D/C ratios of 1.0 and 1.2, with values of 0.606% and 0.635%, respectively. The decreasing trend of FAR with an increase in D/C ratio can be attributed to the fact that as the congestion level increases, vehicles are more likely to be closely spaced and moving slowly, which can result in more consistent behavior and patterns that are easier for the incident detection system to recognize. In contrast, in case of lower traffic volumes, vehicles may be more spaced and traveling at varying speeds, making it more difficult for the system to distinguish between normal and abnormal traffic behavior. This is consistent with earlier findings that suggested that the low traffic volume conditions lead to low occupancy values and a higher chance of false alarms [121,122].
Figure 4 shows that the MTTD values appear to increase as the D/C ratio increases from 0.8 to 1.2. This suggests that the model is more efficient at detecting incidents when the D/C ratio is low. One possible explanation for the increase in MTTD is that at higher traffic volume and congestion, there are queues at the blocked sections of the road, which can cause delays in traffic flow. As a result, incidents that occur may take longer time to create a detectable impact on the traffic performance, as the travel time between the detectors increases with congestion. Therefore, the detection of incidents can be further delayed.
Figure 5 shows the relationship between MTTD and D/C ratio without the one lane blockage incidents that occurred at 0.6 D/C ratio.
Figure 5 confirms that the inconsistent trend in Figure 4 is mainly because of the existence of minor incidents during low traffic volume as shown in Figure 5, the MTTD consistently increases with the increase in D/C ratio. It should be noted that Figure 1, Figure 2, and Figure 4 included incidents with one lane blockage occurring at a D/C ratio of 0.6, which the model failed to detect some of them due to their minor impact during low traffic volumes. As a result, the trends of DR, FAR, and MTTD in these figures were not consistent. When excluding the minor incidents during low traffic volumes, the DR becomes 100% for all D/C ratios and Figure 3 and Figure 5 show a clearer trend for the FAR and MTTD. Therefore, these incident scenarios will be excluded in the upcoming analysis of the other factors to obtain a clear understanding of the impact of the factor of interest on the performance measures. These findings suggest that D/C ratio is an important factor to consider when evaluating the performance of traffic incident detection models.
4.2.2. Impact of Incident Severity on Performance Metrics
An analysis was conducted to examine the variation in DR, FAR, and MTTD as the lane blockage varied from 1 lane to 5 lanes blockage. The DR of the incident detection system shows a constant value of 100%, for all incident cases except for the one lane blockage at D/C ratio of 0.6, indicating that the system is highly accurate in detecting incidents with a significant impact on traffic flow. However, when considering incidents with one lane blockage at a D/C ratio of 0.6, the DR drops to 88.46%. This result is in line with the findings of previous research [44,81], indicating that the DR tends to be lower for minor severity incidents that occur during periods of low traffic volume.
The FAR values were recorded for different lane blockage categories: 1, 3, and 5 lanes. Interestingly, the FAR remained consistently low, staying below 1% across all lane blockage categories. The FAR was found to be 0.789%, 0.654%, and 0.699% for one, three and five lane blockages, respectively. The results indicate that the number of lanes blocked has a minor impact on FAR as there is a very small variation. These results suggest that the incident detection system is not significantly impacted by the incident severity, except for minor incidents during low traffic volume. The lower FAR values across all lane blockage categories are a good indicator of the efficacy of the detection model in distinguishing actual incidents from normal traffic conditions. It should be noted that when the incidents with one lane blockage at D/C of 0.6 are included, the FAR is 0.64, which is lower than the case without such incidents. The system did not create any false alarms nor detect any incidents during such scenarios. Therefore, when these scenarios were excluded, the FAR increased as the number of false alarms is compared to a smaller number of application intervals.
However, when considering the MTTD in relation to the number of lanes blocked, a different trend was observed. The results revealed a notable variation in MTTD with respect to the number of lanes blocked. When one lane was blocked, the MTTD was recorded as 2.37 min. However, as the number of blocked lanes increased to three and five, the MTTD significantly decreased to 0.589 min and 0.565 min, respectively. These findings indicate that as the incident severity increases, the MTTD decreases, suggesting a faster detection time for incidents. This could be due to the fact that incidents with higher severity are easier to detect as they have a higher impact on the traffic flow, allowing the system to detect such incidents in a shorter time. The current findings are consistent with the results reported by Cheu and Ritchie [44].
These results suggest that the severity of an incident, as represented by the number of blocked lanes, has a significant impact on the MTTD. However, it has no impact on the detectability of the incidents and a minor impact on FAR. The DR of the system is consistently high for all lane blockage, except for one lane blockage at D/C of 0.6. The FAR was marginally affected as the number of lanes blocked changes. The MTTD of the system decreases as the severity of the incident increases, indicating that the system is faster at detecting severe incidents with higher lane blockage.
4.2.3. Impact of Incident Location on Performance Metrics
The incident location varies to be 0.25, 0.5, and 0.75 of the distance between the detectors, from the upstream detector. The DR remained 100% for all three incident locations, indicating the system’s high accuracy in detecting severe incidents that have a significant impact on traffic flow. It should be noted that this analysis excludes one lane blockage incidents at 0.6 D/C ratio, due to their minor influence during low traffic volume, as mentioned previously. It is worth noting that when the incidents with one lane blockage at D/C of 0.6 are included, the DR values are 93.1%, 94.12% and 100% for 0.25, 0.5 and 0.75 incident locations respectively. Regarding the FAR, the FAR decreases as the incident moves further from the upstream detector station, with values of 0.99, 0.74, and 0.36 observed for incident position ratios of 0.25, 0.5, and 0.75, respectively. With the inclusion of incidents that involve a single lane blockage at D/C of 0.6, the FAR values for incident locations of 0.25, 0.5, and 0.75 are 0.99%, 0.71%, and 0.36%. It can be noted that when one lane blockage incidents scenarios were excluded, the FAR slightly increased as the number of false alarms was compared to a smaller number of application intervals. The decrease in FAR can be attributed to the fact that the model did not generate any alarms (false or true) during the minor incidents, resulting in a reduction in the FAR. On the other hand, the MTTD values showed a clear correlation with the incident’s location. As the incident is moved further from the upstream station, specifically from 0.25 to 0.75 of the distance between the detectors, an increase in the MTTD is observed. The MTTD values increase from 0.937 min to 1.522 min. This can be attributed to the fact that as the incident moves further away, the time it takes for its effects to propagate to the upstream detector increases. As a result, the detection of the incident is delayed, leading to higher MTTD values.
It can be concluded that the system is highly effective in detecting incidents at all locations, with a DR of 100%. The FAR is slightly impacted by the incident location, while the MTTD of the system is consistently increasing, as the incident location moves further away from the upstream detector. This trend indicates that the incident location relative to the detector plays a vital role in the MTTD, with incidents occurring closer to the upstream detector being detected faster. Neglecting incident location as a factor can compromise the efficacy of detection algorithms and undermine their overall effectiveness.
4.2.4. Impact of Distance between Detectors on Performance Metrics
The distance between the two detectors varies from 500 to 1500 m, and the DR, FAR, and MTTD are evaluated to assess the impact of this variation on the model’s performance. The results show that DR is constant at 100% for all three spacing values, 500 m, 1000 m, and 1500 m excluding minor one lane blockage incidents at 0.6 D/C ratio. The inclusion of such incidents leads to 100% DR value for 500 m spacing and a reduction in DR values to 96.97% and 92.86% for detector distances of 1000 m and 1500 m, respectively. Notably, of the three minor incidents at 0.6 D/C ratio that were not detected, one occurred at 1000 m detector spacing and the remaining two occurred at 1500 m spacing. An analysis of the relationship between the FAR and the distance between detectors revealed that the FAR was recorded as 0.432%, when the distance between detectors was 500 m. As the distance between detectors increased to 1000 m, the FAR showed an increase to 0.673%. Furthermore, when the distance was further extended to 1500 m, the FAR value reached 1.03%. These findings demonstrate a clear trend in the FAR values, indicating that as the distance between detectors increases, the FAR also increases. The increase of the FAR with the increase of the distance between detectors may be due to the longer travel time of vehicles between detectors. Longer travel time can cause fluctuations in traffic measurements, such as volume, speed, and occupancy, at both the upstream and downstream detectors. These fluctuations may lead to variations in the speed measurements. These fluctuations in traffic measurements can cause false triggers of incident alarms. Regarding the MTTD, it was noted that larger detector spacings are associated with longer detection times. The MTTD was recorded as 0.593 min, 0.788 min, and 1.7 min for the three spacings, respectively. This can be attributed to the increased travel time of vehicles between the detectors, as mentioned previously, which can cause delays in detecting incidents. This is aligned with the findings of Rossi et al. [81] who reported that an increase in the distance between detectors results in higher MTTD values.
The overall observations from this analysis indicate that smaller detector spacings result in better performance in terms of FAR and MTTD. This is due to the closer proximity of the detectors, which reduces the detection time and traffic measurement fluctuations between the detectors. The DR remains 100% in all cases, indicating that the system is capable of detecting all incidents regardless of the distance between the detectors. However, while smaller detector spacings are more effective in detecting incidents, they may not be practical due to installation and maintenance costs. On the other hand, larger detector spacings may be more cost-effective and easier to maintain but may result in higher FAR and MTTD values, which is consistent with previously reported results [84]. Therefore, the decision to select an appropriate detector spacing should consider specific application requirements, available resources, and trade-offs between the performance (in terms of DR, FAR, and MTTD) and the associated costs. An optimal balance between these factors is necessary to ensure an effective and cost-efficient incident detection system.
The DR, TTD, and number of false alarms of each scenario in the cross-validation dataset is calculated, and the results are presented in another publication [123].
4.3. Results of Testing Phase of Random Forest
In this section the performance indicators of the testing dataset are calculated using the same method as in the previous section. A sample of these calculations is shown in Table 8, which depicts the actual traffic status during a one lane blockage incident that occurred 250 m from the upstream detector station, with the distance between the upstream and downstream detector stations being 500 m. The incident occurred at 0.8 D/C ratio, and the table displays the model’s predictions of each interval along with a comparison between the actual status and the predictions.
As observed from Table 8, the model can detect the incident after 3 intervals of its occurrence, with a TTD of 3 interval or 1.5 min, as the incident is detected at interval 34. Additionally, two false alarms were generated at intervals 71, and 72. As the false alarms at intervals 71 and 72 occur at consecutive intervals, they were counted as only 1 false alarm in an hour. The DR, TTD, and number of false alarms for each scenario in the testing dataset is calculated, and the results are presented in another publication [123]. The testing dataset includes 29 incidents, all of which are correctly detected by the model which resulted in a DR of 100%. It should be noted that the testing datasets contain two incidents that blocked one lane and occurred at 0.6 D/C ratio. During the cross-validation phase, the model was unable to detect three out of seven incidents with one lane blockage that occurred during 0.6 D/C ratio. However, during the testing phase, the model was able to detect both incidents with one lane blockage that occurred at the same traffic volume as the incidents in the cross-validation phase. This could be due to the fact that the model learned from its performance during the cross-validation phase and made improvements. Additionally, the location and spacing of the detectors used during the Cross-Validation phase may have contributed to the model’s inability to detect these incidents. Therefore, the location and spacing of the detectors used during the cross-validation phase, as well as the learning and improvements made by the model, may have contributed to the differences in the model’s performance between the cross-validation and testing phases. The MTTD for these 29 incidents is determined to be 1.17 min. During the testing phase, traffic measurements are collected for 29 h, resulting in the application of the model 3480 times. Within these 3480 intervals, the model produced 29 false alarms, FAR of 0.862%. It can be recognized that the FAR for the testing data is higher than that for the cross-validation, following the trend observed in previous literature that suggests the FAR increases with the increase in DR [42,44].
4.4. Discussion of Random Forest Model Results
After analyzing the impact of each of the four factors individually, the impacts of all four factors together on the detectability, TTD, and FAR of incidents in the cross-validation and testing phases is discussed. A selection of incident scenarios that are not detected or have relatively long TTD are analyzed to understand the combined impact of all four factors in the cross-validation and testing phases. During the cross-validation phase, it was previously noted that the model failed to detect three incidents that blocked one lane and occurred during low traffic volume at a D/C ratio of 0.6. These incidents took place at a detector spacing of 1000 and 1500 m respectively. The model’s inability to detect these incidents can be attributed to three key factors: traffic volume, incident severity, and detector spacing, which have been discussed earlier. The low severity of these incidents, combined with their occurrence during low traffic volume and the significant distance between the detectors, all contributed to the model’s inability to detect them. The model was able to detect an incident where only one lane was blocked, and the D/C is 0.6. The incident occurred 750 m from the upstream station with a spacing of 1000 m between the stations. However, the model detected the incident 9.5 min after its occurrence, which is not a good indicator of the detection performance. This delay in detection can be attributed to the low severity of the incident, the low D/C ratio, and the distance between the detectors. These factors affected the model’s ability to detect the incident in a timely manner. This finding supports the earlier conclusion that minor severity incidents during low traffic volume can be hard to detect or undetectable. This observation is consistent with the findings of Cheu and Ritchie [71], Ahmed and Hawas [121] and Rossi et al. [81] who reported that incidents involving minor blockage during low traffic volume are associated with low DR and high MTTD values. At a D/C ratio of 1.2, two incidents with high TTD were observed during the cross-validation phase. These two incidents are minor one lane blockage incidents located at distances of 125 and 1125 m from the upstream station, respectively. The distances between the detector stations for these two incidents are 500 and 1500 m, respectively. The model took 6 and 18 min, respectively, to detect them. The extended TTD of the two incidents during the high D/C ratio of 1.2 can be attributed to a combination of factors. Firstly, the severity of the incidents played a role in the delay of detection. The congested conditions during a D/C ratio of 1.2 may have also contributed to the long MTTD, as illustrated in Figure 5. During periods of high demand, such as a D/C ratio of 1.2, the road network experiences heavy traffic congestion. This results in more vehicles on the road, which tend to travel in platoons or sometimes wait in queues, due to the lack of available space. The existence of these platoons can cause slower travel speeds, which in turn delays the incident detection by the model. Moreover, the presence of platoons makes it more difficult for the model to detect changes in traffic patterns that could indicate an incident.
Likewise, during the testing phase, a severe five lane blockage incident occurred at 1.2 D/C ratio, and it occurred at 125 m from the upstream station, with a spacing of 500 m between stations. The TTD for this incident is 15 min, which is high. Such high value of TTD can be attributed to the oversaturated condition of the road network, as discussed earlier. In this incident, the demand was already above the road’s capacity by 20%, and the vehicles on the roads were already queued due to congestion. Therefore, when this severe incident occurred, it further exacerbated the congestion, resulting in a further buildup of queued vehicles. However, the impact of this incident would take some time until the queues of vehicles ahead of the incident location are discharged, so that the impact of this incident reached the downstream station. Therefore, the combination of a high D/C ratio, the severity of the incident and the incident location resulted in a long TTD of 15 min. Notably, during the evaluation of the incident detection system, it was observed that false alarms were produced in certain instances. Most of these false alarms were generated in the 1–2 min range post-incident termination. This is due to the residual impact of the cleared incident, which can cause fluctuations in traffic performance that may be misidentified as a persistent issue by the model. In such cases, the operator can adopt a wait-and-see approach, allowing for a brief time to assess whether the situation is truly an ongoing incident or just a residual effect. This approach can help mitigate the occurrence of false alarms, ensuring the efficiency and accuracy of the incident detection system. In conclusion, it is highlighted by the analysis of the cross-validation and testing phases that considering various factors such as severity of the incident, traffic conditions, and location and spacing between the stations is crucial. The detectability and MTTD of incidents can be significantly influenced by these factors individually or together, ultimately impacting the accuracy of the system’s ability to detect them. Thus, the potential of the incident detection system to be a useful tool for real-world incident detection is demonstrated by the results.
4.5. Comparison of the RF Model with Other AID Systems
This section aims to compare the performance of the developed model with some of the AID models identified in the literature review that exhibit high performance. The effectiveness of the model is evaluated and compared using key performance metrics such as DR, FAR, and MTTD. The DR, FAR, and MTTD reported in the literature for the selected AID model are summarized in Figure 6, Figure 7 and Figure 8.
It can be noted from Figure 6, Figure 7 and Figure 8 that the developed RF model achieved high performance in terms of DR, FAR and MTTD and it has superior performance than the majority of the models in the literature. However, some AID models achieved better performance in terms of one or more of the performance metrics in comparison with the developed model. However, these models have some limitations and weaknesses. The hybrid AID method developed by Xie et al. [29] achieved high DR and low FAR on the I-205 and I-880 datasets. Specifically, the framework achieved a DR of 97.3% and FAR of 0.061% on the I-205 dataset, and a DR of 94.7% and FAR of 0% on the I-880 dataset. The average DR for the two cases is lower than the model developed in this research. In addition, a weakness of this framework is that the MTTD was not measured, which could limit the understanding of the model’s effectiveness in real-world scenarios. Another potential limitation is that the framework used an oversampling technique to generate synthetic incident samples. The oversampling technique can potentially limit the real-world applicability of the developed model. The reason for this is that the synthetic samples generated do not represent actual traffic incidents, which can lead to false positives or overestimation of the incident detection performance when the model is applied to real-world scenarios. In other words, the model’s performance in real-time application may differ from its performance on synthetic data generated through oversampling. Another potential limitation of the oversampling approach is overfitting, which can occur when a model is trained on a limited set of data. This may lead to a good model performiance on the training data but a poorl performance on new and unseen data. Furthermore, the use of synthetic incident samples to balance the database between incident and non-incident cases may not be realistic. Therefore, balancing the incident and non-incident cases in the database may not be necessary, and may even introduce biases in the model’s training data. The decision tree and RF developed by Ahuja [40] achieved high DR and reasonable FAR but they didn’t measure the MTTD of these models. While DR and FAR are important metrics to evaluate the performance of an AID system, they only provide a partial picture of how well the system performs in real-world scenarios. In addition to detecting incidents accurately and minimizing false alarms, it is also crucial for an AID system to detect incidents quickly, as the timely detection of incidents can help reduce their impact on traffic flow and prevent secondary accidents. Likewise, The ANN model developed by Zyryanov [75] accomplished a slightly higher DR than the developed model in this paper during training phase. Nonetheless, the evaluation of the model’s performance only considered DR and did not include FAR and MTTD, which are critical metrics in assessing the model’s reliability and efficiency. As a result, the evaluation may not provide a comprehensive understanding of the model’s effectiveness, limiting its practical applications. On the other hand, the FL system developed by Rossi et al. [81] has lower FAR than the developed RF model but it has lower DR and higher MTTD. Additionally, the training and testing of the system were based on simulated traffic data, and the study only tested the system’s performance for a limited range of flow rate values and distances among detector stations without considering other factors. The RF model created by Dogru and Subasi [70] achieved lower FAR of 0.2% but it has lower DR of 94% and the MTTD of this model was not reported. Besides, their model have limited practical applicability due to several assumptions. For example, the assumption that only probe vehicles are equipped with V2V communication devices and that they broadcast their position and speed every second. Additionally, the models assume that probe vehicles can calculate the position of transferring vehicles using signal processing and antenna techniques and that they can aggregate microscopic traffic values for each vehicle over the last 10 s. These assumptions may not hold in real-world scenarios and thus limit the models’ practical use. The video-based detecting and positioning method developed by Ren el al. [95] exhibited DR, FAR, and MTTD values that were in close proximity to those achieved by the developed model. In spite of that, the lighting conditions, extreme weather conditions and coverage range of the camera that is used to capture traffic video are the main limitations that can impact the performance of this method. In addition, the method requires a significant number of computational resources and may not be suitable for real-time applications or for use in areas with limited computing power. Moreover, they used oversampling technique to generate synthetic incident sample to balance between incident and non-incident samples in the datasets used to train and test the model. As mentioned earlier, using oversampling technique to generate artificial incidents is not realistic.
In summary, the comparison of the developed RF model in this paper with other AID systems showed that the model has better performance than most of the existing ones. The developed RF model considered a wider range of factors that have significant impacts on AID performance. Compared to previous models, the developed model integrated more factors, making it more comprehensive and generic. The aim of the developed model is not only to detect incidents accurately and rapidly, but also to establish effective and generic incident detection model for freeways. Moreover, the use of ML techniques such as RF enabled the model to learn from data and adapt to changing traffic conditions, making them more robust and adaptable to new scenarios. This ensures the generalizability of the model to new data and the potential for future applications in real-time traffic management systems. Overall, the developed RF model offers a promising solution for accurate and effective incident detection on freeways.
5. Conclusions
The aim of this research is to develop an efficient and reliable model for detecting traffic incidents, which are a major cause of delays, air pollution, and reduced gross domestic product in many countries around the world. The study area is a section of a major freeway in Dubai, UAE and it is simulated using VISSIM, which generates a diverse dataset by considering four factors namely, the congestion level, the distance between the upstream and downstream detector stations, the location of the incident relative to the detector stations, and the severity of the incident. The use of simulated data instead of real data provided benefits such as the ability to generate diverse and challenging scenarios for the RF model. The simulation also allowed for the collection of precise and accurate data on traffic parameters, including flow rate, speed, and occupancy at upstream and downstream stations, which are used as input variables for the model. The dataset is used to train and test the RF model using RapidMiner software. Notably, the main hyperparameters that are optimized in this paper encompassed the number of trees, maximal depth, subset ratio, and the confidence parameter of pruning. The developed model achieved high DR and low FAR during cross-validation and testing phase. The RF model achieved a DR of 96.97%, MTTD = 1.05 min and FAR of 0.62% during the cross-validation, and a DR of 100%, MTTD = 1.17 min and FAR of 0.862% during testing. Sensitivity analysis is conducted to evaluate the impact of each of the four factors on the model’s performance in terms of DR, FAR and MTTD. It should be noted that the sensitivity analysis excluded a lane blockage incident that occurred at 0.6 D/C ratio. The sensitivity analysis revealed that these factors should be considered together when developing incident detection systems, as they have a significant impact on performance. It is worth noting that the model has achieved a DR of 100% for all cases, when minor incidents were excluded.
The research carried out in this paper has revealed several important conclusions:
- Incidents with minor severity that occur during low traffic volume may have a low impact on the traffic performance, making them difficult to detect or even go unnoticed by the incident detection system, this aligns with prior research findings [43,53,81,121,124]. Such situation is not a serious limitation to the developed model, as such minor incident may not create a notable level of delay nor congestion on the road. Thus, it will not have a significant influence on the traffic performance.
- The FAR decreases with an increase in D/C ratio, as higher congestion levels during high traffic volumes result in more consistent traffic behavior, making it easier for the incident detection system to recognize abnormal patterns. This is in line with the findings of previous studies [48,59,81,84,121].
- The MTTD values tend to increase as D/C ratio increases, possibly due to queues forming at blocked sections of the road during high traffic volumes. This can delay the effects of an incident on traffic performance, resulting in longer detection times. This result is in agreement with the findings of Rossi et al. [81] and Deniz and Celikoglu [56].
- The FAR decreases as the incident moves farther from the upstream detector, as delayed impact of incidents results in delayed disturbances to traffic flow. This reduces the likelihood of false detections by the model, leading to a decrease in FAR.
- The FAR increases with distance between detectors, possibly due to longer travel times of vehicles between detectors causing fluctuations in traffic measurements such as volume, speed, and occupancy. These fluctuations can trigger false incident alarms, resulting in an increase in FAR. This finding is consistent with earlier studies [81].
- Finally, the importance of using persistence tests to reduce false alarms is also emphasized in this paper. The assumption of treating consecutive false alarms as a single false alarm if they persist for four or fewer intervals is made to represent realistic applications of the model. However, it is important to note that this assumption can affect the detection time of a few incidents, as an incident may occur during the two minutes that the alarms are ignored. Therefore, it is important to strike a balance between reducing the FAR and not extending the MTTD of incidents that may occur after a false alarm.
In conclusion, this paper provides an effective and generic incident detection model for freeways that considers various factors and traffic variables, which were not previously considered together in previous research studies. These findings provide a framework for incident detection systems that can be generalized for use in different regions with different traffic conditions. The results suggest that the RF model is a reliable and efficient method for detecting traffic incidents. The observations made in this study could help researchers and practitioners to better understand the limitations of the AID system and to develop strategies to improve its accuracy and performance. By improving the accuracy and efficiency of traffic incident detection systems, the negative impacts of traffic incidents on the environment and economy can be mitigated.
The study’s results suggest several recommendations for future research and practical implementation. First, it is important to test the developed model using real data to verify its effectiveness and reliability. Additionally, expanding the study area to include various traffic conditions would help assess the model’s generalizability. Exploring different AI models or combinations can lead to more accurate incident detection. Developing and testing additional algorithms to reduce false alarms is crucial. Integrating incident detection models with other traffic management strategies, such as ramp metering, variable message signs, and variable speed limits, can optimize traffic flow and reduce congestion. Collaborating with transportation agencies can help evaluate the practicality and feasibility of implementing the model in real-time traffic management systems. Conducting a cost-benefit analysis will provide insights into the economic feasibility of the model’s implementation. Additionally, utilizing emerging technologies like autonomous and connected vehicles can enhance incident detection and response systems, while public reporting systems can aid in detecting minor incidents during low traffic volume periods. Lastly, the study findings indicate that reducing the distance between upstream and downstream stations improves the model’s detectability and reduces incident detection time. For instance, a 500-m distance between stations enabled the detection of minor incidents during low traffic volume with shorter detection times compared to larger distances. Therefore, it is recommended to minimize the distance between stations while considering budget constraints.
Author Contributions
Conceptualization, O.E. and A.A.; methodology, O.E. and A.A.; software, O.E.; validation, O.E. and A.A.; formal analysis, O.E. and A.A.; investigation, O.E. and A.A.; resources, O.E. and A.A.; writing—original draft preparation, O.E.; writing—review and editing, A.A.; funding acquisition, A.A. All authors have read and agreed to the published version of the manuscript.
Funding
This research was funded by the American University of Sharjah through a Graduate Teaching Assistantship (GTA) Provided by the Office of Research and Graduate Studies as part of the support to the PhD Program in Engineering Systems Management.
Data Availability Statement
The cross-validation and testing datasets utilized for developing the model in this journal paper are accessible at the following link: https://www.dropbox.com/sh/u72c6x1twihru1c/AADrMz4AZIXD4DzyEwEl1t65a?dl=0 (accessed on 3 June 2023).
Acknowledgments
The work in this paper was supported, in part, by the Open Access Program. from the American University of Sharjah. This paper represents the opinions of the author(s) and does not mean to represent the position or opinions of the American University of Sharjah.
Conflicts of Interest
The authors declare no conflict of interest.
References
- Kamran, S.; Haas, O. A Multilevel Traffic Incidents Detection Approach: Identifying Traffic Patterns and Vehicle Behaviours using real-time GPS data. In Proceedings of the 2007 IEEE Intelligent Vehicles Symposium, Istanbul, Turkey, 13–15 June 2007; pp. 912–917. [Google Scholar] [CrossRef]
- Srinivasan, D.; Jin, X.; Cheu, R.L. Evaluation of Adaptive Neural Network Models for Freeway Incident Detection. IEEE Trans. Intell. Transp. Syst. 2004, 5, 1–11. [Google Scholar] [CrossRef]
- Saini, M. Survey on Vision Based On-Road Vehicle Detection. Int. J. U-E-Serv. Sci. Technol. 2014, 7, 139–146. [Google Scholar] [CrossRef] [Green Version]
- Farradyne, P.B. Traffic Incident Management. In Encyclopedia of Transportation: Social Science and Policy; SAGE Publications, Inc.: Thousand Oaks, CA, USA, 2014. [Google Scholar]
- Rno-its, Traffic Incidents and Unplanned Events. Available online: https://rno-its.piarc.org/en/network-control-traffic-management-integrated-strategies/traffic-incidents (accessed on 11 May 2023).
- Knoop, V.L.; Hoogendoorn, S.P.; van Zuylen, H.J. Capacity Reduction at Incidents: Empirical Data Collected from a Helicopter. Transp. Res. Rec. 2008, 2071, 19–25. [Google Scholar] [CrossRef] [Green Version]
- Mohammed, A.A.; Ambak, K.; Mosa, A.M.; Syamsunur, D. A Review of the Traffic Accidents and Related Practices Worldwide. Open Transp. J. 2019, 13, 65–83. [Google Scholar] [CrossRef] [Green Version]
- Jovanis, P.P.; Hobbs, F.D. Traffic Control. Encyclopedia Britannica. 2021. Available online: https://www.britannica.com/technology/traffic-control (accessed on 11 May 2023).
- Islam, M.A. A Literature Review on Freeway Traffic Incidents and Their Impact on Traffic Operations. J. Transp. Technol. 2019, 9, 504–516. [Google Scholar] [CrossRef] [Green Version]
- Road Traffic Injuries. World Health Organization. 2021. Available online: https://www.who.int/news-room/fact-sheets/detail/road-traffic-injuries (accessed on 21 December 2021).
- Micheale, K.G. Road traffic accident: Human security perspective. Int. J. Peace Dev. Stud. 2017, 8, 15–24. [Google Scholar] [CrossRef] [Green Version]
- Tantillo, M.J.; Roberts, E.; Mangar, U. Roles of Transportation Management Centers in Incident Management on Managed Lanes. 2014. Available online: http://ops.fhwa.dot.gov/publications/fhwahop14022/fhwahop14022.pdf (accessed on 21 December 2021).
- Jin, X.; Zhang, Z.; Gan, A. Traffic Management Centers: Challenges, Best Practices, and Future Plans; National Center for Transportation Systems Productivity and Management: Atlanta, GA, USA, 2014. [Google Scholar]
- Xiao, J.; Liu, Y. Traffic Incident Detection Using Multiple-Kernel Support Vector Machine. Transp. Res. Rec. J. Transp. Res. Board 2012, 2324, 44–52. [Google Scholar] [CrossRef]
- Chang, F.-R.; Huang, H.-L.; Schwebel, D.C.; Chan, A.H.S.; Hu, G.-Q. Global road traffic injury statistics: Challenges, mechanisms and solutions. Chin. J. Traumatol. 2020, 23, 216–218. [Google Scholar] [CrossRef]
- Iqbal, Z.; Khan, M.I. Automatic incident detection in smart city using multiple traffic flow parameters via V2X communication. Int. J. Distrib. Sens. Netw. 2018, 14, 1550147718815845. [Google Scholar] [CrossRef] [Green Version]
- Iqbal, Z.; Khan, M.I.; Hussain, S.; Habib, A. An Efficient Traffic Incident Detection and Classification Framework by Leveraging the Efficacy of Model Stacking. Complexity 2021, 2021, 5543698. [Google Scholar] [CrossRef]
- Allen, R.C.; Cleveland, D.E. The Detection of Freeway Capacity Reducing Incidents by Traffic Stream Measurements. Transp. Res. Rec. 1970, 495, 1–11. [Google Scholar] [CrossRef]
- Dudek, C.L.; Messer, C.J.; Nuckles, N.B. Incident detection on urban freeways. Transp. Res. Rec. 1974, 495, 12–24. Available online: http://onlinepubs.trb.org/Onlinepubs/trr/1974/495/495-002.pdf (accessed on 5 January 2022).
- Dudek, C.L.; Weaver, G.D.; Ritch, G.P.; Messer, C.J. Detecting Freeway Incidents under Low-Volume Conditions; Texas. A & M University: College Station, TX, USA, 1975; Volume 553. [Google Scholar]
- Payne, H. Freeway incident detection based upon pattern classification. In Proceedings of the 1975 IEEE Conference on Decision and Control including the 14th Symposium on Adaptive Processes, Los Angeles, CA, USA, 10–12 December 1975; IEEE: Piscataway, NJ, USA; pp. 688–692. [Google Scholar]
- Payne, H.J.; Tignor, S. Freeway incident-detection algorithms based on decision trees with states. Transp. Res. Rec. 1978, 682, 30–37. [Google Scholar]
- Levin, M.; Krause, G.M. Incident detection: A Bayesian approach. Transp. Res. Rec. 1978, 682, 52–58. [Google Scholar]
- Roess, R.P.; Prassas, E.S.; McShane, W.R. Traffic Engineering. In ATM: The Broadband Telecommunications Solution; Institution of Engineering and Technology: Hong Kong, China, 1993; pp. 132–147. ISBN 9780134599717/0134599713. [Google Scholar]
- Elefteriadou, L. Springer Optimization and Its Applications. In An Introduction to Traffic Flow Theory, 17th ed.; Springer: New York, NY, USA, 2014; Volume 84, ISBN 978-1-4614-8434-9. [Google Scholar]
- Ki, Y.-K.; Kim, J.-H.; Kim, T.-K.; Heo, N.-W.; Choi, J.-W.; Jeong, J.-H. Method for Automatic Detection of Traffic Incidents Using Neural Networks and Traffic Data. In Proceedings of the 2018 IEEE 9th Annual Information Technology, Electronics and Mobile Communication Conference (IEMCON), Vancouver, BC, Canada, 1–3 November 2018; IEEE: Piscataway, NJ, USA, 2018; pp. 184–188. [Google Scholar]
- Motamed, M.; Machemehl, R. Real Time Freeway Incident Detection; SWUTC/14/600451-00083-1; Center for Transportation Research, University of Texas at Austin: Austin, TX, USA, 2014; Volume 7. [Google Scholar]
- Motamed, M. Developing a Real-Time Freeway Incident Detection Model Using Machine Learning Techniques; University of Texas at Austin: Austin, TX, USA, 2016. [Google Scholar] [CrossRef]
- Xie, T.; Shang, Q.; Yu, Y. Automated Traffic Incident Detection: Coping with Imbalanced and Small Datasets. IEEE Access 2022, 10, 35521–35540. [Google Scholar] [CrossRef]
- Parkany, E.; Xie, C. A Complete Review of Incident Detection Algorithms & Their Deployment: What Works and What Doesn’t; Report No: NETCR37; The New England Transportation Consortium: Mansfield Center, CT, USA, 2005. [Google Scholar]
- Calderoni, L.; Maio, D.; Rovis, S. Deploying a network of smart cameras for traffic monitoring on a “city kernel”. Expert Syst. Appl. 2014, 41, 502–507. [Google Scholar] [CrossRef]
- Cheng, H.Y.; Gau, V.; Huang, C.W.; Hwang, J.N. Advanced formation and delivery of traffic information in intelligent transportation systems. Expert Syst. Appl. 2012, 39, 8356–8368. [Google Scholar] [CrossRef]
- Wen, W. An intelligent traffic management expert system with RFID technology. Expert Syst. Appl. 2010, 37, 3024–3035. [Google Scholar] [CrossRef]
- Mahmassani, H.S.; Haas, C.; Zhou, S.; Peterman, J. Evaluation of Incident Detection Methodologies; FHWA/TX-00/1795-1; University of Texas at Austin: Austin, TX, USA, 1999. [Google Scholar]
- Martin, P.T.; Perrin, J.; Hansen, B.; Kump, R.; Moore, D. Incident Detection Algorithm Evaluation; Minnesota Department of Transportation: St. Cloud, MN, USA, 2001; Available online: http://www.lrrb.org/PDF/200112.pdf (accessed on 10 January 2022).
- ElSahly, O.; Abdelfatah, A. A Systematic Review of Traffic Incident Detection Algorithms. Sustainability 2022, 14, 14859. [Google Scholar] [CrossRef]
- Chen, S.; Wang, W.; van Zuylen, H. Construct support vector machine ensemble to detect traffic incident. Expert Syst. Appl. 2009, 36, 10976–10986. [Google Scholar] [CrossRef]
- Hamad, K.; Quiroga, C. Geovisualization of Archived ITS Data-Case Studies. IEEE Trans. Intell. Transp. Syst. 2016, 17, 104–112. [Google Scholar] [CrossRef]
- Cheu, R.L. Neural Network Models for Automated Detection of Lane-Blocking Incidents on Freeways. Ph.D. Thesis, University of California, Irvine, CA, USA, 1998. [Google Scholar]
- Ahuja, L. Automatic Incident Detection (AID). Master’s Thesis, Iowa State University, Ames, IA, USA, 2018. [Google Scholar]
- Chakraborty, P.; Sharma, A.; Knickerbocker, S.; Hess, J.R.; Sharma, A.; Knickerbocker, S.; Hess, J.R. Outlier mining based traffic incident detection using big data analytics. In Proceedings of the 96th Annual Meeting Transportation Research Board, Washington DC, USA, 8 January 2016; pp. 8–12. [Google Scholar]
- Ozbay, K.; Kachroo, P. Incident Management in Intelligent Transportation Systems; Artech House Publishers: Norwood, MA, USA, 1999. [Google Scholar]
- Karatsoli, M.; Margreiter, M.; Spangler, M. Bluetooth-based travel times for automatic incident detection–A systematic description of the characteristics for traffic management purposes. Transp. Res. Procedia 2017, 24, 204–211. [Google Scholar] [CrossRef]
- Cheu, R.L.; Ritchie, S.G. Automated detection of lane-blocking freeway incidents using artificial neural networks. Transp. Res. Part C 1995, 3, 371–388. [Google Scholar] [CrossRef]
- Fernández, A.; García, S.; Galar, M.; Prati, R.C.; Krawczyk, B.; Herrera, F. Learning from Imbalanced Data Sets; Springer International Publishing: Berlin/Heidelberg, Germany, 2018; ISBN 978-3-319-98073-7. [Google Scholar]
- Ma, Y.; He, H. Imbalanced Learning; He, H., Ma, Y., Eds.; Wiley: Hoboken, NJ, USA, 2013; ISBN 9781118074626. [Google Scholar]
- Abdulhai, B.; Abdelwahab, H.T. Comparison of three incident detection algorithms using detailed simulation results. J. Transp. Eng. 2001, 127, 251–259. [Google Scholar]
- Stephanedes, Y.J.; Hourdakis, J. Comparison of real-time traffic incident detection algorithms. Transp. Res. Rec. 1996, 1554, 44–51. [Google Scholar] [CrossRef]
- Levin, M.; Krause, G.M. Incident-Detection Algorithms Part 1. Off-Line Evaluation. Transp. Res. Rec. 1979, 722, 49–58. [Google Scholar]
- Levin, M.; Krause, G.M. Incident-detection algorithms. part 2. on-line evaluation. Transp. Res. Rec. 1979, 722, 59–64. [Google Scholar]
- Cohen, S.; Ketselidou, Z. A Calibration Process for Automatic Incident Detection Algorithms. In Proceedings of the 4th International Conference on Microcomputers in Transportation, Baltimore, MD, USA, 22–24 July 1993. [Google Scholar]
- Collins, J.F.; Hopkins, C.M.; Martin, J.A. Automatic Incident Detection: TRRL Algorithms HIOCC and PATREG; Transport and Road Research Laboratory: Crowthorne, UK, 1979. [Google Scholar]
- Masters, P.H.; Lam, J.K.; Wong, K. Incident detection algorithms for COMPASS-An advanced traffic management system. In Proceedings of the Vehicle Navigation and Information Systems Conference, Warrendale, PA, USA, 20–23 October 1991; IEEE: Piscataway, NJ, USA, 1991; Volume 2, pp. 295–310. [Google Scholar]
- Bakioğlu, G.; Silgu, M.A.; Özcanan, S.; Gökaşar, I.; Büyük, M.; Çelikoğlu, H.B.; Osman, A. Incident Detection Algorithms: A Literature Review. In Proceedings of the 1st IRF Europe & Central Asia Regional Congress & Exhibition, Istanbul, Turkey, 15–18 September 2015. [Google Scholar]
- Lyall, B. Performance Evaluation of the Mc Master Incident Detection Algorithm. Ph.D. Thesis, McMaster University, Hamilton, ON, Canada, 1991. [Google Scholar]
- Deniz, O.; Celikoglu, H.B. Overview to some existing incident detection algorithms: A comparative evaluation. Procedia Soc. Behav. Sci. 2011, 2, 153–168. [Google Scholar]
- D’Andrea, E.; Marcelloni, F. Detection of traffic congestion and incidents from GPS trace analysis. Expert Syst. Appl. 2017, 73, 43–56. [Google Scholar] [CrossRef]
- Tsai, J.; Case, E.R. Development of freeway incident-detection algorithms by using pattern-recognition techniques. Transp. Res. Rec. 1979, 722, 113–116. [Google Scholar]
- Ahmed, S.A.; Cook, A. Application of time-series analysis techniques to freeway incident detection. Transp. Res. Rec. 1982, 841, 19–21. [Google Scholar]
- Ahmed, S.A.; Cook, A.R. Time series models for freeway incident detection. Transp. Eng. J. ASCE 1980, 106, 731–745. [Google Scholar] [CrossRef]
- Ahmed, M.S.; Cook, A.R. Analysis of freeway traffic time-series data by using box-jenkins techniques. Transp. Res. Rec. 1979, 722, 1–9. [Google Scholar]
- Li, H.; Li, S.; Zhu, H.; Zhao, X.; Zhang, X. Automated Detection Algorithm for Traffic Incident in Urban Expressway Based on Lengthways Time Series. In Green Intelligent Transportation Systems; Springer: Singapore, 2019; Volume 503, pp. 625–633. ISBN 9789811303012. [Google Scholar]
- Chakraborty, P.; Hegde, C.; Sharma, A. Data-driven parallelizable traffic incident detection using spatio-temporally denoised robust thresholds. Transp. Res. Part C Emerg. Technol. 2019, 105, 81–99. [Google Scholar] [CrossRef] [Green Version]
- Jin, X.; Srinivasan, D.; Cheu, R.L. Classification of freeway traffic patterns for incident detection using constructive probabilistic neural networks. IEEE Trans. Neural Netw. 2001, 12, 1173–1187. [Google Scholar] [CrossRef]
- Olugbade, S.; Ojo, S.; Imoize, A.L.; Isabona, J.; Alaba, M.O. A Review of Artificial Intelligence and Machine Learning for Incident Detectors in Road Transport Systems. Math. Comput. Appl. 2022, 27, 77. [Google Scholar] [CrossRef]
- Sharma, S.; Harit, S.; Kaur, J. Traffic Accident Detection Using Machine Learning Algorithms. In Proceedings of Third International Conference on Sustainable Computing; Springer: Singapore, 2022; pp. 501–507. ISBN 9789811645389. [Google Scholar]
- Mani, D.; Amrith, P.; Umamaheswari, E.; Ajay, D.M.; Anitha, R.U. Smart detection of vehicle accidents using object identification sensors with artificial intelligent systems. Int. J. Recent Technol. Eng. 2019, 7, 375–379. [Google Scholar]
- Huang, T.; Wang, S.; Sharma, A. Highway crash detection and risk estimation using deep learning. Accid. Anal. Prev. 2020, 135, 105392. [Google Scholar] [CrossRef]
- Suthaharan, S. Machine Learning Models and Algorithms for Big Data Classification. In Integrated Series in Information Systems; Springer: Boston, MA, USA, 2016; Volume 36, ISBN 978-1-4899-7640-6. [Google Scholar]
- Dogru, N.; Subasi, A. Traffic accident detection using random forest classifier. In Proceedings of the 2018 15th Learning and Technology Conference (L&T), Jeddah, Saudi Arabia, 25–26 February 2018; IEEE: Piscataway, NJ, USA, 2018; pp. 40–45. [Google Scholar] [CrossRef]
- Cheu, R.L.; Ritchie, S.G.; Recker, W.W.; Bavarian, B. Investigation of a Neural Network Model for Freeway Incident Detection. In Proceedings of the International Conference on the Application of Artificial Intelligence Techniques to Civil and Structural Engineering, Oxford, UK, 19 September 1991; pp. 267–274. [Google Scholar]
- Jin, X.; Cheu, R.L.; Srinivasan, D. Development and adaptation of constructive probabilistic neural network in freeway incident detection. Transp. Res. Part C Emerg. Technol. 2002, 10, 121–147. [Google Scholar] [CrossRef]
- Dia, H.; Rose, G. Development and evaluation of neural network freeway incident detection models using field data. Transp. Res. Part C Emerg. Technol. 1997, 5, 313–331. [Google Scholar] [CrossRef]
- Abdulhai, B.; Ritchie, S.G. Enhancing the universality and transferability of freeway incident detection using a Bayesian-based neural network. Transp. Res. Part C Emerg. Technol. 1999, 7, 261–280. [Google Scholar] [CrossRef]
- Zyryanov, V.V. Incidents detection on city roads. IOP Conf. Ser. Mater. Sci. Eng. 2020, 913, 042065. [Google Scholar] [CrossRef]
- Gupta, G.; Singh, R.; Singh Patel, A.; Ojha, M. Accident Detection Using Time-Distributed Model in Videos. In Proceedings of the Fifth International Congress on Information and Communication, London, UK, 20–21 February 2021; Yang, X.-S., Sherratt, S., Dey, N., Joshi, A., Eds.; Springer: Singapore, 2021; pp. 214–223. [Google Scholar]
- Li, L.; Lin, Y.; Du, B.; Yang, F.; Ran, B. Real-time traffic incident detection based on a hybrid deep learning model. Transp. A Transp. Sci. 2022, 18, 78–98. [Google Scholar] [CrossRef]
- Lin, Y.; Li, L.; Jing, H.; Ran, B.; Sun, D. Automated traffic incident detection with a smaller dataset based on generative adversarial networks. Accid. Anal. Prev. 2020, 144, 1–9. [Google Scholar] [CrossRef]
- Philip, A.O.; Saravanaguru, R.K. Multisource traffic incident reporting and evidence management in Internet of Vehicles using machine learning and blockchain. Eng. Appl. Artif. Intell. 2023, 117, 105630. [Google Scholar] [CrossRef]
- Nikolaev, A.B.; Sapego, Y.S.; Ivakhnenko, A.M.; Mel’nikova, T.E.; Stroganov, V.Y. Analysis of the incident detection technologies and algorithms in intelligent transport systems. Int. J. Appl. Eng. Res. 2017, 12, 4765–4774. [Google Scholar]
- Rossi, R.; Gastaldi, M.; Gecchele, G.; Barbaro, V. Fuzzy logic-based incident detection system using loop detectors data. Transp. Res. Procedia 2015, 10, 266–275. [Google Scholar] [CrossRef]
- Hartigan, J.A.; Wong, M.A. Algorithm AS 136: A K-Means Clustering Algorithm. Appl. Stat. 1979, 28, 100. [Google Scholar] [CrossRef]
- Ahmed, F.; Hawas, Y.E. A fuzzy logic model for real-time incident detection in urban road network. In Proceedings of the 5th International Conference on Agents and Artificial Intelligence, Vienna, Austria, 22–24 February 2013; Volume 2, pp. 465–472. [Google Scholar]
- Mustafa, F.W.F. An Application of Fuzzy Logic in Urban Traffic Incident Detection; United Arab Emirates University: Al Ain, United Arab Emirates, 2015. [Google Scholar]
- Lee, S.; Krammes, R.A.; Yen, J. Fuzzy-logic-based incident detection for signalized diamond interchanges. Transp. Res. Part C Emerg. Technol. 1998, 6, 359–377. [Google Scholar] [CrossRef]
- Yuan, F.; Cheu, R.L. Incident detection using support vector machines. Transp. Res. Part C Emerg. Technol. 2003, 11, 309–328. [Google Scholar] [CrossRef]
- Suthaharan, S. (Ed.) Support Vector Machine; Springer: Boston, MA, USA, 2016; pp. 207–235. ISBN 978-1-4899-7641-3. [Google Scholar]
- Ho, T.K. The random subspace method for constructing decision forests. IEEE Trans. Pattern Anal. Mach. Intell. 1998, 20, 832–844. [Google Scholar] [CrossRef] [Green Version]
- Breiman, L. Random forests. Mach. Learn. 2001, 45, 5–32. [Google Scholar] [CrossRef] [Green Version]
- Yiu, T. Understanding Random Forest. 2019. Available online: https://towardsdatascience.com/understanding-random-forest-58381e0602d2 (accessed on 3 August 2022).
- Saho, K. Kalman Filter for Moving Object Tracking: Performance Analysis and Filter Design. In Kalman Filters-Theory for Advanced Applications; IntechOpen: London, UK, 2018. [Google Scholar]
- Ekstrand, B. Some Aspects on Filter Design for Target Tracking. J. Control Sci. Eng. 2012, 2012, 1–15. [Google Scholar] [CrossRef] [Green Version]
- Saho, K.; Masugi, M. Automatic Parameter Setting Method for an Accurate Kalman Filter Tracker Using an Analytical Steady-State Performance Index. IEEE Access 2015, 3, 1919–1930. [Google Scholar] [CrossRef]
- Hashlamon, I.; Erbatur, K. An improved real-time adaptive Kalman filter with recursive noise covariance updating rules. TURKISH J. Electr. Eng. Comput. Sci. 2016, 24, 524–540. [Google Scholar] [CrossRef]
- Ren, J.; Chen, Y.; Xin, L.; Shi, J.; Li, B.; Liu, Y. Detecting and positioning of traffic incidents via video-based analysis of traffic states in a road segment. IET Intell. Transp. Syst. 2016, 10, 428–437. [Google Scholar] [CrossRef]
- Min, S.L. Evaluation of Adaptive Automatic Freeway Incident Detection Algorithms; Malaysia University of Science and Technology: Selangor, Malaysia, 2004. [Google Scholar]
- Group, P. PTV Vissim 2022 User Manual 2022. Available online: https://vision-traffic.ptvgroup.com/en-us/products/ptv-vissim/ (accessed on 10 September 2022).
- Afrin, T.; Yodo, N. A Survey of Road Traffic Congestion Measures towards a Sustainable and Resilient Transportation System. Sustainability 2020, 12, 4660. [Google Scholar] [CrossRef]
- Li, Z.; Wu, Q.; Yu, H.; Chen, C.; Zhang, G.; Tian, Z.Z.; Prevedouros, P.D. Temporal-spatial dimension extension-based intersection control formulation for connected and autonomous vehicle systems. Transp. Res. Part C Emerg. Technol. 2019, 104, 234–248. [Google Scholar] [CrossRef]
- Elsahly, O.; Abdelfatah, A. Effects of Automated Vehicles on Freeway Traffic Performance. Wulfenia J. 2020, 27, 83–107. [Google Scholar]
- Ngan, V.; Sayed, T.; Abdelfatah, A. Impacts of Various Parameters on Transit Signal Priority Effectiveness. J. Public Transp. 2004, 7, 71–93. [Google Scholar] [CrossRef]
- Aria, E.; Olstam, J.; Schwietering, C. Investigation of Automated Vehicle Effects on Driver’s Behavior and Traffic Performance. Transp. Res. Procedia 2016, 15, 761–770. [Google Scholar] [CrossRef] [Green Version]
- FDOT. Traffic Analysis Handbook; Apress: New York, NY, USA, 2014. [Google Scholar]
- Perraki, G.; Roncoli, C.; Papamichail, I.; Papageorgiou, M. Evaluation of a model predictive control framework for motorway traffic involving conventional and automated vehicles. Transp. Res. Part C Emerg. Technol. 2018, 92, 456–471. [Google Scholar] [CrossRef]
- Toledo, T.; Koutsopoulos, H.N. Statistical Validation of Traffic Simulation Models. Transp. Res. Rec. J. Transp. Res. Board 2004, 1876, 142–150. [Google Scholar] [CrossRef] [Green Version]
- Morando, M.M.; Tian, Q.; Truong, L.T.; Vu, H.L. Studying the Safety Impact of Autonomous Vehicles Using Simulation-Based Surrogate Safety Measures. J. Adv. Transp. 2018, 2018, 6135183. [Google Scholar] [CrossRef]
- Spiegelman, C.H.; Park, E.S.; Rilett, L.R. Transportation Statistics and Microsimulation; CRC Press: Boca Raton FL, USA, 2011; p. 355. ISBN 9781439800232/1439800235. [Google Scholar]
- Nikolaev, A.B.; Sapego, Y.S.; Jakubovich, A.N.; Berner, L.I.; Ivakhnenko, A.M. Simulation of automatic incidents detection algorithm on the transport network. Int. J. Environ. Sci. Educ. 2016, 11, 9060–9078. [Google Scholar]
- Ripley, B.D. 1952-Pattern Recognition and Neural Networks; Cambridge University Press: Cambridge, UK, 1996; p. 403. ISBN 0521460867/9780521460866. [Google Scholar]
- James, G.; Gareth, M.; Witten, D.; Hastie, T.; Tibshirani, R. An Introduction to Statistical Learning: With Applications in R.; Springer: New York, NY, USA, 2013; p. 426. ISBN 1461471370/9781461471370. [Google Scholar]
- Kuhn, M.; Johnson, K. Applied Predictive Modeling; Springer: New York, NY, USA, 2013; ISBN 978-1-4614-6848-6. [Google Scholar]
- Baturynska, I.; Martinsen, K. Prediction of geometry deviations in additive manufactured parts: Comparison of linear regression with machine learning algorithms. J. Intell. Manuf. 2021, 32, 179–200. [Google Scholar] [CrossRef]
- RapidMiner. Available online: https://rapidminer.com/ (accessed on 20 September 2022).
- Agrawal, T. Hyperparameter Optimization in Machine Learning, 1st ed.; Apress: Berkeley, CA, USA, 2021; ISBN 978-1-4842-6578-9. [Google Scholar]
- Bergstra, J.; Bengio, Y. Random search for hyper-parameter optimization. J. Mach. Learn. Res. 2012, 13, 281–305. [Google Scholar]
- Probst, P.; Wright, M.N.; Boulesteix, A. Hyperparameters and tuning strategies for random forest. WIREs Data Min. Knowl. Discov. 2019, 9, 1301. [Google Scholar] [CrossRef] [Green Version]
- Ramadhan, M.M.; Sitanggang, I.S.; Nasution, F.R.; Ghifari, A. Parameter Tuning in Random Forest Based on Grid Search Method for Gender Classification Based on Voice Frequency. DEStech Trans. Comput. Sci. Eng. 2017, 10, 2017. [Google Scholar] [CrossRef] [Green Version]
- Hsu, C.-W.; Chang, C.-C.; Lin, C.-J. A practical Guide to Support Vector Classification; University of National Taiwan: Taipei, China, 2003. [Google Scholar]
- Ishwaran, H. The effect of splitting on random forests. Mach. Learn. 2015, 99, 75–118. [Google Scholar] [CrossRef]
- ElSahly, O.; Abdelfatah, A.; Alshraideh, H. Optimizing Hyperparameters of Random Forest Model for Traffic Incident Detection. In Proceedings of the 50th International Conference on Computers and Industrial Engineering (CIE 50), Sharjah-Dubai, United Arab Emirates, 30 November 2022. [Google Scholar]
- Ahmed, F.; Hawas, Y.E. A Threshold-Based Real-Time Incident Detection System for Urban Traffic Networks. Procedia.-Soc. Behav. Sci. 2012, 48, 1713–1722. [Google Scholar] [CrossRef] [Green Version]
- Stephanedes, Y.J.; Chassiakos, A.P. Application of Filtering Techniques for Incident Detection. J. Transp. Eng. 1993, 119, 13–26. [Google Scholar] [CrossRef]
- ElSahly, O. Detection of Traffic Incidents Using Machine Learning Techniques; American University of Sharjah: Sharjah, United Arab Emirates, 2023. [Google Scholar]
- Liang, Z.; Chen, H.; Song, Z.; Zhou, Y.; Zhang, B. Traffic congestion incident detection and dissipation algorithm for urban intersection based on FCD. In Proceedings of the 2017 3rd IEEE International Conference on Computer and Communications (ICCC), Chengdu, China, 13 December 2017; IEEE: Piscataway, NJ, USA, 2017; pp. 2578–2583. [Google Scholar]
- Margreiter, M.; Spangler, M.; Zeh, T.; Carstensen, C. Bluetooth-Measured Travel Times for Dynamic Re-Routing. In Proceedings of the 3rd Annual International Conference ACE, Amsterdam, The Netherlands, 7–8 June 2015. [Google Scholar] [CrossRef]
- Raosaheb Patil, V.; Suresh Pardeshi, S. Mechanism for accident detection, prevention and reporting system. Mater. Today Proc. 2023, 72, 1975–1980. [Google Scholar] [CrossRef]
Figure 1.
DR vs. D/C ratio for RF model during cross-validation.
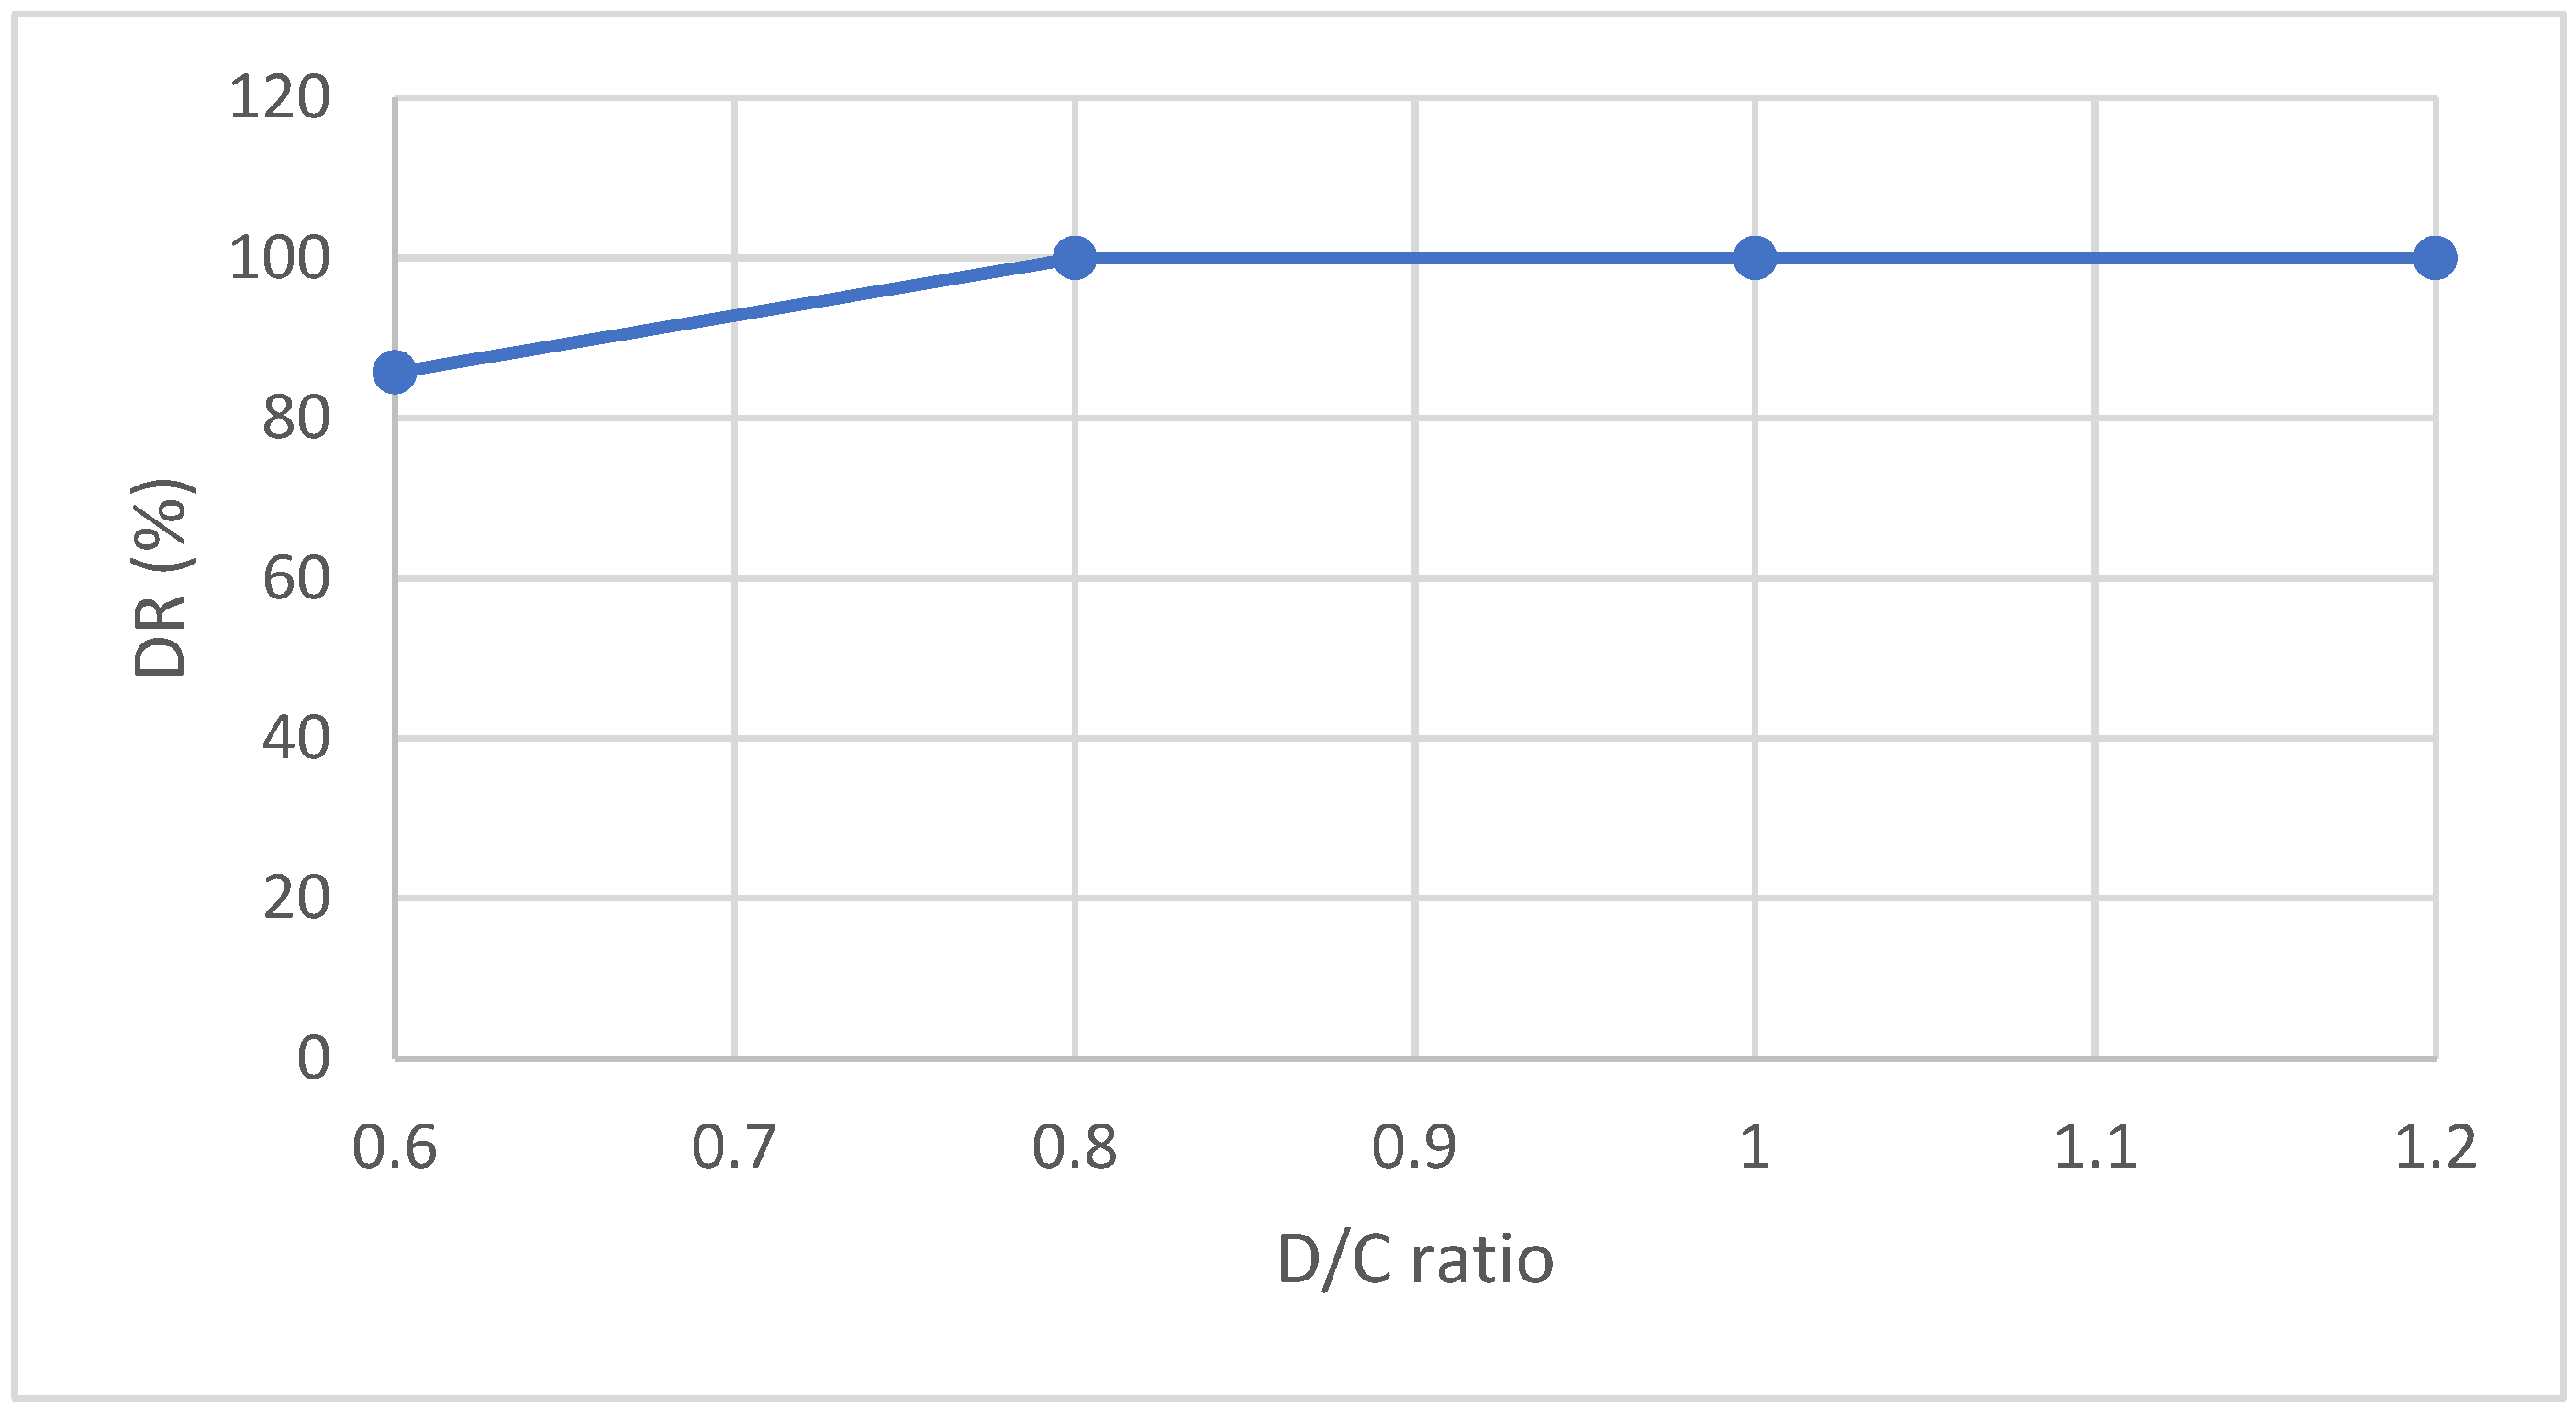
Figure 2.
FAR vs. D/C ratio for RF model during cross-validation.

Figure 3.
FAR vs. D/C ratio for RF model during cross-validation excluding minor incidents during low traffic volume.
Figure 3.
FAR vs. D/C ratio for RF model during cross-validation excluding minor incidents during low traffic volume.
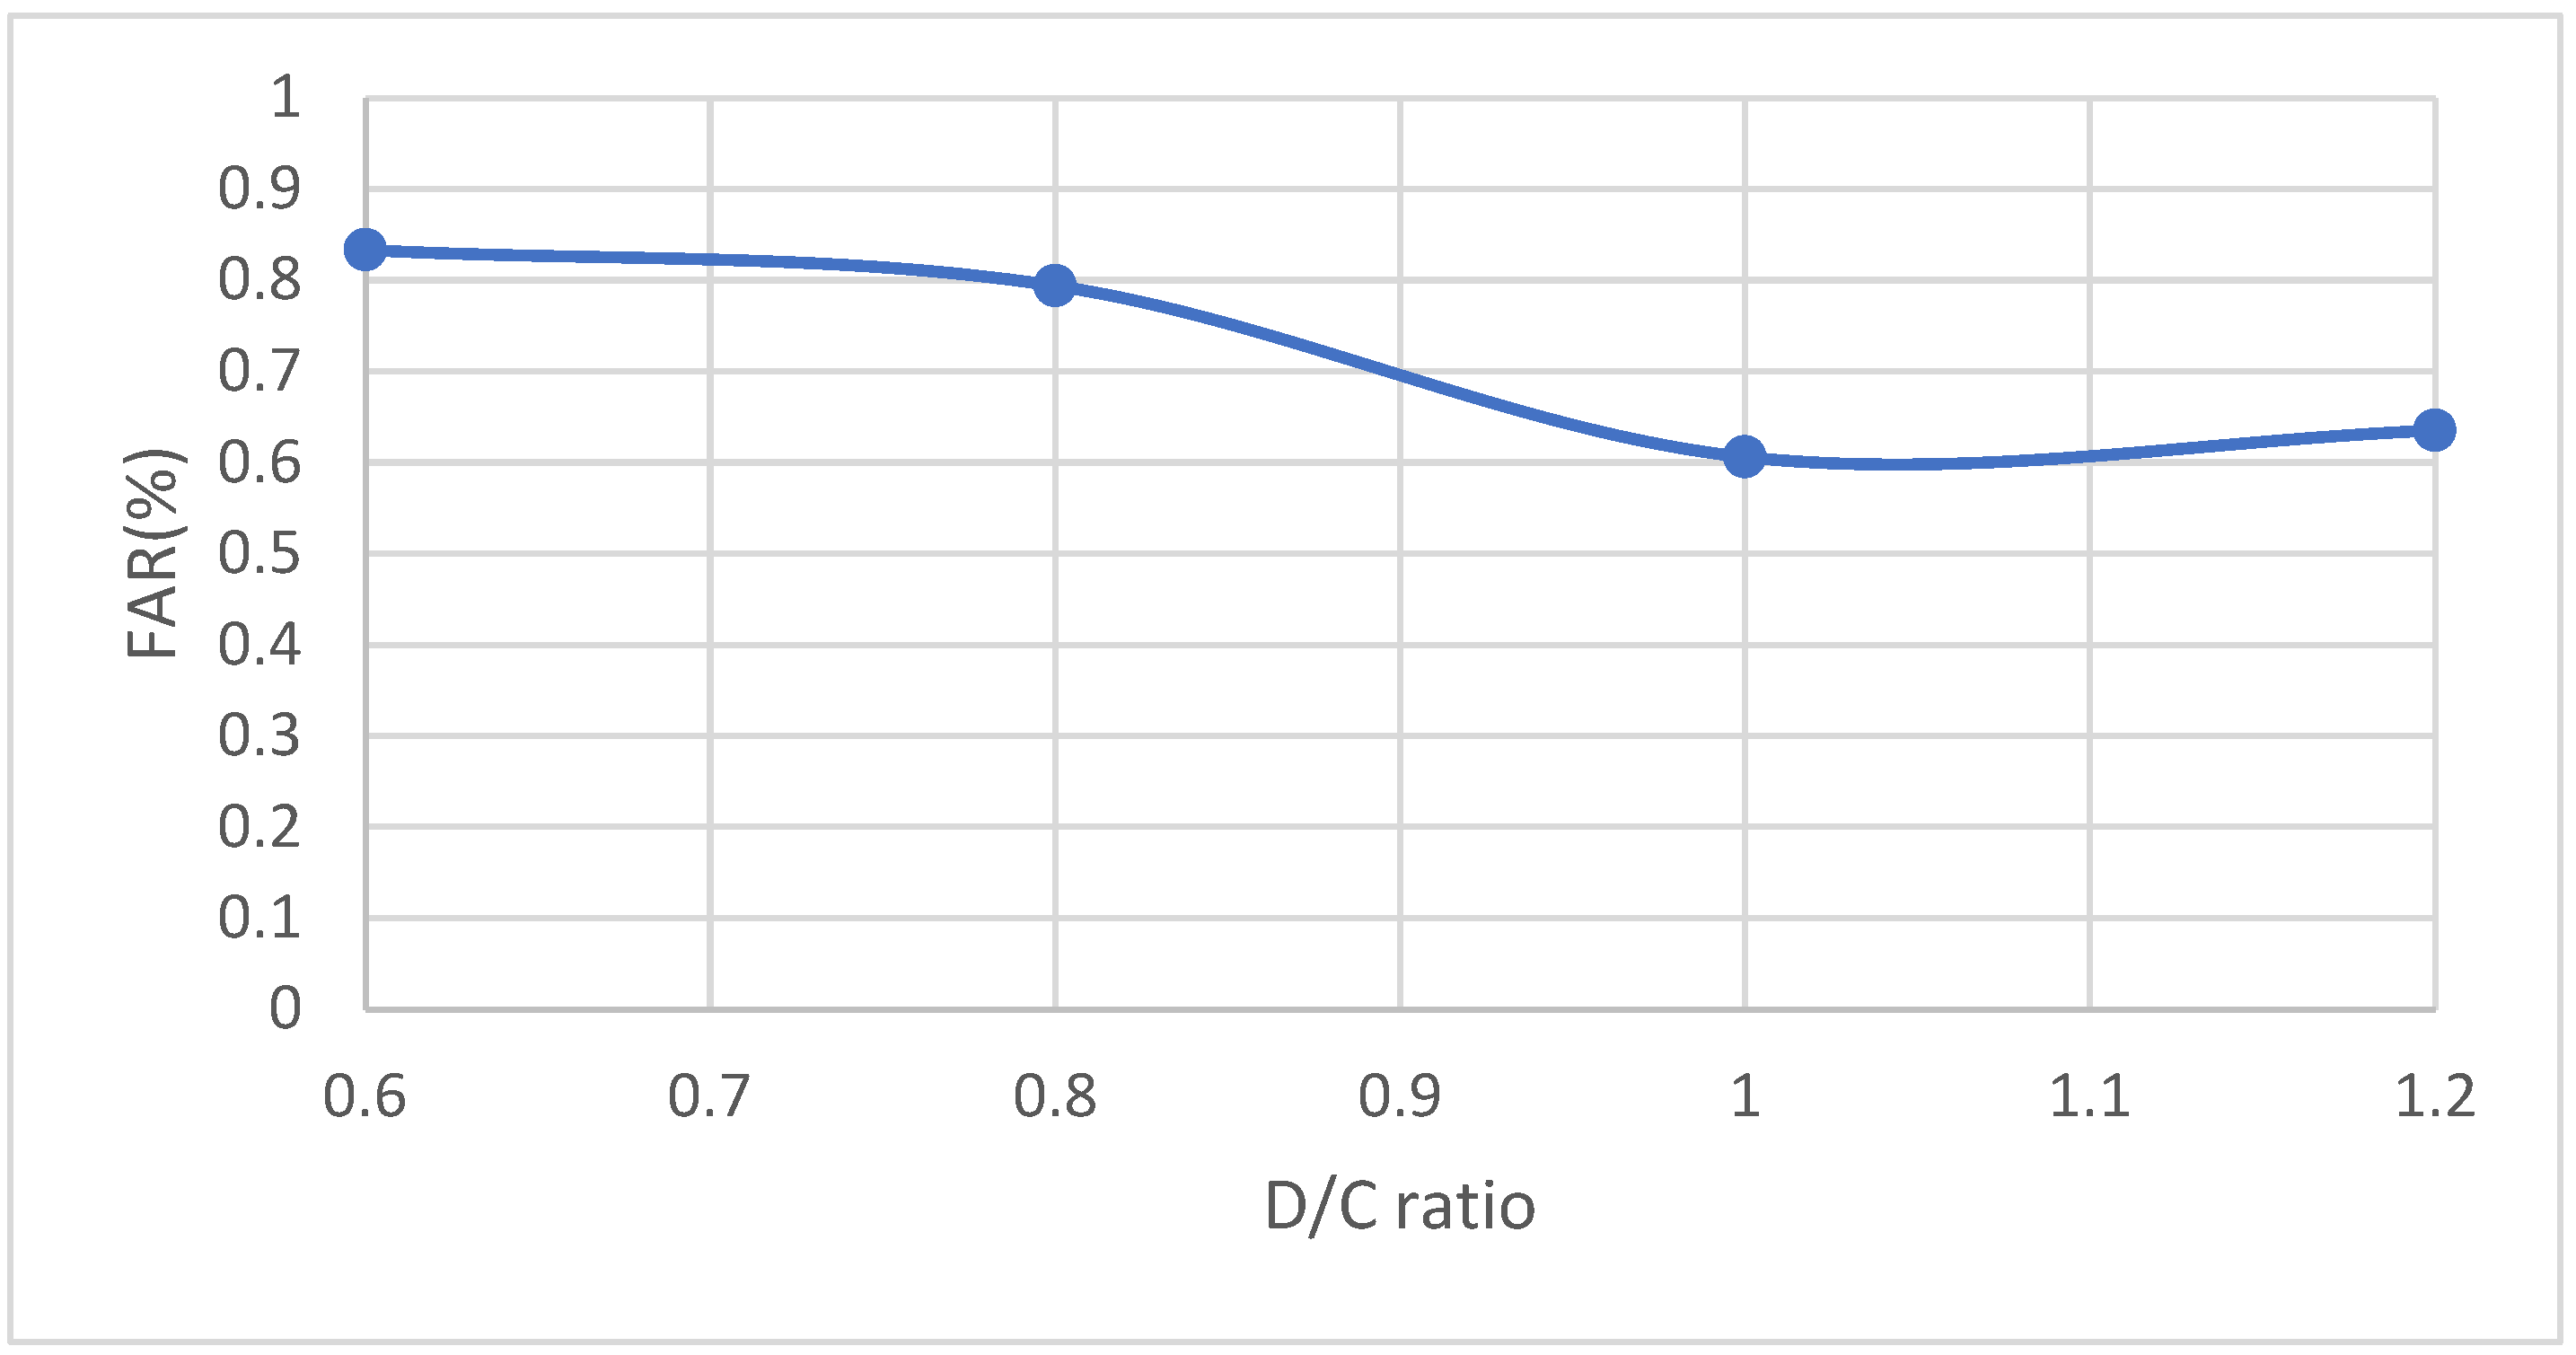
Figure 4.
MTTD vs. D/C ratio for RF model during cross-validation.
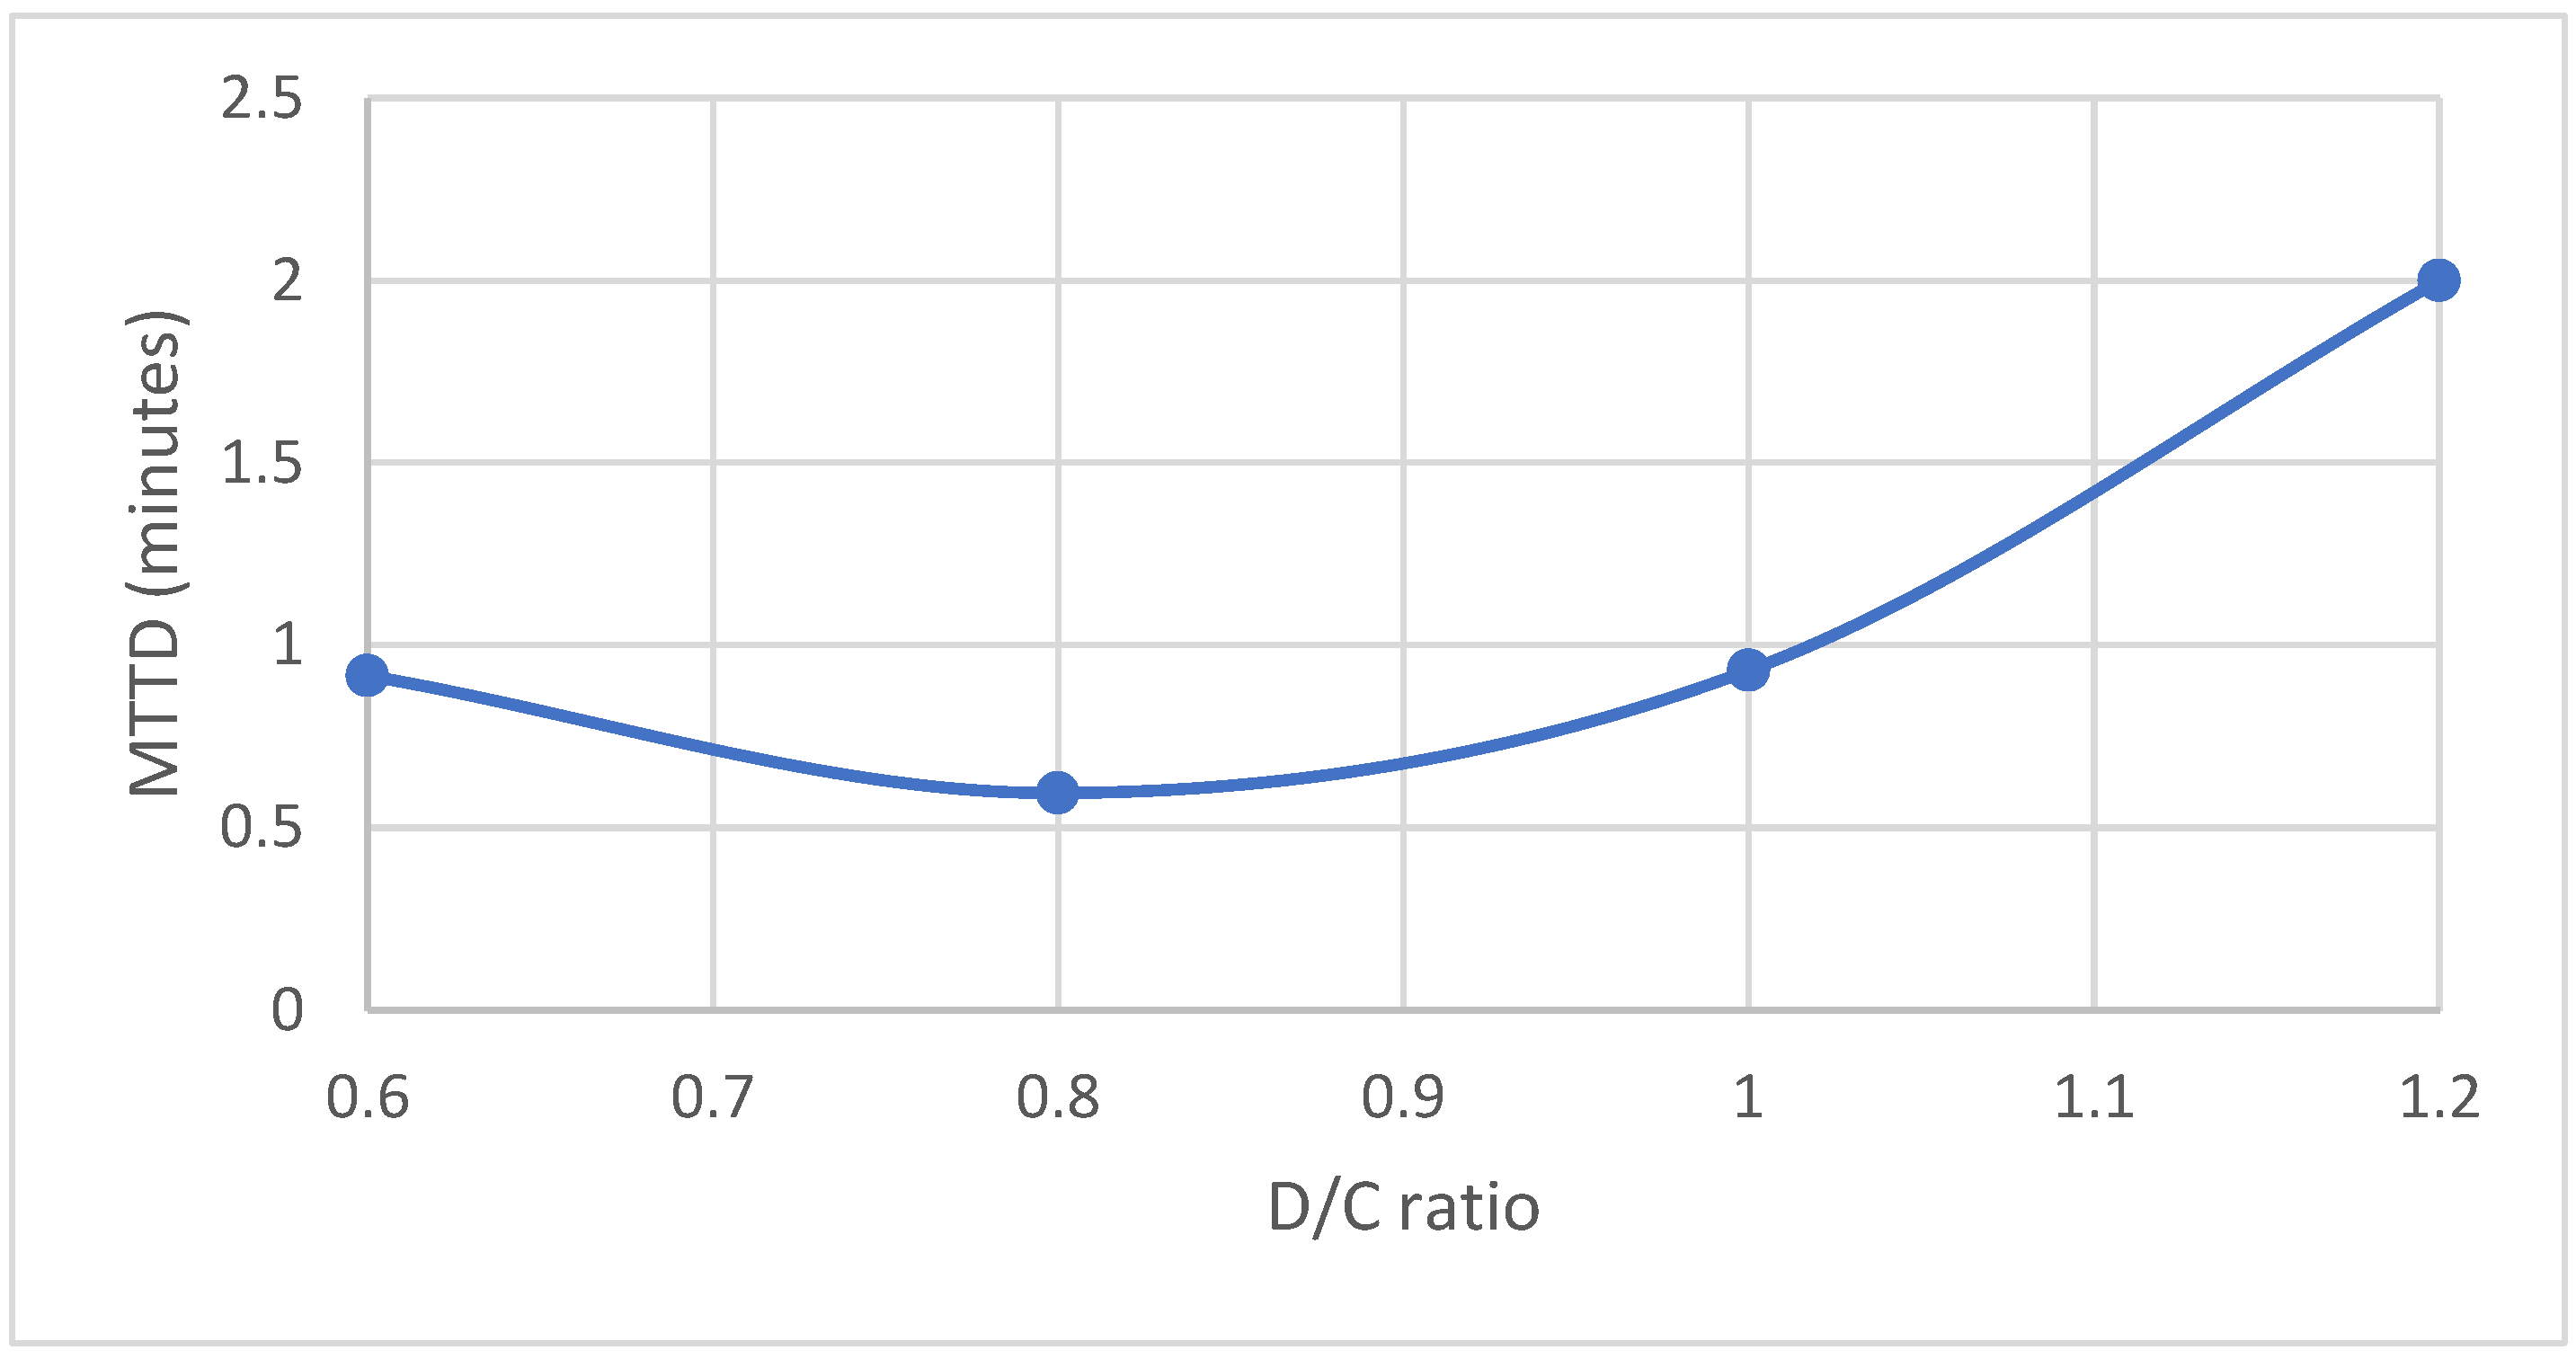
Figure 5.
MTTD vs. D/C ratio for RF model during cross-validation excluding minor incidents during low traffic volume.
Figure 5.
MTTD vs. D/C ratio for RF model during cross-validation excluding minor incidents during low traffic volume.
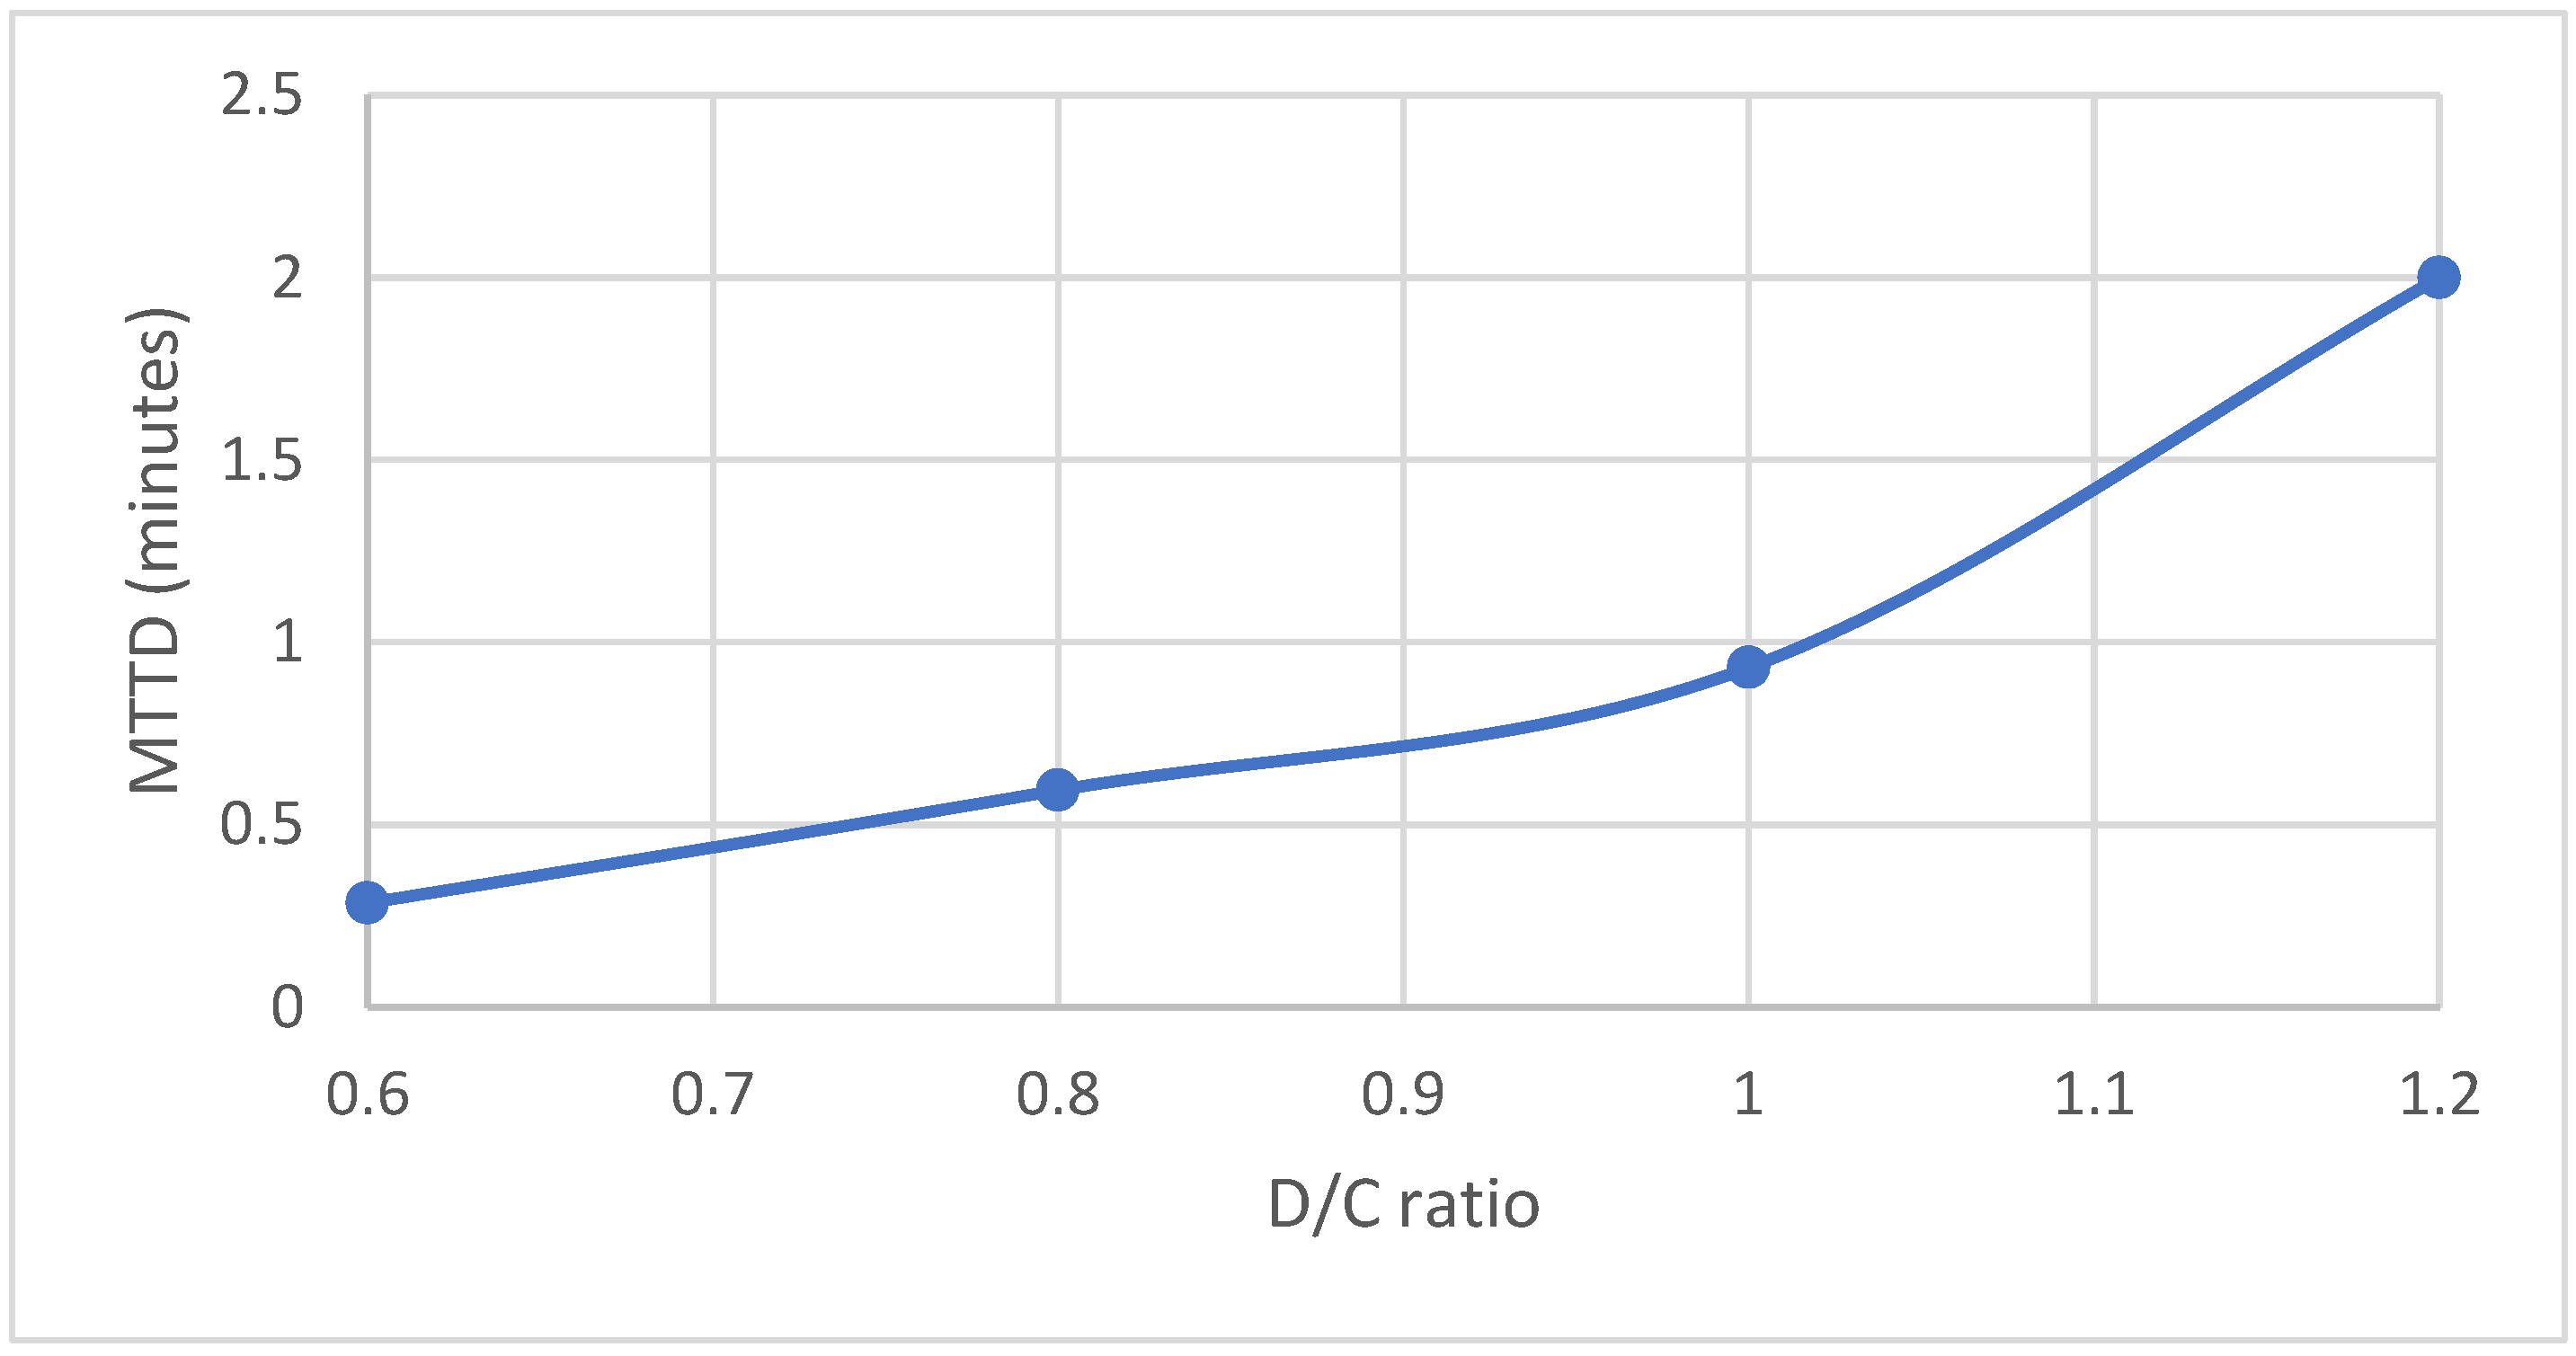
Figure 6.
Comparison of DR between existing AID systems and developed model [27,28,29,30,39,40,57,63,70,75,81,95].
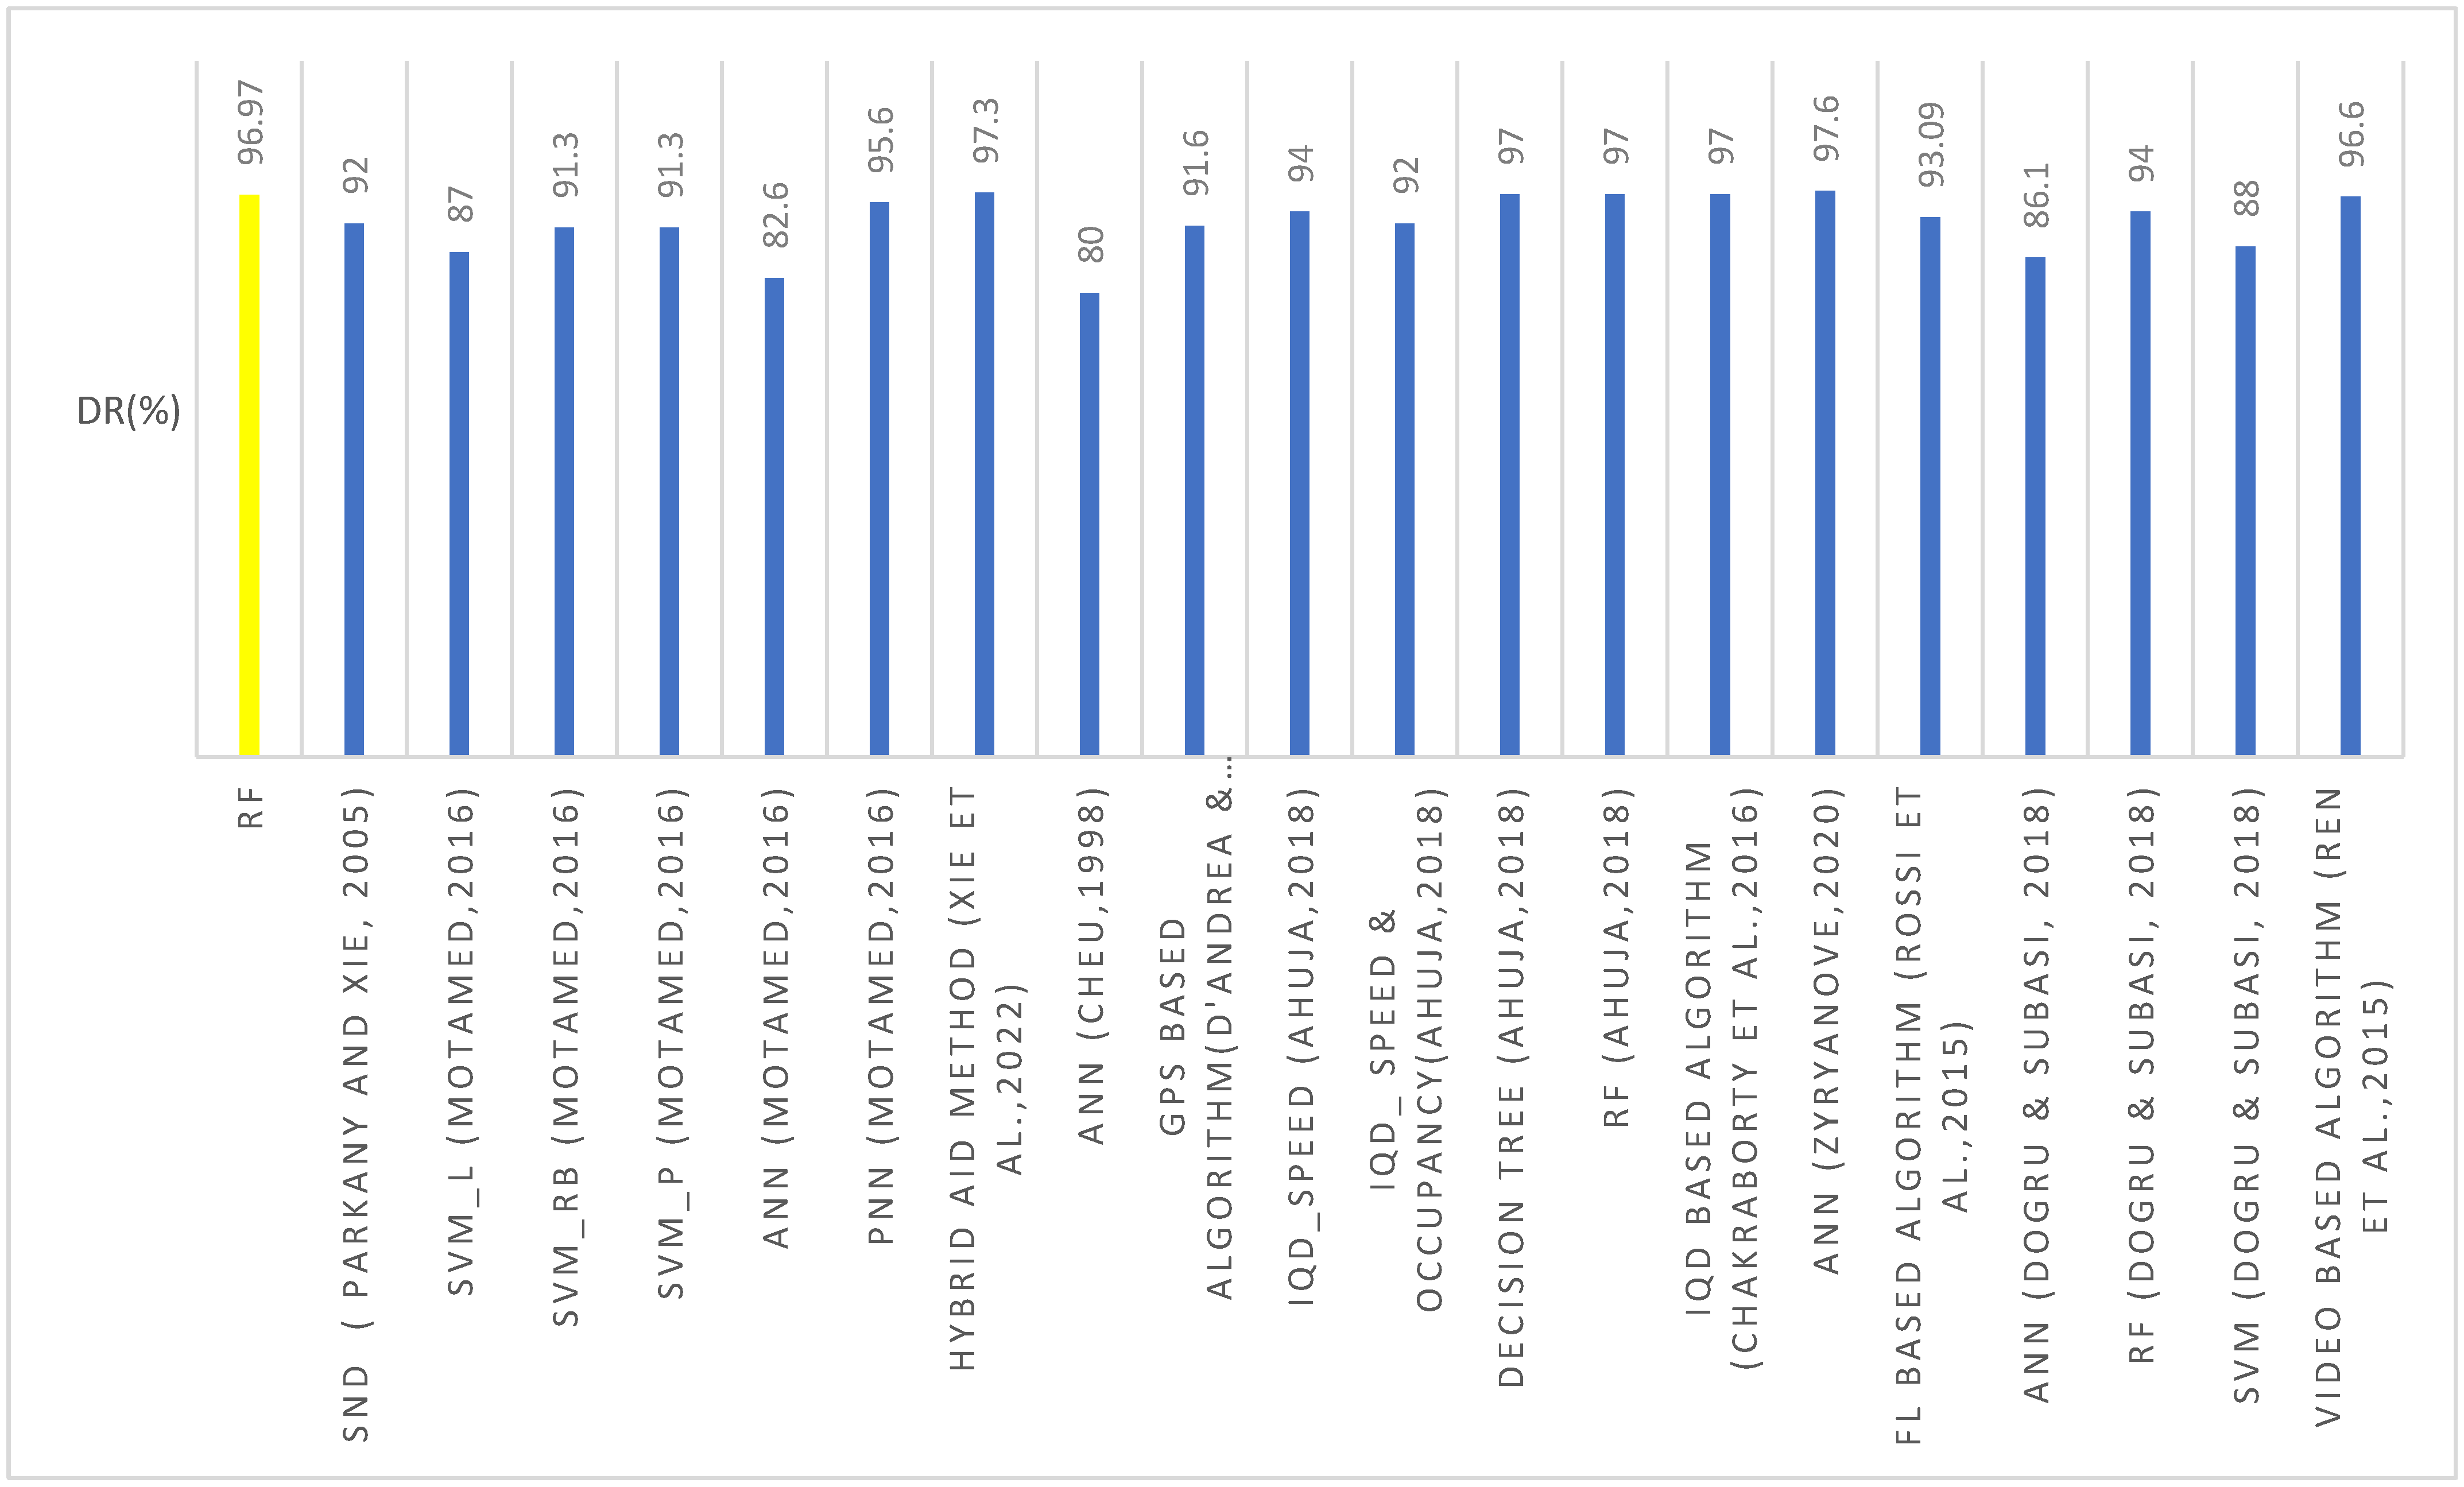
Figure 7.
Comparison of FAR between existing AID systems and developed model [27,28,29,30,39,40,57,63,70,75,81,95].
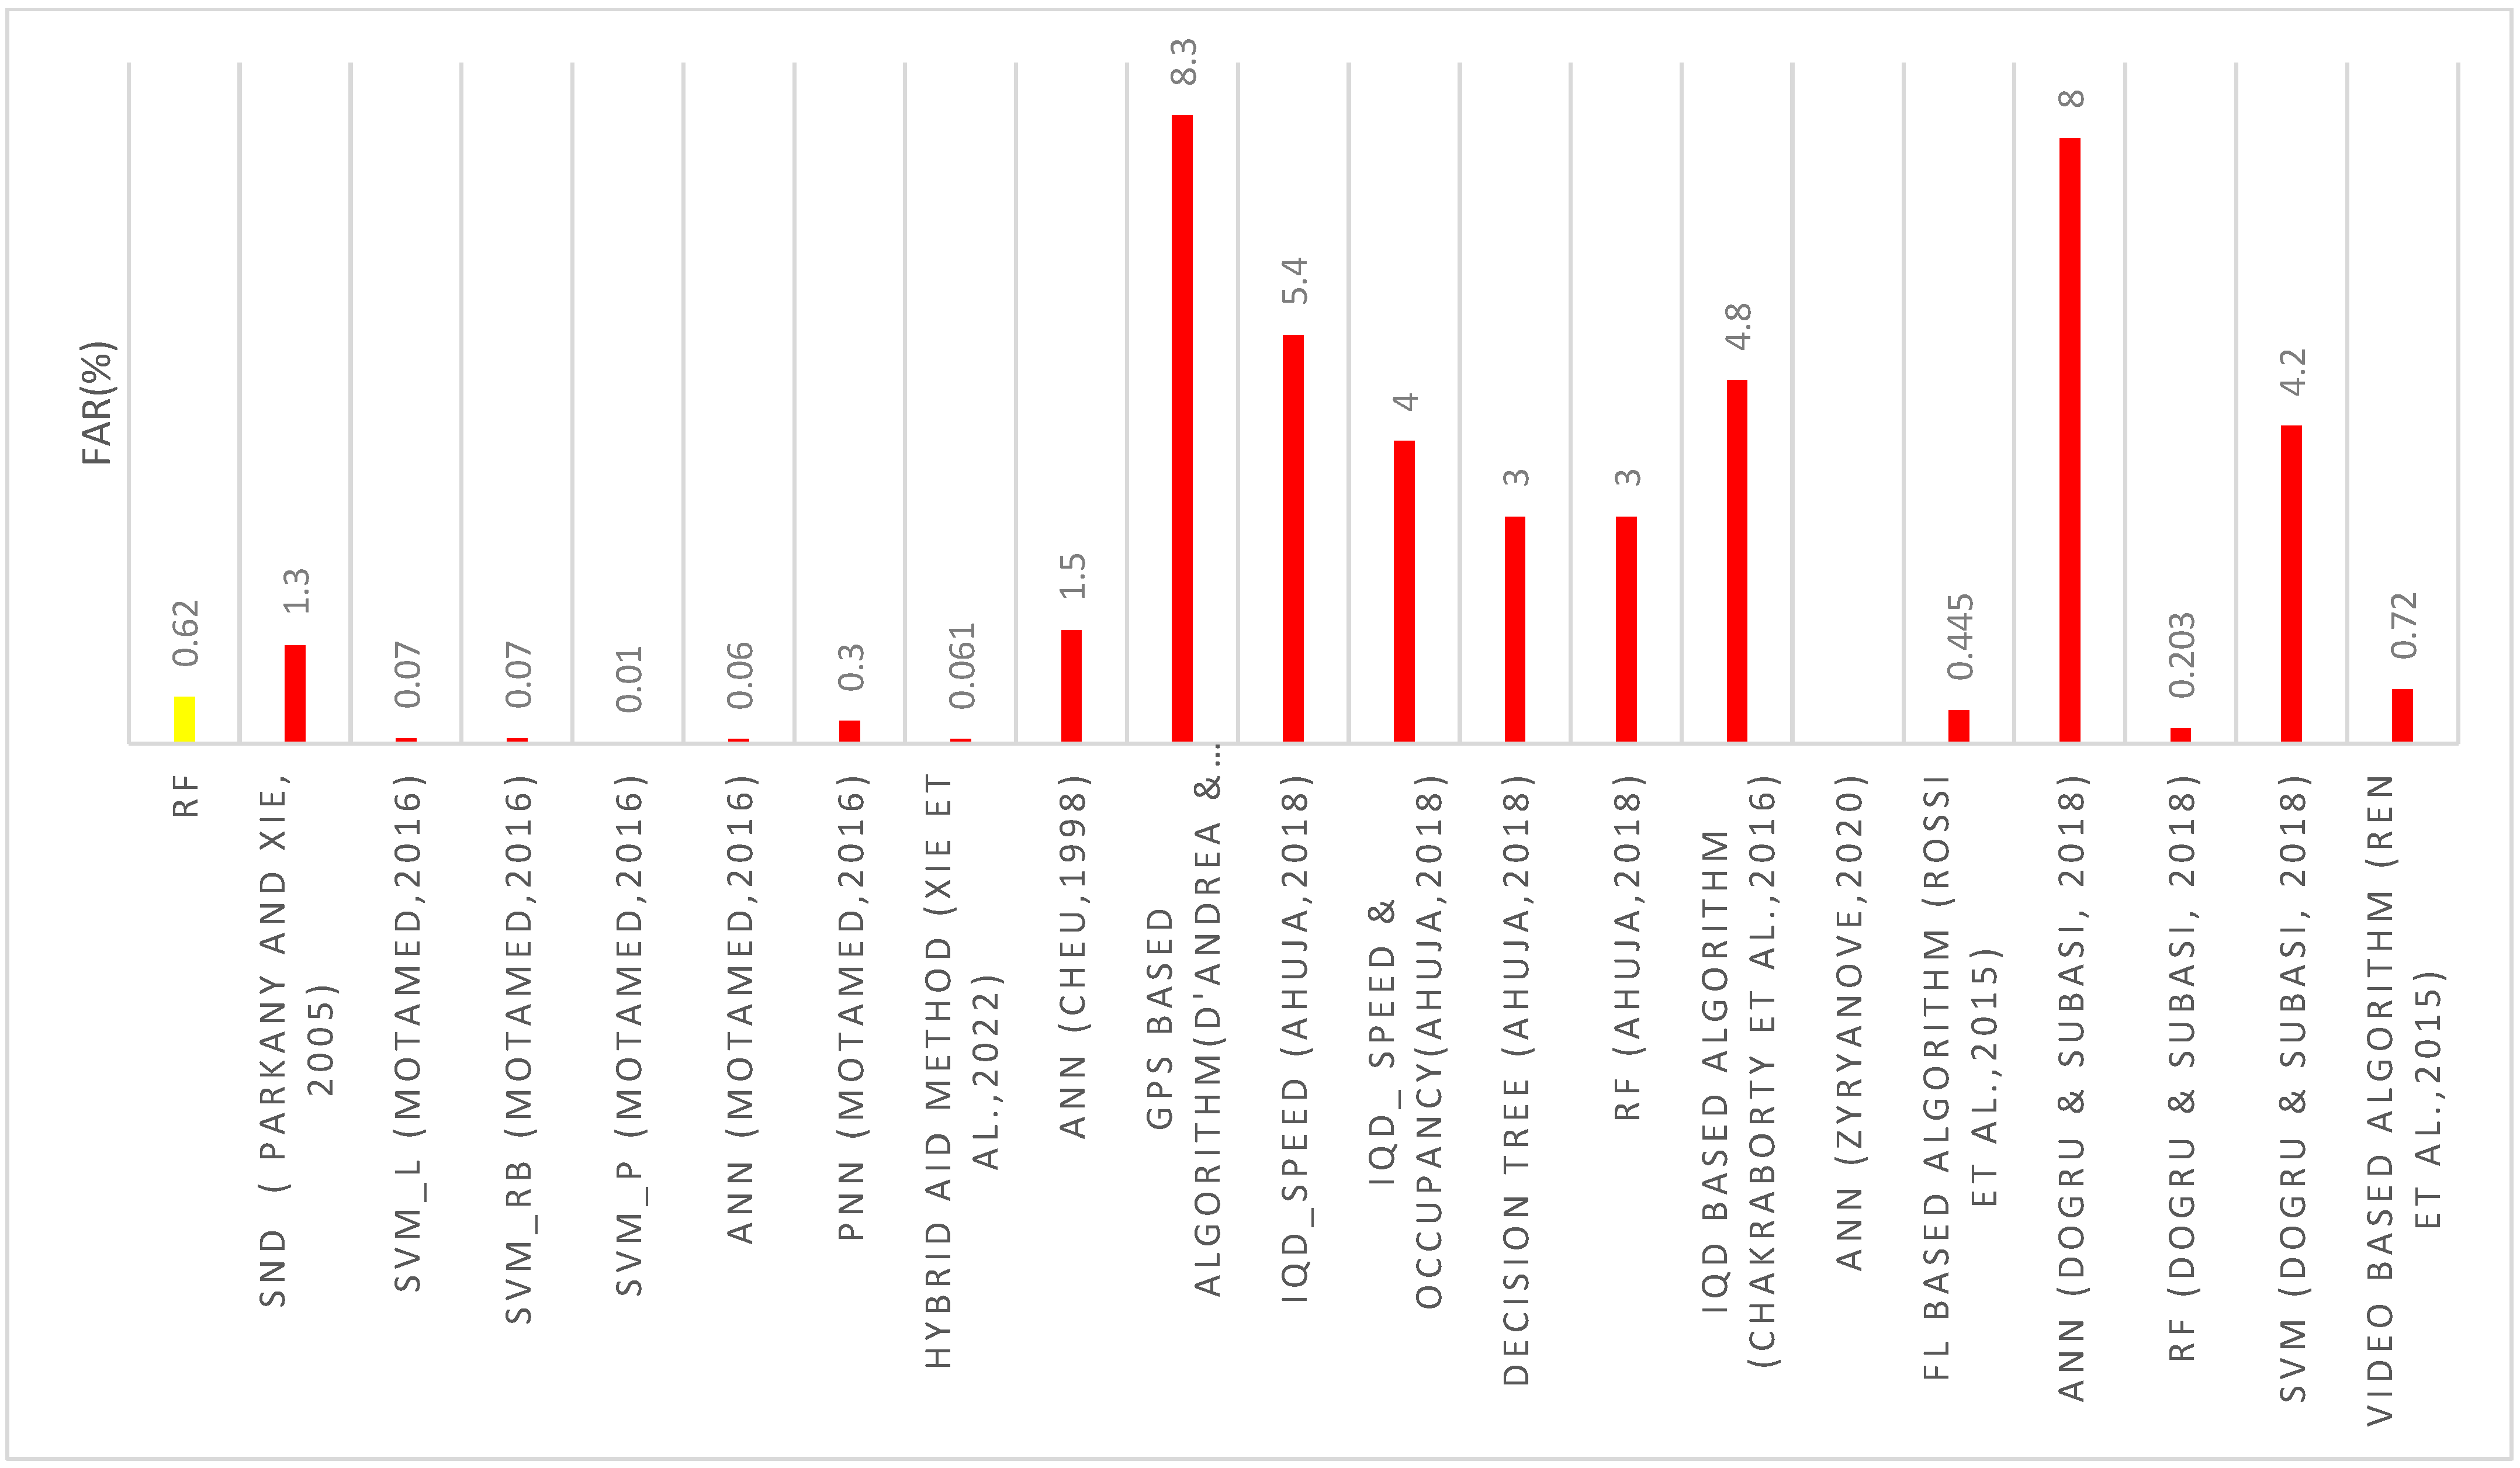
Figure 8.
Comparison of MTTD between existing AID systems and developed model [27,28,29,30,39,40,57,63,70,75,81,95].
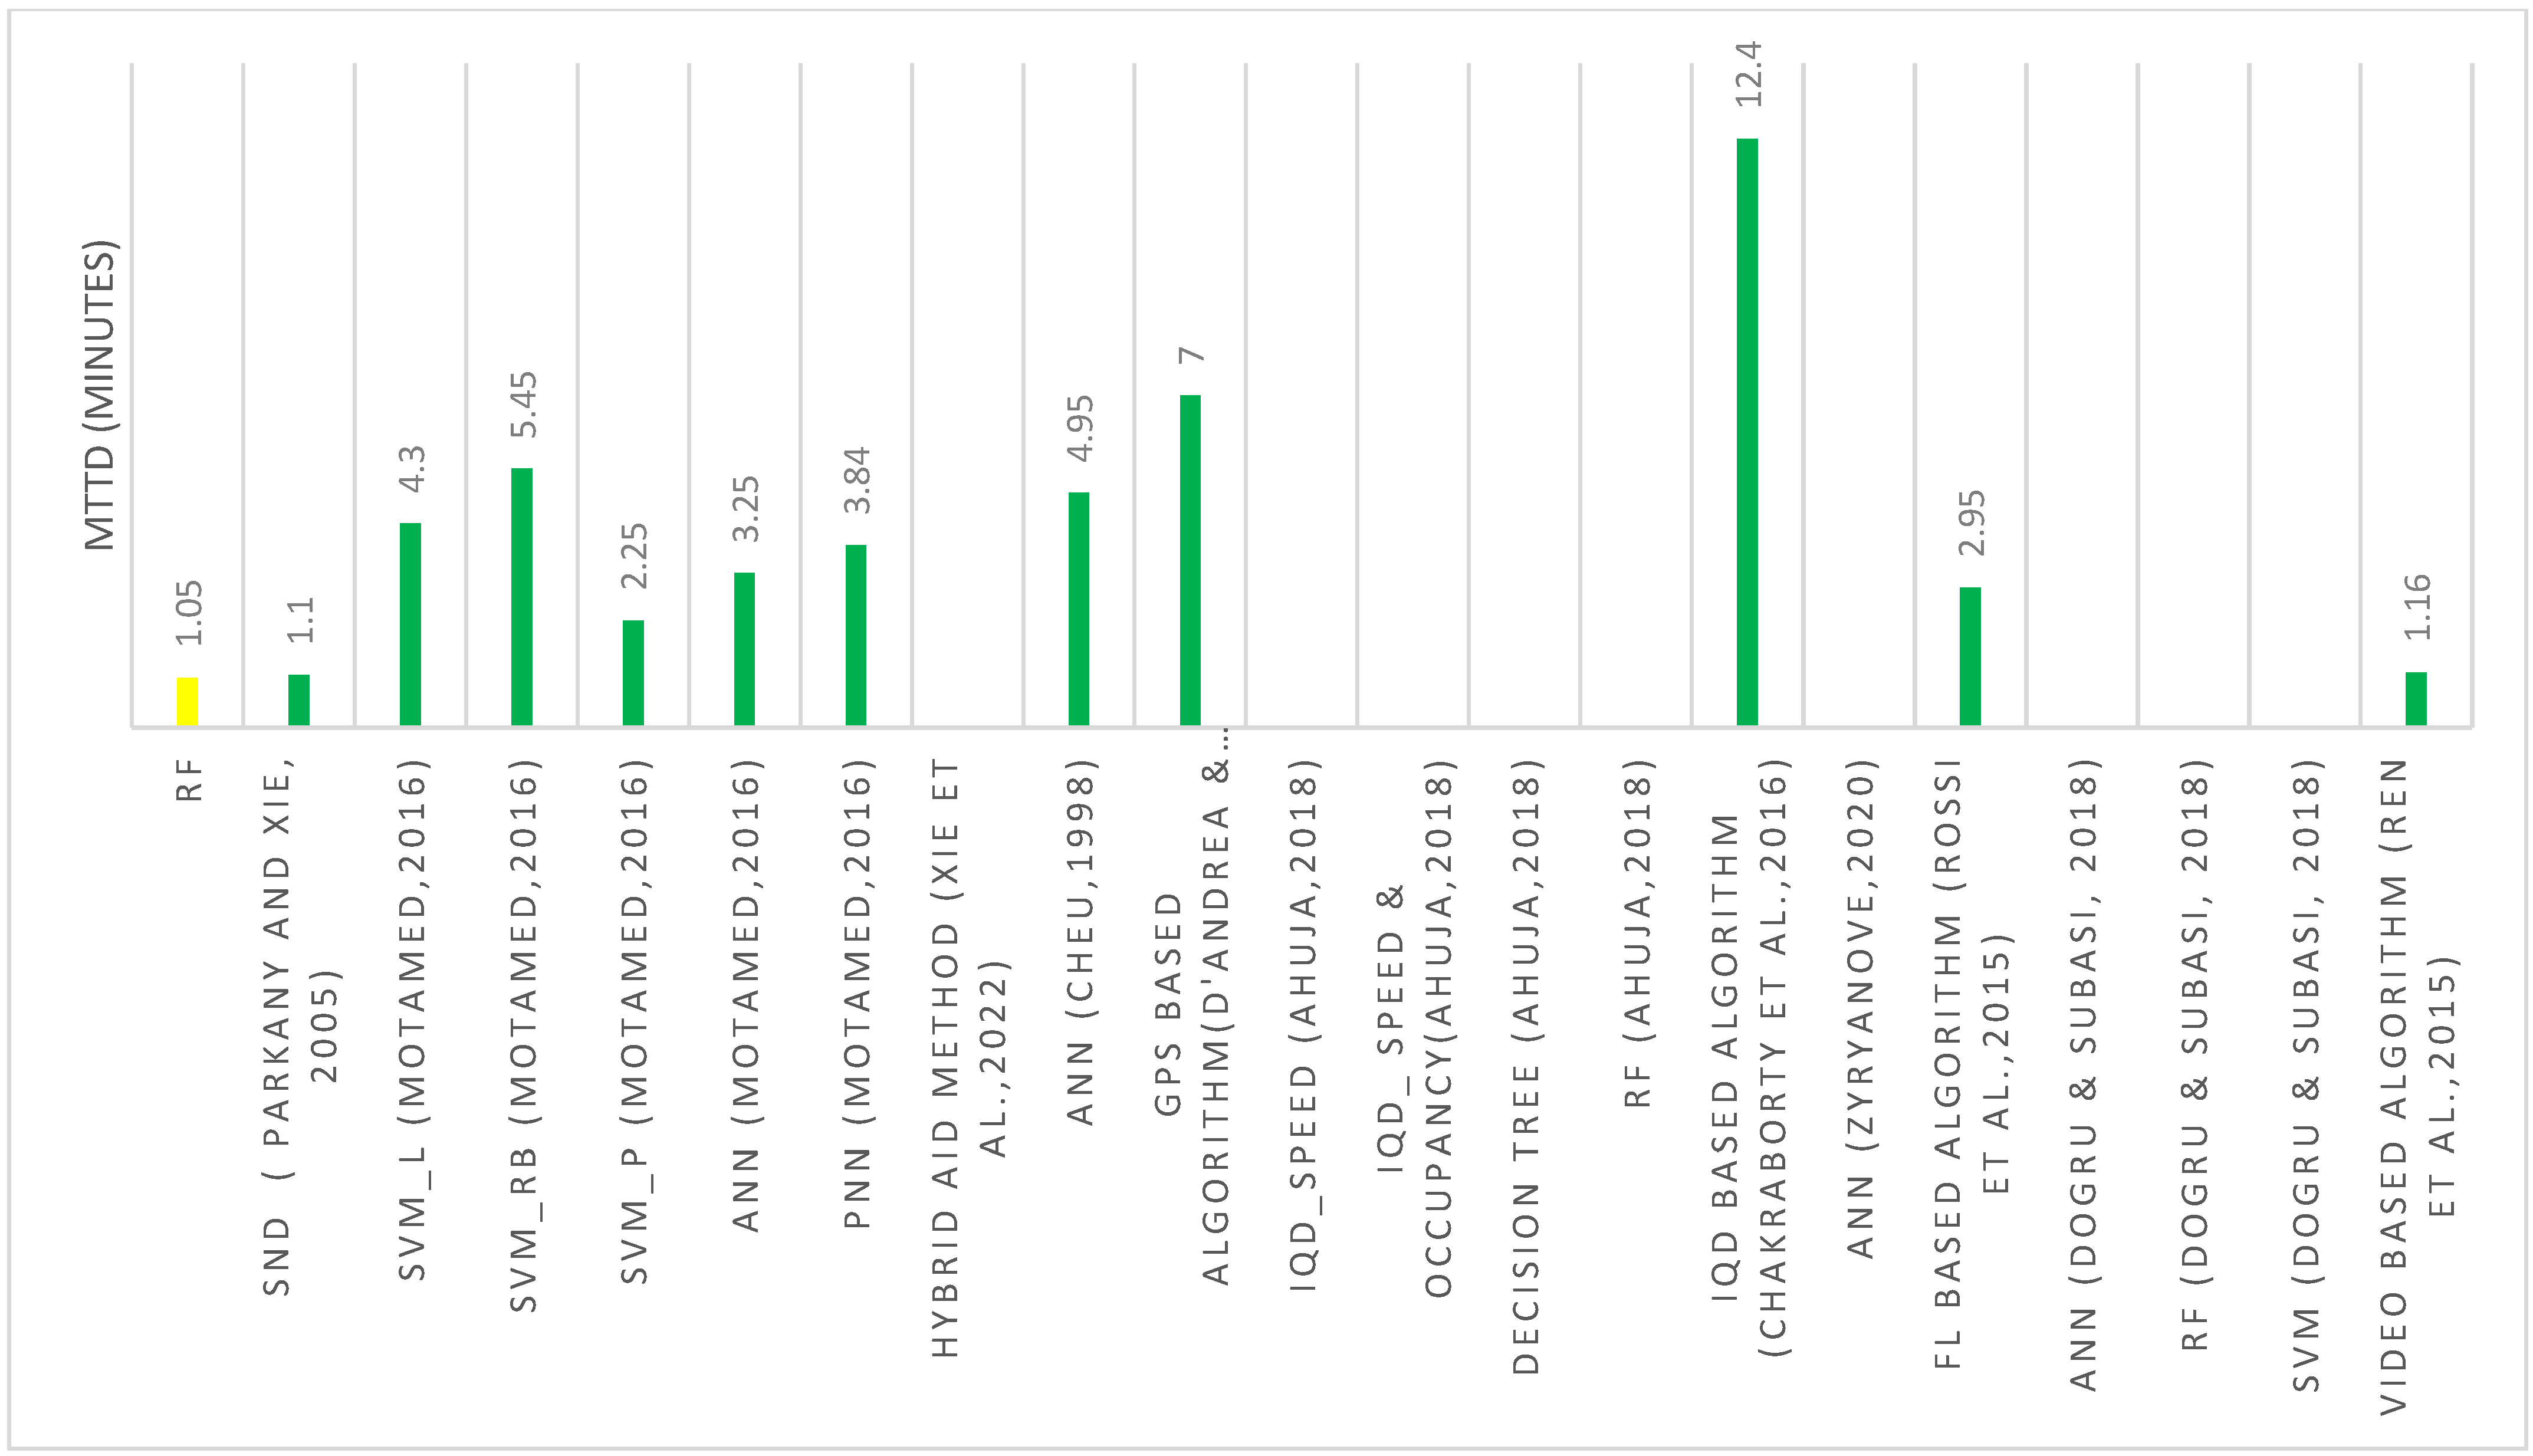

Table 1.
Confusion Matrix for Imbalanced Binary Classification Problems.
| Actual | |||
|---|---|---|---|
| No Incident | Incident | ||
| Predicted | No Incident | True Negative (TN) | False Negative (FN) |
| Incident | False Positive (FP) | True Positive (TP) | |
Table 2.
Cross-Validation confusion matrix of the optimized RF model.
| True Normal | True Incident | Class Precision | |
|---|---|---|---|
| pred. normal | 10,453 | 569 | 94.84% |
| pred. incident | 107 | 3391 | 96.94% |
| class recall | 98.99% | 85.63% | - |
| Accuracy | 95.34% | F-score | 90.94 |
Table 3.
Testing confusion matrix of the optimized RF model.
| True Normal | True Incident | Class Precision | |
|---|---|---|---|
| pred. normal | 2267 | 80 | 96.59% |
| pred. incident | 53 | 1080 | 95.32% |
| class recall | 97.72% | 93.10% | - |
| Accuracy | 96.18% | F-score | 94.20% |
Table 4.
Sample comparison of model predictions and actual status during cross-validation.
| Interval | Actual Status | Model’s Prediction | Comparison Result |
|---|---|---|---|
| 31 | incident | normal | Missed |
| 32 | incident | incident | True |
| 33–37 * | incident | normal | Missed |
| 38–39 * | incident | incident | True |
| 40 | incident | normal | Missed |
| 41–42 * | incident | incident | True |
| 43–45 * | incident | normal | Missed |
| 46–48 * | incident | incident | True |
* Indicates a range of intervals.
Table 5.
Sample of consecutive false alarms in a scenario.
| Interval | Actual Status | Model’s Prediction | Comparison Result |
|---|---|---|---|
| 20–26 | normal | normal | True |
| 27–30 | normal | incident | False Alarm |
| 31–36 | incident | incident | True |
Table 6.
Performance comparison of normal and incident scenario sets for RF model results from cross-validation dataset.
Table 6.
Performance comparison of normal and incident scenario sets for RF model results from cross-validation dataset.
| Scenario Set | Detected Incidents | Number of False Alarms | MTTD (minutes) |
|---|---|---|---|
| Normal | N/A | 10 | N/A |
| Incident | 96 | 80 | 1.05 |
Table 7.
Performance of RF Model by Incident Severity Level.
| Incident Severity | DR (%) | FAR (%) | MTTD (minutes) |
|---|---|---|---|
| 1 lane | 88.46 | 0.641 | 2.5 |
| 2 lanes | 100 | 0.833 | 1.25 |
| 3 lanes | 100 | 0.613 | 0.588 |
| 4 lanes | 100 | 0.972 | 0.5 |
| 5 lanes | 100 | 0.699 | 0.565 |
Table 8.
Sample calculation of DR, MTTD, and false alarms for testing dataset.
| Intervals | Actual Status | Model’s Prediction | Comparison Result |
|---|---|---|---|
| 25–30 | normal | normal | True |
| 31 | incident | normal | Missed |
| 32 | incident | normal | Missed |
| 33 | incident | normal | Missed |
| 34–70 | incident | incident | True |
| 71 | normal | incident | False Alarm |
| 72 | normal | normal | False Alarm |
| 73–80 | normal | normal | True |
Disclaimer/Publisher’s Note: The statements, opinions and data contained in all publications are solely those of the individual author(s) and contributor(s) and not of MDPI and/or the editor(s). MDPI and/or the editor(s) disclaim responsibility for any injury to people or property resulting from any ideas, methods, instructions or products referred to in the content. |
© 2023 by the authors. Licensee MDPI, Basel, Switzerland. This article is an open access article distributed under the terms and conditions of the Creative Commons Attribution (CC BY) license (https://creativecommons.org/licenses/by/4.0/).
Share and Cite
MDPI and ACS Style
ElSahly, O.; Abdelfatah, A. An Incident Detection Model Using Random Forest Classifier. Smart Cities 2023, 6, 1786-1813. https://doi.org/10.3390/smartcities6040083
AMA Style
ElSahly O, Abdelfatah A. An Incident Detection Model Using Random Forest Classifier. Smart Cities. 2023; 6(4):1786-1813. https://doi.org/10.3390/smartcities6040083
Chicago/Turabian StyleElSahly, Osama, and Akmal Abdelfatah. 2023. "An Incident Detection Model Using Random Forest Classifier" Smart Cities 6, no. 4: 1786-1813. https://doi.org/10.3390/smartcities6040083