
Quantitative Electroencephalography: Cortical Responses under Different Postural Conditions

1
Department of Medical Sciences, School of Exercise and Sport Science, University of Turin, 10126 Turin, Italy
2
Division of Pathology, Department of Health Sciences, University of Eastern Piedmont, 28100 Novara, Italy
3
Division of Pathology, Azienda Ospedaliera Santi Antonio e Biagio e Cesare Arrigo, 15121 Alessandria, Italy
4
Department of Psychology, Neurobiology Research Center “Daniel Bovet”, Sapienza University of Rome, 00185 Rome, Italy
*
Author to whom correspondence should be addressed.
Signals 2023, 4(4), 708-724; https://doi.org/10.3390/signals4040039
Submission received: 1 April 2023
/
Revised: 27 September 2023
/
Accepted: 10 October 2023
/
Published: 18 October 2023
(This article belongs to the Special Issue Advancing Signal Processing and Analytics of EEG Signals)
Abstract
:In this study, the alpha and beta spectral frequency bands and amplitudes of EEG signals recorded from 10 healthy volunteers using an experimental cap with neoprene jacketed electrodes were analysed. Background: One of the main limitations in the analysis of EEG signals during movement is the presence of artefacts due to cranial muscle contraction; the objectives of this study therefore focused on two main aspects: (1) validating a tool capable of decreasing movement artefacts, while developing a reliable method for the quantitative analysis of EEG data; (2) using this method to analyse the EEG signal recorded during a particular motor activity (bi- and monopodalic postural control). Methods: The EEG sampling frequency was 512 Hz; the signal was acquired on 16 channels with monopolar montage and the reference on Cz. The recorded signals were processed using a specifically written Matlab script and also by exploiting open-source software (Eeglab). Results: The procedure used showed excellent reliability, allowing for a significant decrease in movement artefacts even during motor tasks performed both with eyes open and with eyes closed. Conclusions: This preliminary study lays the foundation for correctly recording EEG signals as an additional source of information in the study of human movement.
1. Introduction and Fundamentals
Quantitative electroencephalography (QEEG) differs from clinical EEG as it mathematically analyses the tracing of brain waves even in non-pathological states, without necessarily having a clinical purpose [1,2]. Some interesting frontiers in the use of these techniques are linked to sport [3,4,5] or to the analysis of potential predisposing factors for neurodegenerative pathologies, with a preventive approach [6]. Purohit and Bhatt indeed explain that there is still limited evidence examining cortical activity during reactive balance tasks in populations with a high risk of falling [7].
It is possible to find differences in EEG signals recorded in volunteers with closed eyes compared to those with open eyes as regards the alpha frequency band (8–13 Hz) [8,9]. A study by Del Percio and colleagues demonstrated that a certain decrease in the power density of the alpha band in the field of EEG signal frequencies was evident in the parietal area of volunteers standing with monopodalic support, compared to those standing with bipodalic support [10]. A recent study by Kahya and colleagues also demonstrated that it is possible to measure the cortical responses of volunteers engaged in postural control tasks by adding pupillary analysis to the quantitative EEG. Researchers have demonstrated that EEG can be an excellent non-invasive tool for assessing the cortical involvement of postural control. Their aim was to understand the effect of increased postural task difficulty on pupillary response and EEG outcomes, and their relationship, in young adults; however, their study used a much more complex multichannel EEG system than the one presented in this study [11]. Edwards et al. explained that cortical activity involvement in postural control is well recognized; however, the role of non-visual afferents remains unclear. The parietal cortical areas are strongly implicated in vestibular-spatial functions, but topographical localization during balance tasks remains limited [12]. Concerning visual deprivation during postural tasks, Goh and colleagues stated that responses to postural perturbation caused by visual occlusion are similar in nature to those observed in relation to a physical perturbation [13]. Hulsdunker and colleagues also highlighted how little understanding exists of the neural mechanisms underlying the continuous control of balance, and specifically underlined the important role of frontal and parietal electrocortical activities in balance control [14].
In the present study, we highlight the differences in EEG responses between a specific posture with eyes open and with eyes closed, within the EEG spectrum of the alpha bands (8–13 Hz) and also beta (13.5–30 Hz), in agreement with the analysed literature. We investigated the exclusion of visual feedback in a sitting position with eyes open (OA task) and with eyes closed (OC task), in a bipodalic stance with eyes open (BIPOA task) and with eyes closed (BIPOC task) and, finally, in a monopodalic stance with eyes open (MONOA task) and with eyes closed (MONOC task), highlighting the differences in the previously mentioned spectra.
One of the major problems in electroencephalographic analyses is the presence of artefacts, of which the myoelectric type is the most problematic; it is therefore necessary to avoid recording artefacts produced by the contraction of the superficial musculoaponeurotic system (SMAS) [15]. First, we developed a prototype headcap capable of limiting these artefacts; then, we analysed the recording of relatively long tasks so that individual peaks of myoelectric activity were averaged over the entire length of the action, significantly reducing the influence of the artefact on the result of the analysis.
The goals of this study are:
- -
- to replicate some studies already present in the literature on quantitative EEG analysis in eyes-open and eyes-closed conditions to verify the correct acquisition, recording and analysis of the quantitative EEG signals using an experimental headset with neoprene jacketed electrodes;
- -
- to expand upon the studies mentioned above by including a quantitative analysis of the EEG signals obtained in various positions with increasing postural control, again using the headcap with neoprene jacketed electrodes;
- -
- to suggest a possible method to reduce motion artefacts in quantitative EEG recording using neoprene for the headcap.
In other words, we questioned whether it was possible to discriminate tasks with eyes closed from the same ones with eyes open in different postural conditions; whether it was possible to discriminate the position of the volunteer, among the three postural conditions examined; and finally, whether it was possible to verify if some cortical areas behave in a particular way compared to others, using an experimental headcap.
The result of this research should therefore allow for the development of a more effective method for EEG analysis in human movement.
2. Materials and Methods
qEEG: A 16-channel electroencephalograph, W003, produced by OT Bioelettronica (Torino, Italy) was used in this study. The sampling frequency was 512 Hz with a resolution of 12 bits for each sample. The amplifier gain was set to 5000 times. This system analyses a signal band from 3 Hz to 140 Hz, with an adjustable gain of 100, 200, 500, 1000, 2000, 5000 and 10,000 times. The instrument is connected to a processor that handles the visualisation and export of the data [4,5].
Headcap: For this study, an experimental headcap, Spescup, produced by Spes Medica (Genova, Italy), made of breathable elastic material was used, on which a specific type of electrode was applied, consisting of two neoprene rings with an interposed conducting tin ring, with protection against wear at the junction point of the cable, in order to allow for measurements even during the movement of the wearer, without incurring movement artefacts. In Figure 1 and Figure 2 it is possible to see this new type of electrode that reduces the problem of small translation on the scalp; being made of rubbery material, it allows minimal movement of the headcap without the part in contact with the scalp moving from the initial application site. Furthermore, another advantage of this type of electrode is the increased comfort during use. To create skin contact with the electrode, the elastic and conductive gel Neurgel, also produced by Spes Medica, was injected using a syringe with a 1 mm thick needle with a blunt tip. The EEG headcap has 21 electrodes positioned in accordance with the international 10–20 system [16] as shown in Figure 3. The connection between headcap and amplifier is ensured thanks to a 150 cm long cable with a connector, manufactured by OT Bioelettronica (Turin, Italy).
Stabilometric platform and Physiotherapy couch: Volunteers were positioned for the tasks in orthostasis on a Prokin PK 214 P stabilometric platform as shown in Figure 4 (TecnoBody, Bergamo, Italy) [17,18]. The platform data were used only to eliminate measurements with excessive trunk swing. It has a diameter of 40 cm and an overall maximum load capacity of 200 kg (70 kg each sensor, with a maximum resolution of 50 g). The system is equipped with four load cells placed at 120° with respect to the transverse plane and placed diagonally with respect to the two anteroposterior (A-P) and mediolateral (M-L) axes; the acquisition frequency of the sensors is 20 Hz and their calibration takes place automatically. The software of the instrument allows for the creation and analysis of a statokinesigram, axial stabilometry, Fourier transform and the evaluation of oscillations of the trunk [19]. On the wall opposite the platform, a support was placed on which a point was drawn at the height of the volunteer’s eyes. For the tests carried out in a sitting position, a Raminstar physiotherapy bed about 80 cm high, produced by Chinesport (Udine, Italy), was used.
Software: Real-time data visualisation and signal acquisition were performed using OTBiolab 1.2 (OT Bioelettronica, Torino, Italy) software. Before proceeding with the EEG recording, a visual analysis of the signal was necessary in order to evaluate its quality; this operation makes the operator’s experience fundamental.
Data processing was performed using the MathWorks (Natick, MA, USA) 32-bit Matlab 7.9.0.529 (R2009b) program.
The Eeglab 8.0.3.4b program, which runs in Matlab, was used for the visualisation of the imported signal and for the creation of brain activity maps. The software function of displaying the signal over time was used to select the parts of the signal that were visually free from artefacts or with the least noise possible; these selections were then elaborated upon through some specially developed scripts, and the data taken from the signals were used for statistical analysis [20].
The GraphPad’s Prism 5 (GraphPad Software Inc., San Diego, CA, USA) program was used for the statistical analysis [21,22,23].
Testing space: To carry out this study, a laboratory was specially set up in an artificially lit room without windows, to ensure constant brightness, the room was free from noise sources and acoustically isolated from the outside.
Population and characteristics: Ten male volunteers declared to be in good health were examined, with an average age of 29 years and 10 months (SD = 5 years and 1 month), none of whom were affected by any neurological, orthopaedic or vestibular pathology. All participants gave their written informed consent for inclusion in this study and the publication of results before they participated. The study was conducted in accordance with the Declaration of Helsinki. Nine volunteers selected for data analysis preferred right limb support in the lower limb predominance test. In the tasks in monopodalic orthostasis, the volunteers stood on their predominant limb, keeping the contralateral one elevated forward with the thigh approximately parallel to the plane of the platform and the leg bent at the thigh. The inclusion criteria in the experimental group included an absence of cognitive deficits and neurological pathologies.
Phases of the experimental protocol: The volunteer is allowed to get used to the environment where the test was carried out; this confidence-building time is necessary in order to prevent the objects present in the room and the environment itself from influencing the EEG tracing. This preliminary phase lasts about 10 min; during this time, the operator shows the equipment used and explains how the EEG signal will be taken. The volunteer is told that the procedure will not be painful in any way and will not cause any kind of damage. Informed consent and consent to the processing of data in anonymised form are then signed. Before the volunteer is seated on the couch, a test is performed to identify the volunteer’s dominant lower limb. In the last phase, the protocol used for the test is presented. Subsequently, the operator places a bracelet on the volunteer’s right wrist, which is connected to an amplifier and which acts as the ground; a headcap is applied to the volunteer’s head and the electrodes are filled with conductive gel using a syringe with a blunt-point needle. Finally, a connection is made between the headcap and the amplifier. The operator performs a visual check of the signal obtained from the scalp directly on the monitor of the PC to which the amplifier is connected and checks that the signal saturation indicators combined with each single channel give a negative result; following this operation, the signal reception quality is checked; if it was not sufficient, a further check is carried out on the electrodes whose signals are not correctly acquired, thus verifying their correct positioning, and possibly adding further conductive gel. Once the quality of the signal has been verified, the actions that the volunteer must perform during the acquisition of the signal are explained to them. At this point, the recording of the electroencephalic signal begins for each of the actions performed by the volunteer; the acquisition is of the monopolar type and the reference is the median on the scalp (Cz).
At first, the volunteer is seated on the physiotherapy couch and asked to stare at a point on the wall in front of them; this task is called open eyes (OA). After 30 s, the volunteer has to close their eyes, and perform the closed eyes (OC) task, for 30 s more. Figure 5 and Figure 6 show an example of analysis in the frequency domain relating to the two tasks described.
The volunteer is then asked to move onto the stabilometric platform, where the operator checks the quality of the signal again, adding more gel if necessary in order to improve the contact between the electrode and the skin because it may have deteriorated during the movement; the volunteer is positioned with feet together, with one separated from the other by the midline of the instrument (anteroposterior axis), and centred in the anteroposterior direction (on the mediolateral axis). The first task that the volunteer must perform on the platform is to stay in a bipodalic support position with eyes open (BIPOA) for 60 s while staring at a dot set previously (the dot is drawn on a mobile support and applied two metres from the volunteer on the wall opposite the platform at eye level of the volunteer). The second task lasts another 60 s and involves the same type of support but with the eyes closed (BIPOC). The next task involves monopodalic support of the dominant limb, placed with the sagittal line median of the platform (front-posterior axis) coinciding with the second toe and the centre of the heel; this task lasts 30 s with eyes open staring at the point on the wall previously described (MONOA). Finally, the last task involves the same position but with eyes closed (MONOC). See Table 1 for the description of the various tasks.
In the two tasks with monopodalic support, the intervention of a collaborator is necessary to hold the monopolar cable overhead, as this motor task causes greater body oscillations in the volunteer than in the previous tasks. To prevent noise from being generated due to collisions between connectors, an operator holds the cable above the volunteer’s head, allowing the braid of wires coming out of the headcap to move freely without the connectors colliding, this collaborator must have a bracelet on their wrist or a plug on their hand connected to the ground in the amplifier.
During the actions, MONOC and MONOA, in the event of loss of balance, the volunteer may lean with one hand on the support of the platform. The execution of the tasks on the stabilometric platform has as its motivation the prevention of the recorded task from being performed in conditions of poor postural control.
Signal analysis: As for the pre-processing, the signal was acquired through a 3–30 Hz analog bandpass filter to which a digital filter was subsequently applied to further increase the attenuation of out-of-band noise. We used a 1 Hz high-pass filter and a 50 Hz tuned Notch filter to remove AC noise [24,25]. For both the 30 s and 60 s tasks, a time window length of 5 continuous seconds was identified, centrally with respect to the duration of the entire task, and therefore, this time window was used for subsequent signal analyses. The reason for this temporal selection of the signal is due to simple logistic factors: the signal is in fact acquired continuously, and the volunteer needs to move to assume an orthostatic bipodalic position after that session, and then, a monopodalic position after the bipodalic one; the identification of a window in which there are no artefacts due to the movement of the volunteer between the various positions and in which there is coherence and stability in the recorded signal allows us to analyse only the electroencephalic signal dependent on the specific postural task in which the volunteer is engaged. For this study, a specific script executable through the Matlab program was developed in order to create data matrices to be subsequently analysed using the statistical processing program. The program makes it possible to import the desired files sequentially, and it is possible to perform the analyses for the desired signal bands, avoiding selecting a band interval that is too narrow for the type of filter used (5th-order Butterworth).
Once the band to be analysed have been identified, the selection of the file of the first volunteer and the start and end times of the various tasks in milliseconds are requested; then, the other files will be inserted with the relative time data.
The program was designed to memorise the time values of the various tasks, in order to speed up further analysis operations on the same files. Once the input of the volunteer files is completed, the program calculates the mean frequency, the median frequency, the ARV (Average Rectified Value) and the PSD (power spectral density, based on DFT technique) for each second (1000 ms), and then, averages the 5 fragments (because we used a 5 s time window length); in the case of timing sections of less than a second, the program manages the values by weighting them on the length of the section where necessary, so as to be able to compare the data between one section and another [26]. As regards the PSD, we estimated the power that corresponds to the peak in PSD; this approach was applied to both the alpha and beta bands. Pre-processing filtering, described above, reduces sub-10 Hz and -50 Hz spurious frequencies, allowing for a cleaner spectrum analysis.
The four matrices created have five dimensions: (1) volunteer number, (2) band, (3) task, (4) channel and (5) time; so, each value has five indexes that define its position. These values are subsequently entered into a matrix with only four dimensions by averaging the values of the single task, obtaining a single timing value for each action.
The next step is the generation of two-dimensional matrices that can be imported into the statistics program. A dialogue window requires the selection of the location in which to save the data, and through a few processing cycles, the matrices will be created, keeping 2 indexes fixed and thus leaving only 2 variables, which are saved as a .csv file.
The matrices maintain a two-dimensional shape and are constructed for each channel in relation to one of the two variables (ARV or PSD) of one of the two bands (alpha or beta) examined for each of the two conditions (eyes open or eyes closed).
Since the differences between sitting position, standing position with bipodalic support and standing position with monopodalic support were analysed, a total of 384 tables were generated (128 for each analysis * 3 stations investigated).
Statistical analysis: For the statistical analysis, the GraphPad Prism program was used, and a Wilcoxon test was performed on each pair of variables. We decided to carry out the two-tailed Wilcoxon test to verify whether in all channels, the task involving closed eyes had a higher average value than the same with open eyes. Furthermore, a Friedman test was used to compare the three tasks with eyes closed and the three tasks with eyes open. Subsequently, Dunn’s post hoc test was conducted to analyse the differences between the tasks of the same group [27,28].
3. Results and Data Analysis
The difference between the two tasks in a seated position and between the two tasks in an upright position with bipodalic support was statistically significant both as regards ARV and PSD. As can be seen from the Table 2, the differences are visible for almost all of the registered channels.
A greater number of statistically different electrodes were found in the tasks filtered for the alpha band of the signal than for the beta; when statistically significant, the differences showed higher values for the eyes-closed tasks. As regards the task in orthostasis with monopodalic support, the only significant results are highlighted mainly for the electrodes in the posterior area of the skull.
In Figure 7, Figure 8 and Figure 9, the blue coloured electrodes represent a statistically significant difference between eyes open and eyes closed for the ARV variable in the various postural conditions.
In Figure 10, Figure 11 and Figure 12, the blue coloured electrodes represent a statistically significant difference between eyes open and eyes closed for the PSD variable in the various postural conditions.
The data in the graphs shown in Figure 13 and Figure 14 represent ARV and PSD averaged over all channels, thus only obtaining a value for each task that represents the average electrical emission of the entire scalp averaged over all volunteers. From this type of analysis, we can highlight that in the alpha band, the values of the tasks with eyes closed are always greater than those of the tasks with eyes open, both as regards the ARV and PSD variables. It can be observed that the ARV and PSD values of the tasks with eyes closed decrease as the difficulty of the task performed increases.
4. Discussion and Conclusions
On the basis of the results obtained, we can state that the headcap with neoprene jacketed electrodes allows us to obtain EEG signals that discriminate between the conditions of open eyes and closed eyes in a way comparable to the reference literature, both in the alpha band and in the beta band; it also allows us to analyse different postural conditions in order to identify the existing variations in the aforementioned bands as well as allowing for the analysis of the localization of the signal on the scalp in a clear way; finally, it permits us to obtain a clean signal from movement artefacts, an existing limit in the analysis of the EEG signal during motor tasks and which requires heavy subsequent interventions on the signal through hardware and software filters. The use of a headcap with neoprene jacketed electrodes, on the other hand, allows for the acquisition of a signal that is substantially free of large myoelectric artefacts.
We can state that for the alpha band of the EEG signal, it is possible to identify a statistically significant difference for ARV and PSD between eyes open and eyes closed in the tasks with the volunteers seated and in those with the volunteers standing with bipodalic support; although we could expect statistically significant differences involving, in particular, the areas close to the occipital lobe, statistically significant differences were found in all electrodes, except for electrodes C3 and P3.
As the postural task increased in difficulty, however, there was a reduction in the number of electrodes with statistically significant differences between the eyes-open and eyes-closed conditions, as the increasing difficulty of the task tended to smooth out the differences between the visual conditions in most brain areas, highlighting the electrodes at the same time and therefore the brain areas directly involved in the presence or absence of visual stimuli.
The reason for this behaviour is found in the fact that the exclusion of sight causes an increase in the signal amplitude in the alpha band. In the analysis of the tasks in a standing position with monopodalic support, on the other hand, the same type of statistically significant differences were not found; however, some significance was highlighted in the electrodes placed in the occipital area (O1 and O2) and neighbouring areas. These differences were found for both the alpha band and the beta band. A possible explanation is related to the lack of relaxation induced by the elimination of the visual feedback; in this type of support (monopodalic), the volunteer is unable to find a state of relaxation, blocking the increase in the amplitude of the signal in the alpha band.
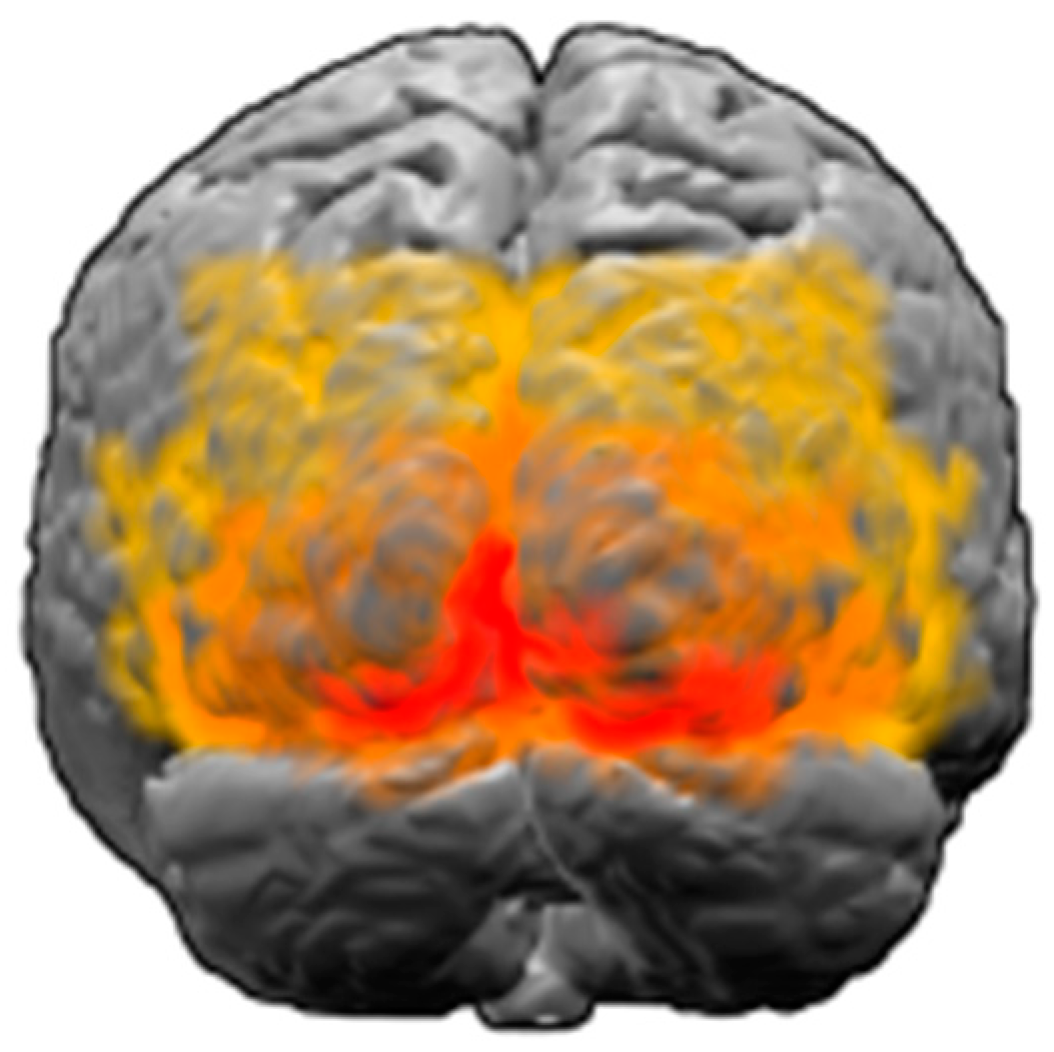
However, the O1 and O2 electrodes were placed on the occipital cortex in correspondence with BA17 (primary visual cortex), BA18 (visual association) and BA19 (visual association, recognition of features, shapes and attentional integration functions) [29,30] as shown in Figure 15; this is probably the reason we can detect differences in all the positions and in all the bands analysed. Furthermore, it is possible that, given the reduced spatial resolution, the signal recorded by these two electrodes contains some signal components coming from the cerebellum, which has the task of controlling the execution of the movements [31,32].
As regards the beta band of the EEG signal, minor significant differences were detected between tasks with eyes open and tasks with eyes closed, the reason being the characteristic of the beta waves, which are gradually wider as brain activity increases; for this reason, fewer differences were found, especially in the tasks with bipodalic and monopodalic support in the standing position.
The difference in brain activity in the task with eyes open compared to that with eyes closed is less than the activity introduced by the task of maintaining this position; furthermore, the increase in the level of attention, which occurs when we exclude sight, produces increased brain activity with increasing instability. Regarding the upright position with bipodalic support, since the task of maintaining balance is less onerous than the positions with monopodalic support, due to the greater support surface, the differences in brain activity relating to the presence or absence of visual feedback are greater, even if they refer only to the posterior area of the skull. For the tasks recorded in the seated position, for the reasons mentioned above, we highlight a greater level of significance. In all the tasks analysed for both bands, when the test results are statistically significant, the ARV and PSD values of the tasks with eyes closed are greater than the respective tasks with eyes open; this means that when the subject has their eyes closed, the cortical signal emitted by the areas in which differences have been identified has a greater amplitude.
In the tasks in monopodalic orthostasis, the value in the power spectral density (PSD) of a particular electrode has attracted our attention: C4 filtered for the beta band. Looking at the representation of the electrodes on the scalp, the area to which this electrode refers is identified in the literature as Brodmann’s area 4, relating to the primary motor cortex [33]; furthermore, we know that the voluntary motor impulses of the contralateral half of the body, in our case, of the left side, are generated from this area [34]. Examining the execution of the task, we could therefore identify a stabilising use of the elevated lower limb; this also involves movements of considerable amplitude made to maintain balance, especially with eyes closed. Then, examining the predominance of the lower limbs of the subjects analysed, we can find that all have the lower left limb raised, the control of which, as already described above, would appear to be responsible for Brodmann’s area 4 on the right side of the skull, precisely the area corresponding to the C4 electrode [35].
Clearly this remains a mere hypothesis relating to the significance found for electrode C4, but which would need further investigations to be confirmed.
Confounding factors: Myoelectric artefacts are the first of the potential error factors, as the contraction of mimic and cranial muscles, in particular, those of the temporo-frontal and occipital area such as the frontal and occipital belly of the epicranius muscle and the auricular muscles, generate an electrical signal which is detected by the EEG amplifier, but which does not match the cortical electrical signal. To limit this factor, it is necessary to apply a low-pass filter at 45 Hz to partially reduce the acquired myoelectric signal [36]; the filter can be applied directly at the hardware level or applied later at the software level.
A further source of error linked to the anatomical district involved concerns the displacement of the skin planes on the skull, due to the contraction of the aforementioned muscles; although, on the one hand, it is true that this displacement does not generate noteworthy electrical artefacts, it is evident in the electroencephalographic recording that there are signal amplitude peaks due to the sliding of the electrodes on the scalp.
The positioning of the electrodes through the application of a prepared headcap must follow a consistent and repeatable procedural line, since if the positioning is varied during the measurement, the signal will be recorded in correspondence with areas that have undergone a slight translation. With this in mind, it is useful to remember that the electrode detects the electrical activity cortex of an area with a diameter approximately 10 mm greater than the diameter of the electrode itself. Furthermore, the conformation of the headcap in relation to the shape of the skull could generate minimal differences in the spatial acquisition of the electroencephalic signal.
To amplify the EEG signal (that on the surface of the scalp has an amplitude of a few tens of microvolts), an amplifier hardware device (already mentioned) is used; due to the strong amplification required to visualise the EEG signal (which can reach ten thousand times), the electromagnetic interference present in the environment is, in turn, amplified and can become a source of disturbance.
The electrical network to which the equipment is connected (AC 240 V 50 Hz) interferes with the acquisition of the electroencephalographic signal; this interference is evident in the analysis of the signal due to the presence of a peak in the frequency domain relating to 50 Hz. Thanks to the use of the low-pass filter, the frequency in question is outside the frequency range under analysis.
Sources of extemporaneous acoustic noise in the recording room could disturb the test, as they would reduce the reproducibility of the protocol by inducing variations in the emitted cortical signal in the tested volunteer; these alterations would then not be distinguishable or eliminated by observing the trace, compromising the usefulness of the measurement of the task in question; for this reason, the tests must always be performed under the same conditions and it is therefore important to eliminate random noises and other forms of sensory disturbance.
To ensure that the electrodes receive the electroencephalographic signal in an optimal manner, it is necessary to use conductive gel; if this is not sufficient, the signal will be affected by a large amount of noise, and in the opposite case, the signal registered may not be correct, due to the short circuit that would occur between nearby electrodes.
A final source of error is related to the correct positioning of the ground electrode on the wrist of the volunteer, which guarantees an optimal recording. The adopted strategy involves the use of a wet bracelet to be positioned on the wrist of the tested volunteer. It is also advisable that the examiner also have an earth connection in the same apparatus.
In the signal reception quality verification phase, the researcher’s experience is decisive in the recognition of the coherence of the recorded signal; a signal in which there are excessive artefacts, or in which the signal recorded by the electrodes is spurious, would generate not very useful data for the subsequent analysis. The presence of indicators of saturation of the signal band does not facilitate the task of the operator, as this indicator does not evaluate the quality of the signal but only the saturation; consequently, the visual analysis of the signal on the monitor is fundamental.
It is very important to choose the right type of assembly; in this study, a monopolar assembly with a reference on the Cz was chosen. It must be remembered that no reference is electrically silent; the reference electrode is usually positioned at the level of the interhemispheric fissure in the apical area.
A superficial or lack of explanation of the phases of the experimental protocol is supposed to influence the result of the electroencephalographic tracing, as a volunteer unaware of what will happen during the study will respond with different cortical activity from a correctly prepared volunteer.
Manipulating the connection cable between the headcap and the amplifier during recording introduces a source of noise into the recorded signal. To overcome this inconvenience, the movements of the volunteer have been reduced to a minimum during the tests and the cable must be positioned so that it cannot swing; the operator must avoid touching the aforementioned cable, as the parts that generate the most noise are the connections between the pins of the headcap and the pins of the connector.
Another source of error is the incorrect coupling of the electrodes with the relative pin of the acquisition cable; this error leads to an inversion of the channels in the import of the signal, making the study of the spatiality of the signal useless.
The use of the amplifier device requires some adjustments, which must be unchanged and consistent; the real-time data visualisation software and the processing software must be sufficiently known by the researcher, who will necessarily have to spend a learning period on the relative use of the applications.
The hair and scalp have conductivity that varies from person to person, so the quality of the signals also depends on the volunteer.
A request to shave the scalp to unify the values of the length of the hair and the application of a degreasing solution would eliminate some differences in the conduction of scalp electricity. Due to the shape of both the headcap and the skull, some electrodes may not adhere perfectly to the skin, this could compromise the quality of the signals taken from these points.
We propose the adoption of a headcap for signal acquisition provided via a continuous pressure system of the electrodes on the scalp and possibly including a continuous gel release mechanism inside the electrode at the point of contact with the skin. By exerting slight pressure on the volunteer’s skin, the electrodes would guarantee perfect adaptation of the instrument to the various thecal conformations.
Perspectives: The removal of artefacts related to the presence of myoelectric activity could be performed via EMG detection, and the artefacts could subsequently be subtracted via software from the signal of the electrodes taken from the affected area (fronto-polar and frontal electrodes), or more easily by eliminating the portion of the signal affected by this artefact using an EMG detection above a certain threshold as a criterion [37].
The use of a wireless amplifier would make it possible to carry out EEG analyses of more complex motor tasks, given the absence of spatial movement constraints.
The use of an amplifier with more than 16 channels could benefit the spatial identification of the origin of the signals.
Author Contributions
Conceptualization: M.I.; methodology: M.I.; software: L.G. and M.I.; validation: M.I.; formal analysis: M.I. and L.G.; investigation: M.I. and L.G.; data curation: M.I. and L.G.; project administration: M.I.; resources: M.I.; writing—original draft preparation: L.G.; writing—review and editing: M.I.; visualisation: M.I. and L.G.; supervision: D.C.; funding acquisition: M.I. All authors have read and agreed to the published version of the manuscript.
Funding
This research was funded by the ISI Foundation’s Lagrange Project for startup research.
Institutional Review Board Statement
All participants gave their written informed consent for inclusion in the study and the publications of results before they participated. The study was conducted in accordance with the Declaration of Helsinki; ethical review and approval were waived for this study due as the participants involved were postgraduate students engaged in educational activities.
Data Availability Statement
The data of the study are available from the corresponding author. The code of the Matlab script used and the OT Biolab software are available at the following links: https://github.com/marcoivaldi/dowsing.git, https://github.com/SPosella/Python-codes.git (accessed on 9 October 2023).
Acknowledgments
M.I. thanks the companies OT Bioelettronica and Spes Medica for providing the tools used for this study and for having supported the experimental phase of the work through the necessary technical support and through the development of the required implementations. Further details, information and technical datasheets relating to the experimental products and the manufacturing companies mentioned in this study are available at the following links: https://otbioelettronica.it/en/publications, https://www.tecnobody.com/en/products/detail/prokin-easy, https://www.graphpad.com/features, https://www.spesmedica.com/en/corporate/. M.I. also thanks Alberto Rainoldi for the support and help in organising the scientific work, Luca Asberto for the valuable suggestions of a linguistic nature and Luca Feletti for the suggestions related to electronic engineering problems.
Conflicts of Interest
The authors declare no conflict of interest.
References
- Friedman, D.; Cycowicz, Y.M.; Gaeta, H. The novelty P3: An event-related brain potential (ERP) sign of the brain’s evaluation of novelty. Neurosci. Biobehav. Rev. 2001, 25, 355–373. [Google Scholar] [CrossRef]
- Gevins, A.; Leong, H.; Smith, M.E.; Le, J.; Du, R. Mapping cognitive brain function with modern high-resolution electroencephalography. Trends Neurosci. 1995, 18, 429–436. [Google Scholar] [CrossRef]
- Davis, G.A.; Iverson, G.L.; Guskiewicz, K.M.; Ptito, A.; Johnston, K.M. Contributions of neuroimaging, balance testing, electrophysiology and blood markers to the assessment of sport-related concussion. Br. J. Sports Med. 2009, 43 (Suppl. S1), i36–i45. [Google Scholar] [CrossRef]
- Ivaldi, M.; Cugliari, G.; Fiorenti, E.; Rainoldi, A. Delta and alpha rhythms are modulated by the physical movement knowledge in acrobatic gymnastics: An EEG study in visual context. Sport Sci. Health 2018, 14, 563–569. [Google Scholar] [CrossRef]
- Ivaldi, M.; Cugliari, G.; Peracchione, S.; Rainoldi, A. Familiarity affects electrocortical power spectra during dance imagery, listening to different music genres: Independent component analysis of Alpha and Beta rhythms. Sport Sci. Health 2017, 13, 535–548. [Google Scholar] [CrossRef]
- Stuart, S.; Vitorio, R.; Morris, R.; Martini, D.N.; Fino, P.C.; Mancini, M. Cortical activity during walking and balance tasks in older adults and in people with Parkinson’s disease: A structured review. Maturitas 2018, 113, 53–72. [Google Scholar] [CrossRef]
- Purohit, R.; Bhatt, T. Mobile Brain Imaging to Examine Task-Related Cortical Correlates of Reactive Balance: A Systematic Review. Brain Sci. 2022, 12, 1487. [Google Scholar] [CrossRef]
- Thuraisingham, R.A.; Tran, Y.; Boord, P.; Craig, A. Analysis of eyes open, eye closed EEG signals using second-order difference plot. Med. Biol. Eng. Comput. 2007, 45, 1243–1249. [Google Scholar] [CrossRef]
- Pirini, M.; Mancini, M.; Farella, E.; Chiari, L. EEG correlates of postural audio-biofeedback. Hum. Mov. Sci. 2011, 30, 249–261. [Google Scholar] [CrossRef]
- Del Percio, C.; Babiloni, C.; Marzano, N.; Iacoboni, M.; Infarinato, F.; Vecchio, F.; Lizio, R.; Aschieri, P.; Fiore, A.; Toràn, G.; et al. “Neural efficiency” of athletes’ brain for upright standing: A high-resolution EEG study. Brain Res. Bull. 2009, 79, 193–200. [Google Scholar] [CrossRef] [PubMed]
- Kahya, M.; Liao, K.; Gustafson, K.M.; Akinwuntan, A.E.; Manor, B.; Devos, H. Cortical Correlates of Increased Postural Task Difficulty in Young Adults: A Combined Pupillometry and EEG Study. Sensors 2022, 22, 5594. [Google Scholar] [CrossRef]
- Edwards, A.E.; Guven, O.; Furman, M.D.; Arshad, Q.; Bronstein, A.M. Electroencephalographic Correlates of Continuous Postural Tasks of Increasing Difficulty. Neuroscience 2018, 395, 35–48. [Google Scholar] [CrossRef] [PubMed]
- Goh, K.L.; Morris, S.; Lee, W.L.; Ring, A.; Tan, T. Postural and cortical responses following visual occlusion in standing and sitting tasks. Exp. Brain Res. 2017, 235, 1875–1884. [Google Scholar] [CrossRef]
- Hülsdünker, T.; Mierau, A.; Neeb, C.; Kleinöder, H.; Strüder, H.K. Cortical processes associated with continuous balance control as revealed by EEG spectral power. Neurosci. Lett. 2015, 592, 1–5. [Google Scholar] [CrossRef] [PubMed]
- Whitney, Z.B.; Jain, M.; Jozsa, F.; Zito, P.M. Anatomy, Skin, Superficial Musculoaponeurotic System (SMAS) Fascia. In StatPearls [Internet]; StatPearls Publishing: Treasure Island, FL, USA, 2023. Available online: https://www.ncbi.nlm.nih.gov/books/NBK519014/ (accessed on 14 January 2023).
- Acharya, J.N.; Acharya, V.J. Overview of EEG Montages and Principles of Localization. J. Clin. Neurophysiol. 2019, 36, 325–329. [Google Scholar] [CrossRef] [PubMed]
- Scotton, C.; Grosso, G.; Ferraris, L.; Caire, M.; Pizzigalli, L. Postural analysis contribution in handstand position. Med. Dello Sport 2015, 68, 303–311. [Google Scholar]
- Pizzigalli, L.; Ahmaidi, S.; Rainoldi, A. Effects of sedentary condition and longterm physical activity on postural balance and strength responses in elderly subjects. Sport Sci. Health 2014, 10, 135–141. [Google Scholar] [CrossRef]
- de Oliveira, J.M. Statokinesigram normalization method. Behav. Res. Methods 2017, 49, 310–317. [Google Scholar] [CrossRef]
- Delorme, A.; Makeig, S. EEGLAB: An open-source toolbox for analysis of single-trial EEG dynamics. J. Neurosci. Methods 2004, 134, 9–21. [Google Scholar] [CrossRef]
- Appling, D.R. Software Review of Prism 5 Prism 5. J. Am. Chem. Soc. 2008, 130, 6056. [Google Scholar] [CrossRef]
- Motulsky, H.J. Prism 5 statistics guide, 2007. GraphPad Softw. 2007, 31, 39–42. [Google Scholar]
- Liao, H.; Tang, M.; Luo, L.; Li, C.; Chiclana, F.; Zeng, X.-J. A bibliometric analysis and visualization of medical big data research. Sustainability 2018, 10, 166. [Google Scholar] [CrossRef]
- Widmann, A.; Schröger, E. Filter effects and filter artifacts in the analysis of electrophysiological data. Front. Psychol. 2012, 3, 233. [Google Scholar] [CrossRef] [PubMed]
- Wȩsierski, D.; Rufuie, M.R.; Milczarek, O.; Ziembla, W.; Ogniewski, P.; Kołodziejak, A.; Niedbalski, P. Rating by detection: An artifact detection protocol for rating EEG quality with average event duration. J. Neural Eng. 2023, 20, 026020. [Google Scholar] [CrossRef]
- Lazurenko, D.; Shepelev, I.; Shaposhnikov, D.; Saevskiy, A.; Kiroy, V. Discriminative frequencies and temporal EEG segmentation in the motor imagery classification approach. Appl. Sci. 2022, 12, 2736. [Google Scholar] [CrossRef]
- Cugliari, G.; Ivaldi, M. Multivariate Statistical Analysis in Neuroscience: Advanced Mathematical Modeling Applied to Electroencephalographic Signals in Complex Data Problems; Grin Verlag: Munich, Germany, 2015. [Google Scholar]
- Cugliari, G.; Ivaldi, M. Data Science in Neuroscience: A Review of The EEG Analytical Workflow. Res. Investig. Sports Med. 2020, 6, 486–488. [Google Scholar] [CrossRef]
- Kawachi, J. Brodmann Areas 17, 18, and 19 in the Human Brain: An Overview. Brain Nerve. 2017, 69, 397–410. (In Japanese) [Google Scholar] [CrossRef]
- Zilles, K.; Amunts, K. Centenary of Brodmann’s map—Conception and fate. Nat. Rev. Neurosci. 2010, 11, 139–145. [Google Scholar] [CrossRef]
- Manto, M.; Bower, J.M.; Conforto, A.B.; Delgado-García, J.M.; da Guarda, S.N.; Gerwig, M.; Habas, C.; Hagura, N.; Ivry, R.B.; Mariën, P.; et al. Consensus paper: Roles of the cerebellum in motor control--the diversity of ideas on cerebellar involvement in movement. Cerebellum 2012, 11, 457–487. [Google Scholar] [CrossRef]
- Bosch, T.J.; Kammermeier, S.; Groth, C.; Leedom, M.; Hanson, E.K.; Berg-Poppe, P.; Singh, A. Cortical and Cerebellar Oscillatory Responses to Postural Instability in Parkinson’s Disease. Front. Neurol. 2021, 12, 752271. [Google Scholar] [CrossRef]
- Chouinard, P.A.; Paus, T. The primary motor and premotor areas of the human cerebral cortex. Neuroscientist 2006, 12, 143–152. [Google Scholar] [CrossRef] [PubMed]
- Sherman, D.A.; Lehmann, T.; Baumeister, J.; Grooms, D.R.; Norte, G.E. Somatosensory perturbations influence cortical activity associated with single-limb balance performance. Exp. Brain Res. 2022, 240, 407–420. [Google Scholar] [CrossRef] [PubMed]
- Rubega, M.; Di Marco, R.; Zampini, M.; Formaggio, E.; Menegatti, E.; Bonato, P.; Masiero, S.; Del Felice, A. Muscular and cortical activation during dynamic and static balance in the elderly: A scoping review. Aging Brain. 2021, 1, 100013. [Google Scholar] [CrossRef] [PubMed]
- Zhou, W.; Gotman, J. Removal of EMG and ECG artifacts from EEG based on wavelet transform and ICA. In Proceedings of the 26th Annual International Conference of the IEEE Engineering in Medicine and Biology Society, San Francisco, CA, USA, 1–5 September 2004; IEEE: New York, NY, USA, 2004; Volume 1, pp. 392–395. [Google Scholar]
- Ivaldi, M.; Pretari, F.; Cugliari, G. Electrocortical activity during stretch reflex in athletes. Sport Sci. Health 2018, 14, 625–631. [Google Scholar] [CrossRef]
Figure 1.
Detail of the experimental cap. Notice the introduction of the conductive gel into the electrode in the neoprene jacket.
Figure 1.
Detail of the experimental cap. Notice the introduction of the conductive gel into the electrode in the neoprene jacket.
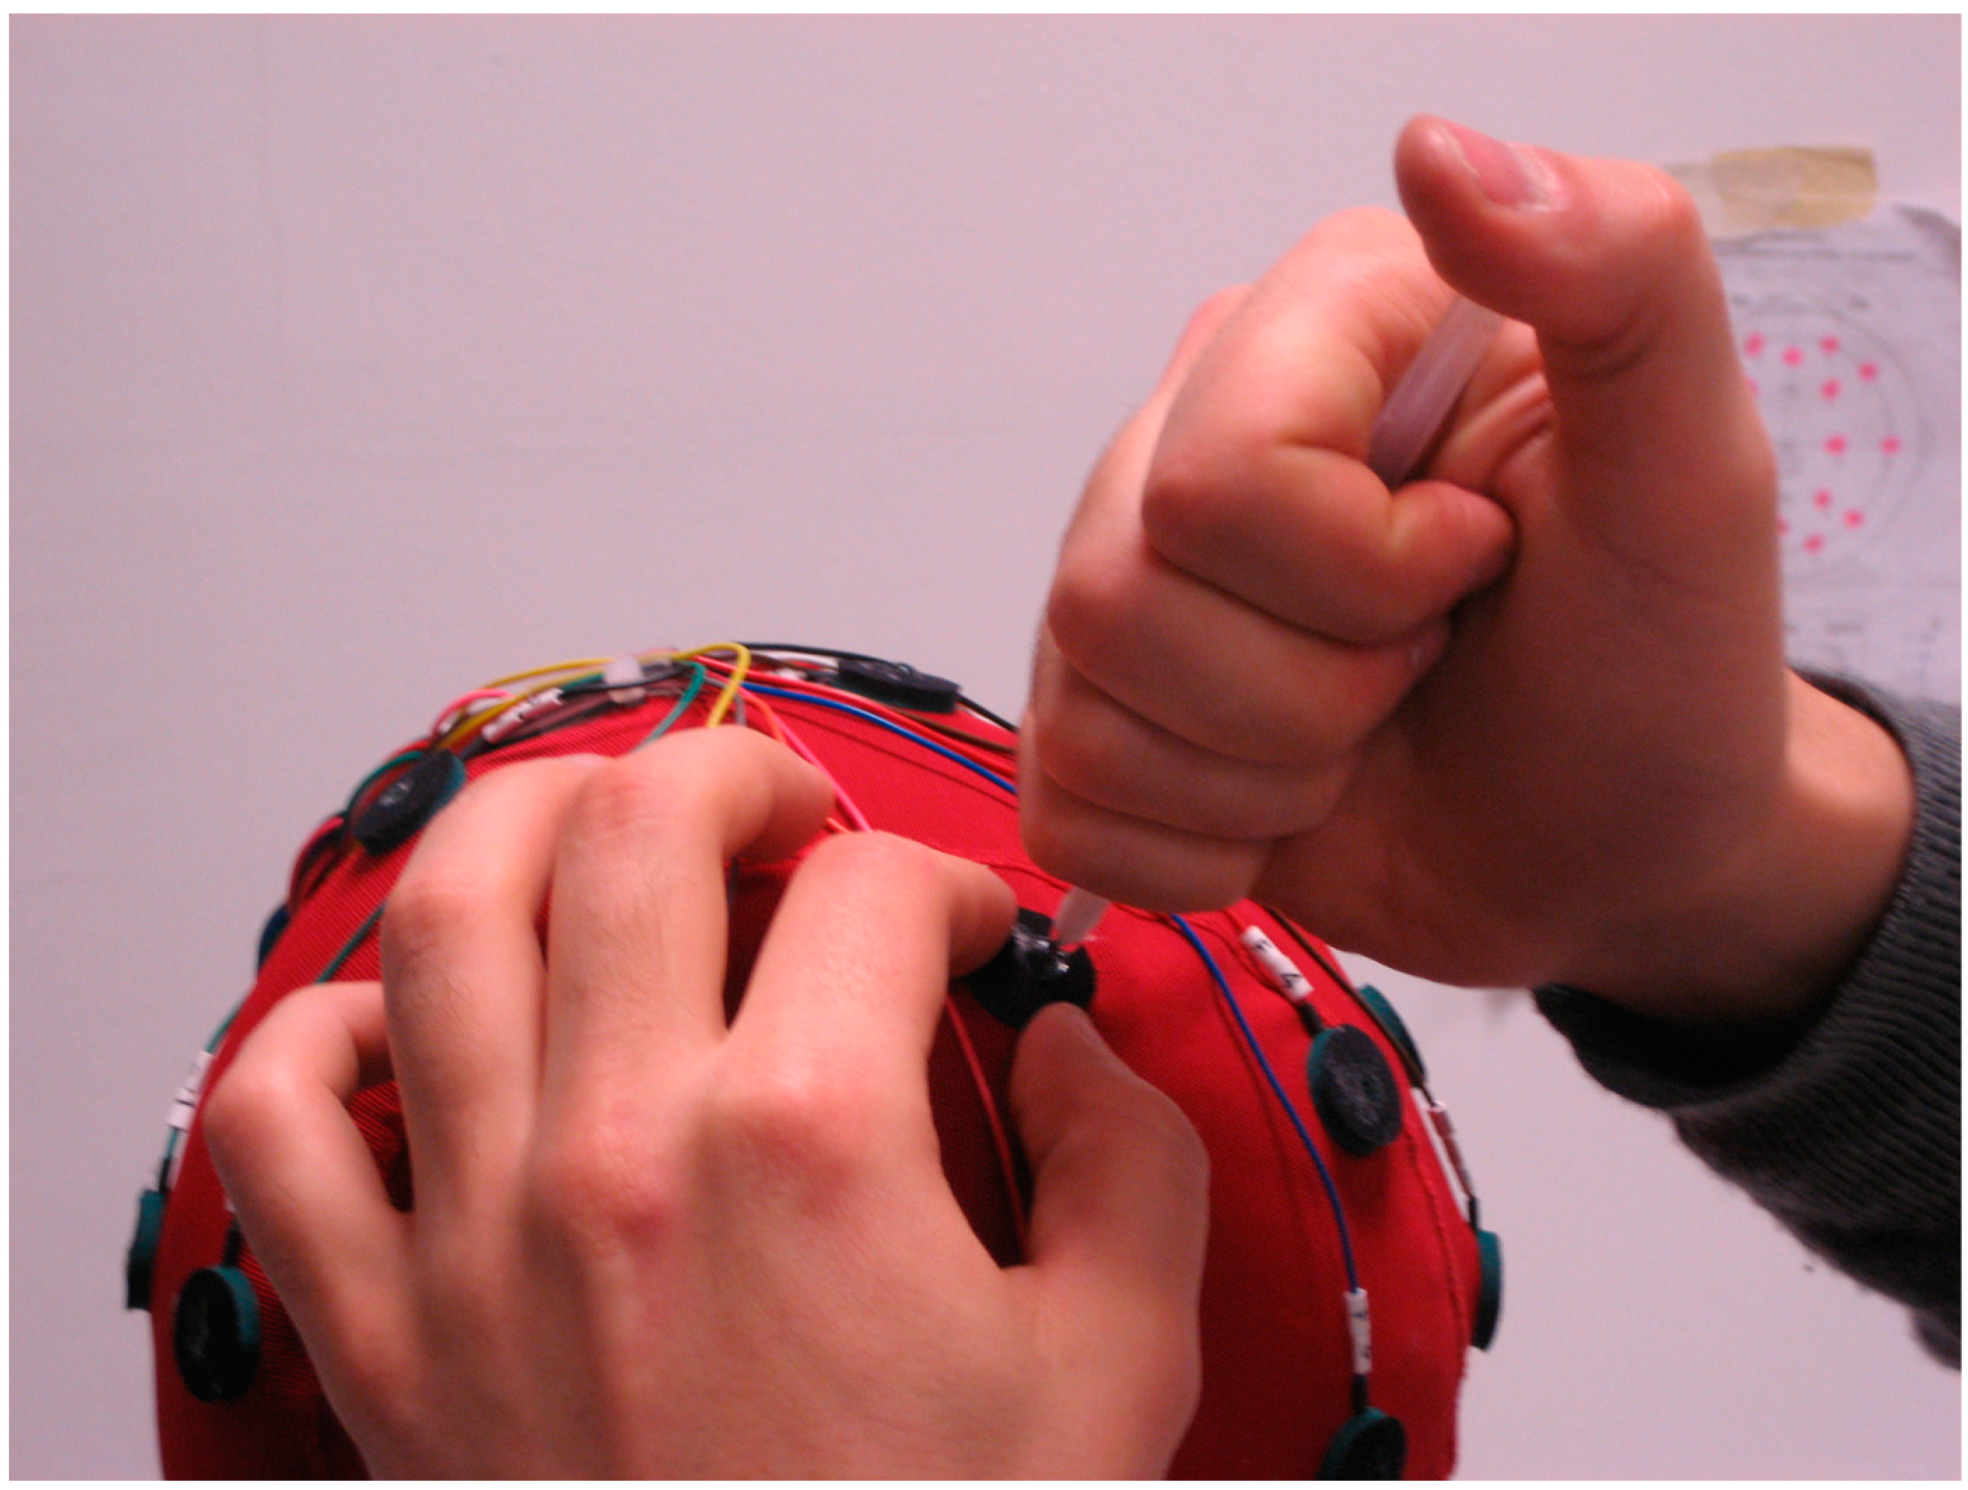
Figure 2.
Representative diagram of the construction of the experimental electrode.

Figure 3.
Electrode placement in accordance with the 10–20 system.
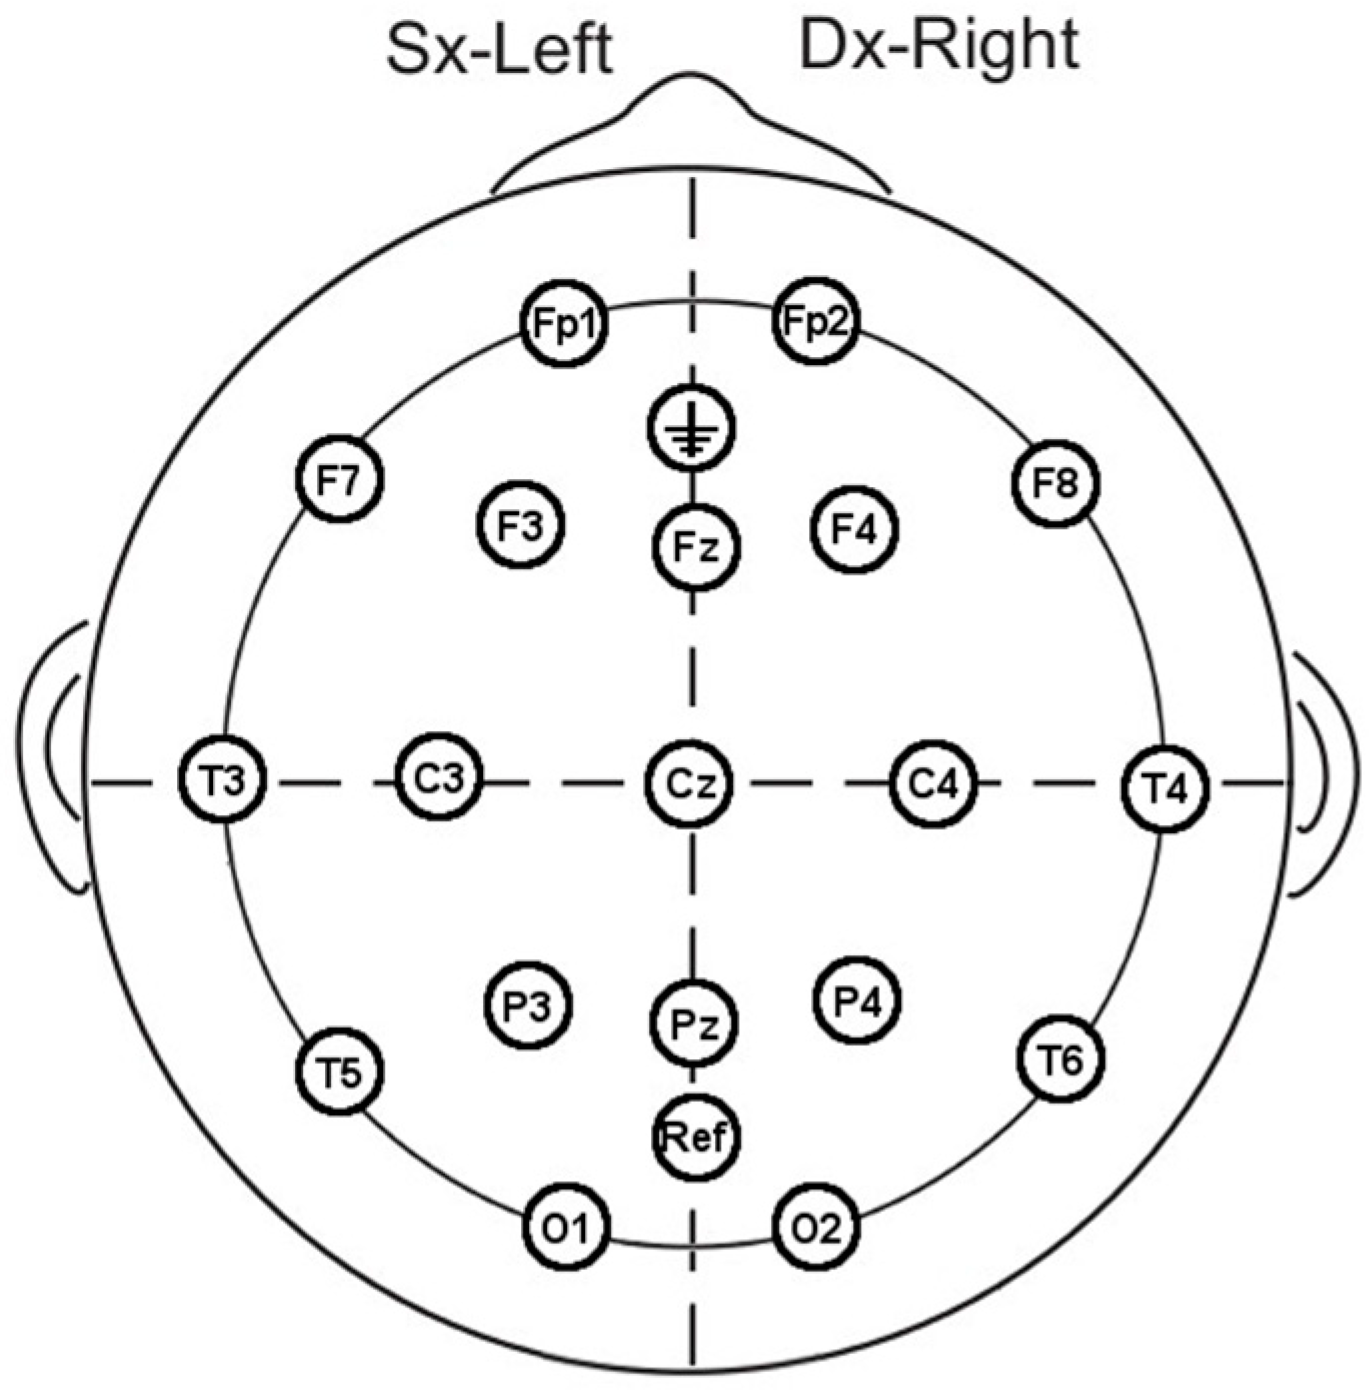
Figure 4.
Example of bipodalic posture performed on the stabilometric platform.
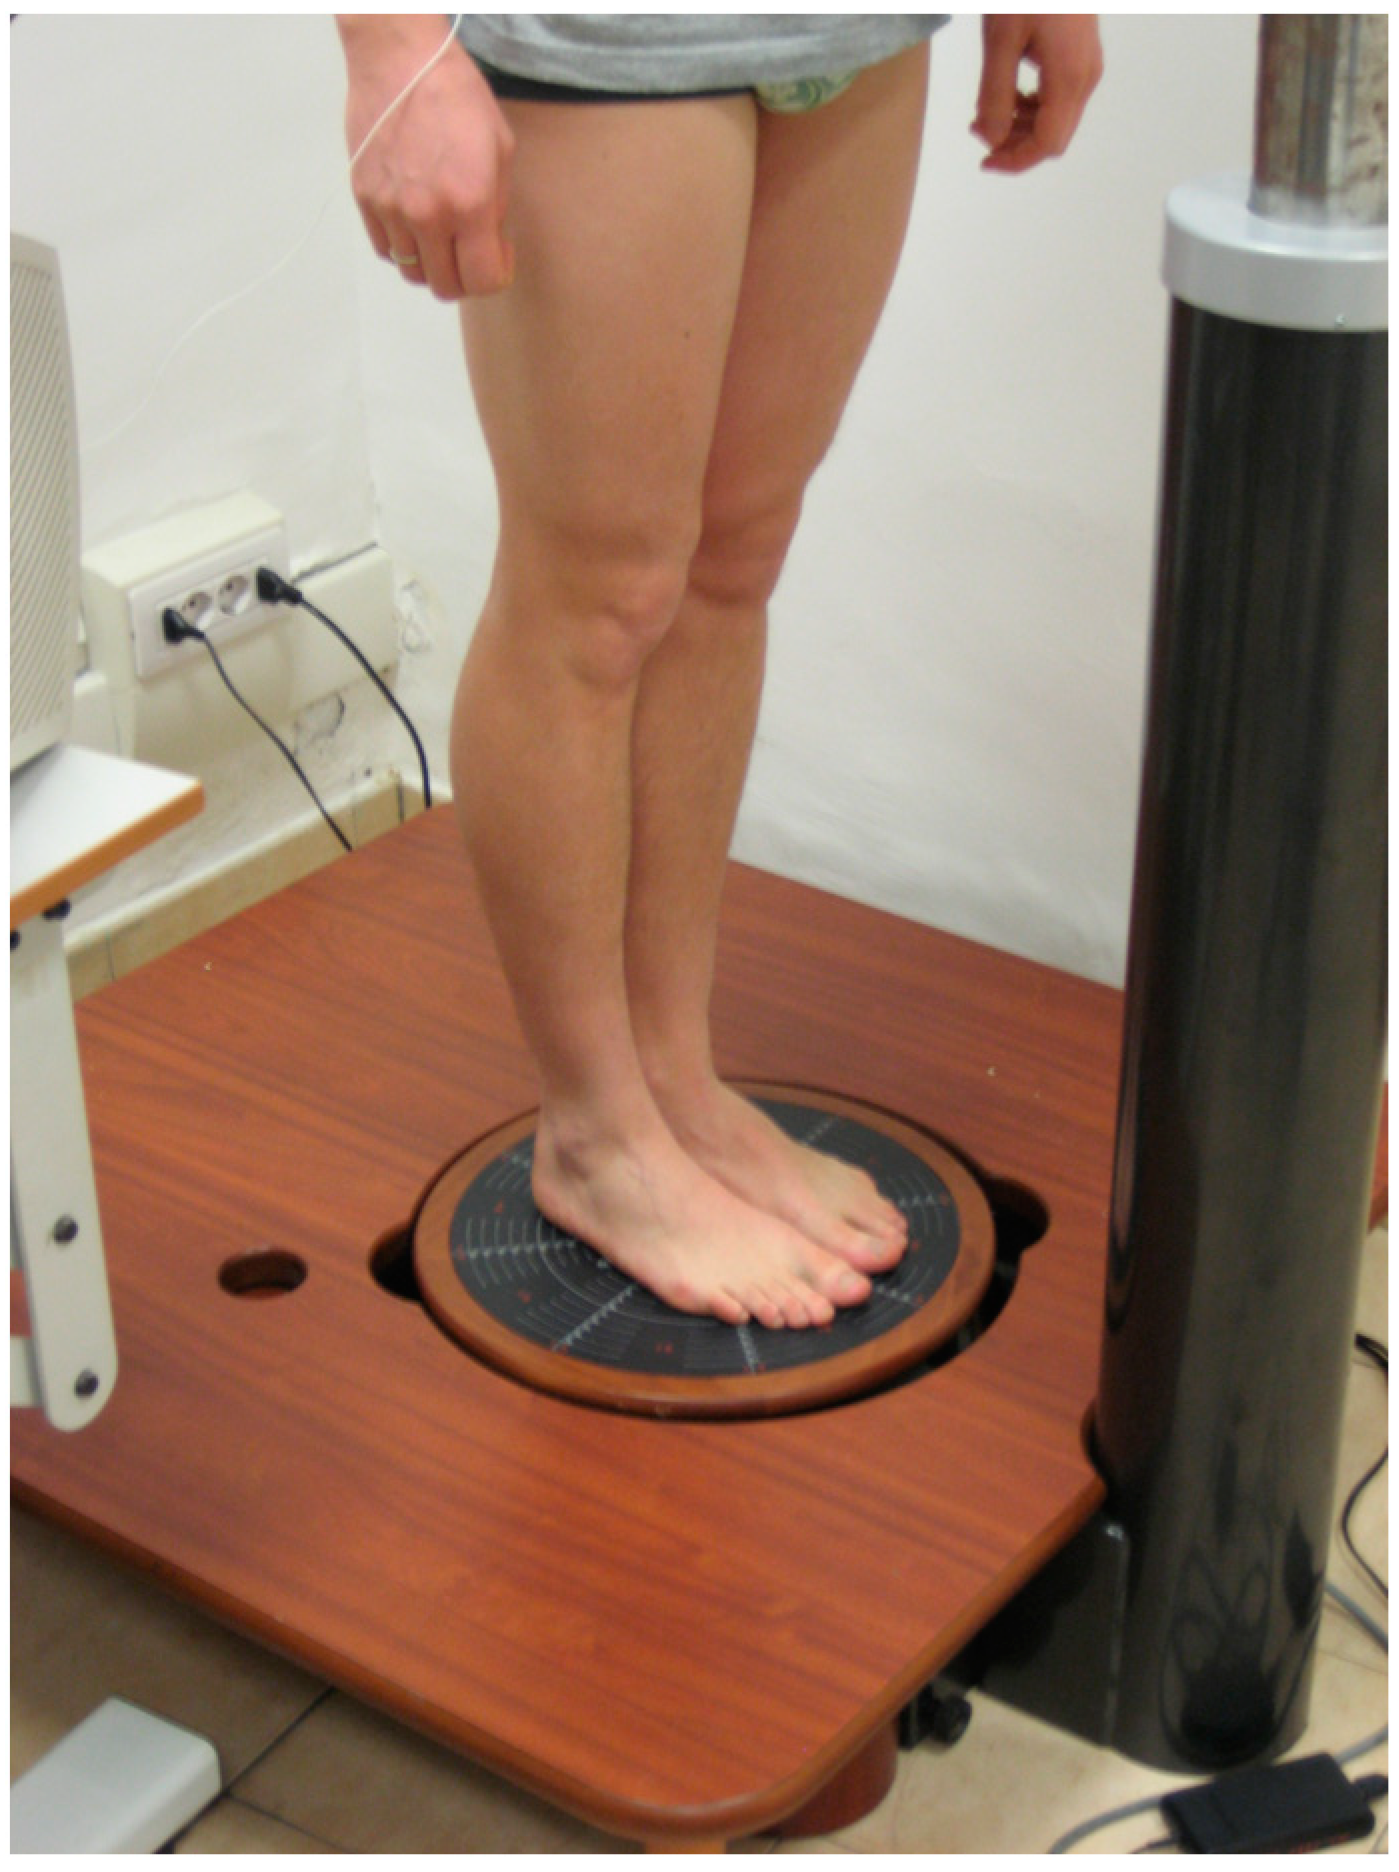
Figure 5.
Seated eyes−closed (OC) task frequency spectrum example (frequency domain).
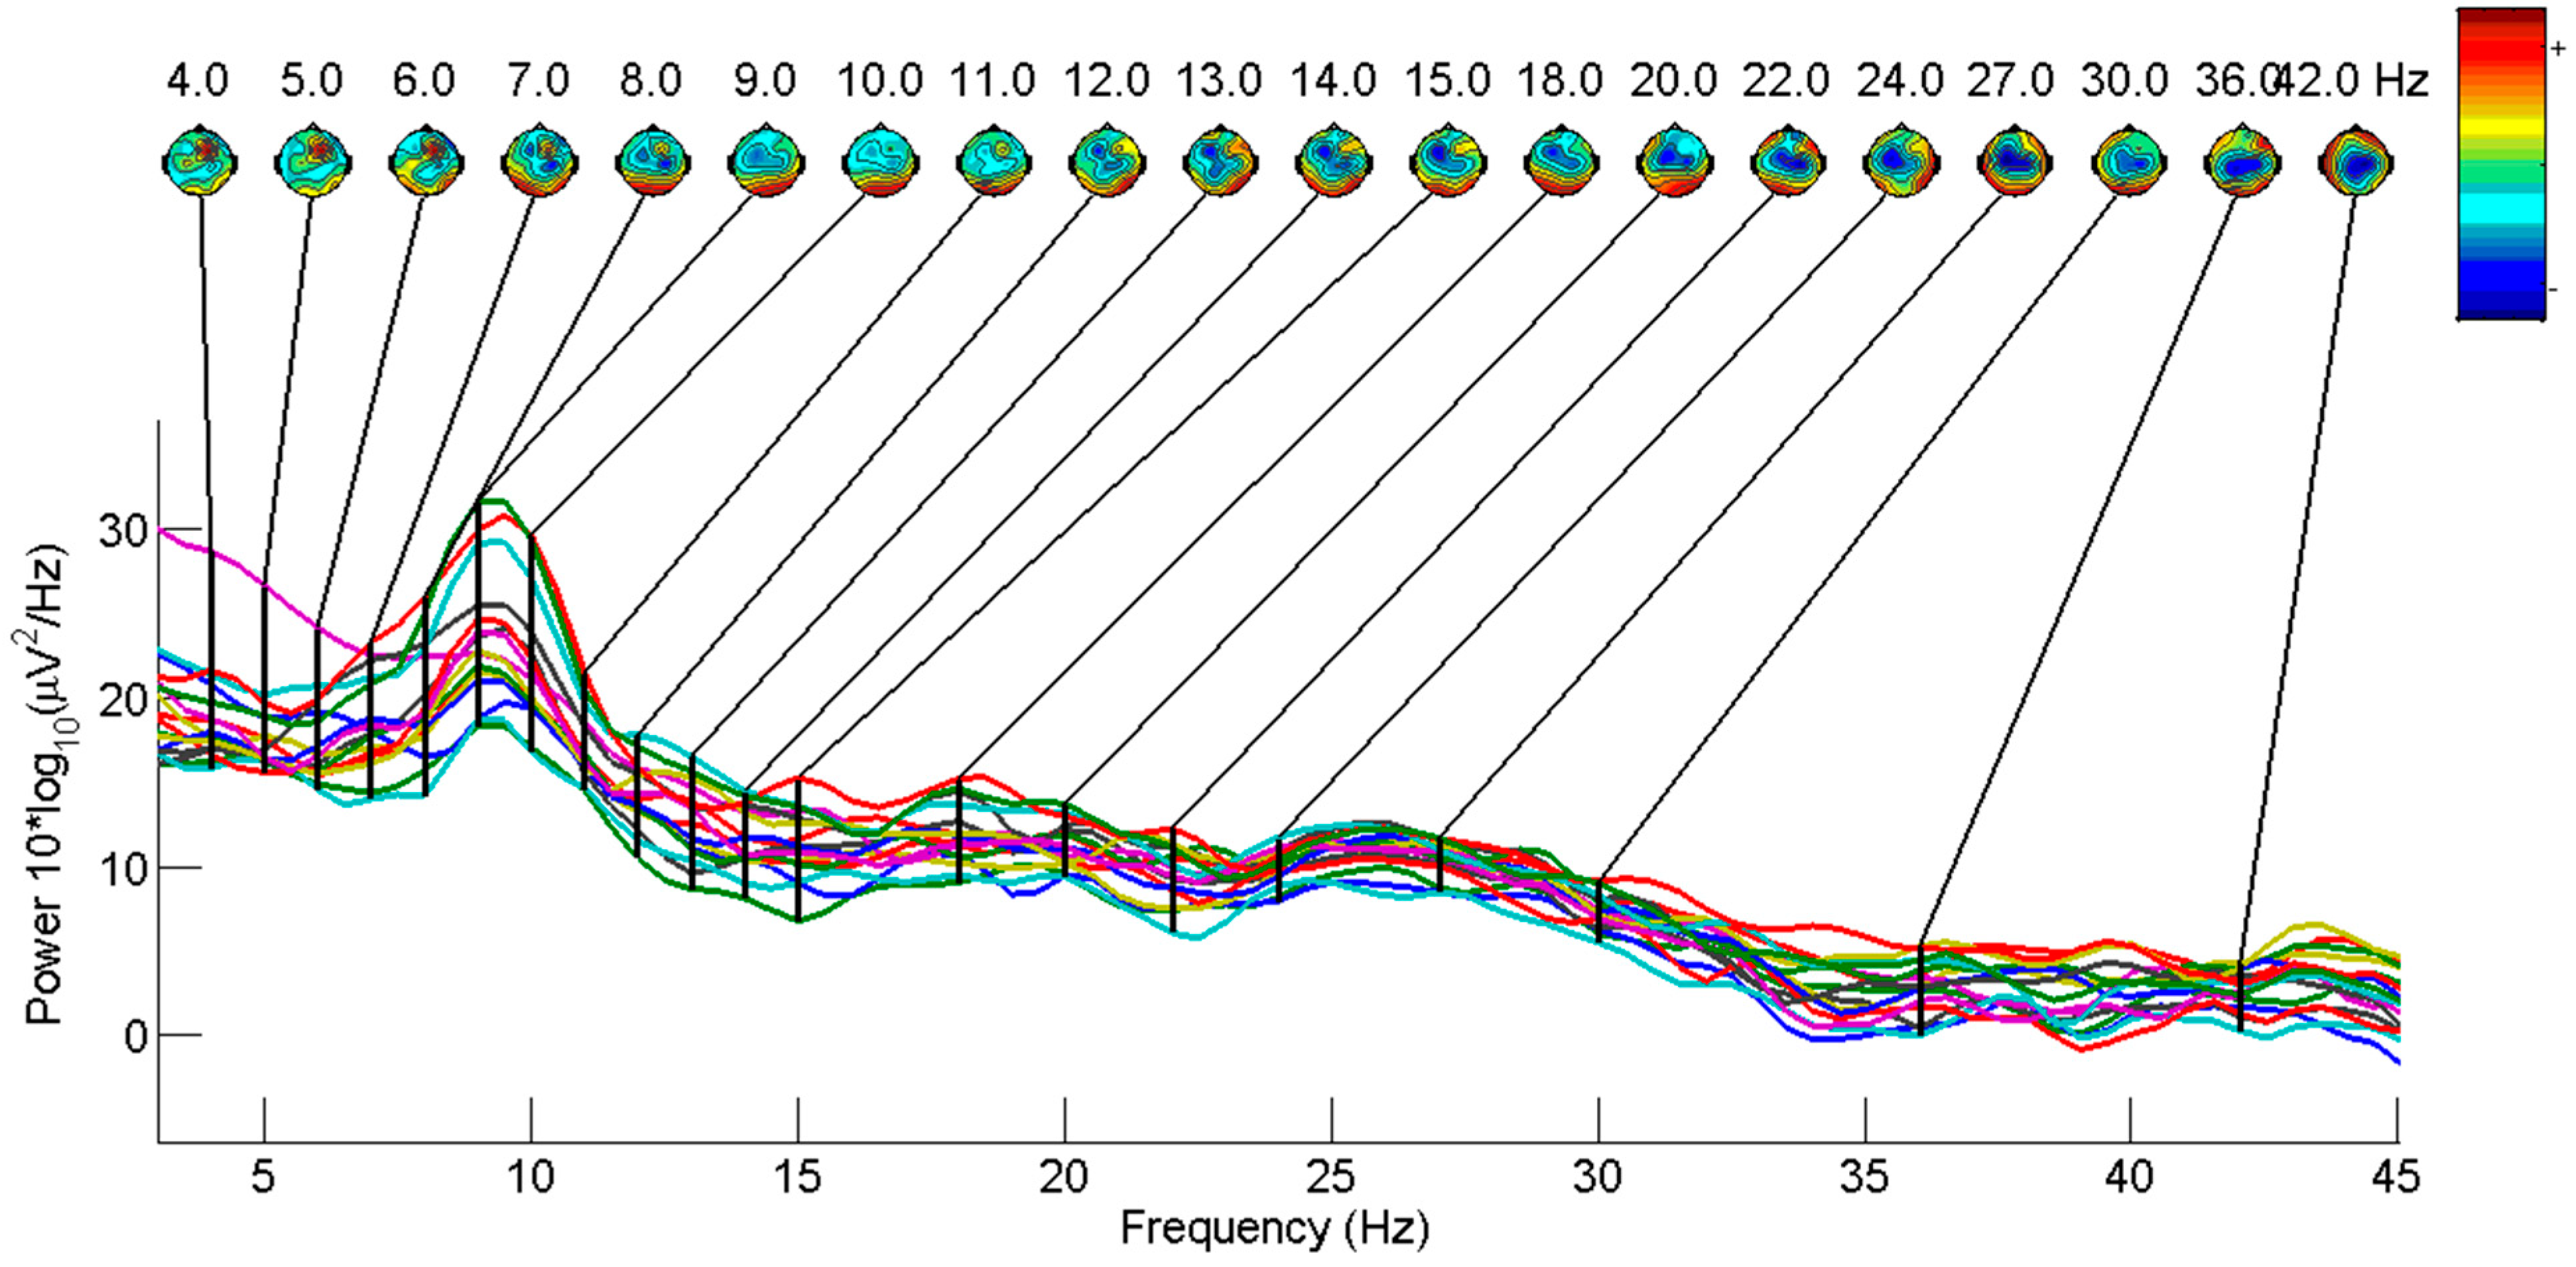
Figure 6.
Seated eyes−open (OA) task frequency spectrum example (frequency domain).
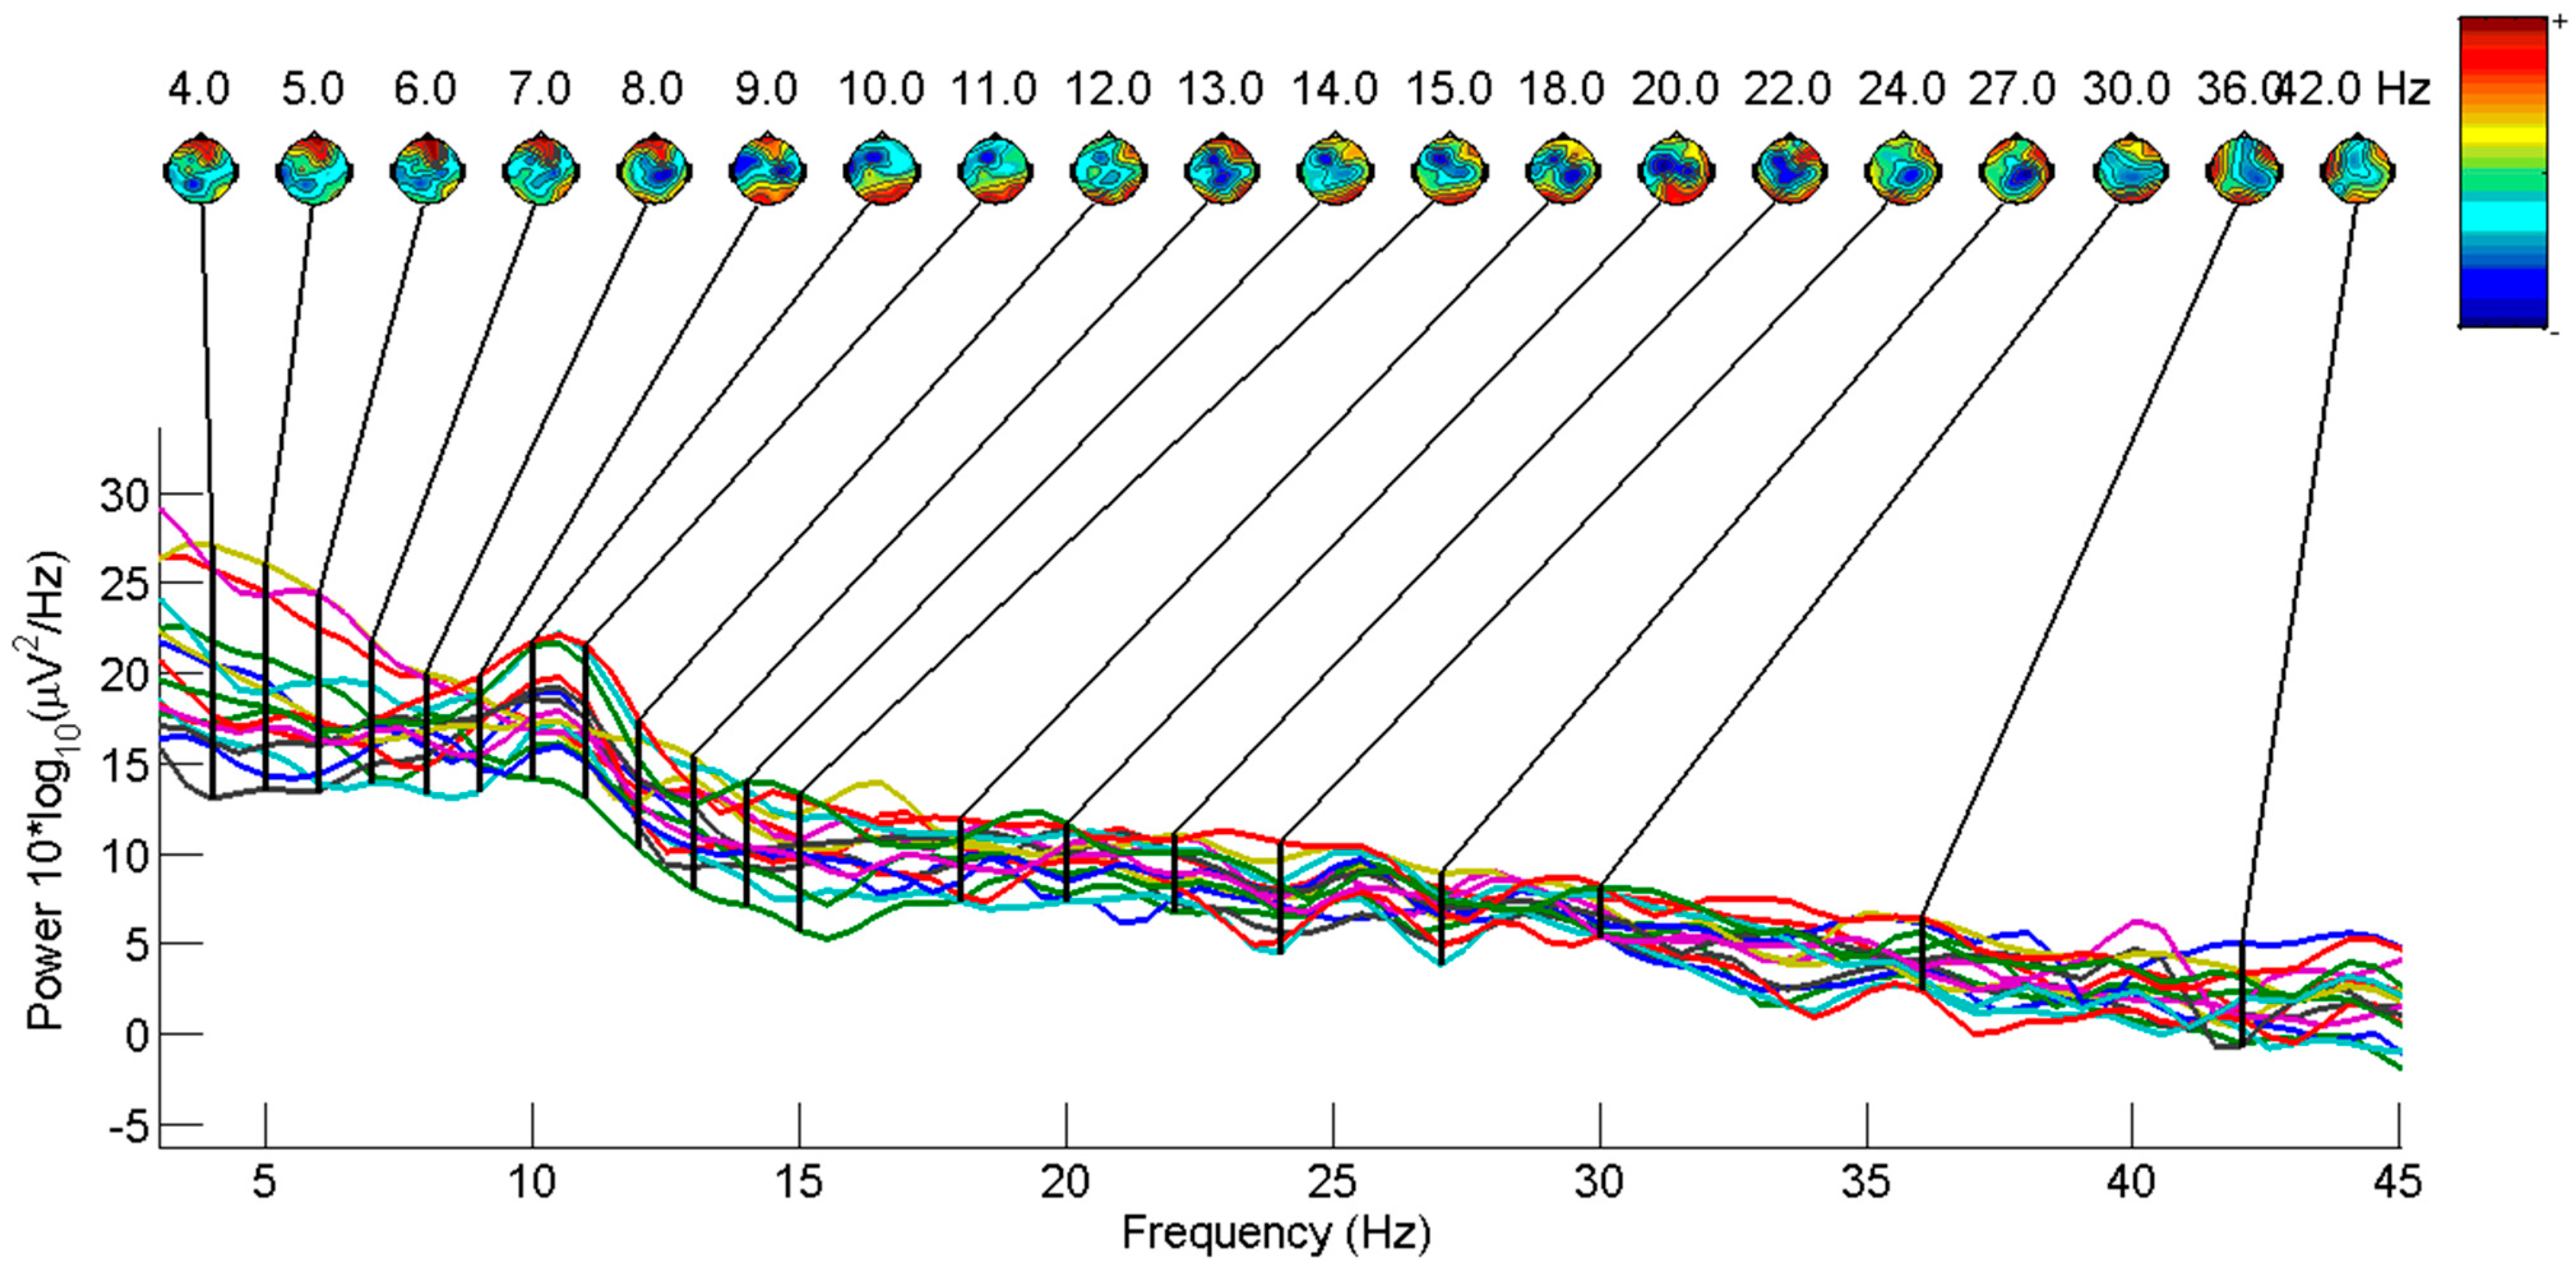
Figure 7.
(a,b) Significance between OA and OC in alpha band and beta band (ARV).

Figure 8.
(a,b) Significance between BIPOA and BIPOC in alpha band and beta band (ARV).
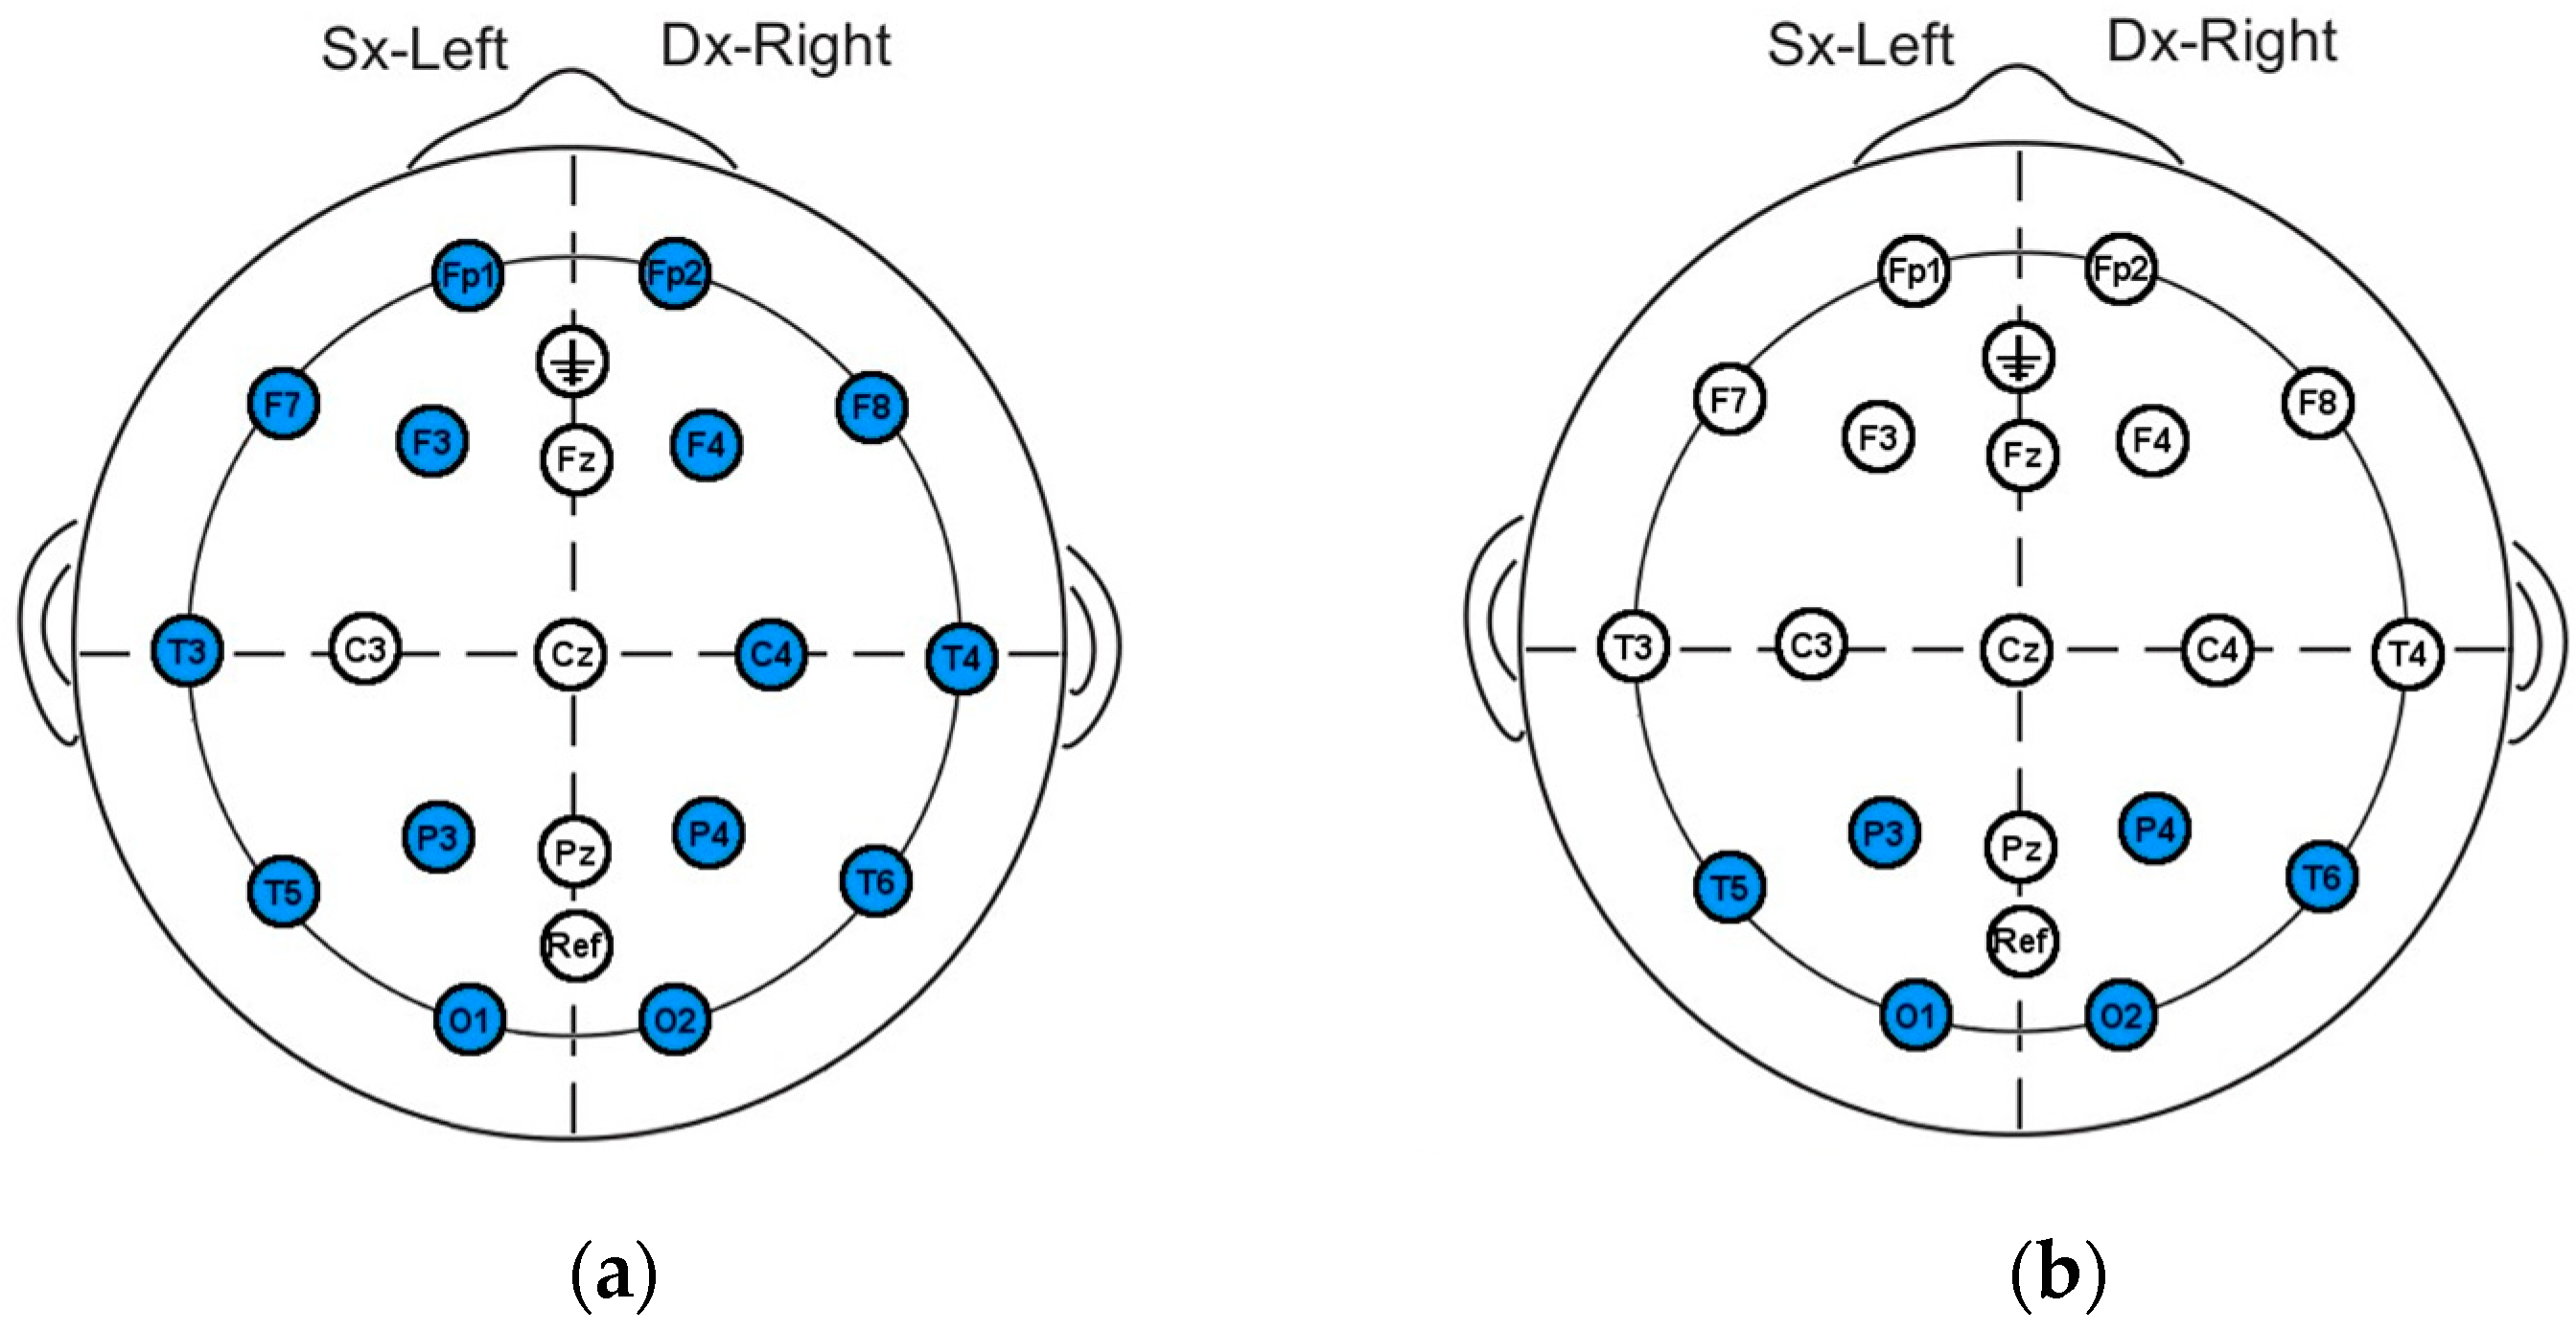
Figure 9.
(a,b) Significance between MONOA and MONOC in alpha band and beta band (ARV).
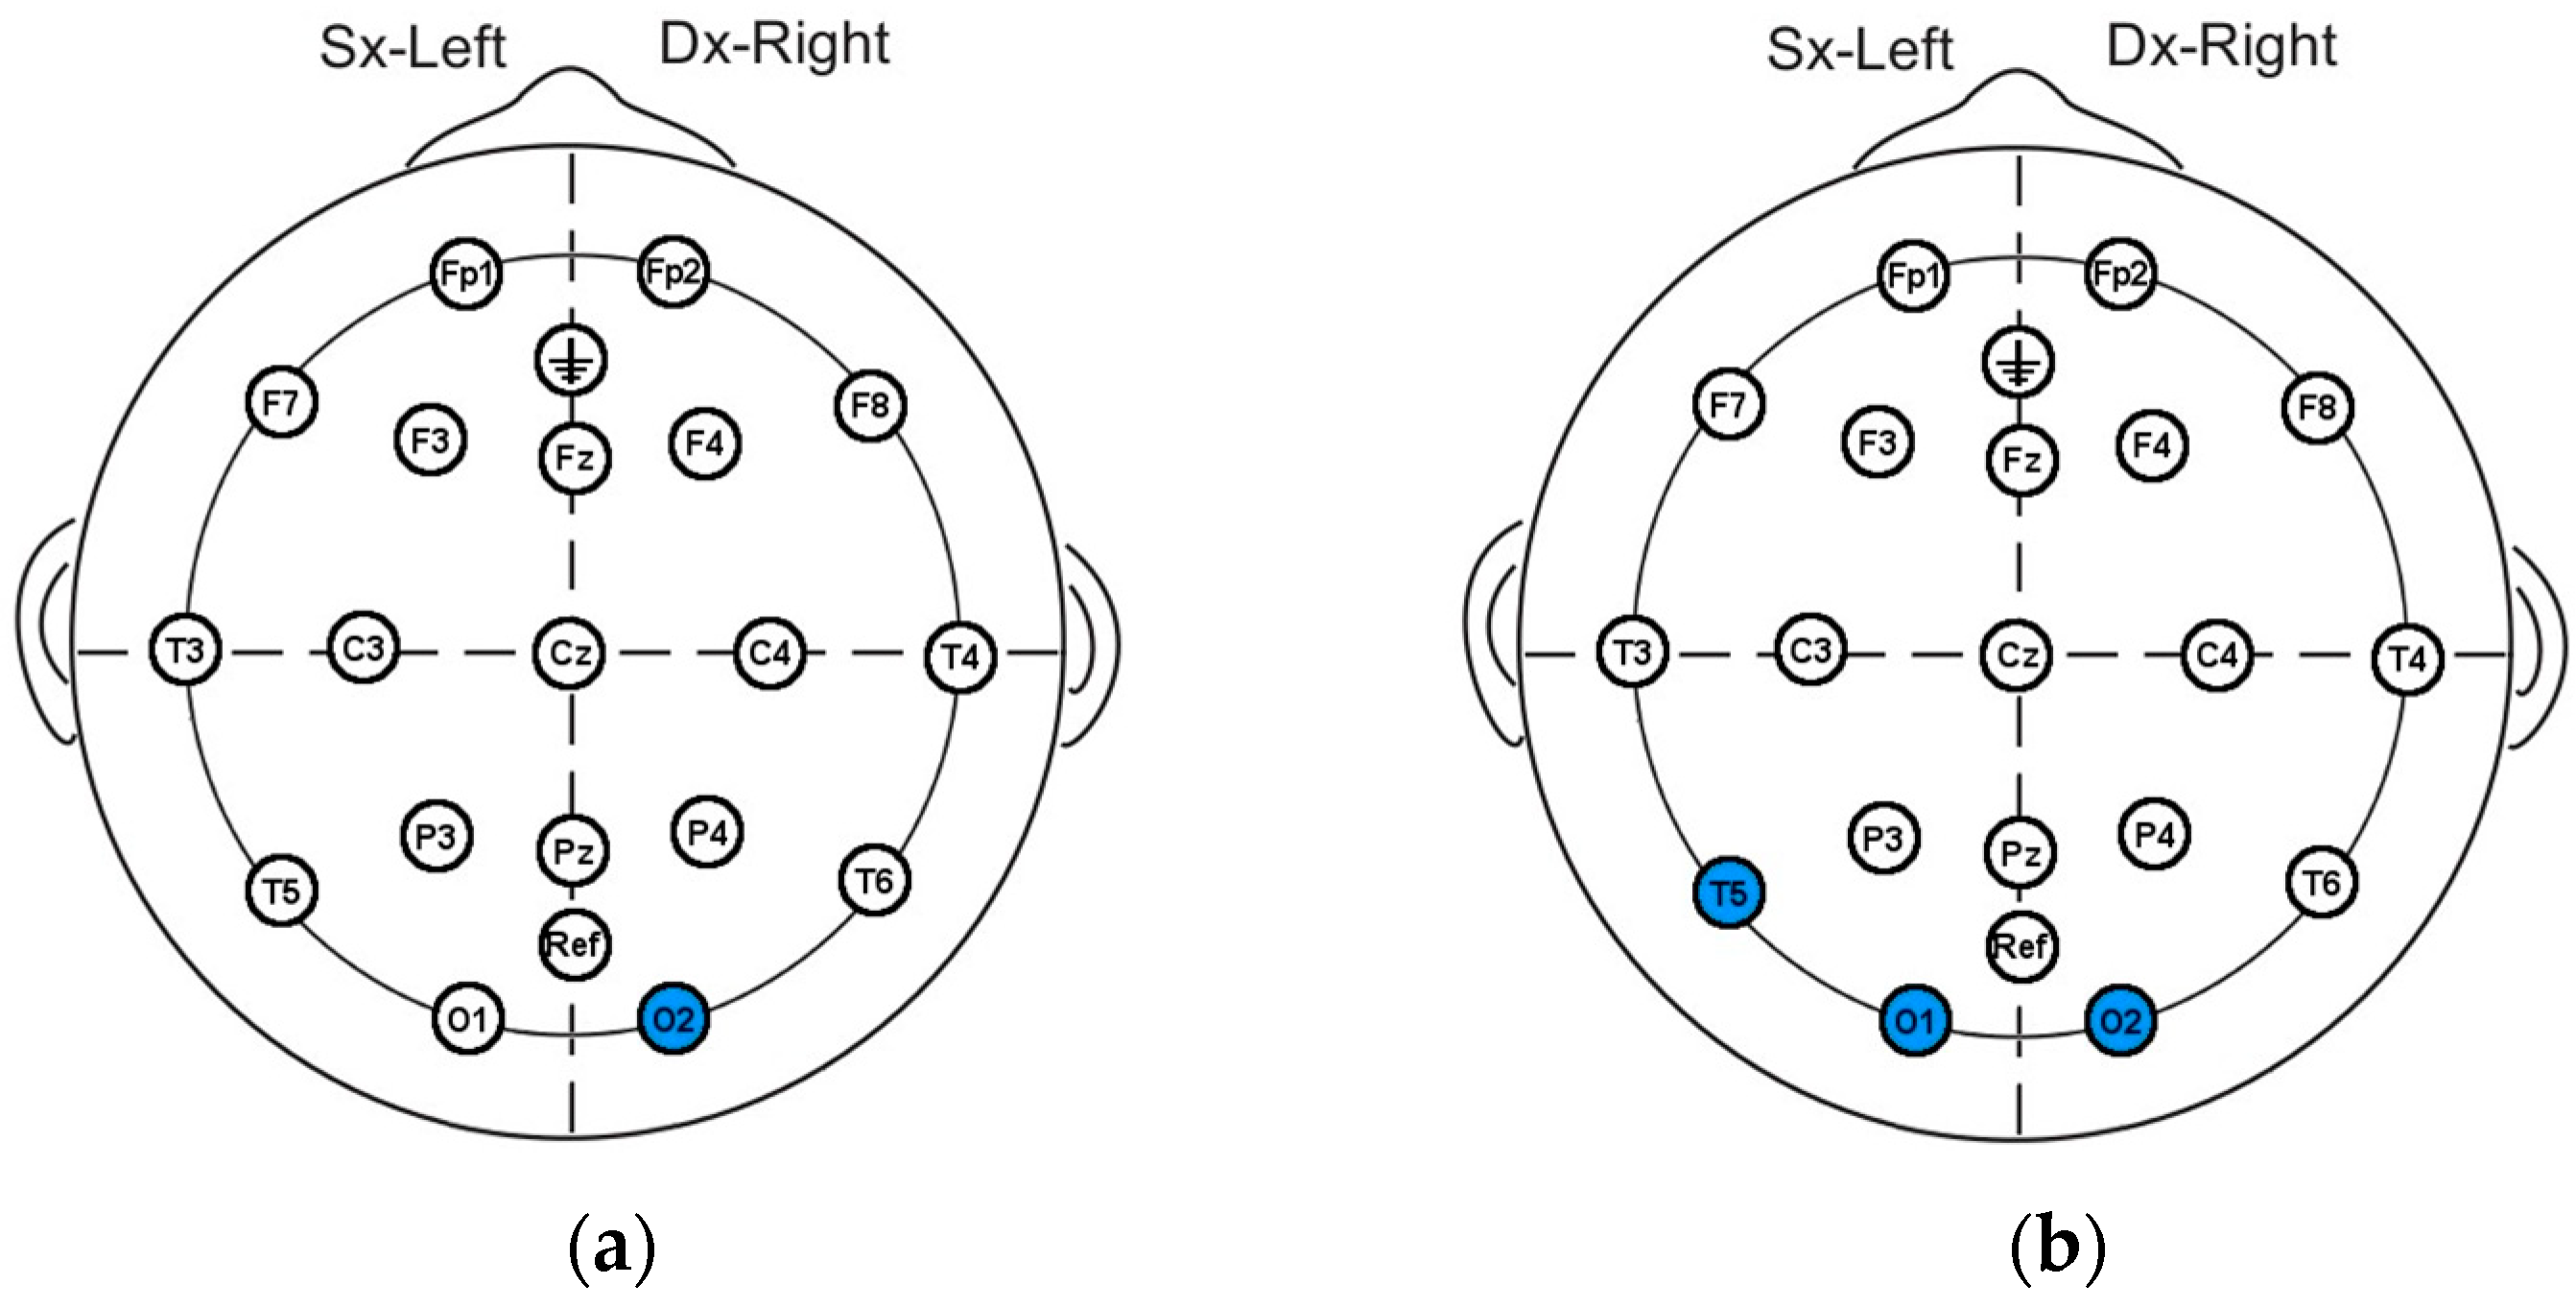
Figure 10.
(a,b) Significance between OA and OC in alpha band and beta band (PSD).
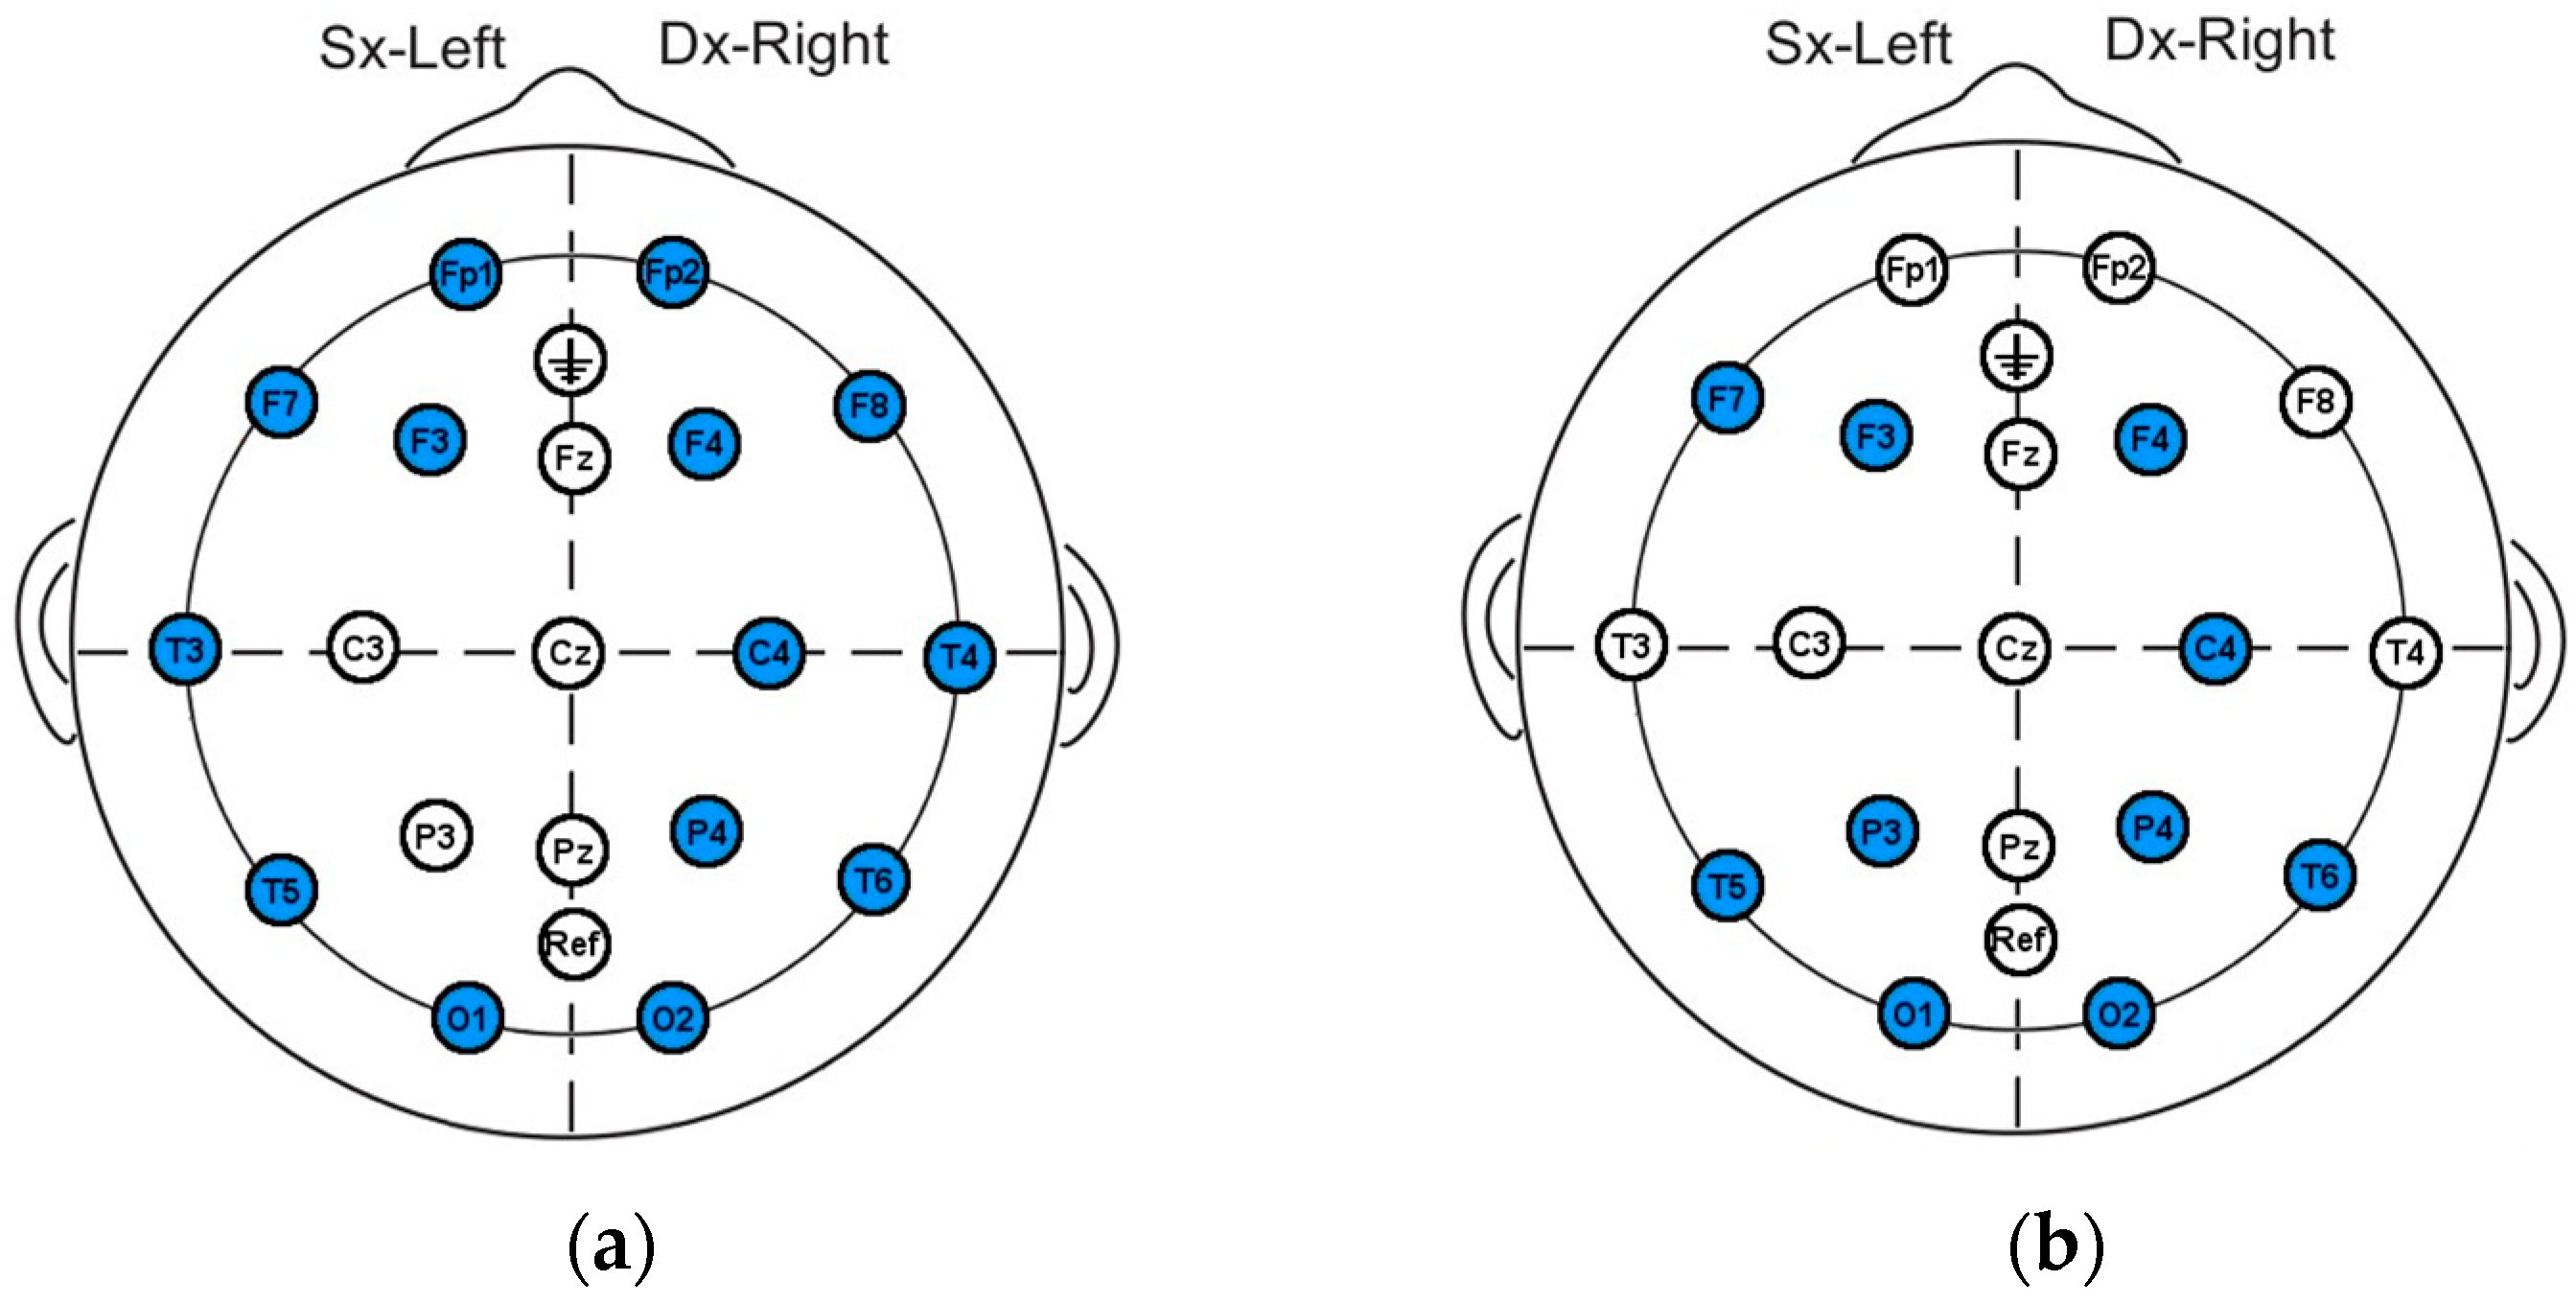
Figure 11.
(a,b) Significance between BIPOA and BIPOC in alpha band and beta band (PSD).
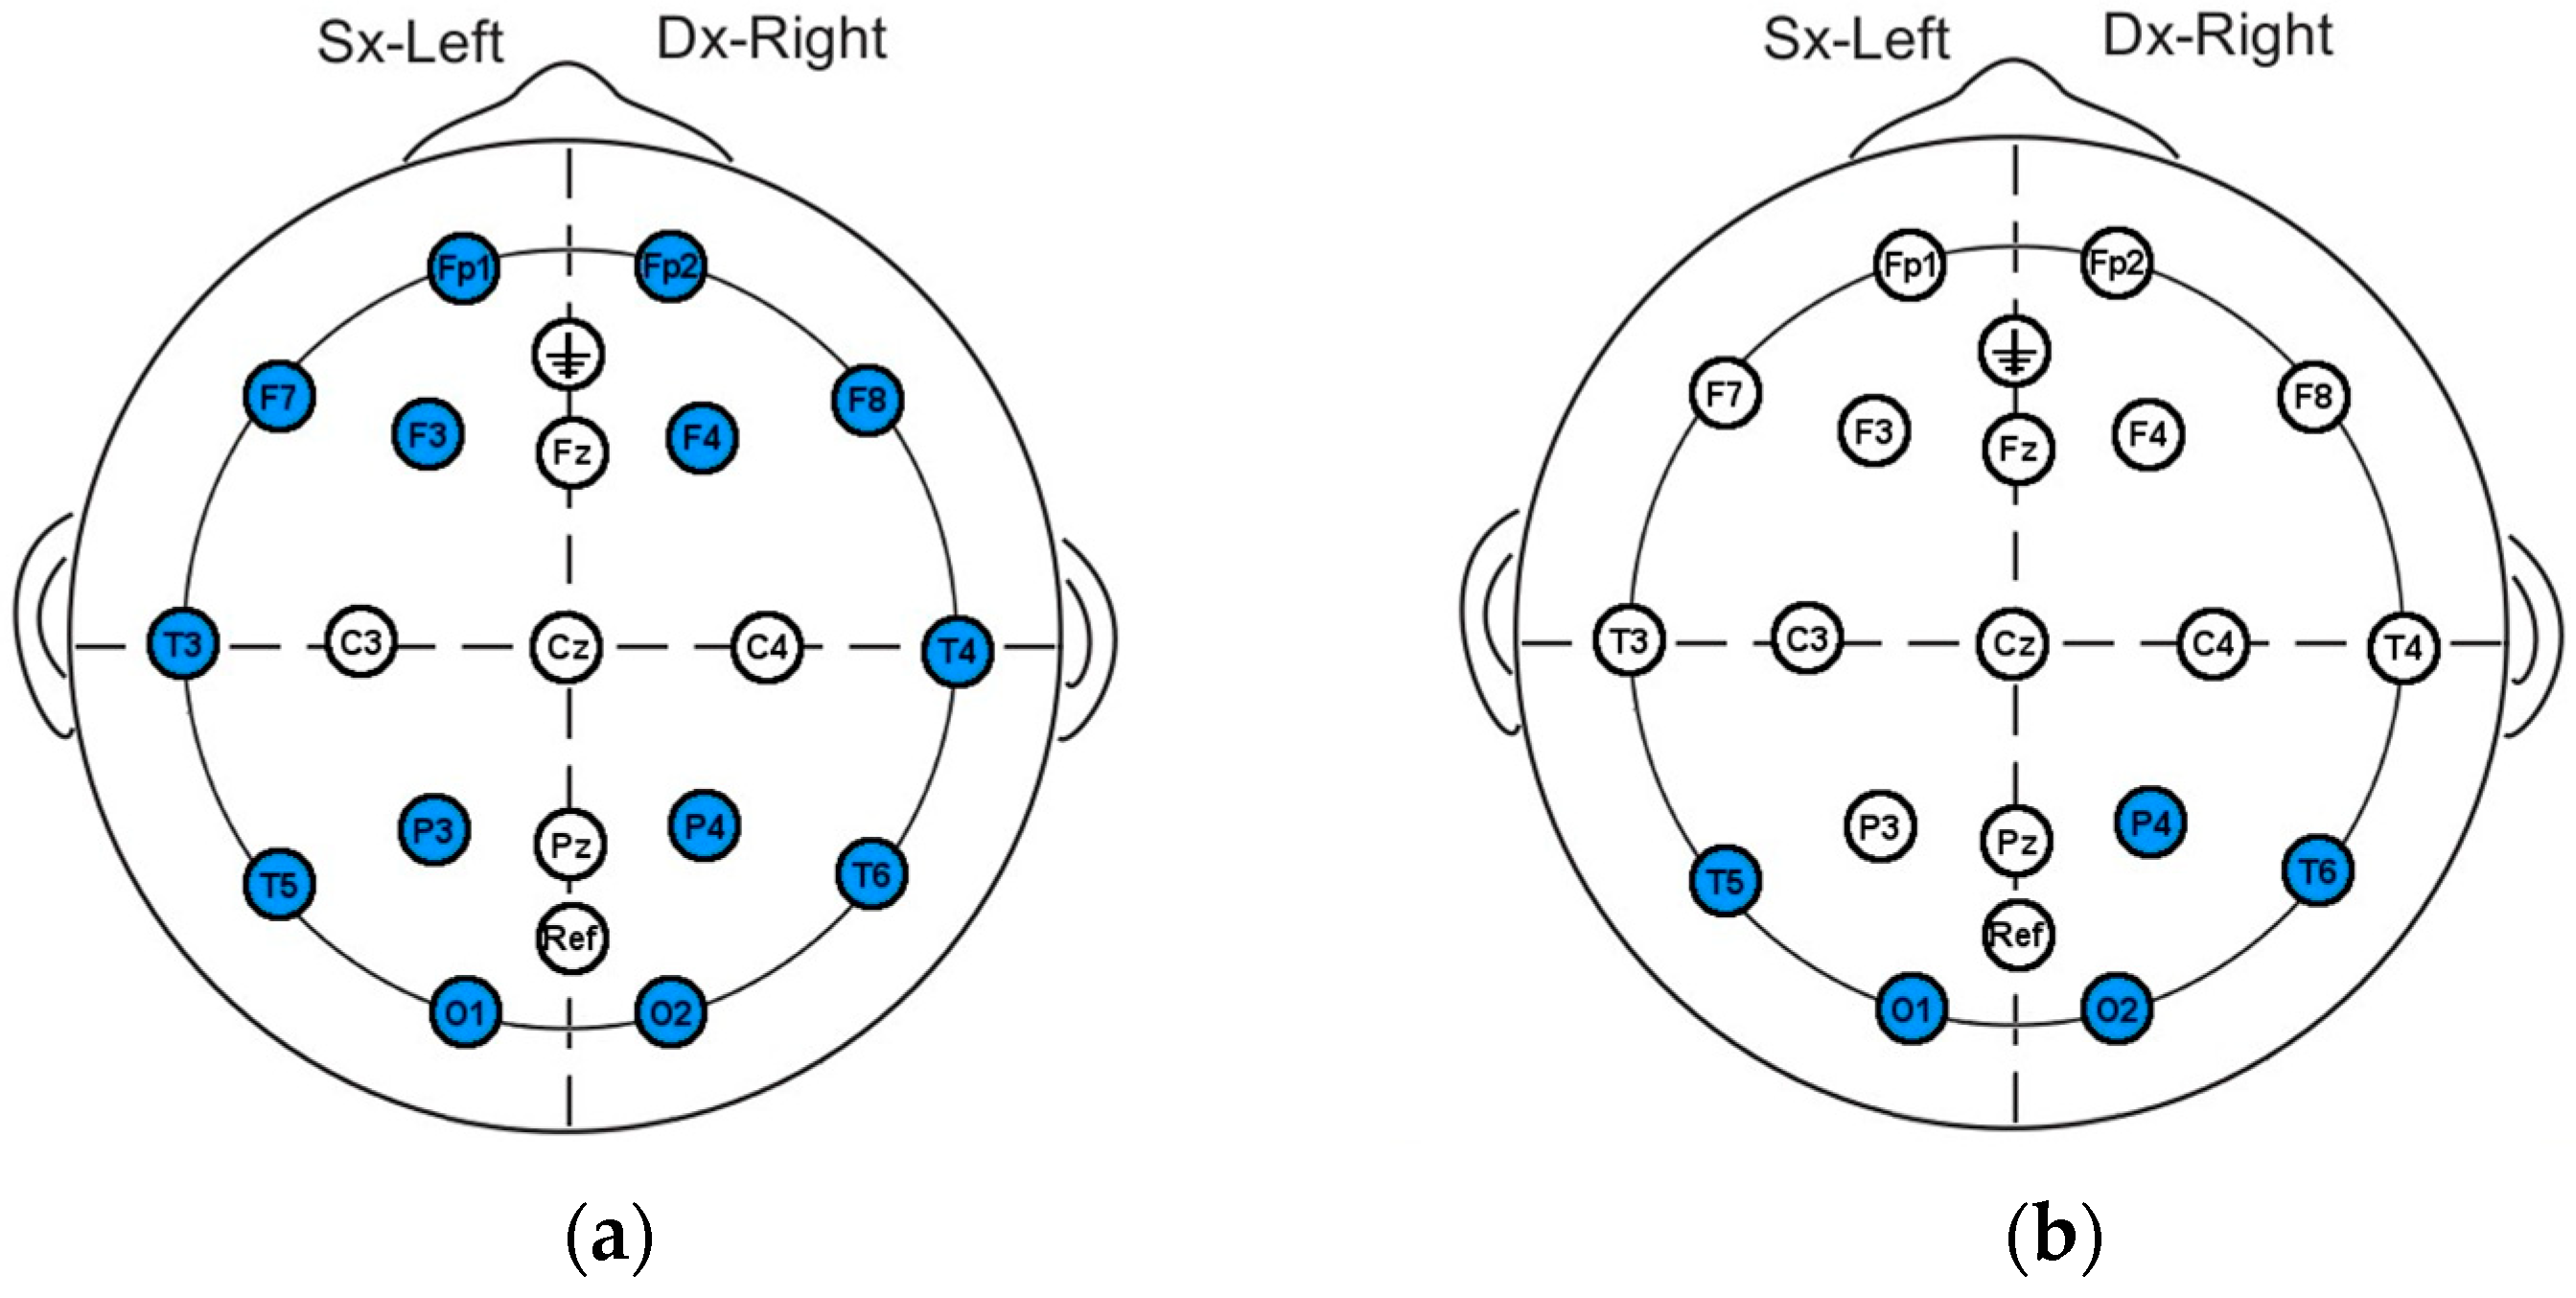
Figure 12.
(a,b) Significance between MONOA and MONOC in alpha band and beta band (PSD).
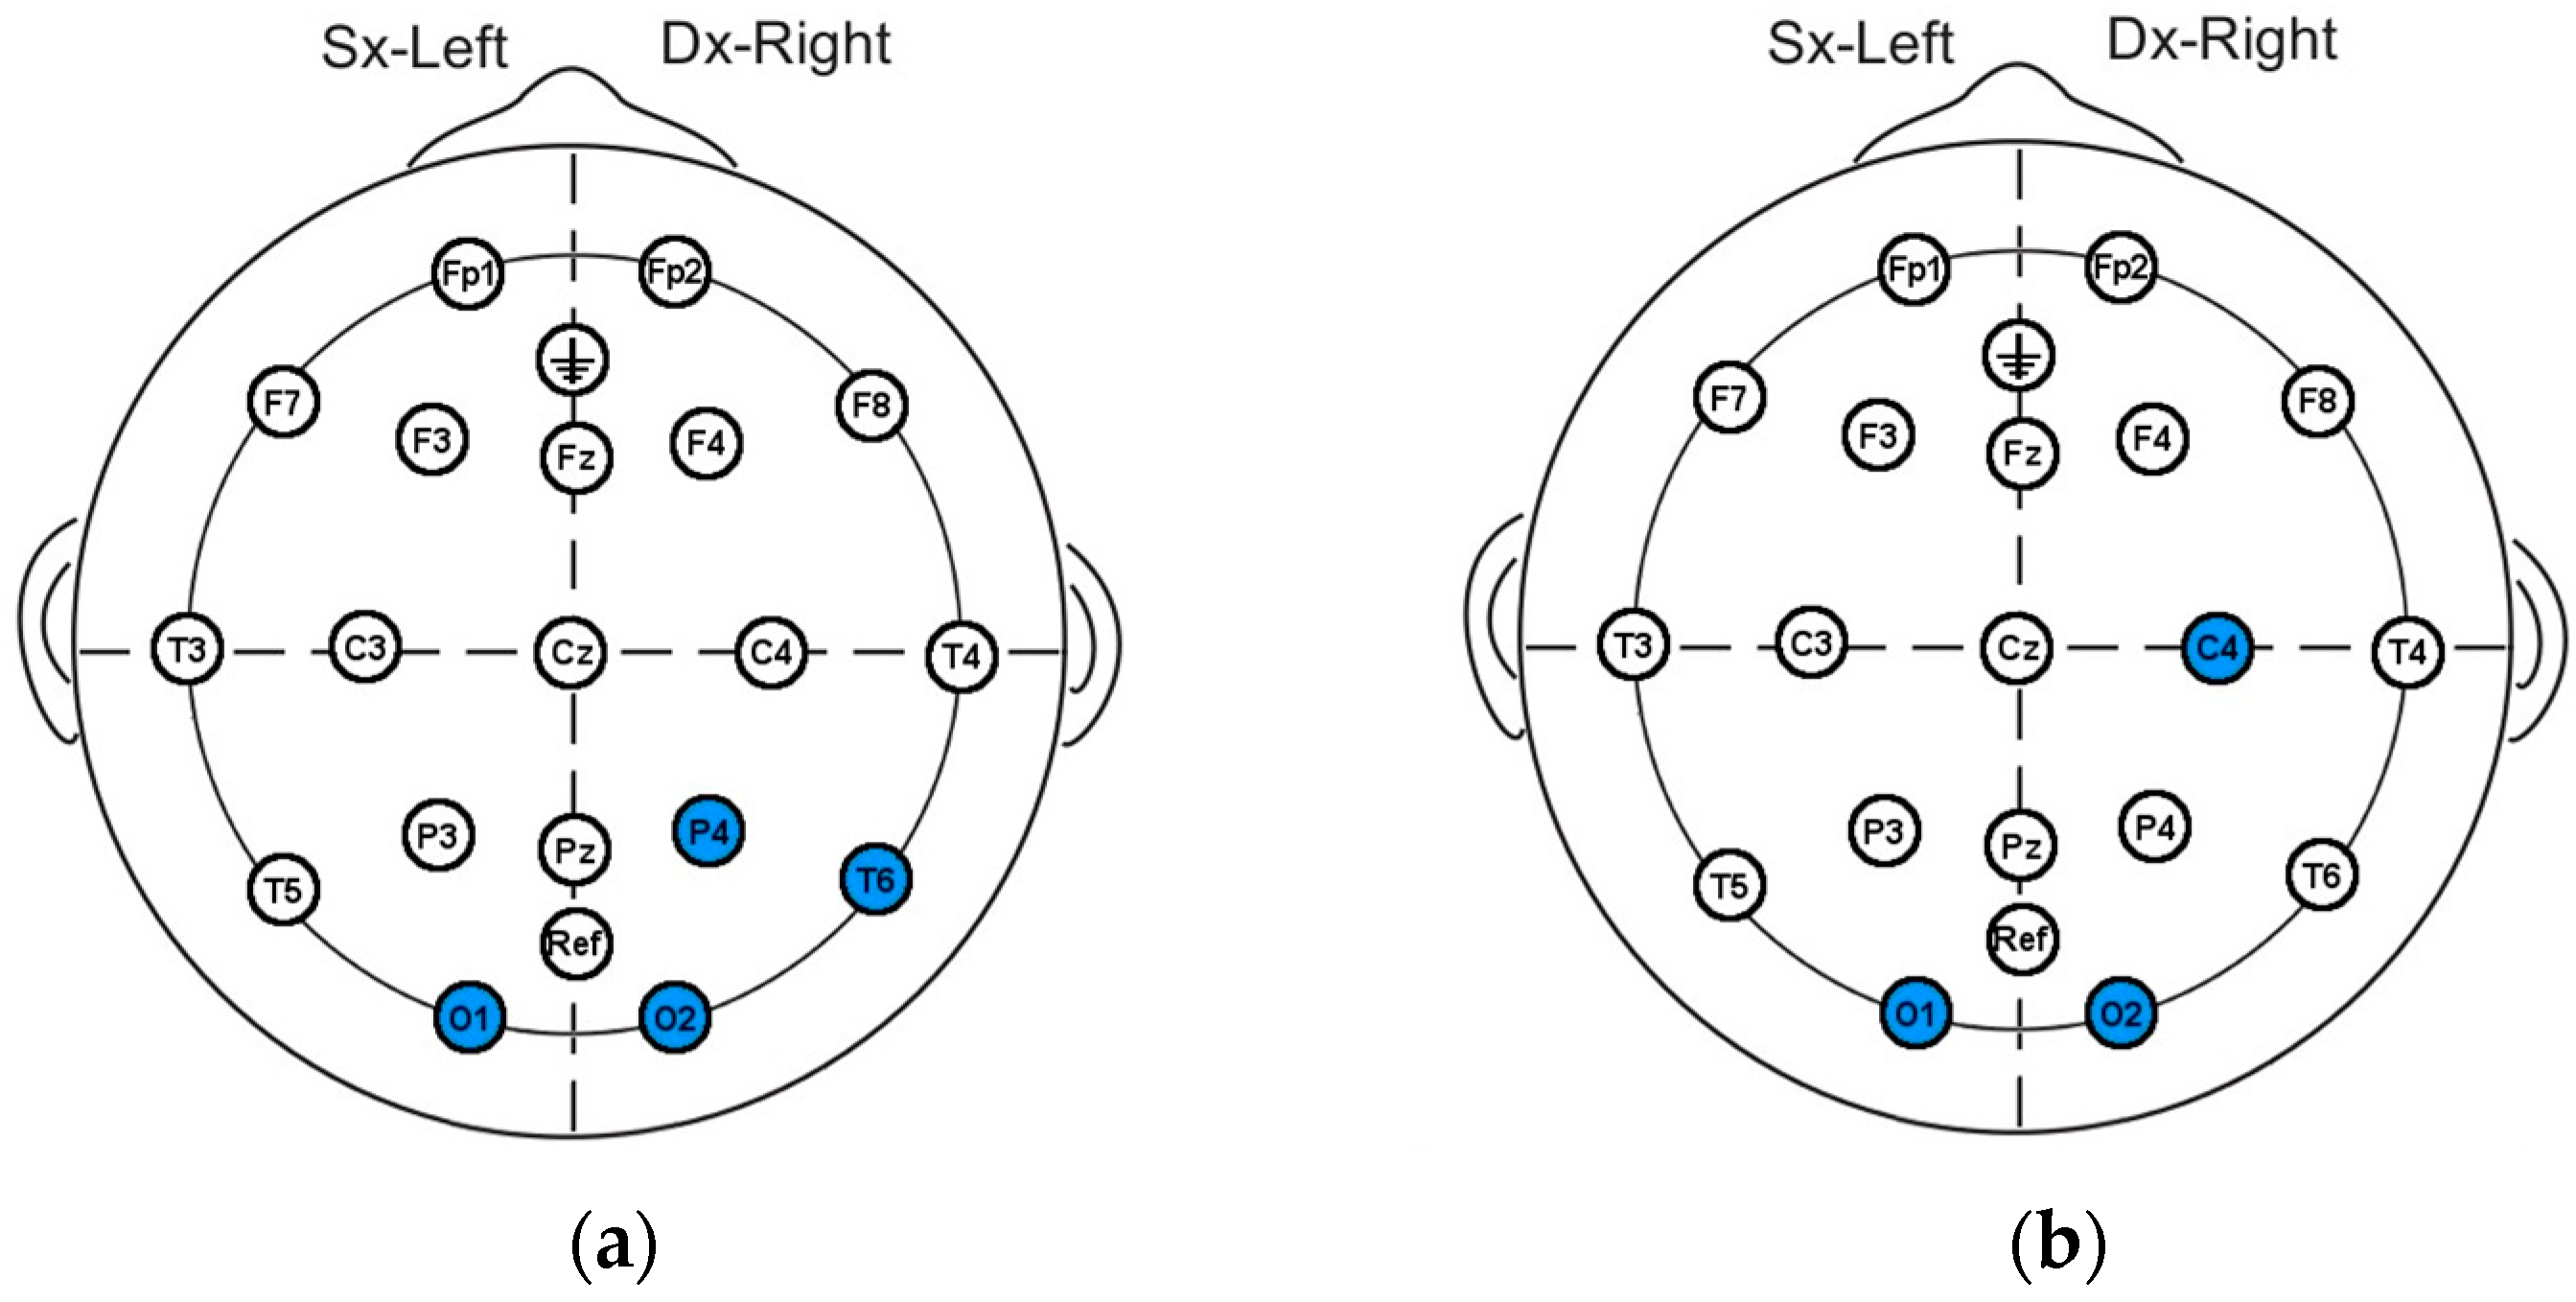
Figure 13.
(a,b) Average ARV of all channels in the alpha and beta bands. * = p < 0.05; ** = p < 0.01; *** = p < 0.001.
Figure 13.
(a,b) Average ARV of all channels in the alpha and beta bands. * = p < 0.05; ** = p < 0.01; *** = p < 0.001.
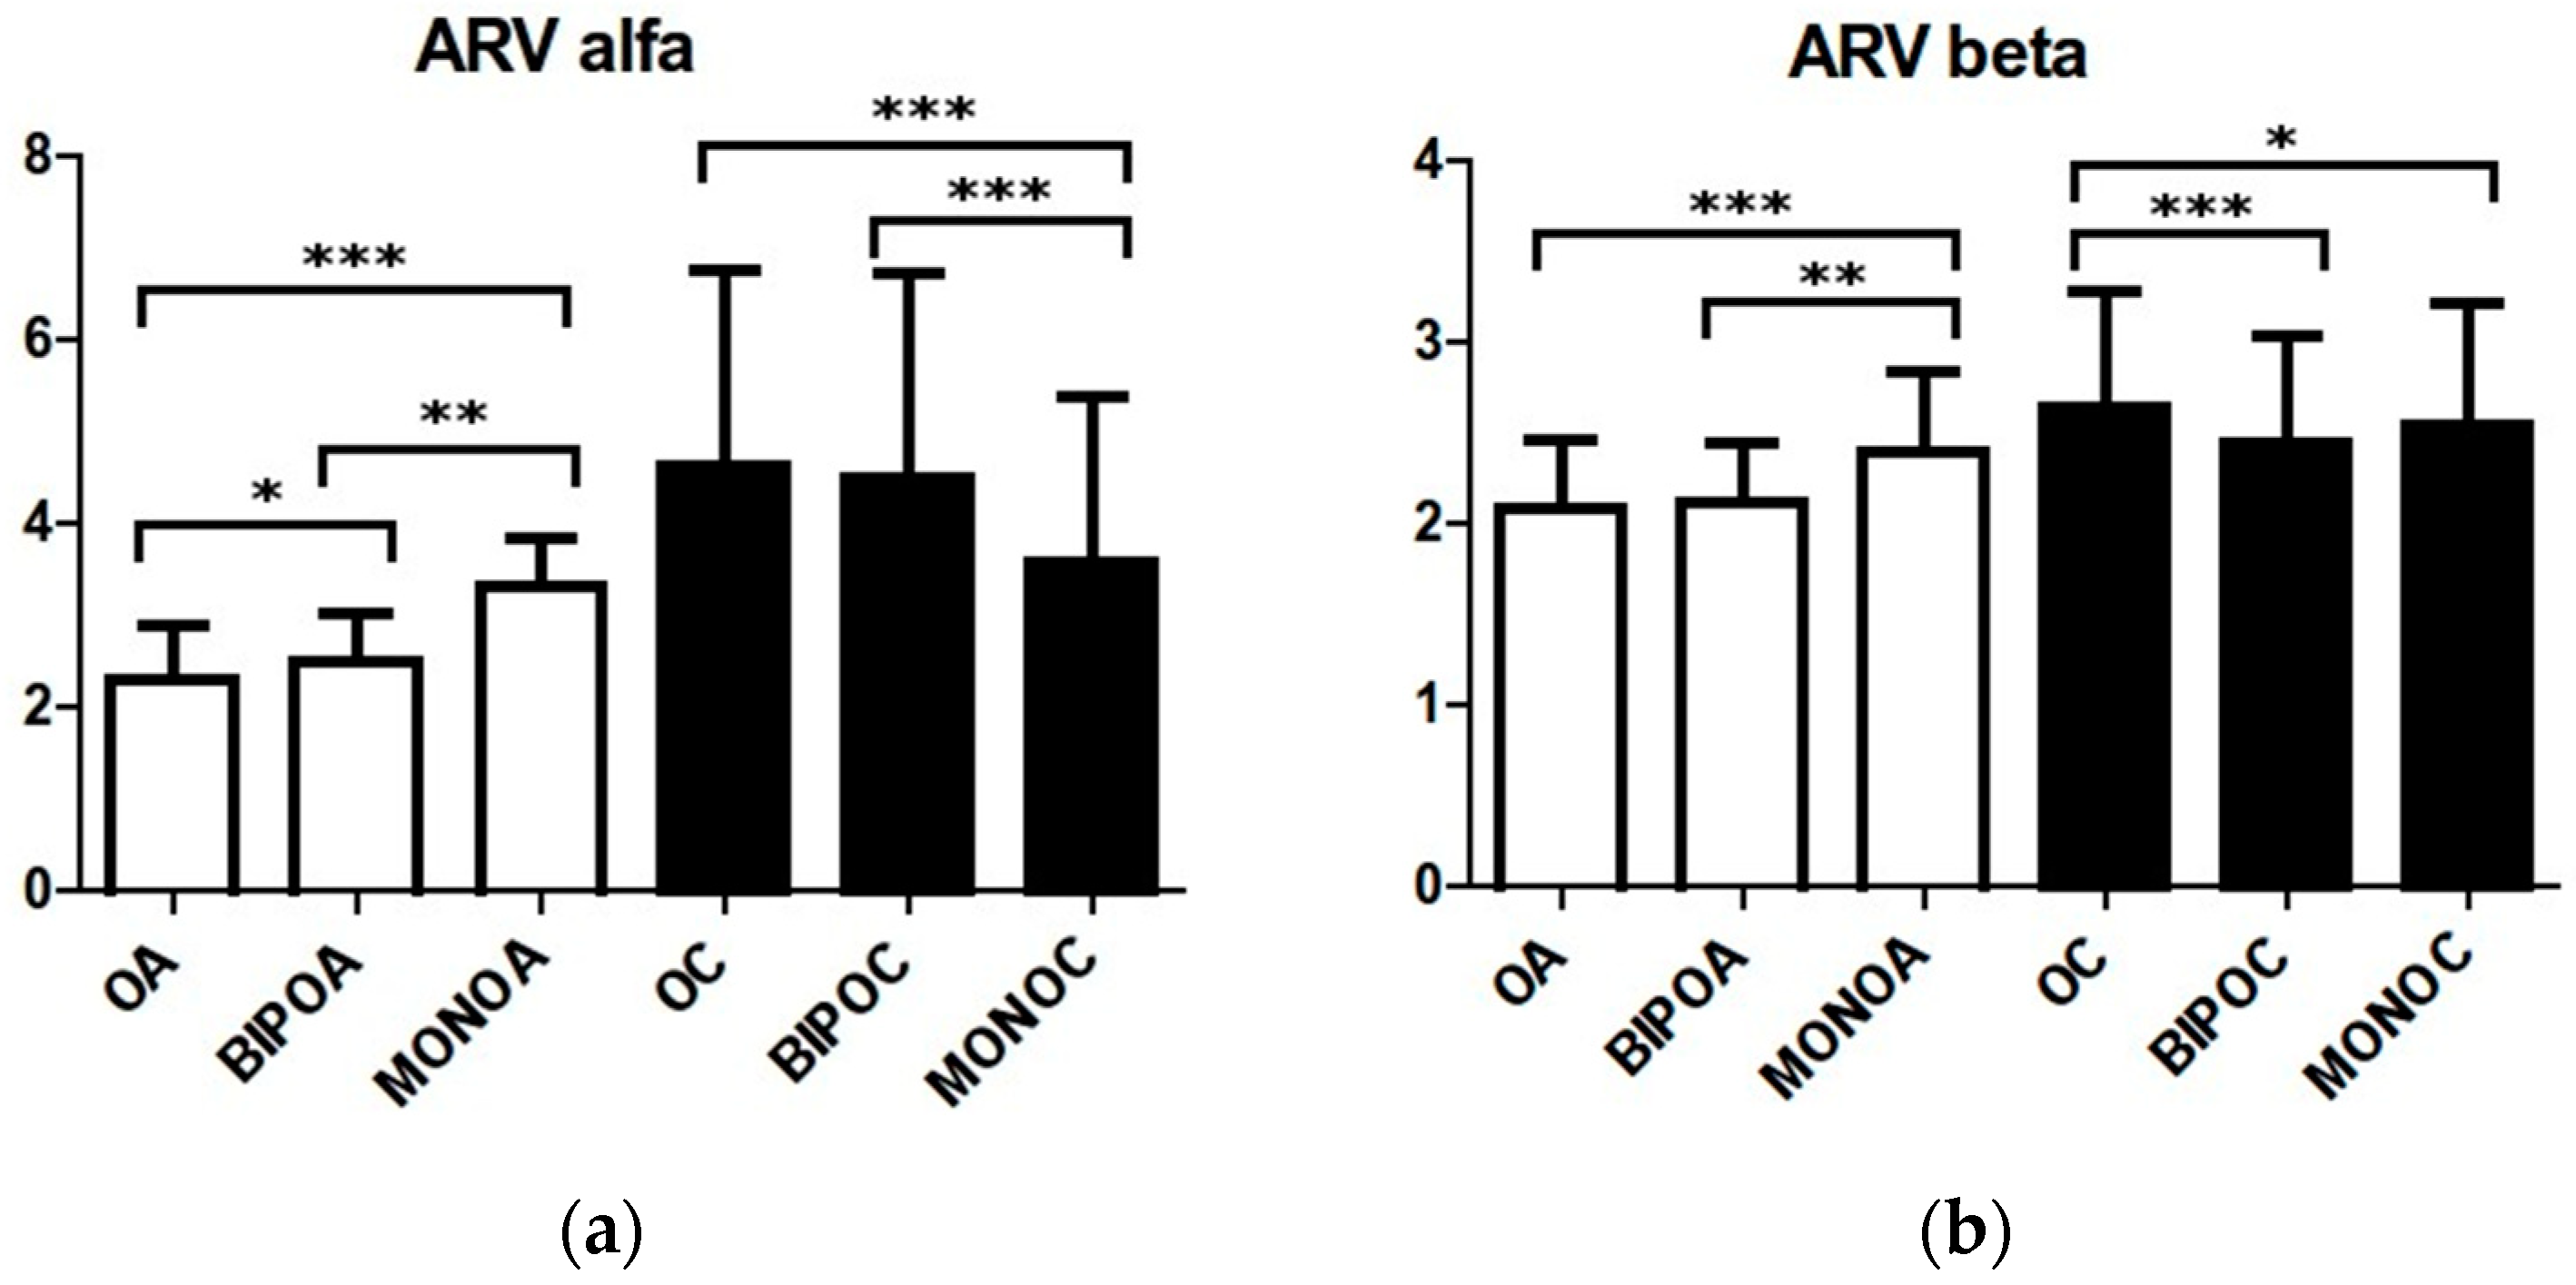
Figure 14.
(a,b) Average PSD of all channels in the alpha and beta bands. * = p < 0.05; ** = p < 0.01; *** = p < 0.001.
Figure 14.
(a,b) Average PSD of all channels in the alpha and beta bands. * = p < 0.05; ** = p < 0.01; *** = p < 0.001.
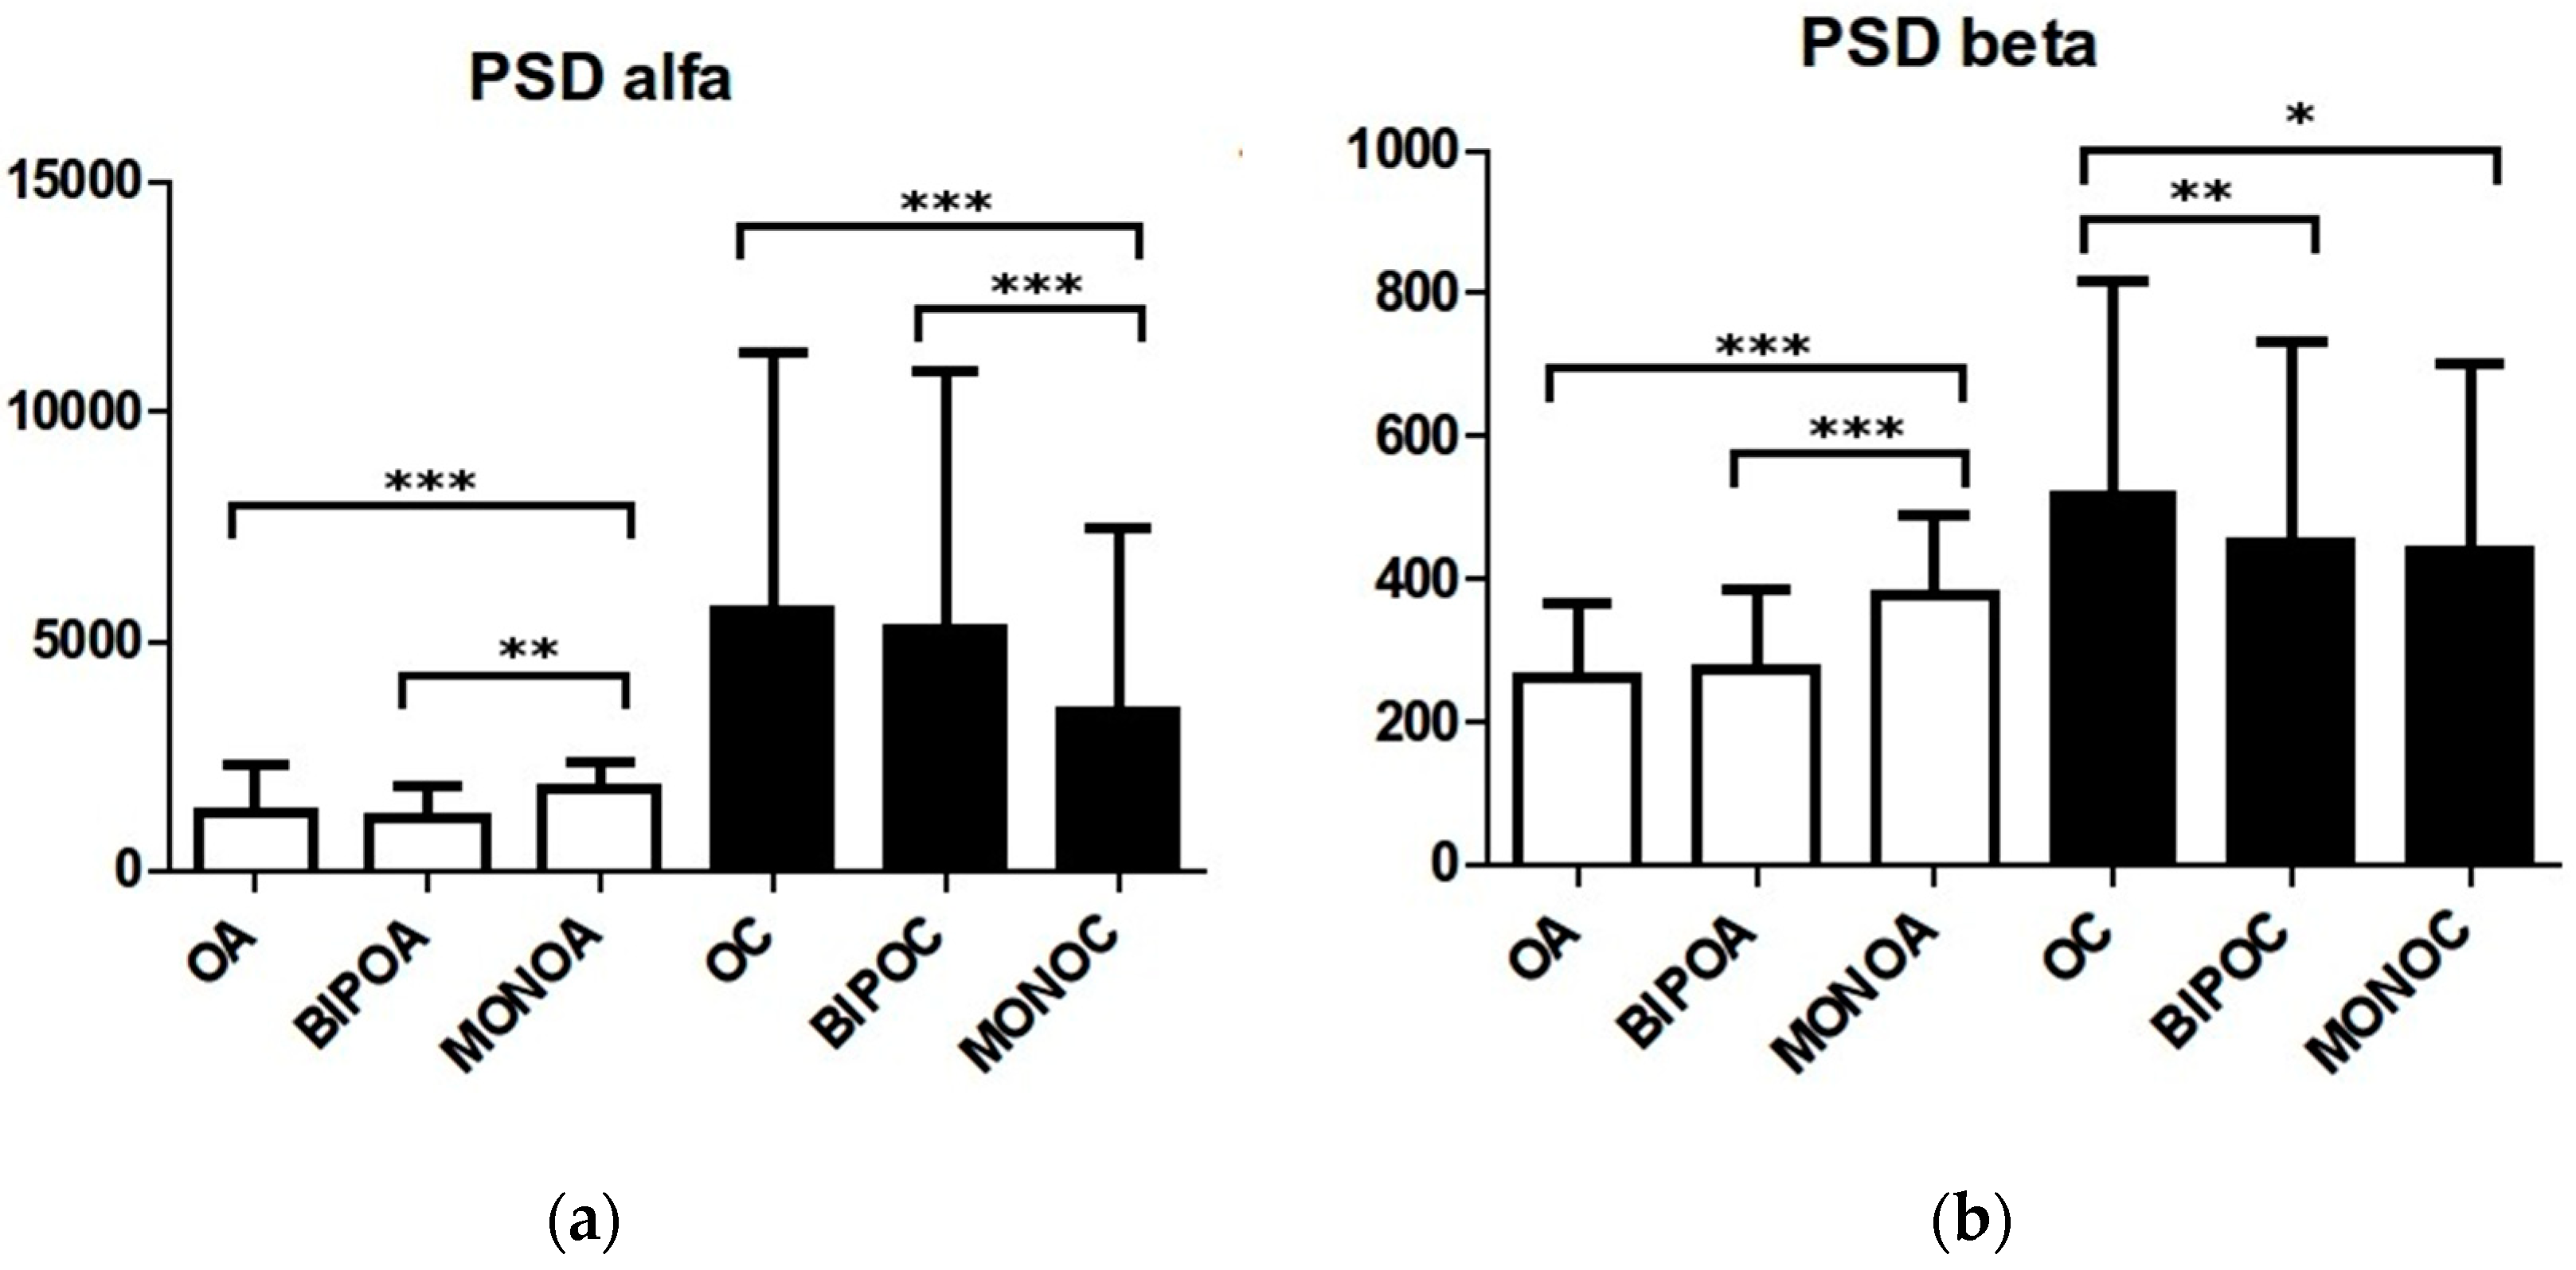
Figure 15.
Brodmann area 17 (primary visual cortex) is shown in red in this image, area 18 in orange and area 19 in yellow.
Figure 15.
Brodmann area 17 (primary visual cortex) is shown in red in this image, area 18 in orange and area 19 in yellow.

Table 1.
Task descriptions.
| Duration (s) and Acronym of the Task | Description of the Task |
|---|---|
| 30 s OA | Volunteer sitting on the couch with eyes open |
| 30 s OC | Volunteer sitting on the couch with eyes closed |
| 60 s BIPOA | Volunteer standing with bipodalic support and eyes open |
| 60 s BIPOC | Volunteer standing with bipodalic support and eyes closed |
| 30 s MONOA | Volunteer standing with monopodalic support and eyes open |
| 30 s MONOC | Volunteer standing with monopodalic support and eyes closed |
Table 2.
Significant p-values of Wilcoxon test performed on pairs of tasks; each open-eye posture was compared with the same closed-eye posture. * = p < 0.05; ** = p < 0.01.
Table 2.
Significant p-values of Wilcoxon test performed on pairs of tasks; each open-eye posture was compared with the same closed-eye posture. * = p < 0.05; ** = p < 0.01.
| Var. | ARV | PSD | ||||||||||
|---|---|---|---|---|---|---|---|---|---|---|---|---|
| Task | OA–OC | BIPOA–BIPOC | MONOA–MONOC | OA–OC | BIPOA–BIPOC | MONOA—MONOC | ||||||
| Band (Line) Electrode (Coloumn) | α | β | α | β | α | β | α | β | α | β | α | β |
| Fp1 | ** | ** | ** | ** | ||||||||
| F3 | ** | ** | * | ** | * | ** | ||||||
| C3 | * | * | ||||||||||
| P3 | ** | * | * | * | * | * | ||||||
| Fp2 | ** | ** | ** | ** | ||||||||
| F4 | * | ** | * | ** | ** | ** | ||||||
| C4 | ** | ** | * | ** | * | * | ||||||
| P4 | ** | ** | ** | ** | ** | ** | ** | ** | * | |||
| F7 | * | * | ** | ** | * | * | ||||||
| T3 | ** | * | ** | * | ||||||||
| T5 | ** | * | ** | * | * | ** | ** | ** | ** | |||
| F8 | ** | * | ** | ** | ||||||||
| T4 | ** | ** | ** | ** | ||||||||
| T6 | ** | ** | ** | ** | ** | ** | ** | ** | * | |||
| O1 | ** | ** | ** | ** | ** | * | ** | ** | * | * | ** | |
| O2 | ** | ** | ** | ** | * | ** | * | ** | ** | ** | * | ** |
Disclaimer/Publisher’s Note: The statements, opinions and data contained in all publications are solely those of the individual author(s) and contributor(s) and not of MDPI and/or the editor(s). MDPI and/or the editor(s) disclaim responsibility for any injury to people or property resulting from any ideas, methods, instructions or products referred to in the content. |
© 2023 by the authors. Licensee MDPI, Basel, Switzerland. This article is an open access article distributed under the terms and conditions of the Creative Commons Attribution (CC BY) license (https://creativecommons.org/licenses/by/4.0/).
Share and Cite
MDPI and ACS Style
Ivaldi, M.; Giacometti, L.; Conversi, D. Quantitative Electroencephalography: Cortical Responses under Different Postural Conditions. Signals 2023, 4, 708-724. https://doi.org/10.3390/signals4040039
AMA Style
Ivaldi M, Giacometti L, Conversi D. Quantitative Electroencephalography: Cortical Responses under Different Postural Conditions. Signals. 2023; 4(4):708-724. https://doi.org/10.3390/signals4040039
Chicago/Turabian StyleIvaldi, Marco, Lorenzo Giacometti, and David Conversi. 2023. "Quantitative Electroencephalography: Cortical Responses under Different Postural Conditions" Signals 4, no. 4: 708-724. https://doi.org/10.3390/signals4040039