
Computer Vision and Image Processing in Structural Health Monitoring: Overview of Recent Applications

1
Institute of Electronics, Information Engineering and Telecommunications, National Research Council, Corso Duca degli Abruzzi 24, 10129 Torino, Italy
2
Department of Control and Computer Engineering, Politecnico di Torino, Corso Duca degli Abruzzi 24, 10129 Torino, Italy
*
Author to whom correspondence should be addressed.
Signals 2023, 4(3), 539-574; https://doi.org/10.3390/signals4030029
Submission received: 13 May 2023
/
Revised: 21 June 2023
/
Accepted: 19 July 2023
/
Published: 24 July 2023
(This article belongs to the Special Issue Health Monitoring of Cement-Based Structures/Materials: Signal Processing and Artificial Intelligence Techniques)
Abstract
:Structural deterioration is a primary long-term concern resulting from material wear and tear, events, solicitations, and disasters that can progressively compromise the integrity of a cement-based structure until it suddenly collapses, becoming a potential and latent danger to the public. For many years, manual visual inspection has been the only viable structural health monitoring (SHM) solution. Technological advances have led to the development of sensors and devices suitable for the early detection of changes in structures and materials using automated or semi-automated approaches. Recently, solutions based on computer vision, imaging, and video signal analysis have gained momentum in SHM due to increased processing and storage performance, the ability to easily monitor inaccessible areas (e.g., through drones and robots), and recent progress in artificial intelligence fueling automated recognition and classification processes. This paper summarizes the most recent studies (2018–2022) that have proposed solutions for the SHM of infrastructures based on optical devices, computer vision, and image processing approaches. The preliminary analysis revealed an initial subdivision into two macro-categories: studies that implemented vision systems and studies that accessed image datasets. Each study was then analyzed in more detail to present a qualitative description related to the target structures, type of monitoring, instrumentation and data source, methodological approach, and main results, thus providing a more comprehensive overview of the recent applications in SHM and facilitating comparisons between the studies.
1. Introduction
Health monitoring is a critically important issue, not only for people, but also for civil infrastructures throughout their lifetime. Bridges, railways, tunnels, roads, and the various buildings distributed across the land play a crucial role in economic growth [1,2] and the public life of cities [3]. Structural deterioration is one of the major long-term concerns regarding civil infrastructure, as it can become a potential and latent risk factor for human safety over time. Indeed, the wear and tear of materials due to weathering, continuous solicitations, or unforeseen events (such as natural disasters) can progressively compromise the integrity of a structure to the point of sudden collapse or loss of functionality, with severe consequences [4]. Therefore, periodic integrity inspections of civil infrastructure are crucial in their ensuring safety and total efficiency. On-site and manual visual inspections were the conventional method to detect damage and structural alterations in civil infrastructure in the past. However, on-site visual inspections conducted by experienced examiners are often impractical, time-consuming, and laborious, especially in the case of large-scale structures, such as bridges and buildings [5,6]. Moreover, in many cases, the assessment results largely depend on the inspectors’ personal competence and subjective evaluation [7].
To overcome the difficulties and limitations of manual visual inspections, structural health monitoring (SHM) has received significant attention over the last two decades as a powerful emerging diagnostic tool for evaluating structural integrity due to advances in technology. The evidence of this growing interest was objectively demonstrated in reference [8]. An in-depth analysis of articles dealing with SHM topics, published in three major journals during 2005–2019, showed a progressive and significant upsurge in the number of articles published, increasing from 22 publications in 2005 to 495 in 2019 (increase factor: 22.5), with a significant increase in the number of authors involved in this research as well (increase factor: 28).
The primary aim of SHM is to collect objective measurements and information related to specific structural properties to trigger timely maintenance interventions and prevent serious consequences. In practice, an SHM system includes sensors, data acquisition modules, along with algorithms for signal processing, structural diagnosis, and damage detection [9]. In recent years, different types of sensors and techniques have been proposed for SHM. Traditional approaches involved the use of contact-based sensors applied directly to the structure under investigation: these include accelerometers, strain gauges, fiber-optic sensors, piezoelectric sensors, ultrasonic waves, displacement sensors, and others, as reported in reference [10]. However, these wired and wireless sensors are often impractical for installation and maintenance on large-scale structures and typically provide only scattered measurements related to application points.
In the past few years, SHM approaches have shifted from conventional contact-based solutions to more efficient and practical non-contact sensors, partially due to recent advances in innovative technologies. In particular, optical sensors, drones, robots, and smartphones, combined with artificial intelligence (AI), such as deep learning models, machine learning methods, data mining techniques, and data-fusion/sensor-fusion approaches, are attracting growing interest, overcoming the practical limitations of contact-based sensors and fostering a paradigm shift in the context of SHM [11,12,13,14,15].
The in-depth analysis in [8] confirms the existing paradigm shift related to the change in supporting sensors. By comparing the top 20 topics covered by studies published in three five-year periods (2005–2009, 2010–2014, 2015–2019), it is evident, for example, that computer vision (CV), empowered by optical sensors, made its appearance only in the third period; while machine learning, which appeared in the top 20 in the second period, made a significant leap forward in the third period, ranking eighth. In contrast, the “damage type” topic has been addressed regularly since 2005. However, its ranking has recently increased significantly (from 14th to seventh place), probably due to the spread of automatic classification methods. The ranking related to 2015–2019 still does not mention deep learning (DL), likely because this is a methodology explored intensively in SHM only more recently, and it was ranked lower than other more established topics [16].
As previously pointed out, CV-based solutions are proving to be promising and powerful tools for SHM investigation in large-scale structures due to the recent developments in optical sensors (high-performance cameras), supporting devices (i.e., drones and robots), and enhanced image processing techniques that take advantage of machine and deep learning [17,18,19,20,21,22,23]. These solutions have been shown to be easily implemented as an alternative to manual visual inspections to estimate the properties and integrity of the structures in several SHM areas, including the assessment of specific local (i.e., cracking, spalling, corrosion, and delamination) and global (i.e., vibration, deformation, displacement) structural conditions [24,25,26,27].
Moreover, CV-based solutions offer several advantages over conventional approaches, including non-contact and long-distance measurements, portability (when installed on vehicles), higher spatial information density, cost-effective installation, and automated assessment capability (when combined with artificial intelligence algorithms) crucial in long-term monitoring and the timely triggering of maintenance actions [16,26,28]. However, some constraints need to be considered, especially in real-world applications, including the impact of environmental and weather conditions; reference markers on the structure; measurement accuracy; the real-time processing, storage, and transmission of large amounts of data (images and videos); calibration procedures; and visual optimization techniques, especially over large distances [29].
On this line of research, this paper reviews the most recent studies (2018–2022) in the literature that have proposed solutions regarding the structural health monitoring of infrastructure using optical devices (specifically, standard color cameras), computer vision, and image processing approaches. Two electronic reference databases (Scopus and the Web of Science) were explored through ad hoc queries to select published articles based on well-defined keywords. Subsequently, the automatically selected articles were manually screened to include only those that met the established eligibility criteria. This review aims to provide a comprehensive overview of vision-based solutions for SHM and to analyze them from the perspective of target structures, monitoring types, instrumentation and data sources, methodological approaches, testing scenarios, and main results. Detailed information was collected from the full text to facilitate comparison between studies and to provide general statistical information concerning the resulting categories.
In summary, the main contribution of this article the evaluation of recent work using optical sensors and image/video signals for SHM, focusing on solutions that can also be applied to real-world cement-based infrastructure. With the information gathered, it was possible to classify the selected studies into two main categories (studies implementing vision-based solutions and studies using pre-collected image datasets) and subgroups based on specific technological and methodological characteristics to highlight the most relevant application domains, trends, peculiarities, strengths, and weaknesses to render the studies and approaches as comparable as possible.
The paper is organized as follows: Section 2 describes the selection procedures, with a focus on databases, search and refinement strategies, and information collected; Section 3 presents the global results of the selection process and the lists of included articles, with detailed information; Section 4 summarizes the results and highlights the more critical issues related to CV-based approaches in SHM that require further investigation from the perspective of long-term and automated monitoring; and Section 5 provides a brief conclusion, with some final remarks and future prospects.
2. Materials and Methods
2.1. Sources of Information
As technological progress rapidly drives new solutions due to the availability of higher-performance devices and computational resources, facilitating the development of innovative methodological approaches, this study aims to explore the latest trends, solutions, and practical applications for SHM using vision systems, computer vision techniques, and image processing approaches as alternatives to traditional inspection methods. Therefore, the search strategy was defined by limiting the analysis to the most recent publications, focusing on 2018–2022. The two most comprehensive electronic databases, namely Scopus and the Web of Science, were considered because both allow ad hoc queries for automatic preliminary selection.
The overall screening procedure followed the guidance of the Preferred Reporting Items for Systematic Review and Meta-Analysis (PRISMA 2020) [30], and a standard flow diagram [31] was customized to illustrate the progressive steps in the process. All the authors were involved in the decision-making process to include or exclude studies automatically selected according to the predetermined eligibility criteria. In the case of decision discrepancy, the majority criterion was applied.
2.2. Search Strategy and Eligibility Criteria
The search strategy for automatic preliminary selection was based on ad hoc queries supported by the two databases. Queries were performed only on the “Title” and “Abstract” fields, as these fields commonly reflect the most relevant topics (i.e., keywords) of a scientific study to facilitate proper indexing of the scientific research. Specifically, the ad hoc queries included both mandatory (in the “Title” or “Abstract” fields) and optional (only in the “Abstract”) keywords, using logical operators (“AND” and “OR”) to concatenate the query elements correctly.
The following queries were used to search in the Web of Science (TI = “Title”, AB = “Abstract”) and Scopus (TITLE = “Title”, ABS = “Abstract”) databases:
- ((TI = (“Structural Health Monitoring”)) OR AB = (“Structural Health Monitoring”)) AND ((AB = “Computer Vision”) OR (AB = “RGB*”) OR (AB = “Optical Sensors”) OR (AB = “camer*”)) for the Web of Science database;
- TITLE-ABS (“Structural Health Monitoring”) AND ((ABS (“Computer Vision”)) OR (ABS (“RGB*”)) OR (ABS (“Optical Sensors”)) OR (ABS (“camer*”))) for Scopus database.
As can be seen, the optional keywords included terms that generally relate to vision-based approaches (i.e., computer vision, cameras, optical sensors, and RGB). In contrast, the mandatory keyword (i.e., structural health monitoring) was used to limit the application context. At this stage, an additional constraint was included regarding the publication date (2018 to 2022 only), but not for the type and language of the publications. These last filters were applied during the refinement process.
2.3. Selection Refinement and Final Inclusion of Papers
On the studies automatically extracted from the two databases, a manual a posteriori screening (refinement process) was performed through the following actions, in this order:
- Removal of duplicates (i.e., studies available in both databases);
- Removal of studies for which the full text is not available (i.e., studies with only the abstract accessible);
- Removal of non-English studies;
- Removal of reviews, books or chapters, letters to editors, notes, data reports, case studies, and comments (filtered by publication type);
- Removal of studies with a different focus (i.e., studies with optional keywords in the abstract, but whose content did not match the purpose of this review);
- Removal of preliminary studies with a more recent extended version already published in a journal and selected from the databases.
At the end of the overall process, the included papers were analyzed in detail to extract relevant information according to the main objectives of our review.
2.4. Collected Information
For each article, relevant information providing insights inherent to the purpose of this review was manually extracted through an in-depth analysis of the full text. This information was collected and organized into a customized database to create tables, generate statistics and categorizations, and provide specific details about each study. Key information included:
- First author and year of publication;
- Target of the SHM (e.g., bridges, roads, buildings);
- Scenario (e.g., indoor, outdoor, in-field, simulation);
- Data source (e.g., vision systems, image dataset);
- For vision systems: details on cameras used (e.g., resolution, frame rate, location);
- For image datasets: details about the images and processing hardware (e.g., dataset size, image type, resolution, cropped size, hardware components);
- Methodological approach (e.g., computer vision, data fusion, deep learning, algorithm optimization);
- SHM category (e.g., crack detection, damage detection, displacement estimation, vibration estimation);
- Main objectives, primary results, and limitations.
3. Results
3.1. Study Selection
The automatic search of electronic databases selected 540 studies (219 from the Web of Science and 321 from Scopus, respectively). A preliminary analysis of the selected studies identified 209 duplicates, which were subsequently removed. Next, we screened the remaining 331 studies by abstract to verify that they were relevant to our review’s purpose: after this evaluation, an additional 117 studies were manually removed. Notably, these studies were out of the scope of the review because they used other technologies (e.g., optical fibers, thermal cameras, micro cameras), methodologies (e.g., acoustic emission analysis, vibrational signals, piezoelectric signals), or were applied to specific components of the targets (e.g., cables, wind turbines, polymers). The remaining articles (214) were considered suitable for retrieval of detailed information from the full text: for 67 articles, the full text was not available (only the abstract was directly accessible), and thus were discarded.
Therefore, only 147 articles were further screened for eligibility according to the established criteria: of these, 3 were discarded because they were published in a non-English language; 21 because of the type of publication (e.g., review, book, data report); 40 because they had a different focus (e.g., traffic load estimation, load forces, performance comparisons between cameras) or did not provide results; and 10 because more comprehensive and extended work was already published. In the end, after the automatic selection process and manual screening, 73 articles were eligible and included in this review. The PRISMA flow diagram summarizes the automatic selection and manual screening process (Figure 1).
The general analysis of the articles selected and included in this review confirmed the use of computer vision approaches and image processing techniques for various SHM applications while revealing a preliminary breakdown into two macro-categories: studies that implemented vision systems (71%) and studies using image datasets available from other studies (29%). The following sections present and detail the selected studies according to this primary categorization, while Figure 2 shows their distribution per year.
3.2. Studies Implementing Vision Systems (VSS)
This section describes studies that have implemented vision systems (VSS) using standard color cameras. Table 1 includes an overview of their main characteristics, focusing on target structures and types of SHM, study objectives, methods, camera features and placement, test scenarios, and main results.
3.2.1. Overall Statistics
This section presents and discusses general statistical information regarding the studies in Table 1. The first analysis concerns the type of infrastructure addressed in the studies and the type of SHM implemented (Figure 3a and Figure 3b, respectively).
The analysis revealed that VSS have been implemented on different types of infrastructure, particularly on more general targets (such as bridges and buildings) or other more specific examples (such as containment vessels or retention ponds). The item “structures (generic)” refers to solutions suitable for multiple infrastructures. Regarding the type of SHM, the analysis revealed four categories, even though they are pairwise related. For example, the “vibration estimation” category includes those studies whose primary objective is to estimate vibration frequencies (mainly of bridges) starting from a displacement measurement determined by the vision system. On the contrary, the “displacement estimation” category includes those studies that have as their primary objective the measurement of displacements (mainly of buildings) and only secondarily attempt to estimate vibration frequencies. The “damage detection” category includes studies that focus on general structural damage (including deformations, deflections, and corrosion). In contrast, the “cracks on surface “ category includes studies addressing this type of damage exclusively.
Another relevant item involving vision systems concerns the type of cameras and configurations used. Regarding configuration, 85% of studies implemented a single-camera solution, while the others adopted a multi-camera approach. Single-camera solutions are more easily manageable, transportable, and therefore feasible for SHM of large-scale structures. In addition, they do not require complex calibration procedures, as is the case with multiple cameras. Regarding the type of cameras, high-resolution and high-speed cameras are often used to ensure spatial and temporal image quality, especially for estimating displacements and vibrations and for taking accurate long-distance measurements. It is also interesting to note the increasing number of studies using smartphone cameras (10 studies). The analysis also revealed that cameras are commonly mounted on tripods to ensure stability. However, new emerging alternatives for mounting cameras, such as UAVs (6 studies), USVs (1 study), and robots (1 study), are becoming common in for reaching locations that would otherwise be difficult to access.
Finally, two other fundamental aspects of VSS concern measurement accuracy and application in real-world or, at least, outdoor scenarios. In the first case, it is essential to compare the measured quantities with those provided by a gold-standard system through a validation procedure. In the second case, it is crucial to verify the behavior of the implemented systems in real situations, where weather and lighting conditions can become critical issues for the system itself, affecting its overall performance.
The following sub-sections provide a detailed analysis of the studies shown in Table 1 regarding these two key points.
3.2.2. Validation with Gold-Standard
The in-depth analysis revealed that almost all VSS include a validation of the proposed solution/algorithm against traditional SHM techniques, based on one or more contact and non-contact sensors.
The analysis revealed that several sensors had been used for validation purposes, including laser displacement sensors [32,34,41,42,49,70,74,76,82], accelerometers [32,33,34,50,51,53,55,59,61,64,65,66,67,68,76], IMU [60], linear variable differential transformers [34,36,41,50,54,61,66,67,73], laser Doppler vibrometers [38,46], stationary cameras [42,75,83], actuators [71], laser trackers [81], infrared sensors [48], and marker-based systems [44,73]. Marker-based systems are routinely used in other fields (such as medicine), where they are the traditional reference systems for motion capture and analysis. However, for specific measurements, such as displacement estimation, marker-based systems can also be successfully employed in SHM to compare the performance and accuracy of the proposed algorithms, thanks to retro-reflective markers applied to target locations on infrastructure-scale models. All the studies adopted the mentioned sensors as the gold standard with which to compare the performance, accuracy, and measurements of the proposed vision-based solutions. Figure 4 shows the percentage breakdown regarding the most common sensors used for validation purposes, as revealed by the analysis of the studies in Table 1. It is important to note that some studies adopted more than one type of sensor to validate their proposed solution. In addition, there is a high percentage related to accelerometers because many of the studies aimed to estimate infrastructure vibration, generally from displacement measurements.
In other studies, however, validation with other sensors was not performed, but rather a performance comparison was conducted between algorithms or devices, indirect measurements, or actual observations. For example, in [37], estimated displacements were compared with actuator-generated movements and stationary targets. In [39,47,63], only a comparison between algorithms was performed. In [40,45,52,56,57,58,62,69,72,77,78,79,80,85] a comparison with damage, deformation, and, in general, real-world manual measurements was performed. Finally, a proof of concept was provided in [84], with only qualitative results.
3.2.3. Experimental and Real-World Scenarios
Implementing vision systems, especially in the case of SHM, implies addressing typical problems, including environmental conditions (for example, lighting and weather events), long-distance measurements, calibration procedures, and stability issues. The in-depth analysis revealed that many studies implemented experimental tests to verify the effectiveness of the proposed solutions only in controlled experimental scenarios.
In many cases, the authors chose experimental indoor scenarios because these allowed the effects of environmental conditions to be limited and solutions to be tested only on scaled models. This choice applies to the following studies: [34,40,41,42,44,45,48,49,50,51,53,54,55,58,59,60,61,62,63,64,66,67,69,70,71,72,73,74,75,76,77,78,80,81,82]. In a few cases, the experimental scenarios were outdoors where, on the other hand, it was necessary to consider, at least in part, the environmental conditions and the problems previously indicated, testing the solution on scale models in most cases as well. The following studies chose this option: [32,36,65].
In addition, some of the studies that implemented experimental tests in indoor or outdoor scenarios also ventured out into the field, verifying the behavior of the proposed solutions in real-world environments and on full-scale targets, that is, under more challenging conditions. This is the case for [32,34,38,40,41,45,55,60,66,69,71,75,81,82].
In contrast, the authors of [39,46,47,52,56,68,79,83,84,85] tested the proposed solution only directly on real scenarios. The authors of [48] also mentioned an in-field experiment (i.e., estimation of building vibration using a video recorded from the roof of a building). However, they did not present any results regarding this experiment.
3.3. Studies Using Image Databases (IDS)
This section describes studies that have implemented frameworks on image databases (IDS), generally available from other studies, mainly to detect and identify areas with structural damage. Indeed, many other studies in the state-of-art literature focus on the same topics that could fall into this category. However, it is essential to note that only studies selected from the initial queries on the electronic databases, based on the mandatory and optional keywords, were included in this section. Table 2 provides an overview of the main characteristics of these studies, focusing on target structures and types of SHM, study objectives, methods, database features, processing unit hardware, and main results.
3.3.1. Overall Statistics
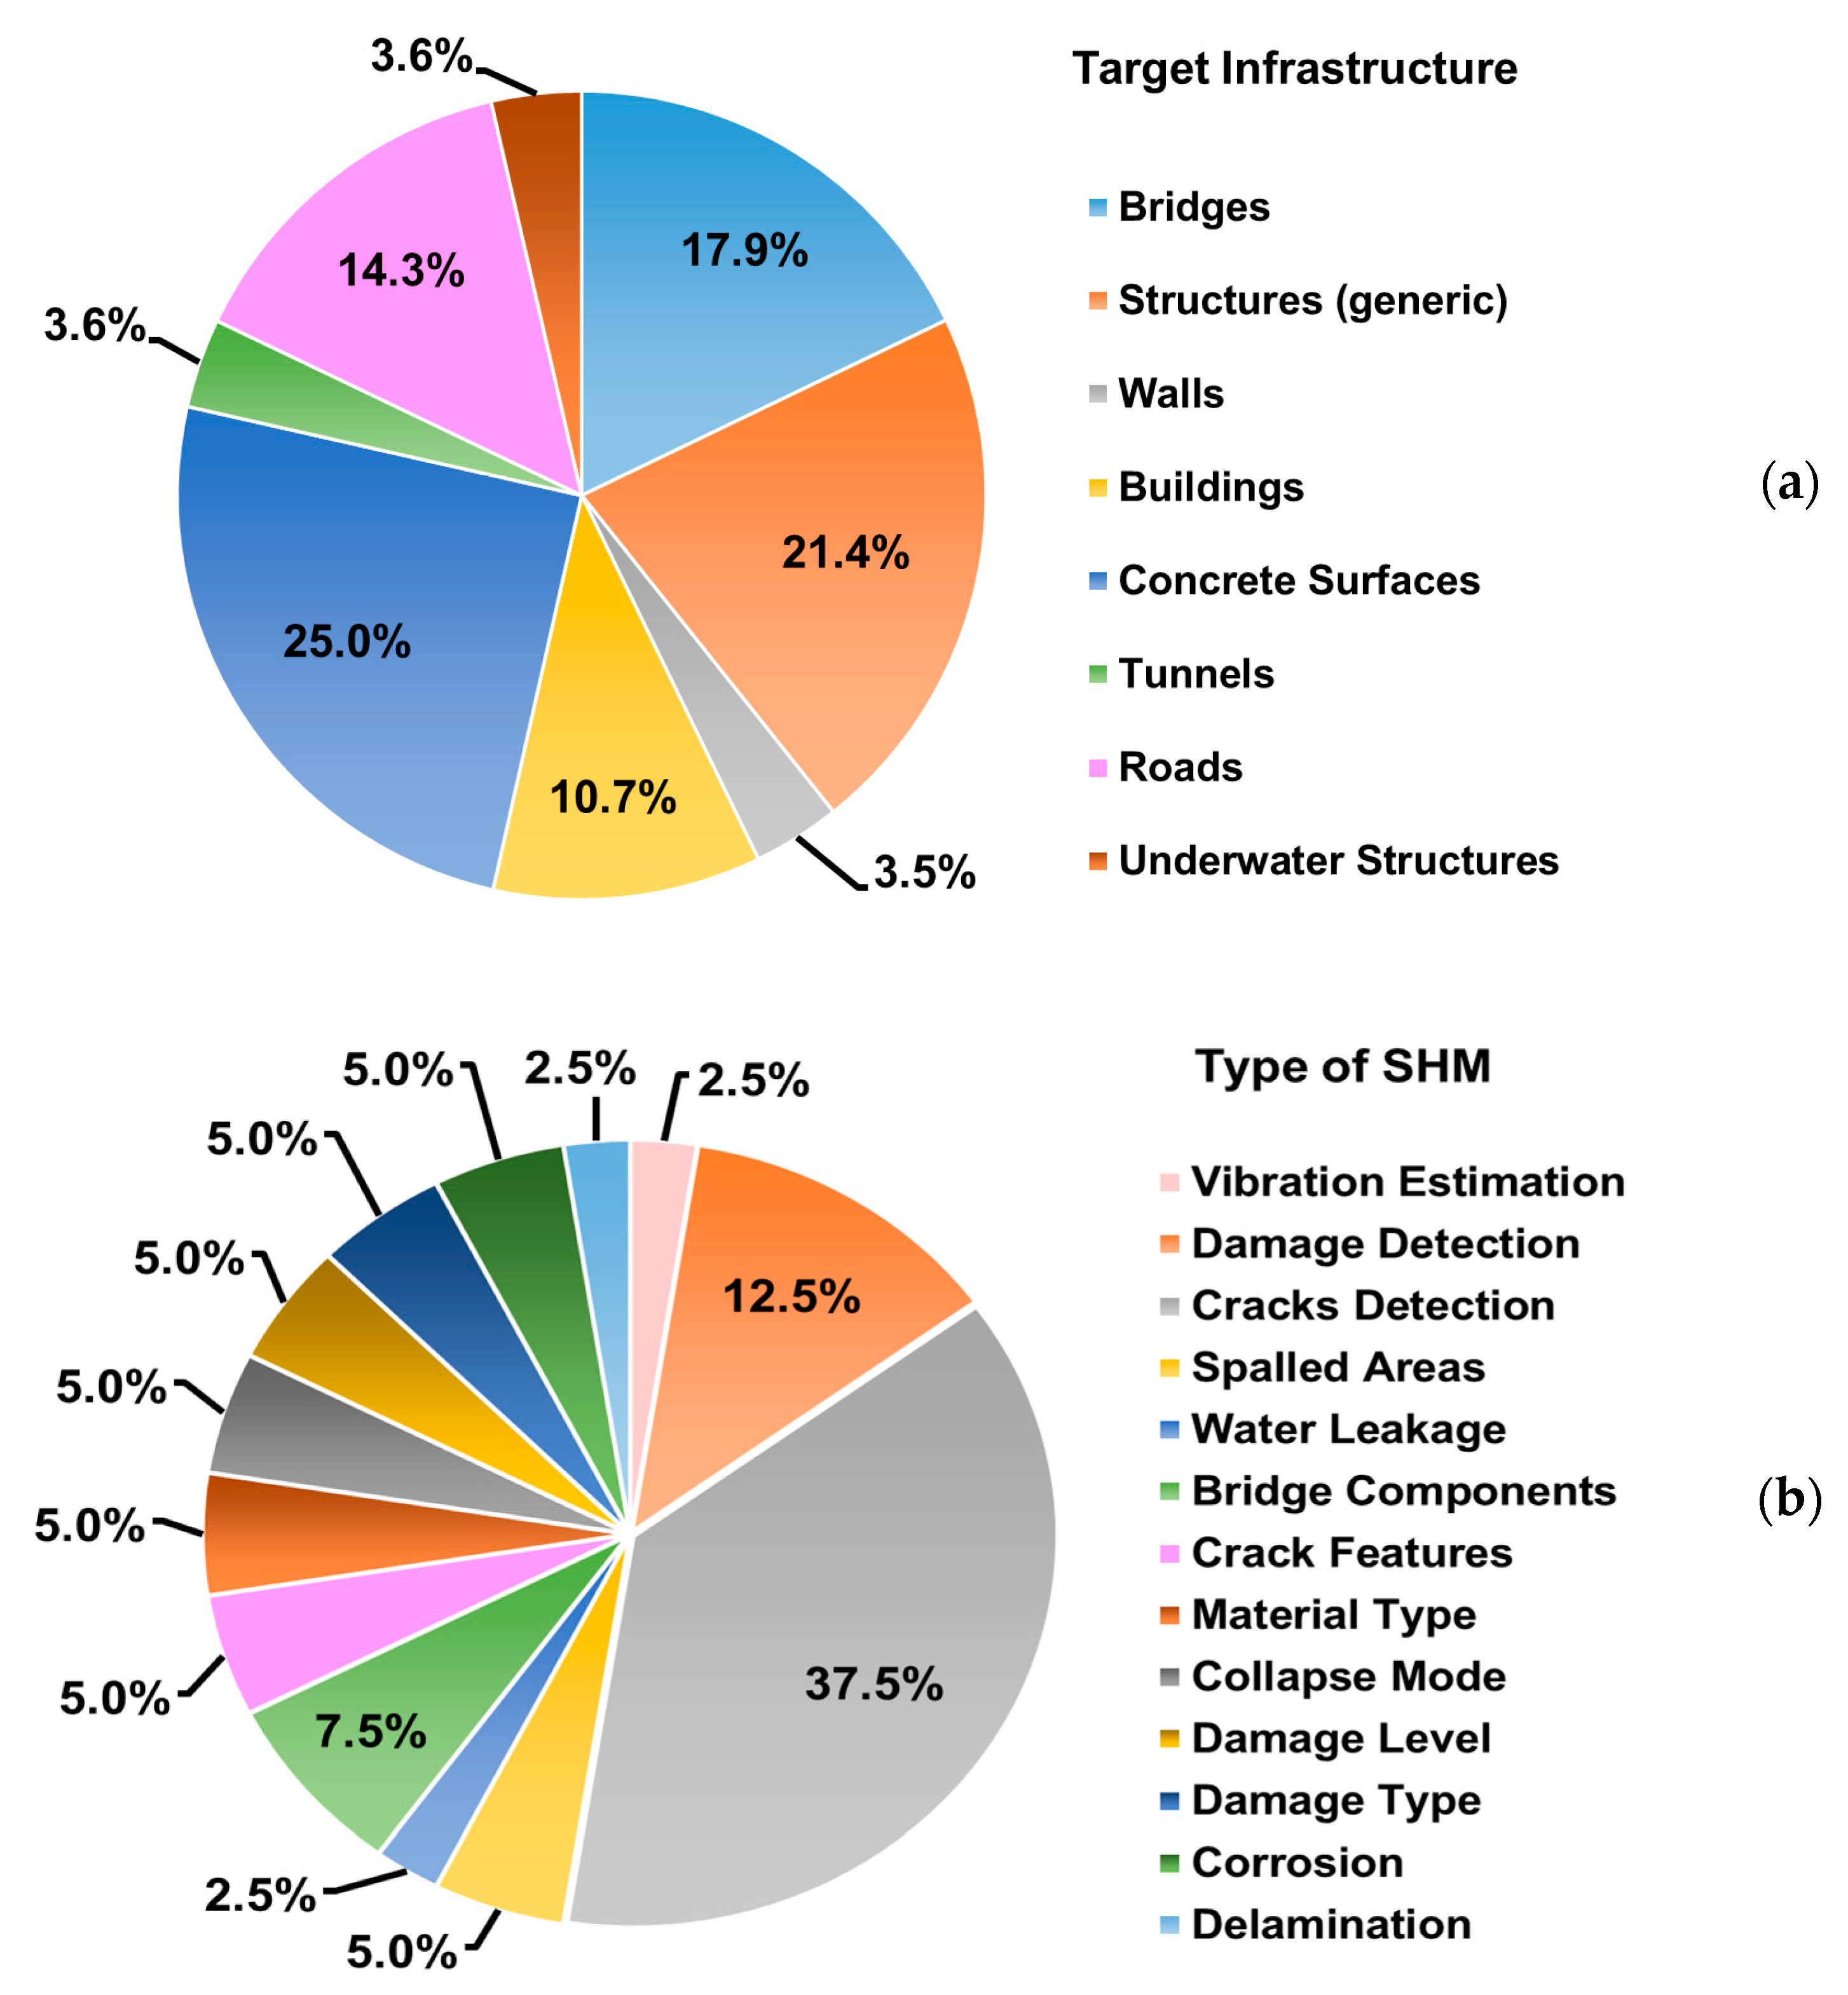
This section reports and discusses general statistical information about the studies in Table 2. The first analysis concerns the type of infrastructure addressed in the study and the type of SHM implemented (Figure 5a and Figure 5b, respectively).
The analysis revealed that frameworks using image datasets were implemented on different types of infrastructure, explicitly addressing more general targets (such as bridges, buildings, and concrete surfaces), as well as specific examples (such as underwater structures or tunnels). Again, the item “structures (generic)” refers to solutions suitable for multiple types of infrastructures, while the item “walls” could be equated with concrete surfaces.
Regarding the type of SHM, the analysis revealed more categories than the four that emerged for VSS. The two main ones (“cracks detection” and “damage detection”) are more generalized and typically concern the presence or absence of structural damage. The other categories, with much lower percentages, concern the detection of specific deteriorations and refer to a much finer classification of the type of damage. Obviously, this fineness is highly dependent on the availability of images supporting this type of investigation.
Additional relevant information about IDS concerns the hardware of the processing unit. The need for higher or lower performance hardware is closely related to the type of framework implemented. Deep learning-based solutions demand significant computational resources, particularly GPU, CPU, and RAM, to handle and process the images. Most studies have used very high-performance graphics cards (in particular, NVIDIA GeForce) and at least 8 GB of RAM (up to a maximum of 64 GB). In contrast, solutions using machine learning and computer vision are much less demanding in terms of computational resources, so much so that in most cases, the hardware configuration was not specified (3 out of 5 studies). The analysis also found that accuracy is the primary metric used to evaluate and compare performance among classification solutions (14 studies). More sporadically, some studies compared performance using MIoU (1 study), F1-score (3 studies), mean square error (1 study), segmentation indices (1 study), and AUC (1 study), whereas 3 studies did not expose a precise metric. Finally, although execution time is one of the crucial aspects of the classification process, only 5 studies have reported results in this regard.
As just pointed out, accuracy is one of the most widely used metrics in automated classification (i.e., detection and recognition of specific damage conditions) to evaluate the performance of networks and predictive models. However, accuracy highly depends on the number of classes to be recognized. The following sub-section provides a detailed analysis of the studies shown in Table 2 in regards to this aspect.
3.3.2. Type of Classification
Machine learning and deep learning approaches allow classification problems with different complexity to be addressed. In the field of SHM, this can lead to an architecture capable of detecting the presence or absence of a specific condition (i.e., binary classification), such as distinguishing structurally damaged areas from intact sections. Alternatively, they can be used for more specific classification purposes based on recognizing different categories of structural deficits (multi-class classification), identifying, for example, the type of damage, type of materials, shape of cracks, and other specific features. Table 3 provides a summary of the main types of classification addressed by studies using image datasets.
Regarding deep learning approaches, most of the selected studies addressed only binary classification problems, including [88,89,92,93,99,100,102,105,110]. Only a few studies also addressed multi-class classification problems in addition to binary classification, such as [86] (type of damage: four classes), [96] (bridge components: seven classes), [87] (several multi-class subsets), [104] (type of damage: three classes), [107] (several multi-class subsets), and [113] (type of damage: five classes). The authors of [105] also mentioned labeling for the multi-class classification of cracks based on their size (in mm), but they did not present the results of this task.
Pre-trained networks have also been combined with transfer learning processes to solve two common issues in DL: insufficient data to train networks from scratch and the reusability of pre-trained models to tackle similar tasks. This approach was used, for example, in [107], in which the authors used pre-trained neural networks to detect structural damage on images from other sources. Moreover, in [110], the authors investigated the potentiality of transfer learning to classify cracks on other materials and targets (cracks in pavement, concrete materials, and brickwork materials). The same occurred in [113], where the authors applied pre-trained models on a small set of images (only seven) taken from different infrastructures.
In addition, some studies have also applied deep learning models for purposes other than classification. For example, [92] proposed a method to estimate damage measurements using the neural network classification results (areas with damage). In [95], pre-trained models were used to estimate displacements (and vibrations) in structures at the sub-pixel level.
In contrast, only a few studies have adopted machine learning approaches based on supervised classifiers, which are less demanding in terms of computation time and architectural complexity. Among them, the authors in [101] implemented a cubic SVM classifier to identify cracked areas on concrete surfaces (binary classification) and to determine the characteristics (width and length) of single and multi-branch cracks on the recognized areas of damage. In [106], a machine learning approach with an SVM classifier was used to detect areas of pitting corrosion. In [111], the AdaBoost algorithm [112] was used to discriminate between areas with and without cracks.
The category related to image databases also includes studies that take advantage of classical computer vision and image processing techniques to improve image quality and, consequently, the accuracy of defect detection. For example, the authors in [103] proposed a de-noising filter to retain the edges and details of concrete surface images, which allows for improvement of the image quality and detection of the finest cracks. The proposed algorithm was compared similar approaches used in five different studies in the literature. The results showed a reduction in mean square error (MSE) between 36.3% and 73.6%, an increase in peak-to-noise ratio (PSNR) between 7.6% and 54.2%, and an increase in mean structural similarity (MSSIM) between 2.4% and 45.1%. A combined strategy based on high boost filtering and enhanced thresholding was proposed in [108], which outperformed other thresholding techniques in terms of Dice and Jaccard’s [109] average indices (+0.1103 and +0.2078, respectively), demonstrating the best similarity between processed and original images, and consequently, better image quality that could be useful and necessary to increase the accuracy in finer damage detection.
4. Discussion
This paper provides an overview of recent applications (2018–2022) in structural health monitoring using optical devices (in particular, standard color cameras), computer vision, and image and video signals. To this end, we queried two electronic reference databases (Scopus and the Web of Science) using the built-in functions to select studies with specific mandatory and optional keywords in their title and abstract. The automatically selected items were then manually screened against pre-established eligibility criteria, ultimately including 73 articles, which we subsequently analyzed in detail, in this review.
Two interesting aspects emerge from the first, more general analysis of the selected studies. The first one is the preliminary breakdown of the studies into two macro-categories: those implementing vision systems (71%) and those using image databases (29%), in most cases, made available by other studies. While the first group was fairly expected, having used terms commonly used in the field of vision-based systems in the optional keywords, the second category, however significant, was somewhat unexpected, considering no related terms were used in the queries. This fact is explainable if we consider that these studies deal with one of the components of a vision-based system, namely image and video processing, regardless of the acquisition phase and data source. However, this group was undoubtedly underestimated here compared with what is available in the literature, and it has been analyzed in recent dedicated reviews [16,114,115]. Nevertheless, this review also considered these studies as resulting from the selection process.
The second aspect is the sharply increasing trend (+61.5%) in the number of SHM applications over a relatively short observation period (only the last five years). This result confirms findings from papers over extended periods (fifteen years) that pointed out the rapid escalation of vision-based solutions and automatic learning approaches [8].
The in-depth analysis showed that VSS studies mainly focus on bridges (35.7%) and buildings (25.0%). Moreover, some solutions address specific targets (e.g., towers, retention basins). On the contrary, 19.6% of the studies report a more general target (category “structure (generic)”). Regarding IDS, the main target infrastructures are the same (bridges, buildings, and general structures). However, the highest percentage (25%) concerns concrete surfaces, probably because several databases containing thousands of images acquired for this purpose are available. In addition, as with vision-based systems, some studies address specific infrastructures (such as tunnels and underwater structures).
Regarding the type of SHM, VSS are distributed into four clusters, with a predominance of studies focused on estimating displacements and vibrations (77.4%) rather than on detecting structural damage and cracks on the surface (22.6%). In contrast, IDS studies clearly dominate in structural damage and crack detection (50%). However, 47.5% of the remainder are focused on detecting and recognizing specific damage conditions; therefore, they are always attributable to the two predominant clusters. Unlike VSS, only 2.5% of the studies focused on vibration estimation.
Going into more detail, the full-text analysis of VSS showed that 85% of the studies implemented a single-camera system, thus overcoming the problems related to the calibration of multiple cameras; 19% of the studies used smartphone cameras, trying to switch to more widespread and low-cost sensors; and about 15% of the studies took advantage from emerging technologies (UAVs, USVs, and robots) for support for reaching remote locations. In addition, 63% of the studies verified the accuracy of measurements through a validation procedure with other systems/sensors commonly used as gold standards in SHM applications. The main limitations of VSS, which emerged during the analysis, concern the following: (i) improving robustness and accuracy through optimization algorithms [54,63,71,73]; (ii) the lack of real-world scenarios (only 46% of the studies proposed in-field tests on real-world structures); (iii) the use of specific targets [67,81,82]; (iv) constraints on image and video sizes [60,64,76,77,83]; and (v) the effects of environmental and weather conditions that can affect performance (44% of the studies proposed only indoor and scaled-target experimental scenarios, with controlled lightning and environmental conditions). This last point is fundamental when using technologies and support aids such as UAVs and tripods. For example, wind can alter the camera stability (and consequently, the performance) if not suitably compensated for. At the same time, poor lighting (due to rain, fog, or evening hours) can reduce visibility and the accuracy of measurements [69,75].
The analysis performed on IDS showed that only three studies implemented a framework based on supervised classifiers (machine learning approach) and two studies based on computer vision. In contrast, 76% of the studies investigated deep learning approaches. Almost 43% of the studies addressed only binary classification, thus determining whether an area is damaged or undamaged. Only 28.5% of the studies also addressed multi-class classification purposes, mainly related to identifying the type of damage, type of materials, and structural components. Finally, three studies investigated the potential of transfer learning, i.e., using a pre-trained model for a different task to overcome issues related to the time to train a network/model from scratch. This approach was used in [107,110,113], which use pre-trained neural networks on images from different sources, targets, materials, and infrastructures. The main limitations of IDS concern the following: (i) in general, the results are presented only on images from the original datasets (through training, validation, and testing phases), without testing trained models on different images, except in [110,111,113]; (ii) the use of training datasets of limited size, as in [95,103,106]; (iii) a lower agreement between labelers of damaged areas, as in [104]; (iv) the model performance was dependent on image resolution and quality [101,107,111]; (v) the need for high-performance hardware (especially for deep learning networks) to manage training phases and optimize execution time on larger image databases; and (vi) high accuracy in binary classification, but lower performance in multi-class classification.
Despite the problems and challenges remaining, this review has highlighted the potential of computer vision and image processing in the context of SHM. There is undoubtedly ample room for improvement to overcome the major weaknesses highlighted by the analysis of selected VSS and IDS studies. Nevertheless, thanks to constant technological progress, the availability of increasingly high-performance resources, and the growing interest in the creation of large image databases (also exploiting techniques such as transfer learning and data augmentation), these methodologies will respond more and more comprehensively to the specific requirements of structural health monitoring, as is already happening in the field of human health [116,117,118,119,120,121].
5. Conclusions
Structural health monitoring has received significant attention in recent decades because of the importance of keeping infrastructure in good condition and in full working order. Non-contact solutions are gradually finding application in this area because they are easier to manage and more practical than contact-based approaches. Among these, solutions based on cameras, computer vision, imaging, and video processing are proving particularly effective because they provide the ability to carry out visual inspections with more continuity, even in hard-to-reach areas, thanks in part to the support of new technologies (drones and robots) that can operate remotely. A further impetus comes from the potential offered by automatic classification algorithms (machine and deep learning approaches) that, thanks to increasingly high-performance hardware, make it possible to detect and recognize the type and level of structural damage. This trend is expected to increase in the coming years, also benefiting from the data fusion of multiple sensors for the increasingly timely and comprehensive detection of structural damage and the activation of appropriate maintenance actions, thus ensuring the safety and efficiency of civil infrastructure.
However, several challenges still need to be addressed to achieve the maximum benefits of these approaches, especially in real-world scenarios [26]. For example, when using optical approaches, environmental conditions (light changes, weather events, obstructive elements) can interfere with structural monitoring. Another factor concerns the effect of vibrations caused by the ground or wind, which can make the image captured by a fixed camera or drone blurry, thus altering the performance, especially over long distances. Another major challenge relates to the amount of data to be managed, stored, and/or transmitted; for example, in long-term monitoring, images and videos, particularly when high resolution is necessary, are large and require special attention for their use, especially in automated and remote damage assessment solutions. In addition, machine learning and deep learning approaches, which can support automatic damage recognition and localization, require huge datasets of images with well-labeled damage to be effective and accurate. Nevertheless, the availability of larger datasets could be addressed by merging smaller datasets, using transfer learning, or through data augmentation approaches. All these factors may affect the applicability of optical approaches in SHM or introduce uncertainties in measurements, so they need to be considered during data acquisition and processing. However, these are well-known problems in computer vision, and ad hoc solutions can be designed to solve and overcome these limitations, as has been done in other fields, benefiting from the use of these approaches for SHM as well.
Author Contributions
Conceptualization, C.F.; methodology, C.F., G.A. and G.P.; software, C.F.; validation, C.F., G.A. and G.P.; formal analysis, C.F., G.A. and G.P.; investigation, C.F., G.A. and G.P.; resources, C.F., G.A. and G.P.; data curation, C.F., G.A. and G.P.; writing—original draft preparation, C.F. and G.P.; writing—review and editing, C.F., G.A. and G.P.; visualization, C.F.; supervision, C.F. All authors have read and agreed to the published version of the manuscript.
Funding
This research received no external funding.
Institutional Review Board Statement
Not applicable.
Informed Consent Statement
Not applicable.
Data Availability Statement
Not applicable.
Conflicts of Interest
The authors declare no conflict of interest.
References
- Thacker, S.; Adshead, D.; Fay, M.; Hallegatte, S.; Harvey, M.; Meller, H.; O’Regan, N.; Rozenberg, J.; Watkins, G.; Hall, J.W. Infrastructure for sustainable development. Nat. Sustain. 2019, 2, 324–331. [Google Scholar] [CrossRef]
- Palei, T. Assessing the Impact of Infrastructure on Economic Growth and Global Competitiveness. Procedia Econ. Financ. 2015, 23, 168–175. [Google Scholar] [CrossRef] [Green Version]
- Latham, A.; Layton, J. Social infrastructure and the public life of cities: Studying urban sociality and public spaces. Geogr. Compass 2019, 13, e12444. [Google Scholar] [CrossRef] [Green Version]
- Frangopol, D.; Soliman, M.S. Life-cycle of structural systems: Recent achievements and future directions. Struct. Infrastruct. Eng. 2016, 12, 1–20. [Google Scholar] [CrossRef]
- Zhu, J.; Zhang, C.; Qi, H.; Lu, Z. Vision-based defects detection for bridges using transfer learning and convolutional neural networks. Struct. Infrastruct. Eng. 2019, 16, 1037–1049. [Google Scholar] [CrossRef]
- Kim, H.; Ahn, E.; Shin, M.; Sim, S.-H. Crack and Noncrack Classification from Concrete Surface Images Using Machine Learning. Struct. Health Monit. 2018, 18, 725–738. [Google Scholar] [CrossRef]
- Ebrahimkhanlou, A.; Farhidzadeh, A.; Salamone, S. Multifractal analysis of crack patterns in reinforced concrete shear walls. Struct. Health Monit. 2016, 15, 81–92. [Google Scholar] [CrossRef]
- Yeom, J.; Jeong, S.; Woo, H.-G.; Sim, S.-H. Capturing research trends in structural health monitoring using bibliometric analysis. Smart Struct. Syst. 2022, 29, 361–374. [Google Scholar]
- Li, H.-N.; Ren, L.; Jia, Z.-G.; Yi, T.-H.; Li, D.-S. State-of-the-art in structural health monitoring of large and complex civil infrastructures. J. Civ. Struct. Health Monit. 2015, 6, 3–16. [Google Scholar] [CrossRef]
- AlHamaydeh, M.; Aswad, N.G. Structural Health Monitoring Techniques and Technologies for Large-Scale Structures: Challenges, Limitations, and Recommendations. Pract. Period. Struct. Des. Constr. 2022, 27, 03122004. [Google Scholar] [CrossRef]
- Sony, S.; LaVenture, S.; Sadhu, A. A literature review of next-generation smart sensing technology in structural health monitoring. Struct. Control Health Monit. 2019, 26, e2321. [Google Scholar] [CrossRef]
- Gordan, M.; Sabbagh-Yazdi, S.-R.; Ismail, Z.; Ghaedi, K.; Carroll, P.; McCrum, D.; Samali, B. State-of-the-art review on advancements of data mining in structural health monitoring. Measurement 2022, 193, 110939. [Google Scholar] [CrossRef]
- Gordan, M.; Chao, O.Z.; Sabbagh-Yazdi, S.-R.; Wee, L.K.; Ghaedi, K.; Ismail, Z. From Cognitive Bias toward Advanced Computational Intelligence for Smart Infrastructure Monitoring. Front. Psychol. 2022, 13, 846610. [Google Scholar] [CrossRef] [PubMed]
- Gordan, M.; Razak, H.A.; Ismail, Z.; Ghaedi, K. Recent Developments in Damage Identification of Structures Using Data Mining. Lat. Am. J. Solids Struct. 2017, 14, 2373–2401. [Google Scholar] [CrossRef]
- Ghaedi, K.; Gordan, M.; Ismail, Z.; Hashim, H.; Talebkhah, M. A Literature Review on the Development of Remote Sensing in Damage Detection of Civil Structures. J. Eng. Res. Rep. 2021, 39–56. [Google Scholar] [CrossRef]
- Azimi, M.; Eslamlou, A.D.; Pekcan, G. Data-Driven Structural Health Monitoring and Damage Detection through Deep Learning: State-of-the-Art Review. Sensors 2020, 20, 2778. [Google Scholar] [CrossRef]
- Poorghasem, S.; Bao, Y. Review of robot-based automated measurement of vibration for civil engineering structures. Measurement 2023, 207, 112382. [Google Scholar] [CrossRef]
- Ye, X.W.; Dong, C.Z.; Liu, T. A Review of Machine Vision-Based Structural Health Monitoring: Methodologies and Applications. J. Sens. 2016, 2016, 7103039. [Google Scholar] [CrossRef] [Green Version]
- Carroll, S.; Satme, J.; Alkharusi, S.; Vitzilaios, N.; Downey, A.; Rizos, D. Drone-Based Vibration Monitoring and Assessment of Structures. Appl. Sci. 2021, 11, 8560. [Google Scholar] [CrossRef]
- Tian, Y.; Chen, C.; Sagoe-Crentsil, K.; Zhang, J.; Duan, W. Intelligent robotic systems for structural health monitoring: Applications and future trends. Autom. Constr. 2022, 139, 104273. [Google Scholar] [CrossRef]
- Yang, L.; Fu, C.; Li, Y.; Su, L. Survey and study on intelligent monitoring and health management for large civil structure. Int. J. Intell. Robot. Appl. 2019, 3, 239–254. [Google Scholar] [CrossRef]
- Matarazzo, T.; Vazifeh, M.; Pakzad, S.; Santi, P.; Ratti, C. Smartphone data streams for bridge health monitoring. Procedia Eng. 2017, 199, 966–971. [Google Scholar] [CrossRef]
- Mishra, M.; Lourenço, P.B.; Ramana, G. Structural health monitoring of civil engineering structures by using the internet of things: A review. J. Build. Eng. 2022, 48, 103954. [Google Scholar] [CrossRef]
- Feng, D.; Feng, M.Q. Computer vision for SHM of civil infrastructure: From dynamic response measurement to damage detection—A review. Eng. Struct. 2018, 156, 105–117. [Google Scholar] [CrossRef]
- Spencer, B.F., Jr.; Hoskere, V.; Narazaki, Y. Advances in Computer Vision-Based Civil Infrastructure Inspection and Monitoring. Engineering 2019, 5, 199–222. [Google Scholar] [CrossRef]
- Dong, C.-Z.; Catbas, F.N. A review of computer vision–based structural health monitoring at local and global levels. Struct. Health Monit. 2020, 20, 692–743. [Google Scholar] [CrossRef]
- Koch, C.; Georgieva, K.; Kasireddy, V.; Akinci, B.; Fieguth, P. A review on computer vision based defect detection and condition assessment of concrete and asphalt civil infrastructure. Adv. Eng. Inform. 2015, 29, 196–210. [Google Scholar] [CrossRef] [Green Version]
- Bao, Y.; Tang, Z.; Li, H.; Zhang, Y. Computer vision and deep learning–based data anomaly detection method for structural health monitoring. Struct. Health Monit. 2018, 18, 401–421. [Google Scholar] [CrossRef]
- Zhuang, Y.; Chen, W.; Jin, T.; Chen, B.; Zhang, H.; Zhang, W. A Review of Computer Vision-Based Structural Deformation Monitoring in Field Environments. Sensors 2022, 22, 3789. [Google Scholar] [CrossRef]
- Page, M.J.; Moher, D.; Bossuyt, P.M.; Boutron, I.; Hoffmann, T.C.; Mulrow, C.D.; Shamseer, L.; Tetzlaff, J.M.; Akl, E.A.; Brennan, S.E.; et al. PRISMA 2020 explanation and elaboration: Updated guidance and exemplars for reporting systematic reviews. BMJ 2021, 372, n160. [Google Scholar] [CrossRef]
- PRISMA Flow Diagram. Available online: http://www.prisma-statement.org/PRISMAStatement/FlowDiagram.aspx (accessed on 14 April 2023).
- Zhu, Q.; Cui, D.; Zhang, Q.; Du, Y. A robust structural vibration recognition system based on computer vision. J. Sound Vib. 2022, 541, 117321. [Google Scholar] [CrossRef]
- Gonen, S.; Erduran, E. A Hybrid Method for Vibration-Based Bridge Damage Detection. Remote Sens. 2022, 14, 6054. [Google Scholar] [CrossRef]
- Shao, Y.; Li, L.; Li, J.; An, S.; Hao, H. Target-free 3D tiny structural vibration measurement based on deep learning and motion magnification. J. Sound Vib. 2022, 538, 117244. [Google Scholar] [CrossRef]
- Sarlin, P.E.; DeTone, D.; Malisiewicz, T.; Rabinovich, A. SuperGlue: Learning Feature Matching With Graph Neural Networks. In Proceedings of the 2020 IEEE/CVF Conference on Computer Vision and Pattern Recognition (CVPR), Seattle, WA, USA, 14–19 June 2020; pp. 4937–4946. [Google Scholar]
- Peroš, J.; Paar, R.; Divić, V.; Kovačić, B. Fusion of Laser Scans and Image Data—RGB+D for Structural Health Monitoring of Engineering Structures. Appl. Sci. 2022, 12, 11763. [Google Scholar] [CrossRef]
- Lee, Y.; Lee, G.; Moon, D.S.; Yoon, H. Vision-based displacement measurement using a camera mounted on a structure with stationary background targets outside the structure. Struct. Control Health Monit. 2022, 29, e3095. [Google Scholar] [CrossRef]
- Chen, Z.-W.; Ruan, X.-Z.; Liu, K.-M.; Yan, W.-J.; Liu, J.-T.; Ye, D.-C. Fully automated natural frequency identification based on deep-learning-enhanced computer vision and power spectral density transmissibility. Adv. Struct. Eng. 2022, 25, 2722–2737. [Google Scholar] [CrossRef]
- Cabo, C.T.D.; Valente, N.A.; Mao, Z. A Comparative Analysis of Imaging Processing Techniques for Non-Invasive Structural Health Monitoring. IFAC-Pap. 2022, 55, 150–154. [Google Scholar] [CrossRef]
- Kumarapu, K.; Mesapam, S.; Keesara, V.R.; Shukla, A.K.; Manapragada, N.V.S.K.; Javed, B. RCC Structural Deformation and Damage Quantification Using Unmanned Aerial Vehicle Image Correlation Technique. Appl. Sci. 2022, 12, 6574. [Google Scholar] [CrossRef]
- Wu, T.; Tang, L.; Shao, S.; Zhang, X.; Liu, Y.; Zhou, Z.; Qi, X. Accurate structural displacement monitoring by data fusion of a consumer-grade camera and accelerometers. Eng. Struct. 2022, 262, 114303. [Google Scholar] [CrossRef]
- Weng, Y.; Lu, Z.; Lu, X.; Spencer, B.F. Visual–inertial structural acceleration measurement. Comput.-Aided Civ. Infrastruct. Eng. 2022, 37, 1146–1159. [Google Scholar] [CrossRef]
- Lucas, B.; Kanade, T. An iterative image registration technique with an application to stereo vision. In Proceedings of the International Joint Conference on Artificial Intelligence, Vancouver, BC, Canada, 24–28 August 1981; pp. 674–679. [Google Scholar]
- Sangirardi, M.; Altomare, V.; De Santis, S.; de Felice, G. Detecting Damage Evolution of Masonry Structures through Computer-Vision-Based Monitoring Methods. Buildings 2022, 12, 831. [Google Scholar] [CrossRef]
- Parente, L.; Falvo, E.; Castagnetti, C.; Grassi, F.; Mancini, F.; Rossi, P.; Capra, A. Image-Based Monitoring of Cracks: Effectiveness Analysis of an Open-Source Machine Learning-Assisted Procedure. J. Imaging 2022, 8, 22. [Google Scholar] [CrossRef] [PubMed]
- Ri, S.; Wang, Q.; Tsuda, H.; Shirasaki, H.; Kuribayashi, K. Deflection Measurement of Bridge Using Images Captured Under the Bridge by Sampling Moiré Method. Exp. Tech. 2022, 1–11. [Google Scholar] [CrossRef]
- Belcore, E.; Di Pietra, V.; Grasso, N.; Piras, M.; Tondolo, F.; Savino, P.; Polania, D.R.; Osello, A. Towards a FOSS Automatic Classification of Defects for Bridges Structural Health Monitoring. In Geomatics and Geospatial Technologies; Borgogno-Mondino, E., Zamperlin, P., Eds.; ASITA 2021; Communications in Computer and Information Science; Springer: Cham, Switzerland, 2022; Volume 1507, pp. 298–312. [Google Scholar]
- Zhu, M.; Feng, Y.; Zhang, Y.; Zhang, Q.; Shen, T.; Zhang, B. A Noval Building Vibration Measurement system based on Computer Vision Algorithms. In Proceedings of the 2022 IEEE 17th Conference on Industrial Electronics and Applications (ICIEA), Chengdu, China, 16–19 December 2022; pp. 1146–1150. [Google Scholar]
- Liu, T.; Lei, Y.; Mao, Y. Computer Vision-Based Structural Displacement Monitoring and Modal Identification with Subpixel Localization Refinement. Adv. Civ. Eng. 2022, 2022, 5444101. [Google Scholar] [CrossRef]
- Wu, T.; Tang, L.; Shao, S.; Zhang, X.-Y.; Liu, Y.-J.; Zhou, Z.-X. Cost-effective, vision-based multi-target tracking approach for structural health monitoring. Meas. Sci. Technol. 2021, 32, 125116. [Google Scholar] [CrossRef]
- Mendrok, K.; Dworakowski, Z.; Dziedziech, K.; Holak, K. Indirect Measurement of Loading Forces with High-Speed Camera. Sensors 2021, 21, 6643. [Google Scholar] [CrossRef]
- Zhao, S.; Kang, F.; Li, J.; Ma, C. Structural health monitoring and inspection of dams based on UAV photogrammetry with image 3D reconstruction. Autom. Constr. 2021, 130, 103832. [Google Scholar] [CrossRef]
- Alzughaibi, A.A.; Ibrahim, A.M.; Na, Y.; El-Tawil, S.; Eltawil, A.M. Community-Based Multi-Sensory Structural Health Monitoring System: A Smartphone Accelerometer and Camera Fusion Approach. IEEE Sens. J. 2021, 21, 20539–20551. [Google Scholar] [CrossRef]
- Chou, J.-Y.; Chang, C.-M. Image Motion Extraction of Structures Using Computer Vision Techniques: A Comparative Study. Sensors 2021, 21, 6248. [Google Scholar] [CrossRef]
- Zhou, Z.; Shao, S.; Deng, G.; Gao, Y.; Wang, S.; Chu, X. Vision-based modal parameter identification for bridges using a novel holographic visual sensor. Measurement 2021, 179, 109551. [Google Scholar] [CrossRef]
- Attard, L.; Debono, C.J.; Valentino, G.; Di Castro, M. Vision-Based Tunnel Lining Health Monitoring via Bi-Temporal Image Comparison and Decision-Level Fusion of Change Maps. Sensors 2021, 21, 4040. [Google Scholar] [CrossRef] [PubMed]
- Obiechefu, C.B.; Kromanis, R. Damage detection techniques for structural health monitoring of bridges from computer vision derived parameters. Struct. Monit. Maint. 2021, 8, 91–110. [Google Scholar]
- Lydon, D.; Lydon, M.; Kromanis, R.; Dong, C.-Z.; Catbas, N.; Taylor, S. Bridge Damage Detection Approach Using a Roving Camera Technique. Sensors 2021, 21, 1246. [Google Scholar] [CrossRef]
- Hosseinzadeh, A.Z.; Tehrani, M.; Harvey, P. Modal identification of building structures using vision-based measurements from multiple interior surveillance cameras. Eng. Struct. 2020, 228, 111517. [Google Scholar] [CrossRef]
- Civera, M.; Fragonara, L.Z.; Antonaci, P.; Anglani, G.; Surace, C. An Experimental Validation of Phase-Based Motion Magnification for Structures with Developing Cracks and Time-Varying Configurations. Shock. Vib. 2021, 2021, 5518163. [Google Scholar] [CrossRef]
- Zhu, J.; Lu, Z.; Zhang, C. A marker-free method for structural dynamic displacement measurement based on optical flow. Struct. Infrastruct. Eng. 2020, 18, 84–96. [Google Scholar] [CrossRef]
- Yang, Y.-S.; Xue, Q.; Chen, P.-Y.; Weng, J.-H.; Li, C.-H.; Liu, C.-C.; Chen, J.-S.; Chen, C.-T. Image Analysis Applications for Building Inter-Story Drift Monitoring. Appl. Sci. 2020, 10, 7304. [Google Scholar] [CrossRef]
- Guo, J.; Xiang, Y.; Fujita, K.; Takewaki, I. Vision-Based Building Seismic Displacement Measurement by Stratification of Projective Rectification Using Lines. Sensors 2020, 20, 5775. [Google Scholar] [CrossRef]
- Erdogan, Y.S.; Ada, M. A computer-vision based vibration transducer scheme for structural health monitoring applications. Smart Mater. Struct. 2020, 29, 085007. [Google Scholar] [CrossRef]
- Khuc, T.; Nguyen, T.A.; Dao, H.; Catbas, F.N. Swaying displacement measurement for structural monitoring using computer vision and an unmanned aerial vehicle. Measurement 2020, 159, 107769. [Google Scholar] [CrossRef]
- Xiao, P.; Wu, Z.Y.; Christenson, R.; Lobo-Aguilar, S. Development of video analytics with template matching methods for using camera as sensor and application to highway bridge structural health monitoring. J. Civ. Struct. Health Monit. 2020, 10, 405–424. [Google Scholar] [CrossRef]
- Hsu, T.-Y.; Kuo, X.-J. A Stand-Alone Smart Camera System for Online Post-Earthquake Building Safety Assessment. Sensors 2020, 20, 3374. [Google Scholar] [CrossRef] [PubMed]
- Fradelos, Y.; Thalla, O.; Biliani, I.; Stiros, S. Study of Lateral Displacements and the Natural Frequency of a Pedestrian Bridge Using Low-Cost Cameras. Sensors 2020, 20, 3217. [Google Scholar] [CrossRef]
- Lee, J.; Lee, K.-C.; Jeong, S.; Lee, Y.-J.; Sim, S.-H. Long-term displacement measurement of full-scale bridges using camera ego-motion compensation. Mech. Syst. Signal Process. 2020, 140, 106651. [Google Scholar] [CrossRef]
- Li, J.; Xie, B.; Zhao, X. Measuring the interstory drift of buildings by a smartphone using a feature point matching algorithm. Struct. Control Health Monit. 2020, 27, e2492. [Google Scholar] [CrossRef]
- Miura, K.; Tsuruta, T.; Osa, A. An estimation method of the camera fluctuation for a video-based vibration measurement. In Proceedings of the International Workshop on Advanced Imaging Technologies 2020 (IWAIT 2020), Yogyakarta, Indonesia, 5–7 January 2020. [Google Scholar]
- Medhi, M.; Dandautiya, A.; Raheja, J.L. Real-Time Video Surveillance Based Structural Health Monitoring of Civil Structures Using Artificial Neural Network. J. Nondestruct. Eval. 2019, 38, 63. [Google Scholar] [CrossRef]
- Yang, Y.-S. Measurement of Dynamic Responses from Large Structural Tests by Analyzing Non-Synchronized Videos. Sensors 2019, 19, 3520. [Google Scholar] [CrossRef] [Green Version]
- Won, J.; Park, J.-W.; Park, K.; Yoon, H.; Moon, D.-S. Non-Target Structural Displacement Measurement Using Reference Frame-Based Deepflow. Sensors 2019, 19, 2992. [Google Scholar] [CrossRef] [Green Version]
- Hoskere, V.; Park, J.-W.; Yoon, H.; Spencer Jr, B.F. Vision-Based Modal Survey of Civil Infrastructure Using Unmanned Aerial Vehicles. J. Struct. Eng. 2019, 145, 04019062. [Google Scholar] [CrossRef]
- Kuddus, M.A.; Li, J.; Hao, H.; Li, C.; Bi, K. Target-free vision-based technique for vibration measurements of structures subjected to out-of-plane movements. Eng. Struct. 2019, 190, 210–222. [Google Scholar] [CrossRef]
- Aliansyah, Z.; Jiang, M.; Takaki, T.; Ishii, I. High-speed Vision System for Dynamic Structural Distributed Displacement Analysis. J. Phys. Conf. Ser. 2018, 1075, 012014. [Google Scholar] [CrossRef]
- Mangini, F.; D’alvia, L.; Del Muto, M.; Dinia, L.; Federici, E.; Palermo, E.; Del Prete, Z.; Frezza, F. Tag recognition: A new methodology for the structural monitoring of cultural heritage. Measurement 2018, 127, 308–313. [Google Scholar] [CrossRef]
- Kang, D.; Cha, Y.-J. Autonomous UAVs for Structural Health Monitoring Using Deep Learning and an Ultrasonic Beacon System with Geo-Tagging. Comput.-Aided Civ. Infrastruct. Eng. 2018, 33, 885–902. [Google Scholar] [CrossRef]
- Yang, Y.-S.; Wu, C.-L.; Hsu, T.T.; Yang, H.-C.; Lu, H.-J.; Chang, C.-C. Image analysis method for crack distribution and width estimation for reinforced concrete structures. Autom. Constr. 2018, 91, 120–132. [Google Scholar] [CrossRef]
- Omidalizarandi, M.; Kargoll, B.; Paffenholz, J.-A.; Neumann, I. Accurate vision-based displacement and vibration analysis of bridge structures by means of an image-assisted total station. Adv. Mech. Eng. 2018, 10. [Google Scholar] [CrossRef]
- Wang, N.; Ri, K.; Liu, H.; Zhao, X. Notice of Removal: Structural Displacement Monitoring Using Smartphone Camera and Digital Image Correlation. IEEE Sens. J. 2018, 18, 4664–4672. [Google Scholar] [CrossRef]
- Yoon, H.; Shin, J.; Spencer, B.F., Jr. Structural displacement measurement using an unmanned aerial system. Comput. Aided Civ. Infrastruct. Eng. 2018, 33, 183–192. [Google Scholar] [CrossRef]
- Shojaei, A.; Moud, H.I.; Razkenari, M.; Flood, I. Feasibility Study of Small Unmanned Surface Vehicle Use in Built Environment Assessment. In Proceedings of the 2018 IISE Annual Conference, Orlando, FL, USA, 19–22 May 2018. [Google Scholar]
- Hayakawa, T.; Moko, Y.; Morishita, K.; Ishikawa, M. Pixel-wise deblurring imaging system based on active vision for structural health monitoring at a speed of 100 km/h. In Proceedings of the Tenth International Conference on Machine Vision (ICMV 2017), Vienna, Austria, 13–15 November 2017; Zhou, J., Radeva, P., Nikolaev, D., Verikas, A., Eds.; SPIE: Vienna, Austria, 2018; p. 26. [Google Scholar]
- Gao, Y.; Mosalam, K.M. Deep learning visual interpretation of structural damage images. J. Build. Eng. 2022, 60, 105144. [Google Scholar] [CrossRef]
- Gao, Y.; Mosalam, K.M. PEER Hub ImageNet (Φ-Net): A Large-Scale Multi-Attribute Benchmark Dataset of Structural Images; PEER Report No. 2019/07; University of California: Berkeley, CA, USA, 2019. [Google Scholar]
- Qiu, D.; Liang, H.; Wang, Z.; Tong, Y.; Wan, S. Hybrid-Supervised-Learning-Based Automatic Image Segmentation for Water Leakage in Subway Tunnels. Appl. Sci. 2022, 12, 11799. [Google Scholar] [CrossRef]
- Mahenge, S.F.; Wambura, S.; Jiao, L. A Modified U-Net Architecture for Road Surfaces Cracks Detection. In Proceedings of the 8th International Conference on Computing and Artificial Intelligence, Tianjin, China, 18–21 March 2022; pp. 464–471. [Google Scholar]
- METU Database. Available online: https://data.mendeley.com/datasets/5y9wdsg2zt/1 (accessed on 19 April 2023).
- RDD2020 Database. Available online: https://data.mendeley.com/datasets/5ty2wb6gvg/1 (accessed on 19 April 2023).
- Quqa, S.; Martakis, P.; Movsessian, A.; Pai, S.; Reuland, Y.; Chatzi, E. Two-step approach for fatigue crack detection in steel bridges using convolutional neural networks. J. Civ. Struct. Health Monit. 2021, 12, 127–140. [Google Scholar] [CrossRef]
- Siriborvornratanakul, T. Downstream Semantic Segmentation Model for Low-Level Surface Crack Detection. Adv. Multimed. 2022, 2022, 3712289. [Google Scholar] [CrossRef]
- Zou, Q.; Zhang, Z.; Li, Q.; Qi, X.; Wang, Q.; Wang, S. DeepCrack: Learning Hierarchical Convolutional Features for Crack Detection. IEEE Trans. Image Process. 2018, 28, 1498–1512. [Google Scholar] [CrossRef] [PubMed]
- Luan, L.; Zheng, J.; Wang, M.L.; Yang, Y.; Rizzo, P.; Sun, H. Extracting full-field sub-pixel structural displacements from videos via deep learning. J. Sound Vib. 2021, 505, 11614. [Google Scholar] [CrossRef]
- Sajedi, S.O.; Liang, X. Uncertainty-assisted deep vision structural health monitoring. Comput. Civ. Infrastruct. Eng. 2020, 36, 126–142. [Google Scholar] [CrossRef]
- Shi, Y.; Cui, L.; Qi, Z.; Meng, F.; Chen, Z. Automatic Road Crack Detection Using Random Structured Forests. IEEE Trans. Intell. Transp. Syst. 2016, 17, 3434–3445. [Google Scholar] [CrossRef]
- Liang, X. Image-based post-disaster inspection of reinforced concrete bridge systems using deep learning with Bayesian optimization. Comput. Civ. Infrastruct. Eng. 2018, 34, 415–430. [Google Scholar] [CrossRef]
- Meng, M.; Zhu, K.; Chen, K.; Qu, H. A Modified Fully Convolutional Network for Crack Damage Identification Compared with Conventional Methods. Model. Simul. Eng. 2021, 2021, 5298882. [Google Scholar] [CrossRef]
- Benkhoui, Y.; El-Korchi, T.; Reinhold, L. Effective Pavement Crack Delineation Using a Cascaded Dilation Module and Fully Convolutional Networks. In Geometry and Vision, Proceedings of the First International Symposium, ISGV 2021, Auckland, New Zealand, 28–29 January 2021; Nguyen, M., Yan, W.Q., Ho, H., Eds.; Communications in Computer and Information Science; Springer: Cham, Switzerland, 2021; Volume 1386, pp. 363–377. [Google Scholar]
- Asjodi, A.H.; Daeizadeh, M.J.; Hamidia, M.; Dolatshahi, K.M. Arc Length method for extracting crack pattern characteristics. Struct. Control Health Monit. 2020, 28, e2653. [Google Scholar] [CrossRef]
- Huang, Y.; Zhang, H.; Li, H.; Wu, S. Recovering compressed images for automatic crack segmentation using generative models. Mech. Syst. Signal Process. 2020, 146, 107061. [Google Scholar] [CrossRef]
- Andrushia, D.; Anand, N.; Arulraj, P. Anisotropic diffusion based denoising on concrete images and surface crack segmentation. Int. J. Struct. Integr. 2019, 11, 395–409. [Google Scholar] [CrossRef]
- Deng, W.; Mou, Y.; Kashiwa, T.; Escalera, S.; Nagai, K.; Nakayama, K.; Matsuo, Y.; Prendinger, H. Vision based pixel-level bridge structural damage detection using a link ASPP network. Autom. Constr. 2020, 110, 102973. [Google Scholar] [CrossRef]
- Filatova, D.; El-Nouty, C. A crack detection system for structural health monitoring aided by a convolutional neural network and mapreduce framework. Int. J. Comput. Civ. Struct. Eng. 2020, 16, 38–49. [Google Scholar] [CrossRef]
- Hoang, N.-D. Image Processing-Based Pitting Corrosion Detection Using Metaheuristic Optimized Multilevel Image Thresholding and Machine-Learning Approaches. Math. Probl. Eng. 2020, 2020, 6765274. [Google Scholar] [CrossRef]
- Zha, B.; Bai, Y.; Yilmaz, A.; Sezen, H. Deep Convolutional Neural Networks for Comprehensive Structural Health Monitoring and Damage Detection. In Proceedings of the Structural Health Monitoring, Stanford, CA, USA, 10–12 September 2019; DEStech Publications, Inc.: Lancaster, PA, USA, 2019. [Google Scholar]
- Umeha, M.; Hemalatha, R.; Radha, S. Structural Crack Detection Using High Boost Filtering Based Enhanced Average Thresholding. In Proceedings of the 2018 International Conference on Communication and Signal Processing (ICCSP), Chennai, India, 3–5 April 2018; pp. 1026–1030. [Google Scholar]
- Anter, A.M.; Hassanien, A.E.; Abu ElSoud, M.A.; Tolba, M.F. Neutrosophic sets and fuzzy c-means clustering for improving CT liver image segmentation. Adv. Intell. Syst. Comput. 2014, 303, 193–203. [Google Scholar]
- Zgenel, Ç.F.; Sorguç, A.G. Performance Comparison of Pretrained Convolutional Neural Networks on Crack Detection in Buildings. In Proceedings of the International Symposium on Automation and Robotics in Construction, Berlin, Germany, 20–25 July 2018; pp. 1–8. [Google Scholar]
- Ali, R.; Gopal, D.L.; Cha, Y.-J. Vision-based concrete crack detection technique using cascade features. In Proceedings of the Sensors and Smart Structures Technologies for Civil, Mechanical, and Aerospace Systems, Denver, DE, USA, 3–7 March 2019. [Google Scholar]
- Schapire, R.E. Explaining AdaBoost. In Empirical Inference; Schölkopf, B., Luo, Z., Vovk, V., Eds.; Springer: Berlin/Heidelberg, Germany, 2013. [Google Scholar]
- Suh, G.; Cha, Y.-J. Deep faster R-CNN-based automated detection and localization of multiple types of damage. In Proceedings of the Sensors and Smart Structures Technologies for Civil, Mechanical, and Aerospace Systems 2018, Berlin, Germany, 20–25 July 2018. 105980T. [Google Scholar]
- Ye, X.W.; Jin, T.; Yun, C.B. A review on deep learning based structural health monitoring of civil infrastructures. Smart Struct. Syst. 2019, 24, 567–586. [Google Scholar]
- Sujith, A.; Sajja, G.S.; Mahalakshmi, V.; Nuhmani, S.; Prasanalakshmi, B. Systematic review of smart health monitoring using deep learning and Artificial intelligence. Neurosci. Inform. 2021, 2, 100028. [Google Scholar] [CrossRef]
- Gao, J.; Yang, Y.; Lin, P.; Park, D.S. Computer Vision in Healthcare Applications. J. Health Eng. 2018, 2018, 5157020. [Google Scholar] [CrossRef] [Green Version]
- Esteva, A.; Chou, K.; Yeung, S.; Naik, N.; Madani, A.; Mottaghi, A.; Liu, Y.; Topol, E.; Dean, J.; Socher, R. Deep learning-enabled medical computer vision. NPJ Digit. Med. 2021, 4, 5. [Google Scholar] [CrossRef]
- Amprimo, G.; Ferraris, C.; Masi, G.; Pettiti, G.; Priano, L. GMH-D: Combining Google MediaPipe and RGB-Depth Cameras for Hand Motor Skills Remote Assessment. In Proceedings of the 2022 IEEE International Conference on Digital Health (ICDH), Barcelona, Spain, 10–16 July 2022; pp. 132–141. [Google Scholar]
- de Belen, R.A.J.; Bednarz, T.; Sowmya, A.; Del Favero, D. Computer vision in autism spectrum disorder research: A systematic review of published studies from 2009 to 2019. Transl. Psychiatry 2020, 10, 333. [Google Scholar] [CrossRef]
- Cerfoglio, S.; Ferraris, C.; Vismara, L.; Amprimo, G.; Priano, L.; Pettiti, G.; Galli, M.; Mauro, A.; Cimolin, V. Kinect-Based Assessment of Lower Limbs during Gait in Post-Stroke Hemiplegic Patients: A Narrative Review. Sensors 2022, 22, 4910. [Google Scholar] [CrossRef]
- Khanam, F.-T.-Z.; Al-Naji, A.; Chahl, J. Remote Monitoring of Vital Signs in Diverse Non-Clinical and Clinical Scenarios Using Computer Vision Systems: A Review. Appl. Sci. 2019, 9, 4474. [Google Scholar] [CrossRef] [Green Version]
Figure 1.
PRISMA flow diagram related to the overall screening procedure.
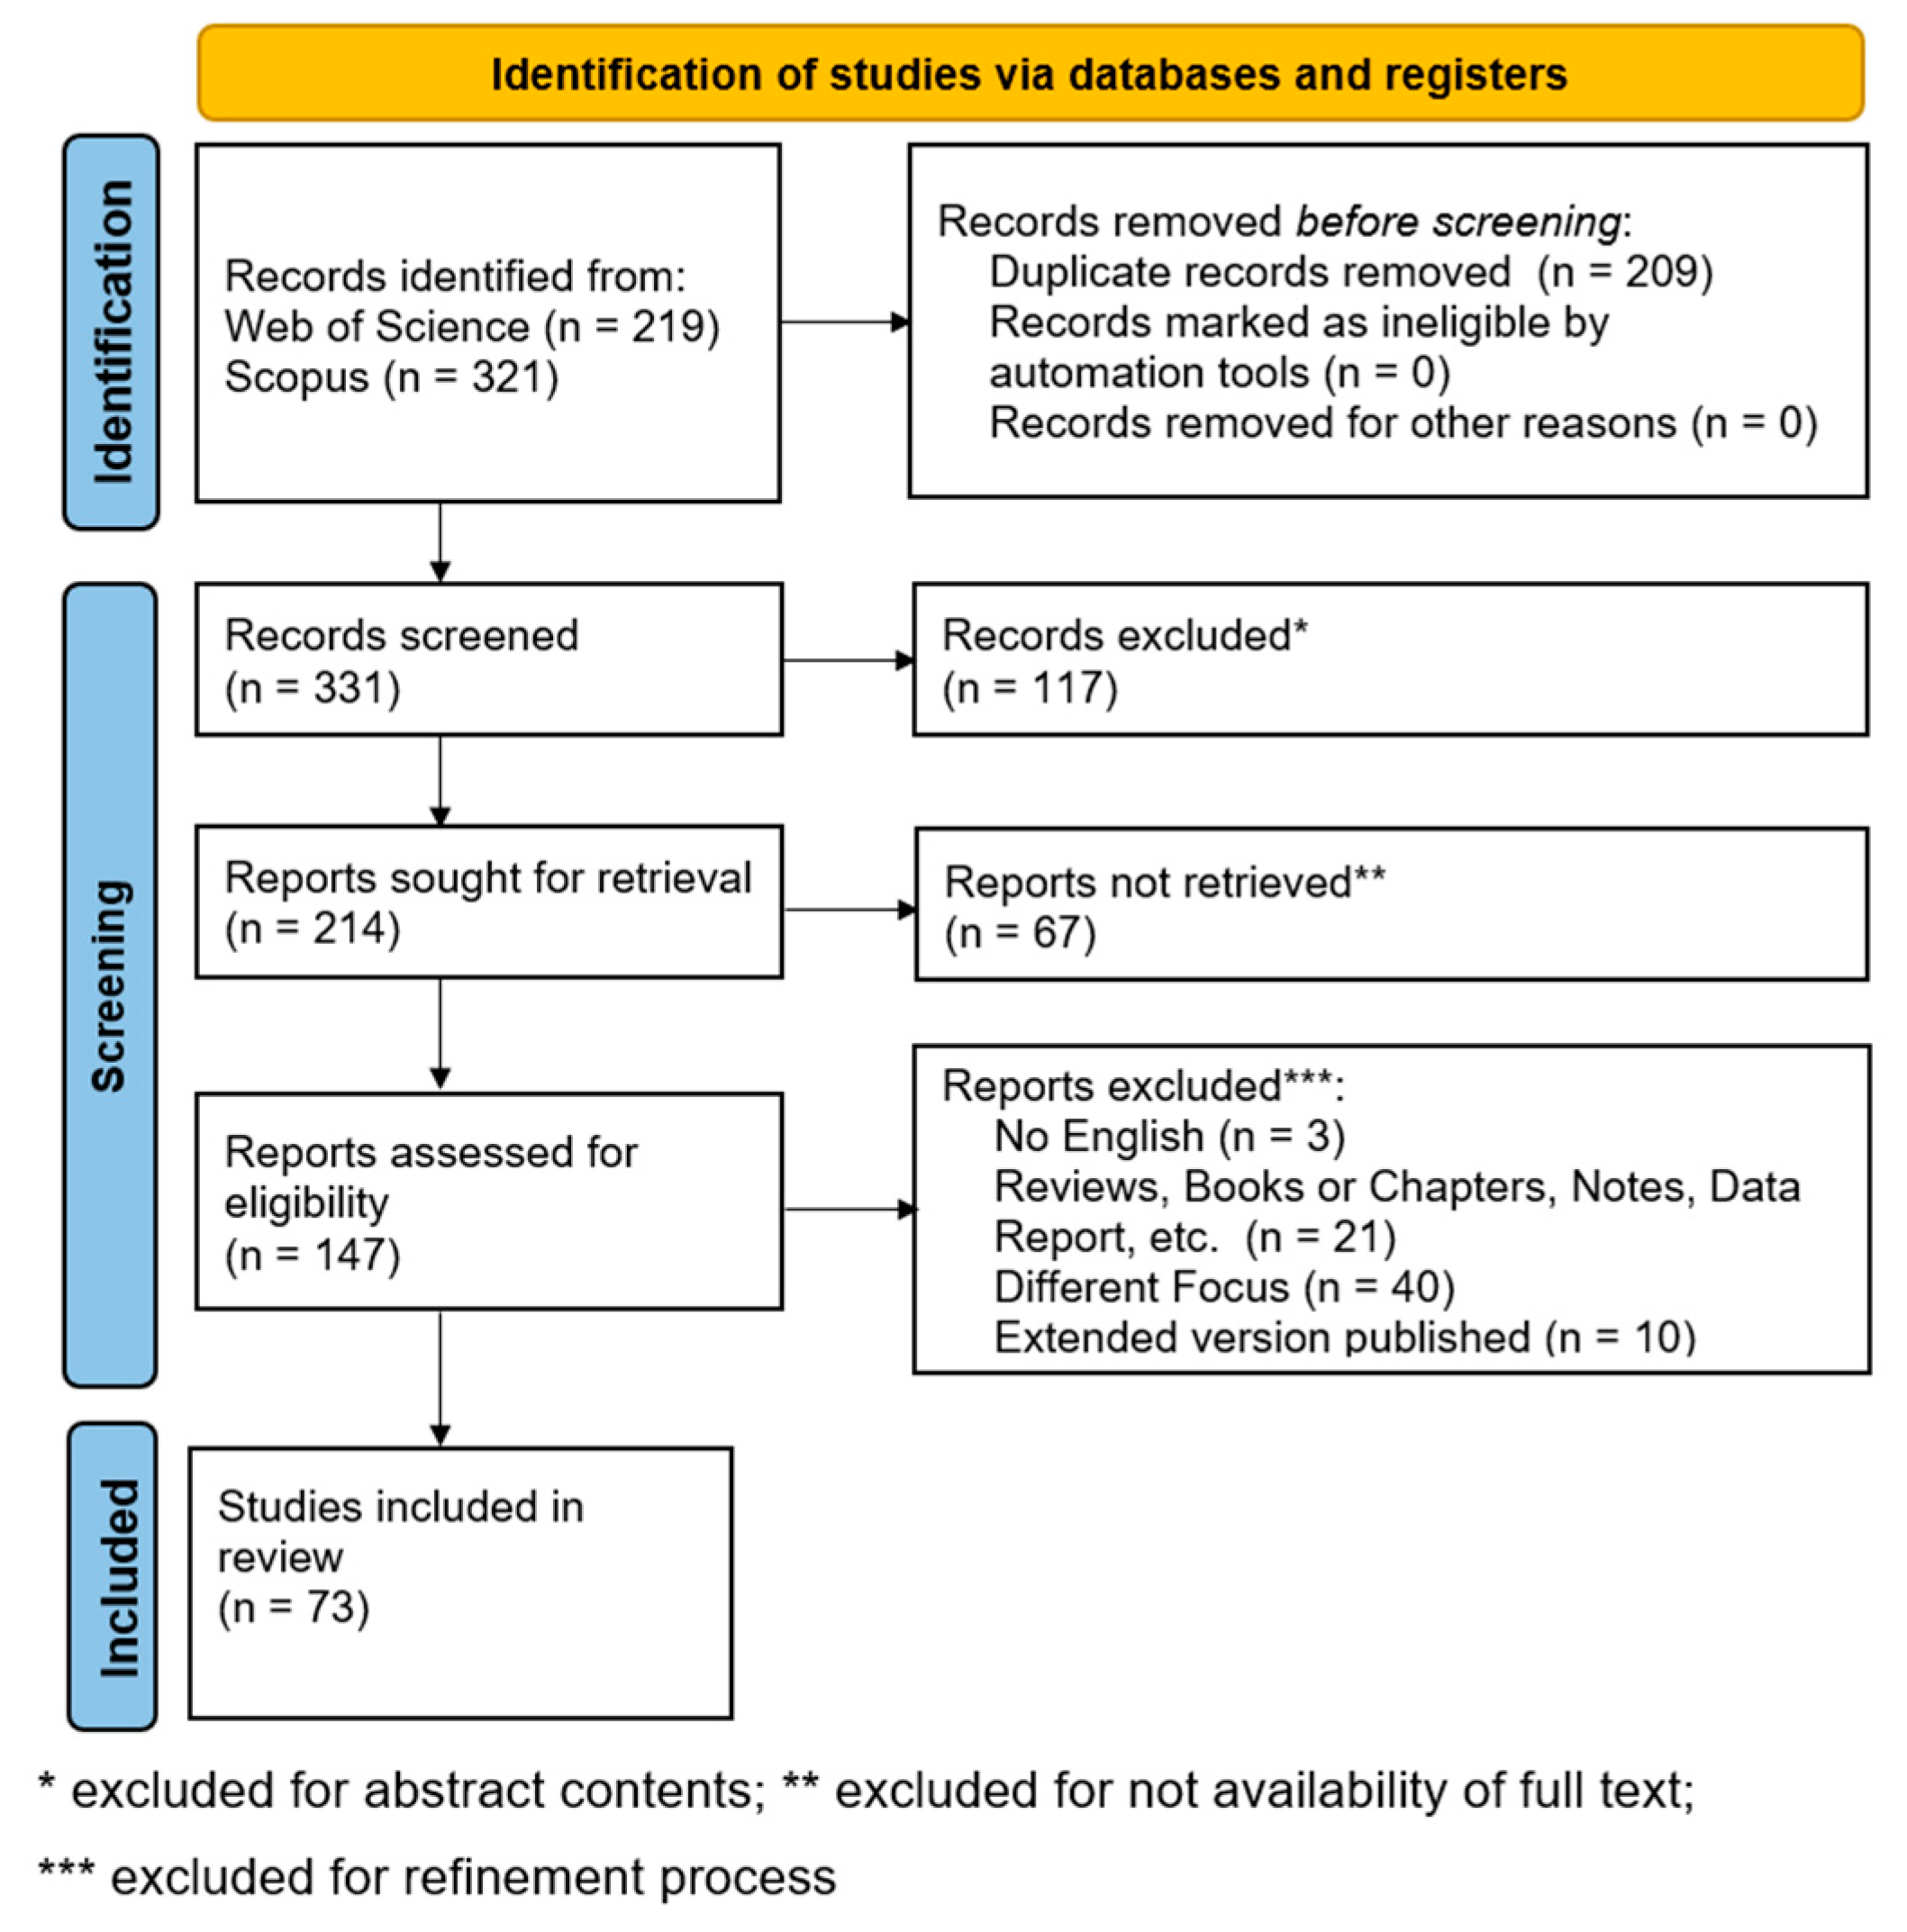
Figure 2.
Breakdown of selected studies by year and category. The symbol # indicates the number of studies.
Figure 2.
Breakdown of selected studies by year and category. The symbol # indicates the number of studies.

Figure 3.
Percentage distribution of VSS (Table 1) with respect to the type of infrastructure (a) and the type of structural health monitoring (b).
Figure 3.
Percentage distribution of VSS (Table 1) with respect to the type of infrastructure (a) and the type of structural health monitoring (b).
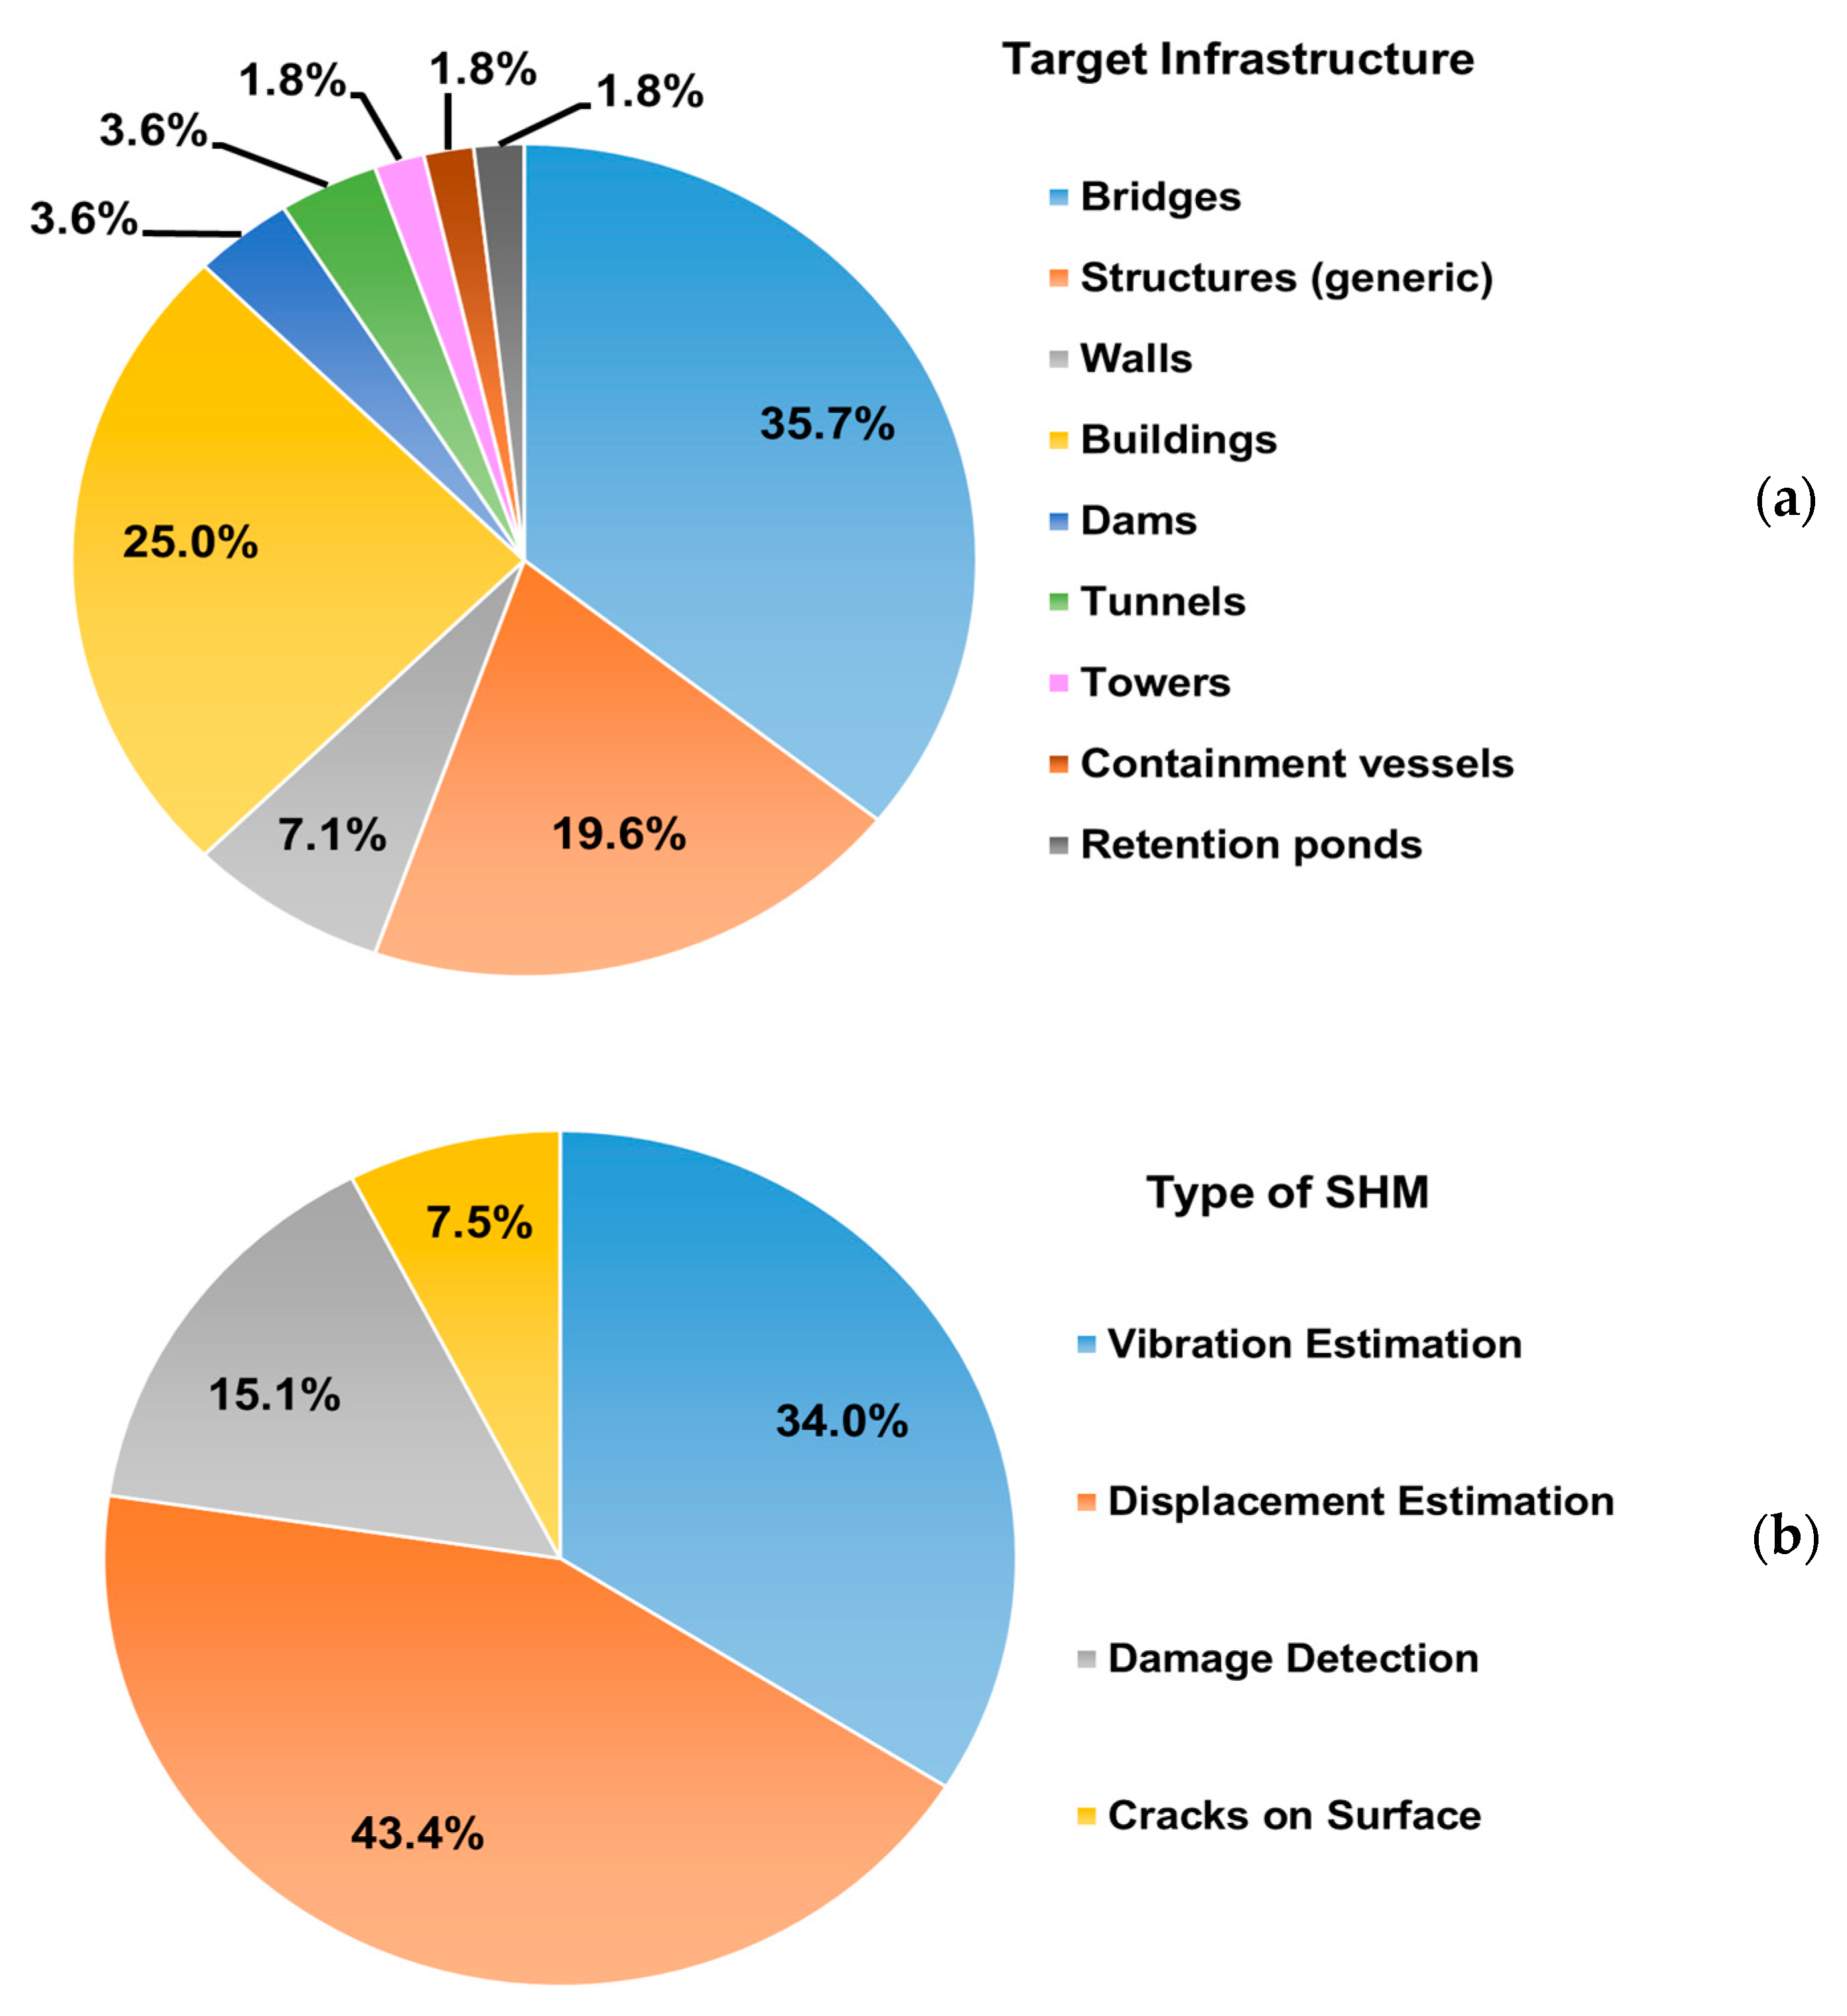
Figure 4.
Percentage distribution of sensors used for validation purposes, emerging from VSS studies (Table 1).
Figure 4.
Percentage distribution of sensors used for validation purposes, emerging from VSS studies (Table 1).
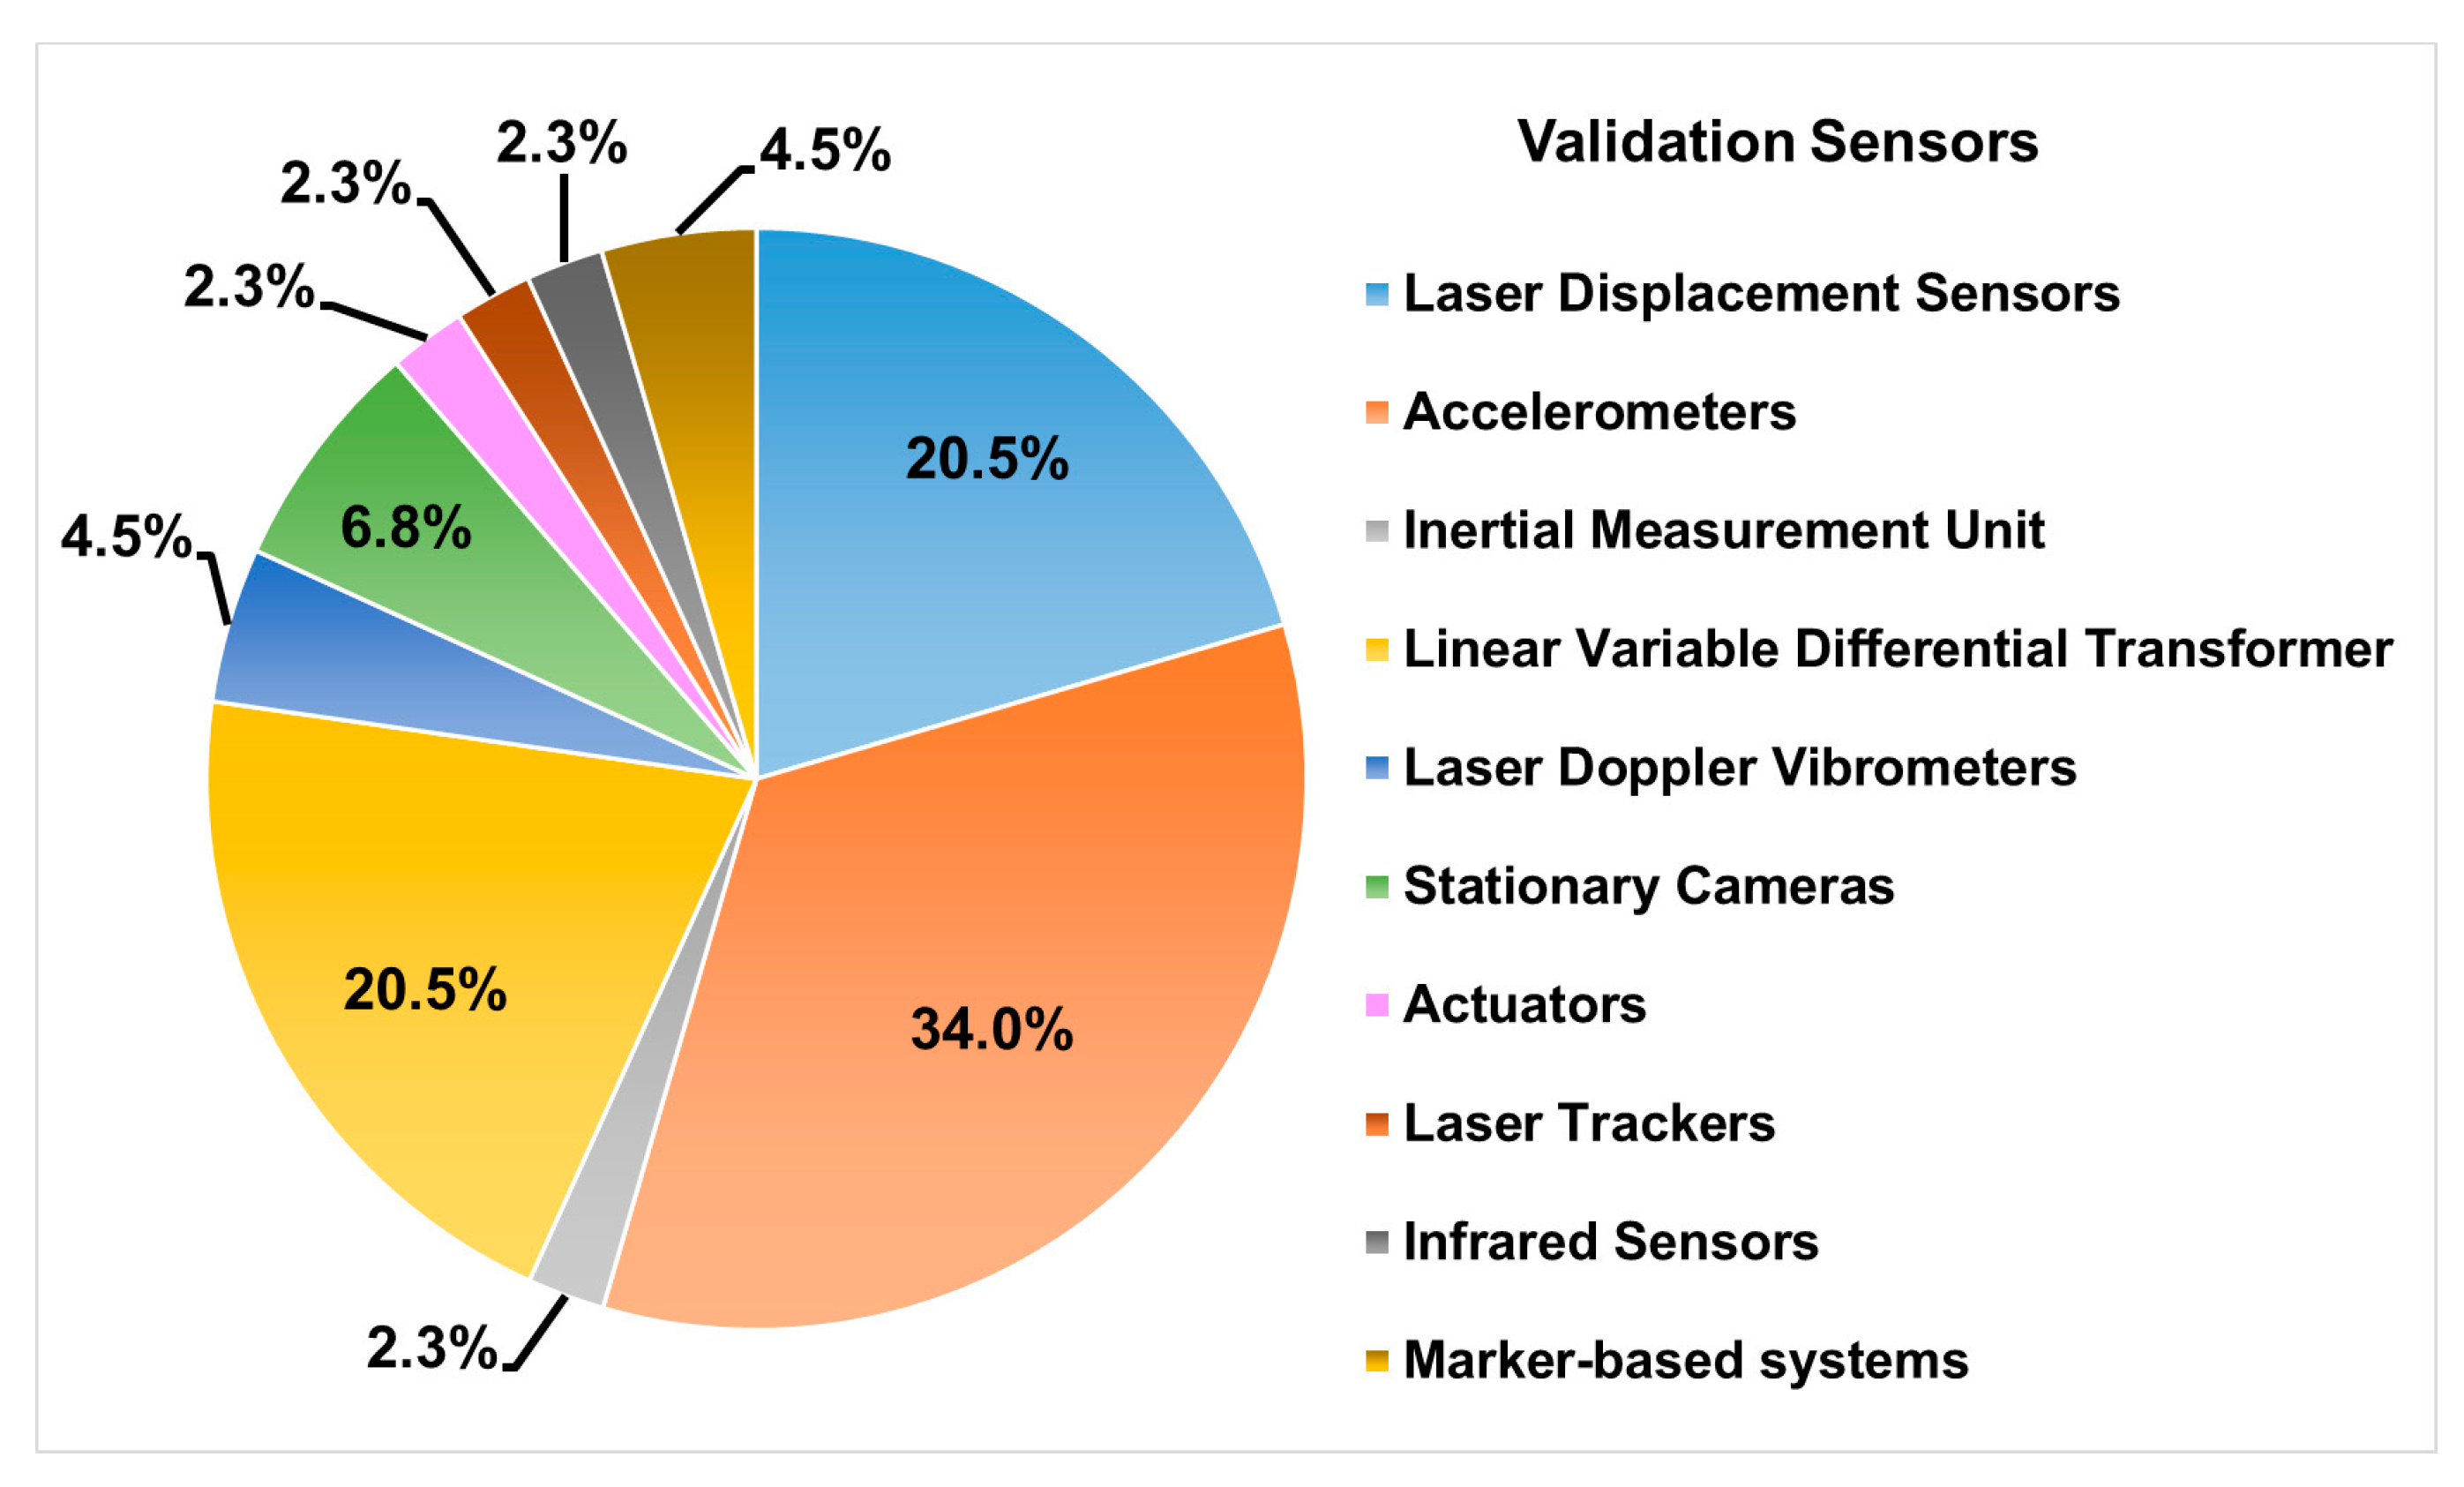
Figure 5.
Percentage distribution of studies (Table 2) with respect to type of infrastructure (a) and type of structural health monitoring (b).
Figure 5.
Percentage distribution of studies (Table 2) with respect to type of infrastructure (a) and type of structural health monitoring (b).

Table 1.
Studies included in the “vision-system” category: main features.
| Author (Year) | Target | SHM Category | Study Objectives | Methods | Camera Features | Test Scenarios | Main Results |
|---|---|---|---|---|---|---|---|
| Zhu et al., 2022 [32] | Bridges | Vibration estimation (from displacement) | Structural vibration assessment system using natural texture target tracking techniques, mode decomposition methods to remove noise, and PMM to improve camera low resolution. | CV | Single-camera: Canon 5D4 (1920 × 1080 px, 50 fps) and telephoto lens, mounted on a tripod approximately 29 m away from the structure. | Experimental: footbridge model (outdoor) In-field: pedestrian bridge (outdoor) | The measurement error was on the order of 0.57–0.78% compared with LDS (experimental tests). The maximum error in vibration was less than 2% compared with ACC (in-field tests). |
| Gonen et al., 2022 [33] | Bridges | Vibration estimation (from displacement) | Structural vibration assessment system using data fusion from the camera (continuous vibrations near the abutments) and accelerometers (vibrations at discrete points along the bridge). | CV and Data Fusion (camera and accelerometers data) | Single-camera: standard video camera (resolution, frame rate, and location not available). | Numerical Simulation: simply supported 50-m long beam (indoor) | Data fusion increased system performance compared with a more conventional configuration with only scattered accelerometers. Robustness was verified against different levels of noise. |
| Shao et al., 2022 [34] | Structures | Displacement estimation | Targetless measurements of small displacements (submillimeter level) due to vibration using computer vision techniques (motion magnification) and deep learning SuperGlue [35] models. | CV and DL | Multi-camera: two Sony PXW-FS5 4K XDCAM (1920 × 1080 px, 50 fps), mounted on a tripod 6.5 m away from the structure. | Experimental: steel cantilever beam (indoor) In-field: pedestrian bridge (indoor) | Relative errors were <13% (X and Y) and <37% (Z) with respect to the actual displacements (0.1 mm), and correlation was 0.94 vs. vibration measurements (experimental tests); relative errors were <36%, and correlation was 0.94 in in-field tests. |
| Peroš et al., 2022 [36] | Structures | Displacement estimation | System to measure displacements due to pressures and forces through point cloud reconstruction from RGB images and laser scanner (distance). | CV and Data Fusion (camera and laser scanner) | Single-camera: High-Speed Trimble SX10 (2592 × 1944 px, 26.6 kHz), mounted on a tripod 5 m away from the structure. | Experimental: wooden beam (outdoor) | Precision of data fusion is +/− 1 mm (maximum residual = 4.8 mm). |
| Lee et al., 2022 [37] | Structures | Displacement estimation | System for quantifying the movement of a structure with respect to outside fixed targets by mounting the camera on the structure (motion detection and estimation). | CV | Single-camera: generic camera (1920 × 1080 px, 30 fps), mounted on the structure. | Numerical Simulation: data simulation using MATLAB (indoor) Experimental: laboratory platform (indoor) | The RMSE was approximately 0.756 mm in simulations and 2.62 mm in experimental tests. |
| Chen et al., 2022 [38] | Bridges | Vibration estimation (from displacement) | Automatic identification of vibration frequency using a deep learning-enhanced computer vision approach. | CV and DL | Single-camera: camera resolution not available (only target area size: 176 × 304 px) 100 Hz, mounted on the bridge. | Experimental: two laboratory scale models (indoor) In-field: large-scale bridge (outdoor) | Vibration frequency detection with a low error (−1.49%) compared to LDV. |
| Do Cabo et al., 2022 [39] | Bridges | Vibration estimation (from displacement) | Comparison between traditional PME and a hybrid approach based on template matching and particle filter (TMPF). | CV | Single-camera: model not available (full HD, 60 fps), mounted on a tripod 22 m away from the bridge. | In-field: pedestrian bridge (outdoor) | Good accuracy in detecting vibration peak frequency (hybrid vs. traditional PME). |
| Kumarapu et al., 2022 [40] | Structures | Damage detection | System for evaluating deformation and damage in concrete structures using UAV-based DIC approaches. | CV | Single-camera: model not specified (CMOS 20 MP, 5472 × 3648 px, 60 fps), mounted on an unmanned aerial vehicle (UAV) | Experimental: concrete specimen (indoor) In-field: real bridge (outdoor) | Accuracy in slight variations is about 88% with UAV (compared to 95% with DSLR); correctly estimated length and width of cracks (mm); deformation (in mm) is correctly estimated. |
| Wu et al., 2022 [41] | Bridges | Vibration estimation (from displacement) | A vision-based system to monitor displacements (vibrations) that uses a consumer-grade surveillance camera and an accelerometer to remove noise due to camera vibration. | CV and Data Fusion (camera and accelerometer data) | Single-camera: consumer-grade DAHUA (2688 × 1520 px, 25 Hz), mounted on the bridge. | Experimental: scale model of suspension bridge (indoor) In-field: real steel bridge (outdoor) | The displacement measurement error was reduced to ±0.3 mm, and the normalized RMSEs were reduced by 30% compared to the raw data. |
| Weng et al., 2022 [42] | Structures | Displacement estimation | A displacement (vibration) measurement system based on a visual-inertial algorithm to compensate for camera movement, using the accelerations provided by the onboard IMU. | CV and Data Fusion (camera and on-board IMU data) | Single-camera: Intel RealSense D455 (1280 × 720 px, 25 fps), mounted on UAV. | Experimental: uniaxial shaking table (indoor) | The RMSE related to the estimated structural displacement is 3.1 mm (2.0 px) compared with a stationary camera (iPhone) using the traditional Kanade–Lucas–Tomasi (KLT) tracker [43]. |
| Sangirardi et al., 2022 [44] | Masonry walls | Displacement estimation | Vision-based system to estimate the natural vibration frequency and the progressive decay associated with damage accumulation. | CV | Single-camera: commercial Reflex (24.3 MP, 30 fps), mounted on a tripod 4 m away from walls. | Experimental: three wall specimens tested on the shake table (indoor) | Estimated vibration frequencies agree with a gold standard marker-based system, with a relative error of less than 6.5%. |
| Parente et al., 2022 [45] | Walls | Damage detection (cracks on surface) | Cost-effective solution for the detecting and monitoring of cracks on walls using low-cost devices and open-source ML algorithms. | CV and ML | Single-camera: Canon 2000D with zoom lens (24.1 MP, frame rate not available), mounted on a tripod 4 m away from walls. | Experimental: drawn cracks (indoor) In-field: cracks on real wall (indoor) | Sub-millimeter (>0.2 mm) and sub-pixel precision, obtaining +/−1.10 mm and +/− 0.50 mm of mean error in crack width and length. |
| Ri et al., 2022 [46] | Bridges | Displacement estimation (deflections) | Simple and effective optical method (based on digital image correlation) for measuring out-of-plane displacement with high accuracy. | CV | Single-camera: Basler (4096 × 2168 px, 30 fps), mounted 13 m under the bridge. | In-field: railway bridge (outdoor) | The average absolute difference vs. LDV is 0.042 mm, corresponding to a sub-pixel level (1/75 px). |
| Belcore et al., 2022 [47] | Bridges | Damage detection | Free and open-source software (FOSS) to detect damages in bridge inspection using drones. | CV and ML | Single-camera: Raspberry Pi Camera Module 2 (8 MP 1024 × 702 px, 2 fps) mounted on a UAV. | In-field: double bridge on motorway (outdoor) | Overall accuracy of the model ranges between 0.816 (without feature selection) to 0.819 (with feature selection). |
| Zhu et al., 2022b [48] | Buildings | Displacement estimation (vibration) | A systematic procedure to estimate building vibration (amplitude and frequency) by combining cameras and edge computing devices, using computer vision techniques such as motion amplification, mask detection, and vibration signal extraction. | CV | Single-camera: Hikvision MVS-CE120-10UM (features not available), mounted on building roof, 94 m away. | Experimental: shaking table (indoor) In-field: video from building roof (outdoor) | In the experimental setup, the frequency and amplitude of vibrations were estimated and compared with ground truth (infrared sensor), obtaining an error of 0.01 Hz (accuracy: 99.8%) in frequency and 1.2 mm in amplitude (accuracy: 93%). The calculation time was reduced by 83.73%. No results were provided for in-field tests. |
| Liu et al., 2022 [49] | Structures | Vibration (from displacement) | A solution for displacement estimation based on computer vision techniques (template matching and circular Hough transform), artificial circular targets, and refinement procedure of subpixel localization to improve estimation accuracy. | CV | Single-camera: iPhone 7 plus (1920×1080 px, 60 fps), mounted on a tripod 1.5 m away from targets. | Experimental: aluminum alloy cantilever plate (indoor) | The estimated displacements agreed well with those measured by the laser transducer system in the time domain. The estimated first and second vibration frequencies were also consistent. |
| Wu et al., 2021 [50] | Bridges | Vibration estimation (from displacement) | System to measure structural displacement using multi-targets data. | CV and active LEDs | Single-camera: DAHUA camera (2688 × 1520 px, 25 Hz), mounted on tripod 24 m away from the bridge. | Experimental: scale bridge (indoor) | The maximum error in displacement was 3 mm (8.45%) in static loading and 5.5 mm (2.90%) in dynamic loading tests vs. LVDT. The maximum relative error in vibration frequency was 1.82% vs. accelerometers. |
| Mendrok et al., 2021 [51] | Structures | Displacement estimation | A contactless approach for indirectly estimating loading forces using a vision-based system with targets. | CV | Single-camera: High-speed Phantom V9 camera (1632 × 800 px, 1000 Hz). | Experimental: cantilever beam with optical markers (indoor) | Pearson correlation with loading forces was between 0.65 and 0.82 using the vision-based system, which was lower than that using accelerometers (0.95) |
| Zhao et al., 2021 [52] | Dams | Damage detection | Damage detection using a UAV-based system on concrete dams through 3D reconstruction and appropriate distribution of ground control points. | CV | Single-camera: Zenmuse X5S (5280 × 2970 px) for heavy lift drone; (5472 × 3078 px) for low-cost drone (frame rate is not available), mounted on UAVs. | In-field: concrete dam (outdoor) | Lower RMSE in X and Y directions, higher RMSE in Z direction. Accurate detection of three types of artificially created damages (errors < 1.0 cm). |
| Alzughaibi et al., 2021 [53] | Building (ceilings) | Displacement estimation | System to measure displacements (vibrations) by tracking identifiable objects on the ceiling using the FAST algorithm and a smartphone. | CV and on-board accelerometer | Single-camera: Samsung Galaxy smartphone camera (1080 px, 30 fps). | Experimental: shake table validation (indoor) | Sub-millimeter (0.0002 inter-story drift ratio) accuracy; accuracy comparable to that of seismic-grade accelerometers. |
| Chou et al., 2021 [54] | Buildings | Displacement estimation | Comparison between three computer vision techniques (motion estimation) for measuring displacements on high structures. | CV (optimization algorithm) | Single-camera: commercial camera (1080 × 1920 px, 30 fps), mounted on a tripod 3 m away from the structure. | Experimental: scaled four-story steel-frame building (indoor) | Similar RMSE (about 1.3 mm) for the three approaches (lowest for DIC, highest for PME). Lower computational load for PME, higher for DIC. |
| Zhou et al., 2021 [55] | Bridges | Vibration estimation (from displacement) | Holographic visual sensor using spatial and temporal data to extract the mechanical behaviour of structures (full-field displacements and natural vibration frequency) under excitatory environmental events. | CV and Data fusion (spatial data at low fps and temporal data at high fps) | Multi-camera: Canon 5Dsr (8688 × 5792 px, 5 fps); Sony AX700 HD high speed (5024 × 2824 px, up to 1000 fps. 100 fps was used for the experimental setup; 30 fps for in-field setup), mounted on tripods. | Experimental: scale model of suspension bridge (indoor) In-field: rail bridge (outdoor) | Agreement with contact sensors (accelerometers) in estimating the first natural vibration frequency. |
| Attard et al., 2021 [56] | Tunnels | Damage detection | Inspection application to monitor and detect changes in tunnel linings using computer vision techniques and robots. | CV | Multi-camera: 12 industrial cameras (5 Mpx resolution), mounted on an inspection robot (CERNBot). | In-field: section of the CERN tunnel (indoor) | Quantitative results of classifying pixels based on image differences (thresholding techniques): 81% recall, 93% accuracy, and 86.7% F1-score. |
| Obiechefu et al., 2021 [57] | Bridges | Damage detection | Techniques to detect and monitor bridge status (damage) using computer vision to derive specific measurements (e.g., deflection, strain, and curvature). | CV | Single-camera: consumer-grade cameras (models and features not available) such as action or smartphone cameras. | Numerical Simulation: damage scenarios through models (indoor) | Deformations are suitable for damage detection and localization, with high resolutions. |
| Lydon et al., 2021 [58] | Bridges | Displacement estimation | Detection of damage in mid-to-long span bridges using roving cameras to measure displacements at 16 predefined nodes under live loading. | CV | Multi-camera: 4 GoPro Hero 4 (1080p), mounted on a tripod. | Experimental: two-span bridge model (indoor) | Four damage cases were tested using a toy truck. Vertical displacement was more accurate than horizontal, which showed lower variability, but greater error. |
| Hosseinzadeh et al., 2021 [59] | Buildings | Vibration estimation (from displacement) | Vibration monitoring system using surveillance cameras within buildings. | CV | Multi-camera: 3 cameras (1280 × 960 px, 60 fps), attached to the edge of each floor. | Experimental: three-story scale structure on a shake table (indoor) | Accuracy and precision in estimating dynamic structural characteristics (modal frequencies and mode shapes) for the excitation intensities. |
| Civera et al., 2021 [60] | Buildings | Damage detection and vibration estimation (from displacement) | System to detect the instantaneous occurrence of damage and structural changes (due to very low amplitude vibrations) using PMM techniques on videos. | CV | Single-camera: High-speed Olympus I-speed 3 (1280 × 1024, 500–1000 fps) mounted on a fixed tripod (experimental); smartphone camera (1920 × 1080, 30 fps) mounted on a surface (in-field). | Experimental: target structures (indoor) In-field: buildings (outdoor) | Accurate displacement measurements and tracking of instantaneous damage induced in structures. Reliable results using low frame rate cameras in outdoor scenarios. |
| Zhu et al., 2021 [61] | Bridges | Displacement estimation | System to measure dynamic displacements using smartphones, computer vision techniques, and tracking target points on the structure. | CV | Single-camera: iPhone8 camera (3840 × 2160 px, 50 fps), mounted on a tripod 1.5 m away from the model. | Experimental: scale model of suspension bridge (indoor) | The RMSE in displacements is 0.19 mm (vs. a displacement sensor and traditional KLT) and 0.0025 Hz in the first modal frequency (compared to results of an accelerometer). |
| Yang et al., 2020 [62] | Buildings | Damage detection | Solution to quantify linear deformations and torsions induced by vibrations. | CV | Single-camera: model not available (640 × 480 px, frame rate not available), fixed on structure ceiling. | Experimental: static and dynamic tests on one-tenth scaled structure (indoor) | The maximum drift error is less than 0.1 mm (static tests). The measurement error was +/− 0.3 mm (dynamic test, 1 Hz) and +/− 2 mm (dynamic test, 3 Hz). |
| Guo et al., 2020 [63] | Buildings | Displacement estimation | Algorithm to measure structural displacements in buildings based on the projective line rectification. | CV (optimization algorithm) | Single-camera: Iphone7 (12 MP) with 28-mm lens. | Experimental: 30-story building model (indoor); two-story base-isolated structure (indoor) | The average RMSE was 0.68 pixels (1.25 pixels for traditional point-based methods), and the measurement error was 8%. The proposed method is more accurate and noise-resistant than traditional point-based methods. |
| Erdogan et al., 2020 [64] | Buildings | Vibration estimation (from displacements) | Computer-vision based system to detect and estimate vibration frequencies from displacements in buildings using the KLT algorithm. | CV | Single-camera: iPhone (1080 × 1290 px, 120 fps), fixed at 7 cm from the reference component. | Experimental: four-story and one bay aluminium structure (indoor) | Good agreement with natural vibration frequencies estimated by accelerometers (low accuracy in damping ratios). Good agreement in modal frequencies related to damage cases. |
| Khuc et al., 2020 [65] | Towers | Displacement estimation | UAV-based targetless system to monitor displacements (vibrations) of high tower structures using natural key points of the structure. | CV | Single-camera: UAV Phantom 3 camera (2704 × 1520 px, 30 fps), mounted top-down on the UAV. | Experimental: steel tower model (outdoor) | Good agreement with accelerometers in estimating the first natural frequency of vibration. |
| Xiao et al., 2020 [66] | Structures, bridges | Displacement estimation | A framework that uses correlation and template matching methods to extract structural responses (displacement and strains) and detect damage through color-coding the displacements. | CV | Single-camera: Nikon D3300 DSLR (30 fps), mounted on a tripod facing the wall (experiment); Pointgray camera (1280 × 1024 px, fps 60), mounted on a tripod 45.7 m away from the bridge (in-field) | Experimental: concrete wall (indoor) In-field: highway bridge (outdoor) | The maximum relative error in displacements is less than 3% (vs. LVDT) for experimental tests, with the result confirmed in real scenarios (vs. accelerometers). The proposed solution showed robustness to environmental light conditions. |
| Hsu et al., 2020 [67] | Buildings | Displacement estimation | Smart vision-based system to estimate dynamic pixel displacements using target patches and data fusion with accelerometer inter-story drifts. | CV and Data Fusion (camera and accelerometers data) | Single-camera: Microsoft LifeCam Studio (1920 × 1080 px), mounted on the bottom surface (first floor). | Experimental: six-story steel building (indoor) | Errors in drift measurements were reduced with the data fusion with drifts measured by accelerometers. |
| Fradelos et al., 2020 [68] | Bridges | Displacement estimation | Low-cost vision-based system to estimate significant deflections (horizontal and vertical) by detecting changes in the pixel coordinates of three target points. | CV | Single-camera: model not available (1920 × 1080 px), mounted a few meters away from the bridge. | In-field: videos of real bridge under excitations due to pedestrian and wind (outdoor) | Good agreement in the estimation of the first vibration frequency. Statistically significant signal-to-noise results on the three target points. |
| Lee et al., 2020 [69] | Bridges | Displacement estimation | Dual-camera system to implement a long-term displacement measurement solution using specific targets to detect and compensate for motion-induced errors. | CV | Multi-camera: GS3-U3-23S6C-C (1920 × 1200 px), main camera, fixed on the bridge pier (in-field test); GS3-U3-23s6M-C (1920 × 1200 px), sub-camera, fixed on the bridge pier (in-field test). | Numerical Simulation: MATLAB simulation of dual-camera system (indoor) Experimental: Dual-camera system in laboratory environment (indoor) In-field: full-scale railway bridge (outdoor) | Numerical simulation validated the error compensation ability. The motion-induced error greater than 44.1 mm was reduced to 1.1 mm in the experimental test. The in-field test on a full-scale bridge showed the difficulty of motion compensation in real and long-term scenarios. An actual displacement of 8 mm was correctly detected over 50 days. |
| Li et al., 2020 [70] | Buildings (ceilings) | Displacement estimation | A smartphone-based solution for measuring building displacements during earthquakes by estimating upper floor (ceiling) movements using traditional computer vision techniques (SURF algorithm and scaling factor). | CV | Single-camera: iPhone 6 or Huawei Mate 10 Pro (1280 × 720, 30 fps), on a flat surface. | Experimental: static and dynamic tests on shaking table (indoor) | The average percentage of error was 3.09%, with a standard deviation of 1.51% from LDS. The accuracy was 0.1664 mm at a distance of 3.000 mm. The SURF algorithm performed well under good lighting conditions. |
| Miura et al., 2020 [71] | Buildings | Vibration estimation (from displacements) | An algorithm for estimating the micro-fluctuations of a camera-based system using a Gabor-type function as the kernel of a complex spatial bandpass filter, by assuming that the global motion (velocity) appears as the mode of the time difference of the spatial motion of a selected target. | CV (optimization algorithm) | Single-camera: Sony DSC-RX100m4 (120 fps, 50 Mbps video) for experimental test; Blackmagic Pocket Cinema Camera (4K, 30 fps), mounted on a tripod, for in-field test. | Numerical Simulation: artificial images (indoor) Experimental: vibrating actuators (indoor) In-field: lightning rod of a building (outdoor) | The proposed approach discriminates frequencies related to camera and subject fluctuations from the phase signal spectra of target pixels. |
| Medhi et al., 2019 [72] | Buildings | Vibration estimation (from displacements) | High-speed vision-based system to estimate displacements due to vibration using a motion detection algorithm of a target object or an existing element in the civil structure. The artificial neural network infers qualitative characteristics of vibration intensity related to the structure’s conditions. | CV and AI | Single-camera: high speed pco.1200 HS (500 fps), Zeiss Makro-Planar T* 100 mm f/2 ZF.2 Lens. | Experimental: shaking table and slip desk (indoor) | Estimated displacements were within a reasonably good range around the actual values. Although the training phase was based only on vertical displacements, the model was also effectively adapted to analyze vibrations in lateral directions, obtaining a low error rate (1.67%) for lateral displacements. |
| Yang et al., 2019 [73] | Buildings | Displacement estimation | Calibration approaches suitable for large-scale structural experiments with multi-camera vision systems, combined with a synchronization method to estimate the time difference between cameras and minimize stereo triangulation error. | CV (optimization algorithm) | Multi-camera: consumer video camera (model not available), 3480 × 2160 px, 30 fps. | Experimental: three-story reinforced-concrete building specimen on shaking table (indoor) | The estimated differences in displacements in the experimental tests were within 2 mm, with a maximum of 4.7 mm and a maximum relative error at the peak of 0.33% (the maximum difference between the systems used for validation is 3 mm with a maximum relative error of 0.33%). |
| Won et al., 2019 [74] | Structures | Displacement estimation | A new method for measuring targetless structural displacement using deep matching and deep flow to find a dense match between images and calculate pixel-wise optical flow at points of interest. | CV and DL | Single-camera: Samsung Galaxy S9+ camera (3840 × 2160 px, 60 fps) mounted 1 m away from the structure. | Experimental: steel cantilever beam model (indoor) | The method outperforms the traditional KLT approach. The RMSE is 0.0753 mm (vs. LDS), while it is 0.2943 mm for KLT. The estimated first natural frequency and power spectral density magnitude agree with LDS. The average computation time is 0.8 s (0.25 s for KLT). |
| Hoskere et al., 2019 [75] | Bridges | Vibration estimation (from displacements) | Framework to estimate full-scale civil infrastructure vibration frequencies from UAV recorded videos using automatic detection of regions of interest, KLT to track motion, high pass filtering to remove effects of hovering, and marker shapes to compensate for UAV rotations. | CV | Single-camera: camera 2704 × 1520 px, 30 fps (for experimental test), camera 3840 × 2160 px, 30 fps (for in-field test), both mounted on a UAV. | Experimental: six-story shear-building model and shaking table (indoor) In-field: pedestrian suspension bridge (outdoor) | Reliable results in experimental tests, with error on natural frequencies less than 0.5% and MAC > 0.996. Slightly worse results were obtained during in-field tests, with errors on frequencies < 1.6% and MAC > 0.928. |
| Kuddus et al., 2019 [76] | Structures | Vibration estimation (from displacements) | Targetless vision-based solution for measuring dynamic vibrations due to bidirectional low-level excitations using a consumer-grade camera to derive displacements. | CV | Single-camera: Sony PXW-FS5 4K XDCAM (1920 × 1080 px, 50 fps) mounted on a tripod 4 m away. | Experimental: reinforced concrete column model and shaking tables (indoor) | Accuracy in dynamic displacement estimation with minimum (2.2%) and maximum (5.7%) errors vs. LDS measurements (RMSE = 1.14 mm, correlations from 0.9215 to 0.9787) in tests with different excitation forces. The errors in vibration frequencies are 1.49% and 3.69% for the first and second examples. |
| Aliansyah et al., 2018 [77] | Bridges | Vibration estimation (from displacements) | A vision-based solution to estimate lateral and vertical displacements of bridge members using a high-speed camera and active LEDs to cope with insufficient incident light. | CV and LEDs | Single camera: High Speed Ximea MQ042MG-C (2048 × 1024 px, 180 fps) with lens. | Experimental: bridge model (indoor) | Correct estimation of the first and second vibration natural frequencies in lateral and vertical directions. |
| Mangini et al., 2018 [78] | Structures (cultural heritage) | Displacement estimation | A non-invasive method for measuring cracks in the cultural heritage sector, taking care of the aesthetic appearance, using small adhesive labels and a high-resolution camera that measures their relative distance through advanced least-squares fitting of quadratic curves and surface algorithms for the Gaussian objective function. | CV | Single camera: Mako G-503B (2592 × 1944 px) mounted 25 cm away from the tags. | Experimental: anti-vibration test bench (indoor) | Maximum relative error (at a camera-tags distance of 25 cm) between actual and estimated displacements was less than 3%, with an approximately constant standard deviation (less than 4.5 μm). It was possible to determine displacements on the order of ten micrometers. |
| Kang et al., 2018 [79] | Walls | Damage detection (cracks on surface) | System based on an autonomous UAV with ultrasonic beacons and a geo-tagging method for structural damage localization and crack detection using UAV-acquired videos and a previously trained deep convolutional neural network. | CV and DL (pre-trained network) | Single camera: Sony FDR-X3000 (2304 × 1296 px resized to 2304 × 1280 px, 60 fps). | In-field: cracks on real wall (indoor) | Cracks in concrete surfaces were detected with high accuracy (96.6%), sensitivity (91.9%), and specificity (97.9%) using video data collected by the autonomous UAV and the pre-trained neural network. |
| Yang et al., 2018 [80] | Containment vessels | Damage detection (cracks on surface) | Image analysis method for detecting and estimating the width of thin cracks on reinforced concrete surfaces, using image optical flow from a stereo system and subpixel information to analyze slight displacements on the concrete surface. | CV | Multi-camera: two Canon EOS 5D Mark III digital cameras (22M) mounted on tripods (stereo-system). | Experimental: reduced-scale containment vessels subjected to a cyclic loading at the top (indoor) | Thin cracks of 0.02–0.03 mm, difficult to detect with the naked eye, were clearly detected by image analysis. Comparison of crack widths measured manually and by the proposed method showed differences generally less than or equal to 0.03 mm. |
| Omidalizarandi et al., 2018 [81] | Bridges | Vibration estimation (from displacements) | Accurate displacement and vibration analysis system that uses an optimal passive target and its reliable detection at different epochs, a linear regression model (sum of sine waves), and an autoregressive (AR) model to estimate displacement amplitudes and frequencies with high accuracy. | CV | Single-camera: Leica Nova MS5 (5 MP, 320 × 240 px videos with 8× zoom, 10 fps). | Experimental: passive target on shaking table (indoor) In-field: footbridge structure (outdoor) | The results demonstrate the feasibility of the proposed system for accurate displacement and vibration analysis of the bridge structure for frequencies below 5 Hz. The displacement and vibration measurements obtained agree with those of the reference laser tracker (LT) sensor. |
| Wang et al., 2018 [82] | Bridges | Vibration estimation (from displacements) | Smartphone-based system for measuring displacement and vibration of infrastructures using target markers and digital image correlation techniques. | CV | Single-camera: iPhone 6 camera mounted on a tripod. | Experimental: static tests (target on surface), dynamic tests (target on shaking table), laboratory-scale 1/28 suspension bridge model (indoor). In field: real bridge (outdoor) | The correlation in static tests between actual and estimated displacements was 0.9996, with a resolution of 0.025± 0.01 mm when the distance between the smartphone and the target was 10–15 cm. In dynamic tests, a constant correlation (0.9998) was measured for displacements. The correlation in time histories was greater than 0.99, with a maximum frequency difference of 0.019 Hz (error: 10.57%). |
| Yoon et al., 2018 [83] | Bridges | Displacement estimation | A framework to quantify the absolute displacement of a structure from videos taken by a UAV, using the targetless tracking algorithm based on the recognition of fixed points on the structure from the optical flow (KLT), quantifying the non-stationary camera motion from the background information, and integrating the two to calculate the absolute displacement. | CV | Single-camera: 4K resolution camera (4.096 × 2.160 px, 24 fps) mounted on UAV (video recording at 4.6 m from bridge) | In-field: pin-connected steel truss bridge (outdoor) | The estimated absolute displacement agrees with that manually measured because of the motion generated by the simulator. The RMSE compared with the reference sensor was 2.14 mm, corresponding to 1.2 pixels of resolution. |
| Shojaei et al., 2018 [84] | Retention ponds, seawalls, dams | Damage detection | Proof of concept for using a USV with an onboard camera to visually assess the health status of a retention pond and a dam, automatically detecting damaged areas. | CV | Single-camera: not specified, mounted on an unmanned surface vehicle (USV). | In-field: retention pond and a seawall (outdoor) | Results related to the various steps of the proposed methodology were provided. |
| Hayakawa et al., 2018 [85] | Tunnels | Damage detection (cracks on surface) | Pixel-wise deblurring imaging (PDI) system for compensation for blurring caused by one-dimensional motion at high speed (100 km/h) between a camera and special targets (black and white stripes) to improve image quality for crack detection in tunnels. | CV | Single-camera: High-speed SPARK-12000M (full HD, 500 fps) with lens, mounted on a vehicle. | In-field: highway tunnel (outdoor) | Detection of 1.5 mm and 0.3 mm cracks with high accuracy. Slight degradation for cracks of 0.2 mm (probably due to camera vibration). The image blurring due to high speed was compensated for by a PDI system; without it, cracks and stripes could not be distinguished at 100 Km/h due to the strong motion blurring. |
PME: phase-based motion estimation; DIC: digital image correlation; PMM: phase-based motion magnification; FAST: features from accelerated segment test; LDS: laser displacement sensor (contactless); ACC: accelerometer (contact); LVDT: linear variable differential transformer (contactless); LDV: laser doppler vibrometer (contact); DSLR: digital single-lens reflex camera (contactless); LT: laser tracker (contactless).
Table 2.
Studies included in the “image database” category: main features.
| Author (year) | Target | SHM Category | Study Objectives | Methods | Database Features | Hardware | Main Results |
|---|---|---|---|---|---|---|---|
| Gao et al., 2022 [86] | Buildings | Damage detection (cracks on surface, spalled areas) | Framework to facilitate comprehension and interpretability of the recognition ability of a “black box” DCNN in detecting structural surface damages. | DL: DCNN Input: 224 × 224 px Ratio between training, validation, and testing: not available | ImageNet dataset (φ-net) [87] 36,413 images, 448 × 448 px, 8 subsets Spalling detection: two classes; Type of damage: four classes | Not Available | From the comparison between the baseline (BL), BL+ transfer learning (TL), and BL + TL + data augmentation (DA) models, BL + TL outperforms the other models. |
| Qiu et al., 2022 [88] | Subway tunnels | Water leakage | Framework for the automatic and real-time segmentation of water leakage areas in subway tunnels and complex environments. | DL: Hybrid method (WRes2Net, WRDeepLabV3+) Input: 512 × 512 px Training: 4800 images Testing: 1200 images | 6000 images taken by subway locomotive (CCD camera, 3.5 MP, 400–5250 fps) | AMD Tyzen 7 5800× (4.6 GHz), NVIDIA GeForce RTX 3060 (6 GB), 16 GB (RAM) | The results show the highest MIoU (82.8%) and a higher efficiency (+25%) that all the hybrid methods than other the end-to-end semantic segmentation approaches (on the experimental dataset). |
| Mahenge et al., 2022 [89] | Roads | Damage detection (cracks on surfaces) | A modified version of U-Net architecture to segment and classify cracks on roads. | DL: CNN (U-Net) Input: 227 × 227 px Training: 25K (METU), 9K (RDD2020) Validation: 5K (METU), 2K (RDD2020) Testing: 300 (both) | Two datasets: METU [90]: 40,000 images, 227 × 227 px, 2 classes; RDD2020 [91]: 26,336 images, 227 × 227 px, four classes | Intel Core i7-4570 CPU (3.20 GHz), 16 GB (RAM) | Higher accuracy in binary classification on both datasets (97.7% on METU and 98.3% on RDD2020) compared with other studies that used CNN to identify crack and non-cracks on road images (execution time around 6 ms). |
| Quga et al., 2022 [92] | Walls | Damage detection (cracks on surface) | Framework using a two-steps procedure to discern between regions with and without damage and characterize crack features (length and width) with CNN. | DL: CNN Input: 32 × 32 px Ratio between training, validation, and testing: not available | 100 images, 4928 × 3264 px, two classes | Intel Core i7-8700 CPU (3.20 GHz), NVIDIA Quadro P620 (2 GB), 32 GB (RAM) | The precision of the first step is around 98.4% (classification in damaged and non-damaged 32 × 32 regions), with AUC = 0.804. Average errors in length and width are 31% and 38%, respectively (approximately 2 pixels). |
| Siriborvornratanakul et al., 2022 [93] | Structures | Damage detection (cracks on surface) | A framework that implemented downstream models to accelerate the development of deep learning models for pixel-level crack detection, using an off-the-shelf semantic segmentation model called DeepLabV3-ResNet101, with different loss functions and training strategies. | DL: CNN (DeepLabv3 + ResNet101] Input: 512 × 512 px Training and validation: original images Testing: four datasets | DeepCrack Dataset [94] 512 × 512 px, 800 × 600 px, 960 × 720 px, 1024 × 1024 px, four datasets | NVIDIA GeForce RTX 2080 GPU, 8 GB (RAM) | The model generalizes well among the four different testing datasets and yields optimal F1-score measurements for the datasets: 84.49% on CrackTree260, 80.29% on CRKWH100, 72.55% on CrackLS315, and 75.72% on Stone331, respectively. |
| Luan et al., 2021 [95] | Structures | Vibration estimation (from displacement) | Framework based on convolutional neural networks (CNNs) to estimate subpixel structural displacements from videos in real time. | DL: CNN Input: 48 × 48 px Ratio between training, validation, and testing: 7:2:1 | 15,000 images (frames from 10 s video with high-speed camera), 1056 × 200 px | Not available | The trained networks detect pixels with sufficient texture contrast, as well as their subpixel motions. Moreover, they show sufficient generalizability to accurately detect subpixels in other videos of different structures. |
| Sajedi et al., 2021 [96] | Buildings, roads, bridges | Damage detection and localization (cracks on roads, damage on concrete structures, bridge components) | Frameworks to reduce uncertainty in prediction due to erroneous training datasets using deep learning. | DL: DBNN Input: 320 × 480 px (crack detection); 215 × 200 px (structural damage); 224 × 224 px (bridge components) Training: 80% Validation: 20% (of training set) Testing: 20% | Three datasets: -Crack detection (118 images 320 × 480 px), two classes [97] -Structural damage (436 images 430 × 400 px) [98] -Bridge components (236 images) [98] | NVIDIA GTX 1070 (or GTX 1080), 8 GB (RAM) | The proposed models show the best performance in detecting cracks (binary segmentation with a simple background), damage (binary segmentation with a complex background), and bridge components (multi-class segmentation problem). |
| Meng et al., 2021 [99] | Underwater structures | Damage detection (cracks on surface) | Framework based on modified FCN to improve localization of cracks in concrete structures, thanks to image preprocessing. | DL: FCN Input: 256 × 256 px Training-Validation: 3-fold cross validation, images split randomly into three groups, two used for training and one for validation. | 20,000 images, 256 × 256 px | NVIDIA GTX 1080Ti | The proposed approach outperforms other FCN models (97.92% precision), reducing processing time (efficiency improvement of nearly 12%). |
| Benkhoui et al., 2021 [100] | Buildings, roads | Damage detection (cracks on surface) | Framework based on FCN and three encoder-decoder architectures combined with a cascaded dilation module to improve the detection of cracks on concrete surfaces. | DL: FCN Input: 224 × 224 px and 299 × 299 px Training: 60% Validation: 20% Testing: 20% | METU [90]: 40,000 images, 227 × 227 px, 2 classes | Intel Quad Core i7-6700HQ, NVIDIA GeForce GTX 1060 | Best accuracy for dilated encoder-decoder (DED) combined with VGG16 (91.78%) vs. ResNet18 (89.36%) and InceptionV3 (78.26%). Best computation time for DED-VGG16. |
| Asjodi et al., 2020 [101] | Structures | Damage detection (cracks on surface and features) | Framework to detect cracks on concrete surfaces using a cubic SVM supervised classifier and to quantify crack properties (i.e., width and length) using an innovative arc length approach based on a color index that discriminates between the brightest and darkest image pixels. | ML: SVM Input: 227 × 227 px Training: 80% Validation and Testing: 20% | METU [90]: 40,000 images, 227 × 227 px, 2 classes | Not available | The accuracy of SVM in detecting crack zones is about 99.3%. The arc length method can identify single and multi-branch cracks without complexity (computationally efficient) and estimate width and length (average error vs. manual measurements in optimal condition is 0.07 ± 0.05 mm). |
| Huang et al., 2020 [102] | Buildings | Damage detection (cracks on surface) | Framework for crack segmentation from compressed images and generated crack images to improve performance and robustness. | DL: DCGAN Input: 128 × 128 px Training: 458 images Validation: 50 images | Dataset [103]: 20,000 images (4032 × 3024 px) split in 227 × 227 px | Intel it-8700K, NVIDIA GeForce RTX 2080, 16 GB (RAM) | Greater accuracy (>0.98) for crack segmentation, higher robustness (to compression rate, occlusions, motion blurring), and lower computation time than other traditional methods. |
| Gao et al., 2020 [87] | Structures, bridges | Damage detection and components | A new dataset of labeled images related to buildings and bridges, divided into 8 sub-categories. Several deep learning models were investigated to a provide baseline performance for other studies. Data augmentation and transfer learning were employed during training for subsets with fewer images. | DL: DCNN (with VGG-16, VGG-19, and ResNet50 models) Input: 224 × 224 px Training-Testing: new multi-attribute split algorithm with ratio ranging from 8:1 to 9:1 according to each attribute. | PEER Hub ImageNet: 36,413 images, 448 × 448 px, 8 subsets. Scene-level (3 classes); Damage-state (2 classes); Spalling-condition (2 classes); Material-type (2 classes); Collapse-mode (3 classes); Component-type (4 classes); Damage-level (4 classes); Damage-type (3 classes) | Intel Core i7-8700K (3.7 GHz), NVIDIA GeForce RTX 2080Ti, 32 GB (RAM) | Best reference accuracy ranges from 72.4% (“damage type” subset) to 93.4% (“scene level” subset). The best model and training approach is provided for each subset. |
| Andrushia et al., 2020 [103] | Structures | Damage detection (cracks on surface) | A framework combining an anisotropic diffusion filter to smoothen noisy concrete images with adaptive thresholds and a gray level-based edge stopping constant. The statistical six sigma-based method is used to segment cracks from smoothened concrete images. | CV: denoising filters. | Dataset: 200 images 256 × 256 px | Intel i7 duo core, 8 GB (RAM) | Comparison with five state-of-the-art methods, resulting in reduced mean square errors and similar peak signal-to-noise ratios. The fine details of the images are also preserved to segment the micro cracks. |
| Deng et al., 2020 [104] | Bridges | Damage detection | Framework for detecting specific damages on bridges (such as delamination and rebar exposure) from pixel-level segmentation using an atrous spatial pyramid pooling (ASPP) model in neural networks to compensate for an imbalance in training classes and to reduce the effects of small database size. | DL: CNN (ASPP model) Input: 480 × 480 px Training: 511 images Testing: 221 images | Dataset: 732 images (original size 600 × 800 px and 768 × 1024 px). Pixel-level labeling in three categories: no-damage, delamination, rebar exposure | Intel i9-7900X, 10 cores, 3.3 GHz, 2 NVIDIA GTX 1080Ti GPU | Link-ASPP outperforms the other two models tested (LinkNet and UNet) by achieving an average F1-score of 74.86% (without damage: >93%, with damage: 60–70%). The execution time on 100 images is higher than that of the other models (4.01 ms vs. 2.80 ms for LinkNet, and 3.40 ms for UNet, respectively). |
| Filatova et al., 2020 [105] | Buildings | Damage detection (cracks on surface) | A novel semantic segmentation algorithm based on a convolutional neural network to detect cracks on the surface of concrete, leveraging a MapReduce distributed framework to improve performance through the parallelization of the training process. | DL: CNN (with MapReduce framework) Input: 1024 × 1024 px Training, validation, testing ratios: 3:1:2 | Dataset: 4500 blocks (1024 × 1024 px). 2 classes (crack, no-crack) and 4 sub-categories for cracking based on size of damage (in mm) | Intel i7-470HQ 2.50 GHz, 16 GB (RAM), NVIDIA GeForce GTX 860M | In binary classification, the proposed model outperforms the comparison approaches (UNet and CrackNet) by achieving higher precision (about 98%). Using the MapReduce framework significantly reduces the training time (857 s vs. 2160 s without MapReduce), with only a slight loss in regards to recall and F1-score. |
| Hoang et al., 2020 [106] | Buildings | Damage detection (corroded areas) | Framework for automatic pitting corrosion detection by integrating metaheuristic techniques (history-based adaptive differential evolution with linear population size reduction (LSHADE), image processing, and machine learning through support vector machine (SVM). | ML: SVM Input: 64 × 64 px Training: 90% Testing: 10% (training and testing sets were randomly created 20 times) | Dataset: 120 images (high resolution). 2 classes (with corrosion, no-corrosion) | Intel i7 8750H 4.1 GHz, 8 GB (RAM), NVIDIA GeForce GTX 1050 Ti Mobile 4 GB | The classification accuracy rate (CAR) is above 91% (93% after hyper-parametric optimization). The proposed approach outperforms the other two compared methods in regards to CAR, accuracy, recall, and F1-score. The t-test confirms the significance of the prediction performance of the proposed approach. |
| Zha et al., 2019 [107] | Structures, bridges | Damage detection and components | Framework to recognize and assess structural damage using deep residual neural network and transfer learning techniques to apply the pre-trained neural network to a similar task (new real-world images). | DL: DCNN (ResNet152 model) + Transfer Learning | PEER Hub ImageNet: 36,413 images, 448 × 448 px, 8 subsets. Scene-level (3 classes); Damage-state (2 classes); Spalling-condition (2 classes); Material-type (2 classes); Collapse-mode (3 classes); Component-type (4 classes); Damage-level (4 classes); Damage-type (3 classes) | NVIDIA GeForce GTX 1080 (other hardware characteristics not available) | The accuracy regarding testing sets created for each category ranges from 63.1% (collapse-mode: 3 classes) to 99.5% (material-type: 2 classes). The accuracy regarding a small number of real-world images (transfer learning) is lower, ranging from 60.0% (damage-type: 4 classes) to 84.6% (component-type: 4 classes). |
| Umeha et al., 2018 [108] | Structures | Damage detection (cracks on surface) | Image processing method to identify defects on concrete surfaces using high boost filtering and enhanced average thresholding strategy to improve accuracy of crack detection in structures. | CV: high boost filtering + Enhanced Average Thresholding (EAT) | Not available | Not available | High boost filtering combined with EAT strategy increases performance compared with traditional filtering and thresholding techniques, according to segmentation quality metrics [109] (+0.1103 in the Dice index, +0.2078 in the Jaccard index). |
| Zgenel et al., 2018 [110] | Structures | Damage detection (cracks on surface) | Applicability of CNNs for crack detection in construction-oriented applications combined with transfer learning, considering the influence of the size of the training dataset, the number of epochs used for training, the number of convolution layers, and the learnable parameters on the performance of the transferability of CNNs to new types of materials. | DL: CNN (7 models: AlexNet, VGG16, VGG19, GoogleNet, ResNet50, ResNet101, and ResNet152) Input: 224 × 224 px Training: 70% Validation: 15% Testing: 15% Different sizes of training sets Four testing sets: Test1 (6K images from original dataset); Test2 (transfer learning for cracks in pavements); Test3 (transfer learning for cracks on concrete material); Test4 (transfer learning for cracks on brickwork material) | METU [90]: 40,000 images (227 × 227 px) | 2 Intel Xeon E5-2697 v2 2.7 GHz, 64 GB (RAM), NVIDIA Quadro K6000 | In Test1, all networks achieved accuracy > 0.99. In Test2 (cracks in pavement), only VGG16, VGG19, GoogleNet, and ResNet50 achieved accuracy > 0.90. In Test3 (cracks on concrete material), only VGG16, VGG19, and GoogleNet achieved accuracy > 0.90. In Test4 (cracks on masonry material), only VGG16 and VGG19 achieved accuracy > 0.90. The size of the training set affected the performance of the models. AlexNet was the fastest network for a training set of 28K units, while ResNet152 was the slowest. |
| Ali et al., 2018 [111] | Structures | Damage detection (cracks on surface) | Framework to detect surface cracks using a modified cascade technique based on the Viola–Jones algorithm and the AdaBoost [112] meta algorithm for training on positive and negative images. | CV: Viola–Jones algorithm + AdaBoost Input: 30 × 30 px, 56 × 56 px, 72 × 72 px (positive images); 1024 × 1024 px (negative images) Training: 975 + 1950 images Testing: 100 new images from different angles | Dataset: 975 positive and 1950 negative images (1024 × 1024) | Not available | Overall, the results were satisfactory (even in the presence of dents and noise), except for those involving dark images in which only 60 percent of the positive areas (however, with highly accurate results in low light) were correctly detected. |
| Suh et al., 2018 [113] | Structures, bridges | Damage detection | Framework to provide near real-time simultaneous detection and localization of multiple damage types using faster region-based convolutional neural network-based (Faster R-CNN) and data augmentation techniques. The robustness of the trained network was evaluated on seven new images of different infrastructures. | DL: Faster R-CNN + Data Augmentation Input: 2366 images (500 × 375 px) Training, Validation, Testing: original images randomly assigned to the three sets. Testing2: seven new images from different infrastructures (transfer learning) | 297 images (6000 × 4000 px); 5 classes: steel delamination, medium and high steel corrosion, bolt corrosion, and concrete cracks | Intel Core i7-6700k; 32 GB (RAM); NVIDIA GeForce GTX 1080 8 GB. | Training and validation showed an accuracy of 90.6%, 83.4%, 82.1%, 98.1%, and 84.7% for concrete cracking, medium steel corrosion, high steel corrosion, bolt corrosion, and steel delamination, respectively (average accuracy: 87.8%). Tests on new images demonstrated the feasibility of using the trained models on new image datasets (but no objective results were provided). |
MIoU: mean intersection over union; DCNN: deep convolutional neural network; CNN: convolutional neural network; DBNN: deep Bayesian neural network; FCN: fully convolutional network; SVM: support vector machine; DCGAN: deep convolutional generative adversarial network; R-CNN: region-based convolutional neural network; AUC: area under the curve.
Table 3.
Classification characteristics.
| Author (year) | Method | Binary Classification | Multi-Class Classification | Transfer Learning |
|---|---|---|---|---|
| Gao et al. [86] | Deep Learning | X | X | |
| Gao et al. [87] | Deep Learning | X | X | |
| Qiu et al. [88] | Deep Learning | X | ||
| Mahenge et al. [89] | Deep Learning | X | ||
| Quga et al. [92] | Deep Learning | X | ||
| Siriborvornratanakul et al. [93] | Deep Learning | X | ||
| Sajedi et al. [96] | Deep Learning | X | X | |
| Meng et al. [99] | Deep Learning | X | ||
| Benkhoui et al. [100] | Deep Learning | X | ||
| Huang et al. [102] | Deep Learning | X | ||
| Deng et al. [104] | Deep Learning | X | X | |
| Filatova et al. [105] | Deep Learning | X | ||
| Zha et al. [107] | Deep Learning | X | X | X |
| Zgenel et al. [110] | Deep Learning | X | X | |
| Suh et al. [113] | Deep Learning | X | X | X |
| Asjodi et al. [101] | Machine Learning | X | ||
| Hoang et al. [106] | Machine Learning | X | ||
| Ali et al. [111] | Machine Learning | X |
Disclaimer/Publisher’s Note: The statements, opinions and data contained in all publications are solely those of the individual author(s) and contributor(s) and not of MDPI and/or the editor(s). MDPI and/or the editor(s) disclaim responsibility for any injury to people or property resulting from any ideas, methods, instructions or products referred to in the content. |
© 2023 by the authors. Licensee MDPI, Basel, Switzerland. This article is an open access article distributed under the terms and conditions of the Creative Commons Attribution (CC BY) license (https://creativecommons.org/licenses/by/4.0/).
Share and Cite
MDPI and ACS Style
Ferraris, C.; Amprimo, G.; Pettiti, G. Computer Vision and Image Processing in Structural Health Monitoring: Overview of Recent Applications. Signals 2023, 4, 539-574. https://doi.org/10.3390/signals4030029
AMA Style
Ferraris C, Amprimo G, Pettiti G. Computer Vision and Image Processing in Structural Health Monitoring: Overview of Recent Applications. Signals. 2023; 4(3):539-574. https://doi.org/10.3390/signals4030029
Chicago/Turabian StyleFerraris, Claudia, Gianluca Amprimo, and Giuseppe Pettiti. 2023. "Computer Vision and Image Processing in Structural Health Monitoring: Overview of Recent Applications" Signals 4, no. 3: 539-574. https://doi.org/10.3390/signals4030029