

Simulation of an Indoor Visible Light Communication System Using Optisystem


Center for ICT & Automotive Convergence, Kyungpook National University, 80 Daehak-ro, Buk-gu, Daegu 41566, Korea
Signals 2022, 3(4), 765-793; https://doi.org/10.3390/signals3040046
Submission received: 29 September 2022
/
Revised: 17 October 2022
/
Accepted: 20 October 2022
/
Published: 1 November 2022
(This article belongs to the Special Issue The 2022 7th International Conference on Intelligent Information Processing)
Abstract
:Visible light communication (VLC ) is an emerging research area in wireless communication. The system works the same way as optical fiber-based communication systems. However, the VLC system uses free space as its transmission medium. The invention of the light-emitting diode (LED) significantly updated the technologies used in modern communication systems. In VLC, the LED acts as a transmitter and sends data in the form of light when the receiver is in the line of sight (LOS) condition. The VLC system sends data by blinking the light at high speed, which is challenging to identify by human eyes. The detector receives the flashlight at high speed and decodes the transmitted data. One significant advantage of the VLC system over other communication systems is that it is easy to implement using an LED and a photodiode or phototransistor. The system is economical, compact, inexpensive, small, low power, prevents radio interference, and eliminates the need for broadcast rights and buried cables. In this paper, we investigate the performance of an indoor VLC system using Optisystem simulation software. We simulated an indoor VLC system using LOS and non-line-of-sight (NLOS) propagation models. Our simulation analyzes the LOS propagation model by considering the direct path with a single LED as a transmitter. The NLOS propagation model-based VLC system analyses two scenarios by considering single and dual LEDs as its transmitter. The effect of incident and irradiance angles in an LOS propagation model and an eye diagram of LOS/NLOS models are investigated to identify the signal distortion. We also analyzed the impact of the field of view (FOV) of an NLOS propagation model using a single LED as a transmitter and estimated the bitrate . Our theoretical results show that the system simulated in this paper achieved bitrates in the range of to bits/s when the FOV changes from to . A VLC hardware design is further considered for real-time implementations. Our VLC hardware system achieved an average of 70% data recovery rate in the LOS propagation model and a 40% data recovery rate in the NLOS propagation model. This paper’s analysis shows that our simulated VLC results are technically beneficial in real-world VLC systems.
1. Introduction
With the development of the photophone, a device that transmits a voice signal on a beam of light, Alexander Graham Bell introduced the idea of using light as a communication medium in 1880 [1]. Bell focused sunlight with a mirror and then talked into a mechanism that vibrated the mirror. At the other end, the detector captured the vibrating beam and converted it back into the voice signal. Bell could not produce a helpful carrier frequency for transferring the light beam from one location to another; hence, his tests failed. Bell had to cease his studies since the laboratory area’s sunlight, fog, and rain interfered with his research. The Morse code transmission [2] in 1844 also gave rise to the concept of visible light communication. In Morse code transmission, it transmits text as a series of on-off tones, lights, or clicks that a skilled listener or observer can only understand. After that, the concept of visible-light communication (VLC) was revived by the development of LEDs in 1927. VLC uses white light-emitting diodes to transmit data by flashing light at speeds that are invisible to human eyes [3]. One important benefit of VLC is that it offers high-speed connection and can be utilized anywhere without distortion [4]. In the VLC system, LED is the transmitter, and a photodiode or phototransistor acts as the detector. The transmission medium used in the VLC system is the electromagnetic radiation spectrum (400 to 700 nanometers) visible to the human eye [5]. The unique characteristic of the VLC system is that it has no interference with radio frequency (RF) signals. Furthermore, secure communication, simple implementation procedures, and license-free band characteristics also enhance the usage of the VLC system for various applications [6]. The application of the VLC system includes Li-Fi [7], location-based services (LBS) [8], vehicle-to-vehicle communication [9], information displayed on sign boards [10], robots in hospitals (HOSPI) [11], augmented reality (AR) [12], and underwater communication (UTROV) [13].
When developing a VLC system, numerous factors must be considered, such as high data rates, uplink problems, legal considerations, LOS/NLOS situations, range (the separation between transmitter and receiver), and interference [14]. When we implement a VLC system, it is vital to optimizing these parameters because they control the system’s performance. The transmitter (LED) and receiver (photodiode or phototransistor) for a high data rate-based VLC system must be compatible with their respective operating frequencies without affecting the system’s cost. It is challenging and expensive to design a high data rate-based VLC system. This study examines the relationship between data rate, delay spread, and signal distortion using a VLC system simulation model. Several reflection pathways were considered in this study based on the number of LEDs employed as the transmitter. To examine how the simulated VLC system performed under LOS/NLOS channel conditions, we used an Optisystem simulation tool [15,16].
This paper aims to analyze and understand the existing VLC systems and investigate the possibilities of improving the system’s performance in a multireflection environment. We used an Optisystem simulation tool that simulated multiple reflection VLC systems using single and dual LEDs as transmitters. We started our simulation by considering the LOS propagation model that includes a direct path between the transmitter and receiver using a single LED and photodiode. Then, we extended our simulation in an NLOS propagation model by considering single and dual LEDs as its transmitters. After that, we estimated the data rate (Rb) using the root mean square (RMS) delay spread. When the data rate is assessed, we analyze the impact of the field of view (FOV) for data rate estimation. The essential contributions from our VLC simulations are summarised as follows.
- We simulated a VLC system using the Optisystem simulation tool. The simulation considers LOS and NLOS propagation models with single and dual LEDs. Our simulation implements a direct path with a single LED as the LOS propagation model’s transmitter. The effect of the incident and irradiance angles in LOS propagation is considered for further analysis. In the NLOS propagation model, simulation considers two cases: a single LED as transmitter and dual LEDs as transmitters. We tested our simulations by evaluating the signal shape on the transmitter and receiver sides using single and double LEDs in the NLOS propagation models. The impact of the incident and irradiance angles in the LOS propagation model and eye diagrams of LOS/NLOS models are evaluated for signal distortion analysis.
- We estimated a bitrate value based on the theoretical analysis. We implemented a VLC system model with principles and mathematical formulations. We analyzed the impact of FOV on bitrate estimation from our NLOS single LED as a transmitter-based Optisystem simulation.
- A VLC transmitter and receiver hardware designs are presented for real-time VLC implementation. We tested the VLC hardware system and verified its functional performance in LOS and NLOS conditions.
The rest of the paper is organized as follows. Related work on the VLC system is discussed in Section 2. An Optisystem simulation-based VLC system is added in Section 3. Section 4 presents a VLC system model with principles and mathematical formulations. The VLC transmitter and receiver hardware designs are described in Section 5, and the simulation results are presented in Section 6. Finally, the paper concludes our VLC simulation in Section 7.
2. Related Work
Numerous VLC system-related issues are looked into in this literature review. In many applications, the fundamental idea of a VLC system using an LED source appears to be crucial [17,18]. LED lighting can achieve lower power usage and a longer lifespan compared to previous illumination systems. Understanding the many visible light communication facets and simulating a VLC system model for additional performance study are the goals of this literature review. Understanding the core ideas of VLC, applications, and difficulties is necessary for this literature assessment. The other features examined included various subjects, including VLC’s difficulties and potential, simulation software for VLC systems, video and audio transmission systems employing VLC, light-based LED encryption techniques, and VLC-based vehicle-to-vehicle communication. The data rate, range, LOS/NOLS, uplink, regulatory concerns, and interference are a few of the difficulties examined in the context of VLC systems for various applications [19,20,21].
The introductory study of the VLC system employing LED lights is researched in [22]. The authors created an experimental setup and talked about optical lighting and transmission. Based on their VLC tests, the impact of inter-symbol interference and reflection was examined. They also spoke about attenuation from reflection sites and transmission loss brought on by inter-symbol interference. They concluded a correlation between data rate and the FOV employed in VLC and suggested the possibility of high-speed data transfer at speeds up to 10 GB/s. The concepts of a VLC system utilizing white LEDs are discussed in paper [23], which also looks into the possible possibilities of power line communications and white LED interior communications for broadband access. To ensure that there is no blind zone in the room for data connections, the authors installed a VLC system for lighting and high data rate indoor communications. The following are some essential items mentioned in [23]:
- When the receiver’s coverage radius exceeds meters, the receiver gets at least one LOS signal.
- The receiver must have a minimum field of vision that is 25° or more.
- LOS path signals have higher powers as compared to reflected path signals.
In [24], the authors reported the concept of VLC and its challenges and prospects. Using straightforward modulation methods, they described the fundamental setup of the VLC system and the performance analysis of visible light transmission. According to their research, LEDs have a signal-to-noise ratio greater than 40 dB and a bandwidth of several megahertz (MHz). The equalization procedure is one of many methods that can be utilized to increase the data rate. They described various strategies for providing data rates of 100 Mb/s and higher. Additionally, they consider multiple factors to increase data speeds, including optical filtering, transmitter and receiver equalization, and optical multi-input multi-output (MIMO) transmission. They examined these factors to determine how they relate to data rate before concluding and outlining potential difficulties. VLC needs equalization, complicated modulation, signal processing, or parallel communications to reach high data rates of up to 100 Mb/s. However, for real-time data transmission, the VLC with larger data rates complicates the system. The authors’ work presented a simulation program for indoor VLC in [25]. For simulation, they employed the programs MATLAB and Simulink. The simulation application explains the various transmitter placements and wall reflections. The authors used a simulation tool to determine the light distribution, root mean square (RMS) delay spread, and received signal waveform while considering transmitter placements and wall reflections. They examined the illuminance distributions before looking at the RMS delay spread distributions for one and four transmitters. Additionally, they used MATLAB/Simulink to show the waveforms for non-return-to-zero (NRZ) - on-off Keying (OOK).
In [26], the authors presented how to transmit audio and video using VLC. Their test findings demonstrated that voice and video might be transferred up to 3 m away. The lighting model was created and simulated within the context of the room, providing a close correlation between the placement of light sources and illuminance distribution. The use of VLC for location-based services is another important use. The article cited in [27] explains these concepts. The authors describe an indoor positioning system (IPS) prototype employing VLC. Here, LED-ID technology was utilized. LED sources send unique ID codes that reveal the positions of current users. The optical link budget was also examined and modeled by them. Additionally, specific numerical analyses for the system’s design were done. With the help of the MATLAB simulation tool, the positioning method, the probability distribution of detection, and the allowable movement speed were examined. After that, they concluded that their lab prototype met the necessary precision in a few coarse location environments.
A warning system for the road to vehicle communication was suggested in paper [28]. They employ VLC in their approach to communicate from the road to the vehicle. They developed a method for acquiring low- and high-frequency data when it was close to the transmitter using the frequency-shift keying (FSK) coding technique. Only low-frequency data can be received by their system when it is far from the transmitter. They created a prototype model at a 1/32 scale. According to their experimental findings, a car employing their prototype technology applied the brakes 2 m away from an LED using 16.6 kHz. Their experiments did not consider the weather’s impact, noise sensitivity, and multi-fading on rainy days. However, in real-world usage, the VLC system affects these parameters significantly. In [29], the author explained vehicle-to-vehicle transmission under atmospheric conditions. In their work, the authors showed how to communicate amongst vehicles while the environment is turbulent. They employed a modified fixed decision threshold (MFDT) technique in the presence of raindrops. A photodiode uses MFDT to detect the transmitted data, while a red LED serves as the transmitter. In wet conditions, their suggested model is accurate and dependable. The author of [30] described a road-to-vehicle VLC that used an LED array and a high-speed camera. They suggested a brand-new approach for enhancing data rate by utilizing overlay coding in their work. Their test findings demonstrated that their suggested solution might significantly increase data rate and be useful for real-world vehicle-to-vehicle communication. The authors of [31] created a VLC system for use in vehicles during nighttime driving circumstances. Comparing their suggested VLC strategy to other traditional methods, it is successful and affordable. Their system’s crucial characteristic is its lack of a need for a service provider for communication. The authors from [32] presented another essential work on the road-to-vehicle VLC system. Their technique uses a high-speed camera in the car as the receiver and an LED traffic light as the transmitter. The authors suggested new practical algorithms for locating and tracking the transmitter, which led to a faster communication rate than traditional approaches. The authors of [33] discuss a simulation model of the VLC channel for use in automotive applications. They used the CATIA V5 tool to model vehicle-to-vehicle (V2V) and vehicle-to-infrastructure (V2I) communication linkages in two usage situations (crossroad and urban scenario). They employed a ray-tracing technique with industry-standard light tools software for VLC channel modeling. They evaluated the outcomes of two cases using these simulation tools and discovered significant advancements in intelligent transportation systems (ITS). The authors from [34] presents a tracking LED array transmitter for VLC in a driving environment. The authors discussed an algorithm for VLC systems’ decoding. They suggested an M-sequence-based LED array detection approach and an inverted signal-based LED array tracking method. Their experimental results demonstrated that the system could establish error-free communication between 25 and 80 m while driving and that the receiver could detect and track precisely. In [35], the idea of a vehicle positioning strategy utilizing a VLC system is proposed. The authors outline a vehicle positioning system that uses V2V and V2I visible light communication in their work. A camera sensor extracts the location information of LEDs installed on the tunnel infrastructure and car tail lamp. The simulation results demonstrated that their suggested strategy might produce accurate positioning when a large number of pixels and a short distance from the LED light sources are supported. This model can be used as an alternative to the conventional GPS.
Data transmission security is one of the main issues VLC systems encounter. To address data security concerns, the VLC systems now use light encryption. A new encryption method for visible-light communication is presented in [36]. This work suggests a light encryption system combining gadgets with LED and a camera image sensor receiver (Rx), such as mobile phones, palmtops, or laptop computers. The suggested light encrypter may receive the original visible light signal from the ceiling or desktop lamp; after that, the data can be encrypted using a private key or other cutting-edge encryption techniques. This light encrypter can then emit the encrypted signal as visible light. The light encrypter serves as an encryption gateway for signals in the optical domain. A positive intrinsic-negative (PIN) photodiode (PD), an avalanche photodiode (APD), or a smartphone camera image sensor can serve as the Rx in this light encrypter. The rolling shutter effect of the complementary metal–oxide semiconductor (CMOS) camera can be used to enhance the transmission data rate to a higher level than the camera’s frame rate. Then, the data information can be obtained by demodulating the rolling shutter pattern (bright and dark fringes received by the camera). They also proposed and demonstrated a light encryption scheme using the Otsu thresholding scheme to define the data logic in the rolling shutter pattern. They discovered that employing 16 Otsu intervals was preferable at high illuminance situations. The proposed smoothing scheme can significantly enhance the BER by up to 2 orders of magnitude at high illuminance due to the reduction of ER fluctuation. In [37], the authors’ used standard data encryption techniques followed by modulation of the signal using OFDM. LEDs are driven by the modulated signal, which sends a binary bit stream as light across the air medium. The broadcast signal is converted back into a usable form at the receiving end using a photodetector. A driver circuit and an appropriate decryption block are used on the receiver side to get back the transmitted signal. The authors showed an example by sending a grayscale image. On the receiver side, they reproduced the shared grayscale image. Their proposed system used LED bulbs to transmit data at a high rate. The OFDM modulation scheme is used for coding the grayscale image. The photodiode detects the LED blinking at the receiving end and reproduces the transmitted grayscale image. The authors suggested a brand-new data encryption system for visible-light communication in [38]. The authors present the effect of encryption and decryption in the indoor visible-light communication system. For encryption, they made use of the Rivest-Shamir-Adleman (RSA) algorithm. The bit error rate performance for both insecure and secure visible-light communication systems is also explained. It was discovered that the power penalties for a BER of were 2 to 4 dB in secured visible-light communication. The impact of key length on error propagation and the power penalty of indoor visible-light communication systems is also covered in their work.
The related work on VLC discussed here indicates that the system needs further studies and analysis to improve its performance. Our motivation for this research is to analyze a VLC system based on simulation results. Our study focuses on an Optisystem-based VLC system in LOS/NLOS channel conditions. We investigated the LOS propagation model’s incident and irradiance angle effect when the system uses a single LED as the transmitter. We determined the signal distortion measurement using eye diagrams in LOS and NLOS propagation models, and these studies show the multipath effects in a VLC system. We also examined the impact of the FOV on the VLC data rates and investigated the challenges for higher FOV-based VLC systems. The hardware design of the VLC system is tested, and the data recovery rate for LOS and NLOS propagation models is obtained.
3. Optisystem Simulation Tool for Indoor VLC System
Users can plan, test, and simulate optical links in the transmission layer using the simulation tool Optisystem. A realistic fiber-optic communication system model serves as the tool’s foundation. It has a solid simulation environment and a hierarchical specification of components and systems. The application visually provides design alternatives and situations (LOS/NLOS circumstances) for VLC implementation and offers a global view of system performance. In our simulation, we examine the LOS and NLOS propagation models to assess the performance of a VLC system. First, using the LOS propagation model, our simulation considers a direct path with a single LED as a transmitter. Then, our simulation investigates the NLOS propagation models by changing the number of LEDs from a single LED to dual LEDs as transmitters. The following subsections present our simulations in the Optisystem simulation tool by considering LOS and NLOS propagation models.
3.1. LOS Propagation Model
As illustrated in Figure 1, our simulation of the LOS propagation model considers a direct path from a single LED in an indoor environment.
From Figure 1, the indoor space is 10 m long, 10 m wide, and 10 m high. A photodiode is used as the detector at the receiving location, with one LED acting as the transmitter. The angles of incidence (), irradiance (), and transmitter-receiver distance (l) are defined as follows.
Figure 2 depicts an Optisystem simulation of the LOS propagation model. The simulation model generates a Pseudorandom data sequence with a bitrate of bits/s. The generated data are converted to NRZ electrical pulses, and these signals directly derive the LED. A connection between the transmitter and the receiver is made through a diffuse channel. At the receiving end, the simulation uses a PIN photodiode as the detector, and a lowpass Bessel filter filters out the detected electrical signal from the photodiode. This filtered signal is regenerated using a 3R regenerator component which analyzes the bit error rate (BER) and Q factor in the BER analysis. An oscilloscope visualizer is used on the transmitter and receiver sides to check the shape of input and out signals. Table 1 shows the components specification used in the Optisystem simulation tool.
3.2. NLOS Propagation Model
Both the direct path and the reflected path of light are considered in the NLOS propagation model. By changing the number of LEDs used on the transmitter side, the simulation identifies two instances of NLOS propagation models. We consider a single LED as the transmitter in the first scenario and two LEDs as the transmitters in the second scenario. Then, considering the received signal’s shape, we evaluated the VLC system’s performance at the receiver side.
3.2.1. Case 1. Single LED NLOS Propagation Model
In the Single LED NLOS propogation model, we employ a single LED as the transmitter and consider both the direct and reflected pathways of the light. Figure 3 depicts the propagation model.
The main difference between this model and the LOS propagation model is that we considered both a direct and reflected light path rather than just a direct one. In each situation, the following equations provide the distance between the transmitter and receiver, the incidence angle, and the irradiance angle.
Figure 4 depicts an Optisystem simulation model of a single LED NLOS propagation model.
This model is identical to the LOS propagation model except that it considers the reflection point. As seen in Figure 4, we apply attenuation (5 dB) in the reflection point. The simulation started with the same configuration in the LOS propagation model, and we used a power splitter at the transmitting side. The NLOS simulation uses the same diffuse channel used in the LOS propagation model with the values specified in Table 1. We used the power combiner component on the receiver side before feeding it into the PIN photodiode. The simulation uses the same lowpass filter used in the LOS model for filtering the detected electrical signal from the photodiode.
3.2.2. Case 2. Dual LED NLOS Propagation Model
We use two LEDs as transmitters in this case and consider the light’s direct and reflected paths. The propagation model is shown in Figure 5.
This simulation model takes into account all direct and reflected pathways and includes two LEDs on the transmitter side. The system becomes more complex, and the signal distortion is more significant than in the other two propagation models as the number of LEDs used as the transmitter increases. In all scenarios listed in Table 2, the distance between the transmitter and receiver, the angle of incidence, and the angle of irradiance are determined.
An Optisystem simulation of dual LED NLOS propagation model is shown in Figure 6.
In this model, the simulation used the exact configuration of a single LED propagation model with an additional LED. The system used four power splitters with ten diffuse channel models on the transmitting side. All attenuators use a 5 dB attenuation during signal transmission. On the receiver side, the simulation has five power combiners, and the output from this is fed to the PIN photodiode. The simulation uses the same lowpass filter configuration used in the other propagation model for the filtering process.
4. VLC System Model
Figure 7 depicts a VLC system model using a single LED mounted on the ceiling of the room and a receiver (photodetector) placed on the floor. The transmitter-radiated light’s property corresponds to the LED’s viewing angle. After the distance d from the LED to the receiver, the light is incident with angle . The distances between an LED and a reflective point and between a reflective point and a photodetector are represented by the numbers and . The angles of irradiance to a reflective point and a photodetector are represented by the quantities and . The received power is calculated when a reflection from a wall is taken into account using the channel DC gain on the directed path () and the reflected path (). According to references [22,39,40,41] the multipath scenario’s total received power is defined as follows:
where is the transmitted optical power which is given [22] by:
where and are determined by the sensitivity curve of the photodiode. The is the flux energy which is defined as:
where is the standard luminosity curve, is the maximum visibility defined as 683 lm/W at nm.
The channel DC gain in the direct path is given [42,43] as:
where is the gain of an optical filter, is the gain of an optical concentrator, is the physical area of the detector in a photodiode, d is the distance between an LED and a photodiode. The size of the photodiode’s field of view is determined by the constant . The optical concentrator is expressed [42] as:
where n is the refractive index.
The DC channel gain of the wall reflection is given [43] by:
where is the reflectance factor and is a reflective area of a small region.
A crucial performance requirement for the VLC system is the RMS delay spread, which is defined [39] as:
where is the mean excess delay which is defined by:
where the received optical power from the ith direct path is , and the jth reflected path is . The terms M and N are the numbers of direct paths from an LED source to a specific photodetector and reflection paths to the same photodetector.
The value is given as:
The maximum bit rate that can be transmitted through the VLC channel without the need for an equalizer is expressed [44] as:
The Lambertian radiation pattern of an LED is assumed throughout this research. As a result, the radiant intensity depends on the irradiance angle . The value is the order of Lambertian emission and is expressed by the semi-angle at half illuminance of an LED . The order of Lambertian emission is defined as:
5. Hardware Design of VLC Transmitter and Receiver
A VLC transmitter that uses an LED as a transmitter is shown in Figure 8. The circuit diagram’s first section depicts the conversion of 12V DC to 5V DC. A 5V DC supply powers the LED. To transform signals from an RS-232 serial port into signals usable in transistor-transistor logic (TTL)-compatible digital logic circuits, we employed the MAX232 IC in the circuit. It is common practice to convert the RX, TX, clear to send (CTS), and request to send (RTS) signals using the MAX232 dual transmitter/receiver. A dB9 connection is used to connect the MAX232’s output. A cable connects the dB9 connector to the input from the personal computer (PC). We enter the values into the PC using the XCTU software. The transmitted data are translated to binary values in the XCTU terminal, and the LED begins blinking based on these binary values. We can adjust the baud rate, flow rate, data bits, parity bits, and stop bits in the software terminal. The XCTU terminal used in our implementation is shown in Figure 9.
A phototransistor is used to detect the incoming light pulses produced by the transmitter on the receiving side. In a phototransistor, light energy is transformed into electric energy. When an LED blinks, the phototransistor in the VLC receiver notices it and turns the information into data. A phototransistor’s output is coupled to an LM358 integrated circuit. The dual-channel Op-amp IC LM358 is a low-power, user-friendly device. This IC is primarily used to run at various voltages from a single power source. The LED attached to the LM358 IC serves only as a simple signal of data reception. The LED goes ON when data are received; if not, it remains OFF. The dB9 connector, which is used to connect to the PC, is attached to the LM358’s output. We employ the same XCTU software on the PC that we did on the transmitter side. The exact specifications of the transmitter terminal must apply to the receiver terminal’s baud rate, flow control, data bits, parity bits, and stop bits. The schematic for the receiver is shown in Figure 10.
6. Results and Discussion
We started our simulation by considering the LOS and NLOS propagation models from Figure 2, Figure 4 and Figure 6. The Optisystem simulation results from these propagation models are shown in Figure 11, Figure 12 and Figure 13. The propagation model uses a square pulse as its input. The oscilloscope visualizer from the transmitter side shows the generated input signal. The oscilloscope visualizer_1 indicates the signal from the receiver. These results indicate the input signal shape is distorted from the diffuse channel and the reflection paths. The width and amplitude of the transmitted signals are changed when it arrives at the receiver side. When considering the received signal amplitude, the LOS propagation model’s receiver affected negligible amplitude distortions compared to NLOS propagation models. The NLOS propagation model results show channel interference’s effect when the system has multiple reflection paths. When the system considers the various numbers of reflection points from the walls, the received signal is distorted and affects the VLC system’s performance. When we see the smoothness of the received signal, the single LED NLOS propagation-based approach has smooth curvature signals compared to the dual LED-based VLC system. The signal amplitudes in both (single and dual LED) methods are almost similar, indicating that the signal amplitude distortion effects in the single LED-based approach can be overcome by adding another LED into the VLC system. These results give the signal shape (amplitude variation) analysis from the receiver side. In addition, it is necessary to investigate the receiver’s signal distortions for further validation of the VLC systems. We consider the eye diagram of the received signal in LOS and NLOS propagation models to validate our simulation results. Figure 14 shows the eyes diagram results from our simulation.
From Figure 14, the eye diagram results indicate the signal distortion level in LOS and LOS propagation models. The results show that the LOS propagation model (Figure 14a is more precise than other models and has good eye-opening results. The single LED NLOS propagation model (Figure 14b) has higher signal distortion, drastically disturbing the eye-opening. The improper eye-opening results of the single LED propagation model indicate that the system failed to transmit the data correctly. The reflection paths in the simulation environment increase the data loss, affecting the VLC performance. To enhance the performance of the single LED NLOS propagation model-based approach, the simulation considers an additional LED which reduces the signal distortion. The dual LED NLOS propagation model-based approach (Figure 14c) has good eye-opening results than the single LED-based approach. This indicates that adding extra LEDs in the VLC system can improve the data loss issue in a VLC system. However, the addition of LEDs increases the system’s complexity. The system requires high-speed switching electronics and high-speed LEDs and phototransistors, giving high system costs for real-time implementation.
Furthermore, we also analyzed the effect of incident () and irradiance () angles in an LOS propagation model. We started our simulation by setting the angle of the incident () to a constant value () and changed the irradiance angle from to . Similarly, we kept the angle of irradiance at a constant value () and changed the incident angle from to . Figure 15, Figure 16, Figure 17 and Figure 18 show the oscilloscope visualizer_1 results from the receiver. These results indicate the effect of irradiance and incident angles in an LOS propagation model. The signal distortion significantly affects the receiver performance when we increase the irradiance and incident angles from a lower to a higher value. The received signal amplitude decreased when the simulation used higher values. The received signals have smooth curvature for higher values of irradiance and incident angles. However, the signal amplitude is reduced compared to lower angle values. This indicates the angles significantly determine the VLC performance, and it is necessary to optimize the irradiance and incident angles for real-time system implementation.
Figure 19 summarises the irradiance and incident angle effect on the receiver signal amplitude. It can be seen that with the angle values from to , the signal amplitude fluctuates with higher and lower values. When the angle reaches or higher values, the signal distortion is directly proportional to the angle values. The signal amplitude decreases when the system uses higher angles. When the irradiance and incident angles reach , the system shows an equal amount of signal distortion on the receiver side. This indicates that when the angles are in the same value or range of values, the signal amplitude distortion is almost the same in the receiver. Our analysis shows that the VLC system performs well when the angles range from to .
The theoretical analysis of a single LED-based NLOS propagation model is further considered for the FOV effect. Consider an example of the NLOS propagation model of a single LED as a transmitter, shown in Figure 20.
The incidence and irradiance angles in all the cases are presented in Equations (2)–(6). The initial values used in the analysis are defined as:
Speed,
Semi-angle at half power, ;
Lambertian order of emission:
Total transmitted power, ; Detector the physical area of a photodiode, = 1; Reflection coefficient, = 0.8; Gain of an optical filter, ; Refractive index of a lens at a photodiode, n = 1.5; FOV of a receiver, FOV = 70; Gain of an optical concentrator:
Room dimension in meter, ; Position of transmitter (LED): Number of the grid on each surface:
First Reflection:
m;
m;
;
;
;
;
;
;
;
Second Reflection:
m;
m;
;
;
;
;
;
;
;
;
Direct Path:
;
;
;
m;
;
;
Mean excess delay:
RMS delay spread:
Bitrate:
Similarly, we changed the FOV value from to and estimated the bitrate. Table 3 summarises the FOV and bitrate results.
Table 3 results indicate that the FOV plays a significant role in bitrate estimation. When we increase the FOV angle from a lower value to a higher value, the bitrate also rises at a specific range. For higher values of FOV, the system needs high-speed switching electronics and high-speed LEDs and phototransistors, increasing the system’s cost. Figure 21 presents the relationship between the FOV and bitrate estimation. The results indicate that the FOV value significantly impacts bitrate estimation. Optimizing a FOV angle for a real-time VLC system is necessary for better performance. Our analysis gives a general idea of the FOV effect on bitrate estimation, which is valuable information for VLC system implementation.
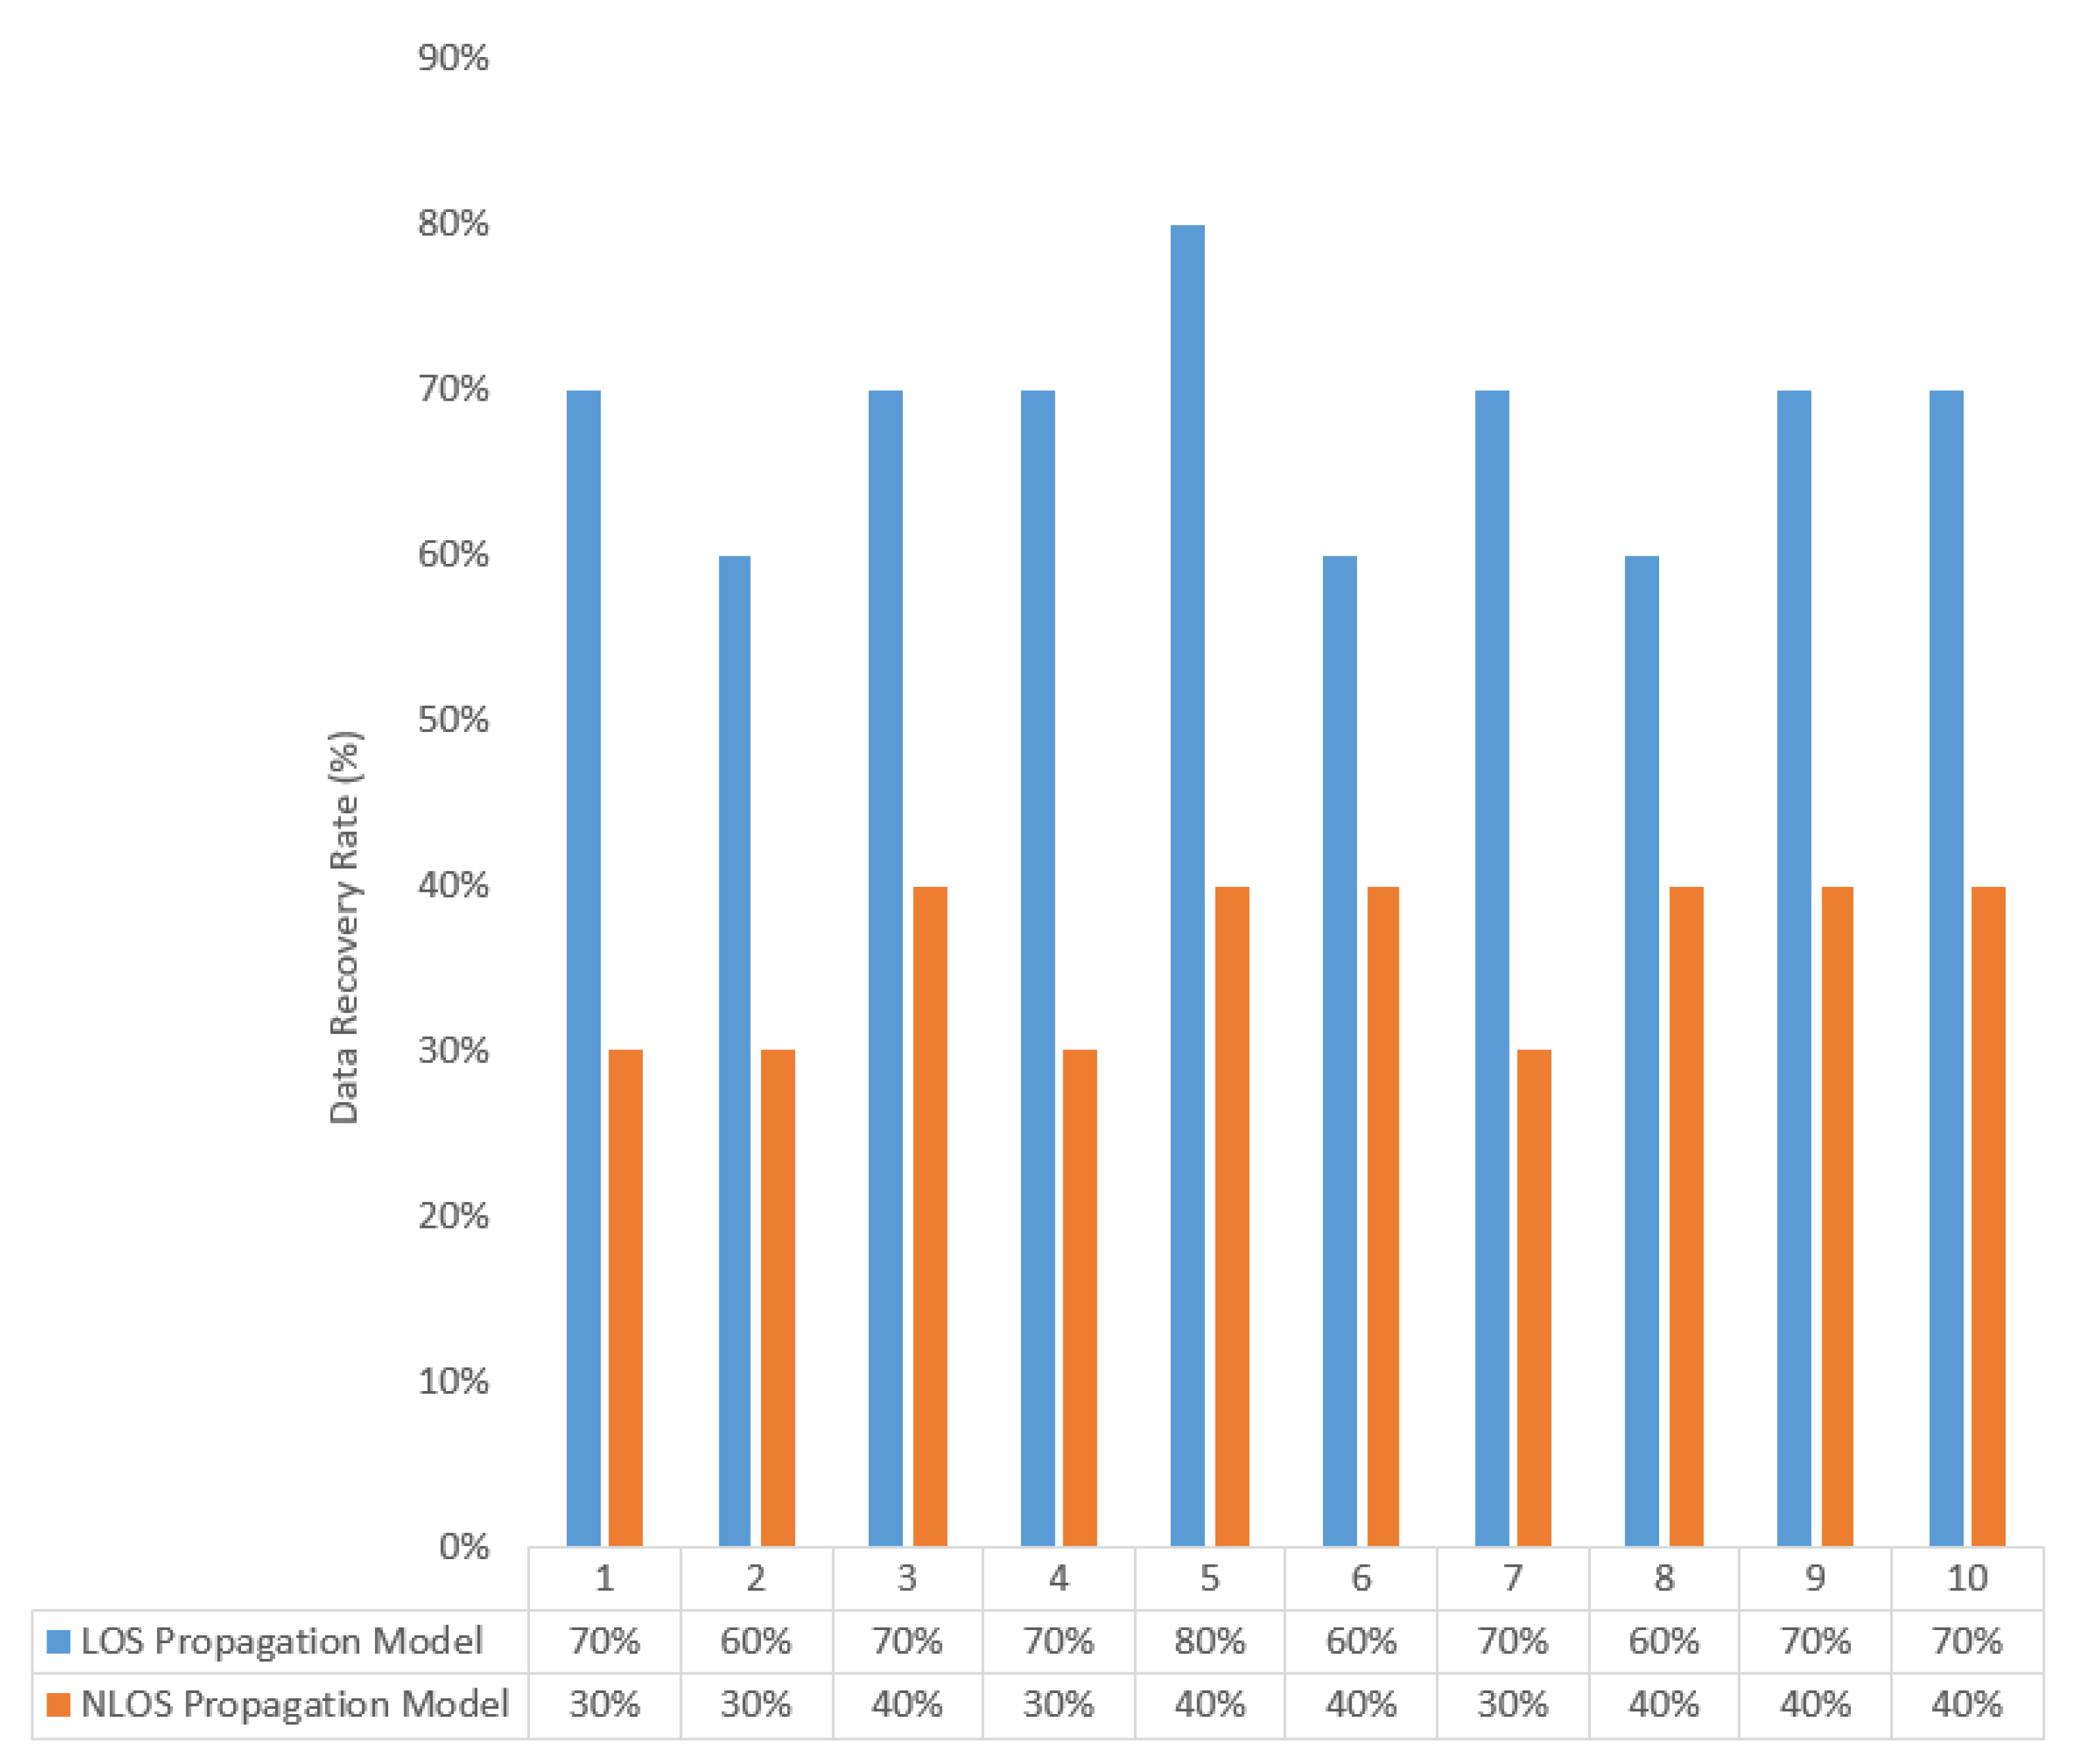
The hardware design of the VLC transmitter and receiver is tested for further validation. Our experiment is carried out based on the Figure 8, Figure 9 and Figure 10. We tested our VLC system by considering ten experiments in real time. We transmitted random alphabetic letters from the transmitter and analyzed the received data. We estimated the data recovery rate from the experiments by considering the number of correct alphabetic letters received in LOS and NLOS propagation models. The data recovery rate is defined as:
where is the number of data received correctly in the receiver and is the total number of data transmitted. Figure 22 shows our VLC hardware experiment results in LOS and NLOS conditions.
From Figure 22, the LOS propagation model-based approach reached an average of 70% data recovery rate. It can be seen from the results that the recovery rate is higher (80%) if the transmitter sends the same alphabet together (Experiment 5). If the transmitter sends unique alphabets, the system has a lower data recovery rate (Experiment 2). In the NLOS propagation model, the system achieved an average of 40% of data recovery. These data recovery results from our experiments indicate that the hardware design of our VLC is a suitable choice for real-time implementation. From all our experiments and results analysis, we demonstrated the relevance of the VLC system, and our results apply to various applications such as communication, positioning, and security [45].
7. Conclusions
This article used an Optisystem simulation tool to present an indoor VLC system. The study demonstrates how to examine a VLC system using mathematical and computer simulation methods. The parameters needed for an effective VLC system can be estimated using the results of this investigation. For an indoor VLC system, our simulation looked at the LOS and NOLS propagation models. In an LOS propagation model, we examined the impact of the incidence and irradiance angles. The effect of the FOV on the bitrate estimate was also discussed. The investigation calculated the relationship between the FOV and bitrate for VLC systems using a single LED NLOS propagation model based on mathematical formulations. The data recovery rate for LOS and NLOS propagation models is estimated, and the VLC transmitter and receiver hardware implementation is tested in real-time. Future research should frame a universal strategy for assessing RMS delay spread for the n-LED system. Similarly, it is possible to think of post-processing the signal using many receivers-based VLC methods to reduce the deformation brought on by the delayed spread of numerous reflected optical signals.
Funding
This research received no external funding.
Institutional Review Board Statement
Not applicable.
Informed Consent Statement
Not applicable.
Data Availability Statement
Not applicable.
Acknowledgments
This research was supported by the Department of Electronics and Communication Engineering, CHRIST (Deemed to be University), Kengeri Campus, Bangalore 560074, India.
Conflicts of Interest
The author declares no conflict of interest.
References
- Ku, J.H. Between Invention and Discovery: AG Bell’s Photophone and Photoacoustic Research. J. Acoust. Soc. Korea 2012, 31, 73–78. [Google Scholar] [CrossRef]
- Tan, H.Z.; Durlach, N.I.; Rabinowitz, W.M.; Reed, C.M.; Santos, J.R. Reception of Morse code through motional, vibrotactile, and auditory stimulation. Percept. Psychophys. 1997, 59, 1004–1017. [Google Scholar] [CrossRef] [PubMed] [Green Version]
- Ismail, S.N.; Salih, M.H. A review of visible light communication (VLC) technology. In AIP Conference Proceedings; AIP Publishing LLC: Melville, NY, USA, 2020; Volume 2213, p. 020289. [Google Scholar]
- Chen, H.; Wu, C.; Li, H.; Chen, X.; Gao, Z.; Cui, S.; Wang, Q. Advances and prospects in visible light communications. J. Semicond. 2016, 37, 011001. [Google Scholar] [CrossRef]
- Rehman, S.U.; Ullah, S.; Chong, P.H.J.; Yongchareon, S.; Komosny, D. Visible light communication: A system perspective—Overview and challenges. Sensors 2019, 19, 1153. [Google Scholar] [CrossRef] [PubMed] [Green Version]
- Khan, L.U. Visible light communication: Applications, architecture, standardization and research challenges. Digit. Commun. Netw. 2017, 3, 78–88. [Google Scholar] [CrossRef] [Green Version]
- Sarkar, A.; Agarwal, S.; Nath, A. Li-Fi technology: Data transmission through visible light. Int. J. Adv. Res. Comput. Sci. Manag. Stud. 2015, 3. [Google Scholar] [CrossRef]
- Cherntanomwong, P.; Chantharasena, W. Indoor localization system using visible light communication. In Proceedings of the 7th IEEE International Conference on Information Technology and Electrical Engineering (ICITEE), Chiang Mai, Thailand, 29–30 October 2015; pp. 480–483. [Google Scholar]
- Ziehn, J.R.; Roschani, M.; Ruf, M.; Bruestle, D.; Beyerer, J.; Helmer, M. Imaging vehicle-to-vehicle communication using visible light. Adv. Opt. Technol. 2020, 9, 339–348. [Google Scholar] [CrossRef]
- Park, S.; Jung, D.; Shin, H.; Shin, D.; Hyun, Y.; Lee, K.; Oh, Y. Information broadcasting system based on visible light signboard. Proc. Wirel. Opt. Commun. 2007, 30, 311–313. [Google Scholar]
- Murai, R.; Sakai, T.; Kawano, H.; Matsukawa, Y.; Kitano, Y.; Honda, Y.; Campbell, K.C. A novel visible light communication system for enhanced control of autonomous delivery robots in a hospital. In Proceedings of the 2012 IEEE/SICE International Symposium on System Integration (SII), Fukuoka, Japan, 16–18 December 2012; pp. 510–516. [Google Scholar]
- Riurean, S.; Olar, M.; Ionică, A.; Pellegrini, L. Visible light communication and augmented reality for underground positioning system. In Proceedings of the MATEC Web of Conferences; EDP Sciences: Les Ulis, France, 2020; Volume 305, p. 00089. [Google Scholar]
- Wang, F.; Liu, Y.; Jiang, F.; Chi, N. High speed underwater visible light communication system based on LED employing maximum ratio combination with multi-PIN reception. Opt. Commun. 2018, 425, 106–112. [Google Scholar] [CrossRef]
- Pradana, A.; Ahmadi, N.; Adionos, T. Design and implementation of visible light communication system using pulse width modulation. In Proceedings of the 2015 IEEE International Conference on Electrical Engineering and Informatics (ICEEI), Denpasar, Indonesia, 10–11 August 2015; pp. 25–30. [Google Scholar]
- Manivannan, K.; Raja, A.S.; Selvendran, S. Performance investigation of visible light communication system using optisystem simulation tool. Int. J. Microw. Opt. Technol. India 2016, 11, 377. [Google Scholar]
- Xia, P.; Zhang, L.H.; Lin, Y. Simulation study of dispersion compensation in optical communication systems based on optisystem. In Proceedings of the Journal of Physics: Conference Series; IOP Publishing: Bristol, UK, 2019; Volume 1187, p. 042011. [Google Scholar]
- Oyewobi, S.S.; Djouani, K.; Kurien, A.M. Visible Light Communications for Internet of Things: Prospects and Approaches, Challenges, Solutions and Future Directions. Technologies 2022, 10, 28. [Google Scholar] [CrossRef]
- Shi, J.; Niu, W.; Ha, Y.; Xu, Z.; Li, Z.; Yu, S.; Chi, N. AI-Enabled Intelligent Visible Light Communications: Challenges, Progress, and Future. Photonics 2022, 9, 529. [Google Scholar] [CrossRef]
- Rahman, M.T.; Bakibillah, A.S.M.; Parthiban, R.; Bakaul, M. Review of advanced techniques for multi-gigabit visible light communication. IET Optoelectron. 2020, 14, 359–373. [Google Scholar] [CrossRef]
- Matheus, L.E.M.; Vieira, A.B.; Vieira, L.F.; Vieira, M.A.; Gnawali, O. Visible light communication: Concepts, applications and challenges. IEEE Commun. Surv. Tutor. 2019, 21, 3204–3237. [Google Scholar] [CrossRef]
- Christy, G.S.; Sundari, G.; Sonti, V.K. A Review on Evolution, Challenges and Scope in Visual Light Communication Systems. In Proceedings of the 7th IEEE International Conference for Convergence in Technology (I2CT), Mumbai, India, 7–9 April 2022; pp. 1–5. [Google Scholar]
- Komine, T.; Nakagawa, M. Fundamental analysis for visible-light communication system using LED lights. IEEE Trans. Consum. Electron. 2004, 50, 100–107. [Google Scholar] [CrossRef]
- Amirshahi, P.; Kavehrad, M. Broadband access over medium and low voltage power-lines and use of white light emitting diodes for indoor communications. In Proceedings of the CCNC 3rd IEEE Consumer Communications and Networking Conference, Las Vegas, NV, USA, 8–10 January 2006; Volume 2006, pp. 897–901. [Google Scholar]
- O’Brien, D.; Le Minh, H.; Zeng, L.; Faulkner, G.; Lee, K.; Jung, D.; Oh, Y.; Won, E.T. Indoor visible light communications: Challenges and prospects. Free-Space Laser Commun. VIII 2008, 7091, 60–68. [Google Scholar]
- Nguyen, H.; Choi, J.H.; Kang, M.; Ghassemlooy, Z.; Kim, D.; Lim, S.K.; Kang, T.G.; Lee, C.G. A MATLAB-based simulation program for indoor visible light communication system. In Proceedings of the 7th IEEE International Symposium on Communication Systems, Networks & Digital Signal Processing (CSNDSP 2010), Newcastle Upon Tyne, UK, 21–23 July 2010; pp. 537–541. [Google Scholar]
- He, Y.; Ding, L.; Gong, Y.; Wang, Y. Real-time audio & video transmission system based on visible light communication. Opt. Photonics 2013, 3, 153–157. [Google Scholar]
- Lou, P.; Zhang, H.; Zhang, X.; Yao, M.; Xu, Z. Fundamental analysis for indoor visible light positioning system. In Proceedings of the 1st IEEE International Conference on Communications in China Workshops (ICCC), Beijing, China, 15–17 August 2012; pp. 59–63. [Google Scholar]
- Yoneda, R.; Okuda, K.; Uemura, W. A tight curve warning system using FSK visible light and road-to-vehicle communication. In Proceedings of the 3rd IEEE International Conference on Consumer Electronics, (ICCE-Berlin), Berlin, Germany, 9–11 September 2013; pp. 1–3. [Google Scholar]
- Kim, Y.H.; Cahyadi, W.A.; Chung, Y.H. Experimental demonstration of LED-based vehicle to vehicle communication under atmospheric turbulence. In Proceedings of the 2015 IEEE International Conference on Information and Communication Technology Convergence (ICTC), Jeju, Korea, 28–30 October 2015; pp. 1143–1145. [Google Scholar]
- Nishimoto, S.; Yamazato, T.; Okada, H.; Fujii, T.; Yendo, T.; Arai, S. High-speed transmission of overlay coding for road-to-vehicle visible light communication using LED array and high-speed camera. In Proceedings of the 2012 IEEE Globecom Workshops, Anaheim, CA, USA, 3–7 December 2012; pp. 1234–1238. [Google Scholar]
- Karthik, P.; Kumar, B.M.; Ravikiran, B.; Suresh, K.; Toney, G. Implementation of visible light communication (VLC) for vehicles. In Proceedings of the 2016 International Conference on Advanced Communication Control and Computing Technologies (ICACCCT), Ramanathapuram, India, 25–27 May 2016; pp. 673–675. [Google Scholar]
- Premachandra, H.C.N.; Yendo, T.; Tehrani, M.P.; Yamazato, T.; Okada, H.; Fujii, T.; Tanimoto, M. High-speed-camera image processing based LED traffic light detection for road-to-vehicle visible light communication. In Proceedings of the 2010 IEEE Intelligent Vehicles Symposium, La Jolla, CA, USA, 21–24 June 2010; pp. 793–798. [Google Scholar]
- Lee, S.; Kwon, J.; Jung, S.; Kwon, Y. Simulation modeling of visible light communication channel for automotive applications. In Proceedings of the 15th International IEEE Conference on Intelligent Transportation Systems, Anchorage, AK, USA, 16–19 September 2012; pp. 463–468. [Google Scholar]
- Nagura, T.; Yamazato, T.; Katayama, M.; Yendo, T.; Fujii, T.; Okada, H. Tracking an LED array transmitter for visible light communications in the driving situation. In Proceedings of the 7th IEEE International Symposium on Wireless Communication Systems, York, UK, 19–22 September 2010; pp. 765–769. [Google Scholar]
- Kim, B.W.; Jung, S.Y. Vehicle positioning scheme using V2V and V2I visible light communications. In Proceedings of the 83rd IEEE Vehicular Technology Conference (VTC Spring), Nanjing, China, 15–18 May 2016; pp. 1–5. [Google Scholar]
- Liu, Y.; Liang, K.; Chen, H.Y.; Wei, L.Y.; Hsu, C.W.; Chow, C.W.; Yeh, C.H. Light encryption scheme using light-emitting diode and camera image sensor. IEEE Photonics J. 2016, 8, 1–7. [Google Scholar] [CrossRef]
- Parikh, H.; Chokshi, J.; Gala, N.; Biradar, T. Wirelessly transmitting a grayscale image using visible light. In Proceedings of the 2013 IEEE International Conference on Advances in Technology and Engineering (ICATE), Mumbai, India, 23–25 January 2013; pp. 1–6. [Google Scholar]
- Mousa, F.; Son, T.T.; Burton, A.; Le Minh, H.; Ghassemlooy, Z.; Duong, T.Q.; Boucouvalas, A.C.; Perez, J.; Dai, X. Investigation of data encryption impact on broadcasting visible light communications. In Proceedings of the 9th IEEE International Symposium on Communication Systems, Networks & Digital Sign (CSNDSP), Manchester, UK, 23–25 July 2014; pp. 390–394. [Google Scholar]
- Ghassemlooy, Z.; Popoola, W.; Rajbhandari, S. Optical Wireless Communications: System and Channel Modelling with Matlab®; CRC Press: Boca Raton, FL, USA, 2019. [Google Scholar]
- Poulose, A. Visible light communication. In Masters of Technology in Communications Systems; Christ University: Bengaluru, India, 2017. [Google Scholar]
- Poulose, A. An Optisystem Simulation for indoor visible light communication system. In Proceedings of the National Conference on Emerging Technologies (NCET), Tiruvannamalai, Tamil Nadu, India, 11 March 2017. [Google Scholar]
- Barry, J.R. Wireless Infrared Communications; Springer Science & Business Media: Berlin/Heidelberg, Germany, 1994; Volume 280. [Google Scholar]
- Gfeller, F.R.; Bapst, U. Wireless in-house data communication via diffuse infrared radiation. Proc. IEEE 1979, 67, 1474–1486. [Google Scholar] [CrossRef]
- Xu, F.; Khalighi, A.; Caussé, P.; Bourennane, S. Channel coding and time-diversity for optical wireless links. Opt. Express 2009, 17, 872–887. [Google Scholar] [CrossRef]
- Liu, X.; Guo, L.; Wei, X. Indoor Visible Light Applications for Communication, Positioning, and Security. Wirel. Commun. Mob. Comput. 2021, 2021, 1730655. [Google Scholar] [CrossRef]
Figure 1.
Experiment design for LOS propagation model. The experiment was 10 m long and considered a single LED and photodiode.
Figure 1.
Experiment design for LOS propagation model. The experiment was 10 m long and considered a single LED and photodiode.

Figure 2.
LOS propagation model simulation environment in Optisystem.

Figure 3.
Experiment design for single LED NLOS propagation model. The experiment was 10 m long and considered a single LED and photodiode with multiple refection points.
Figure 3.
Experiment design for single LED NLOS propagation model. The experiment was 10 m long and considered a single LED and photodiode with multiple refection points.
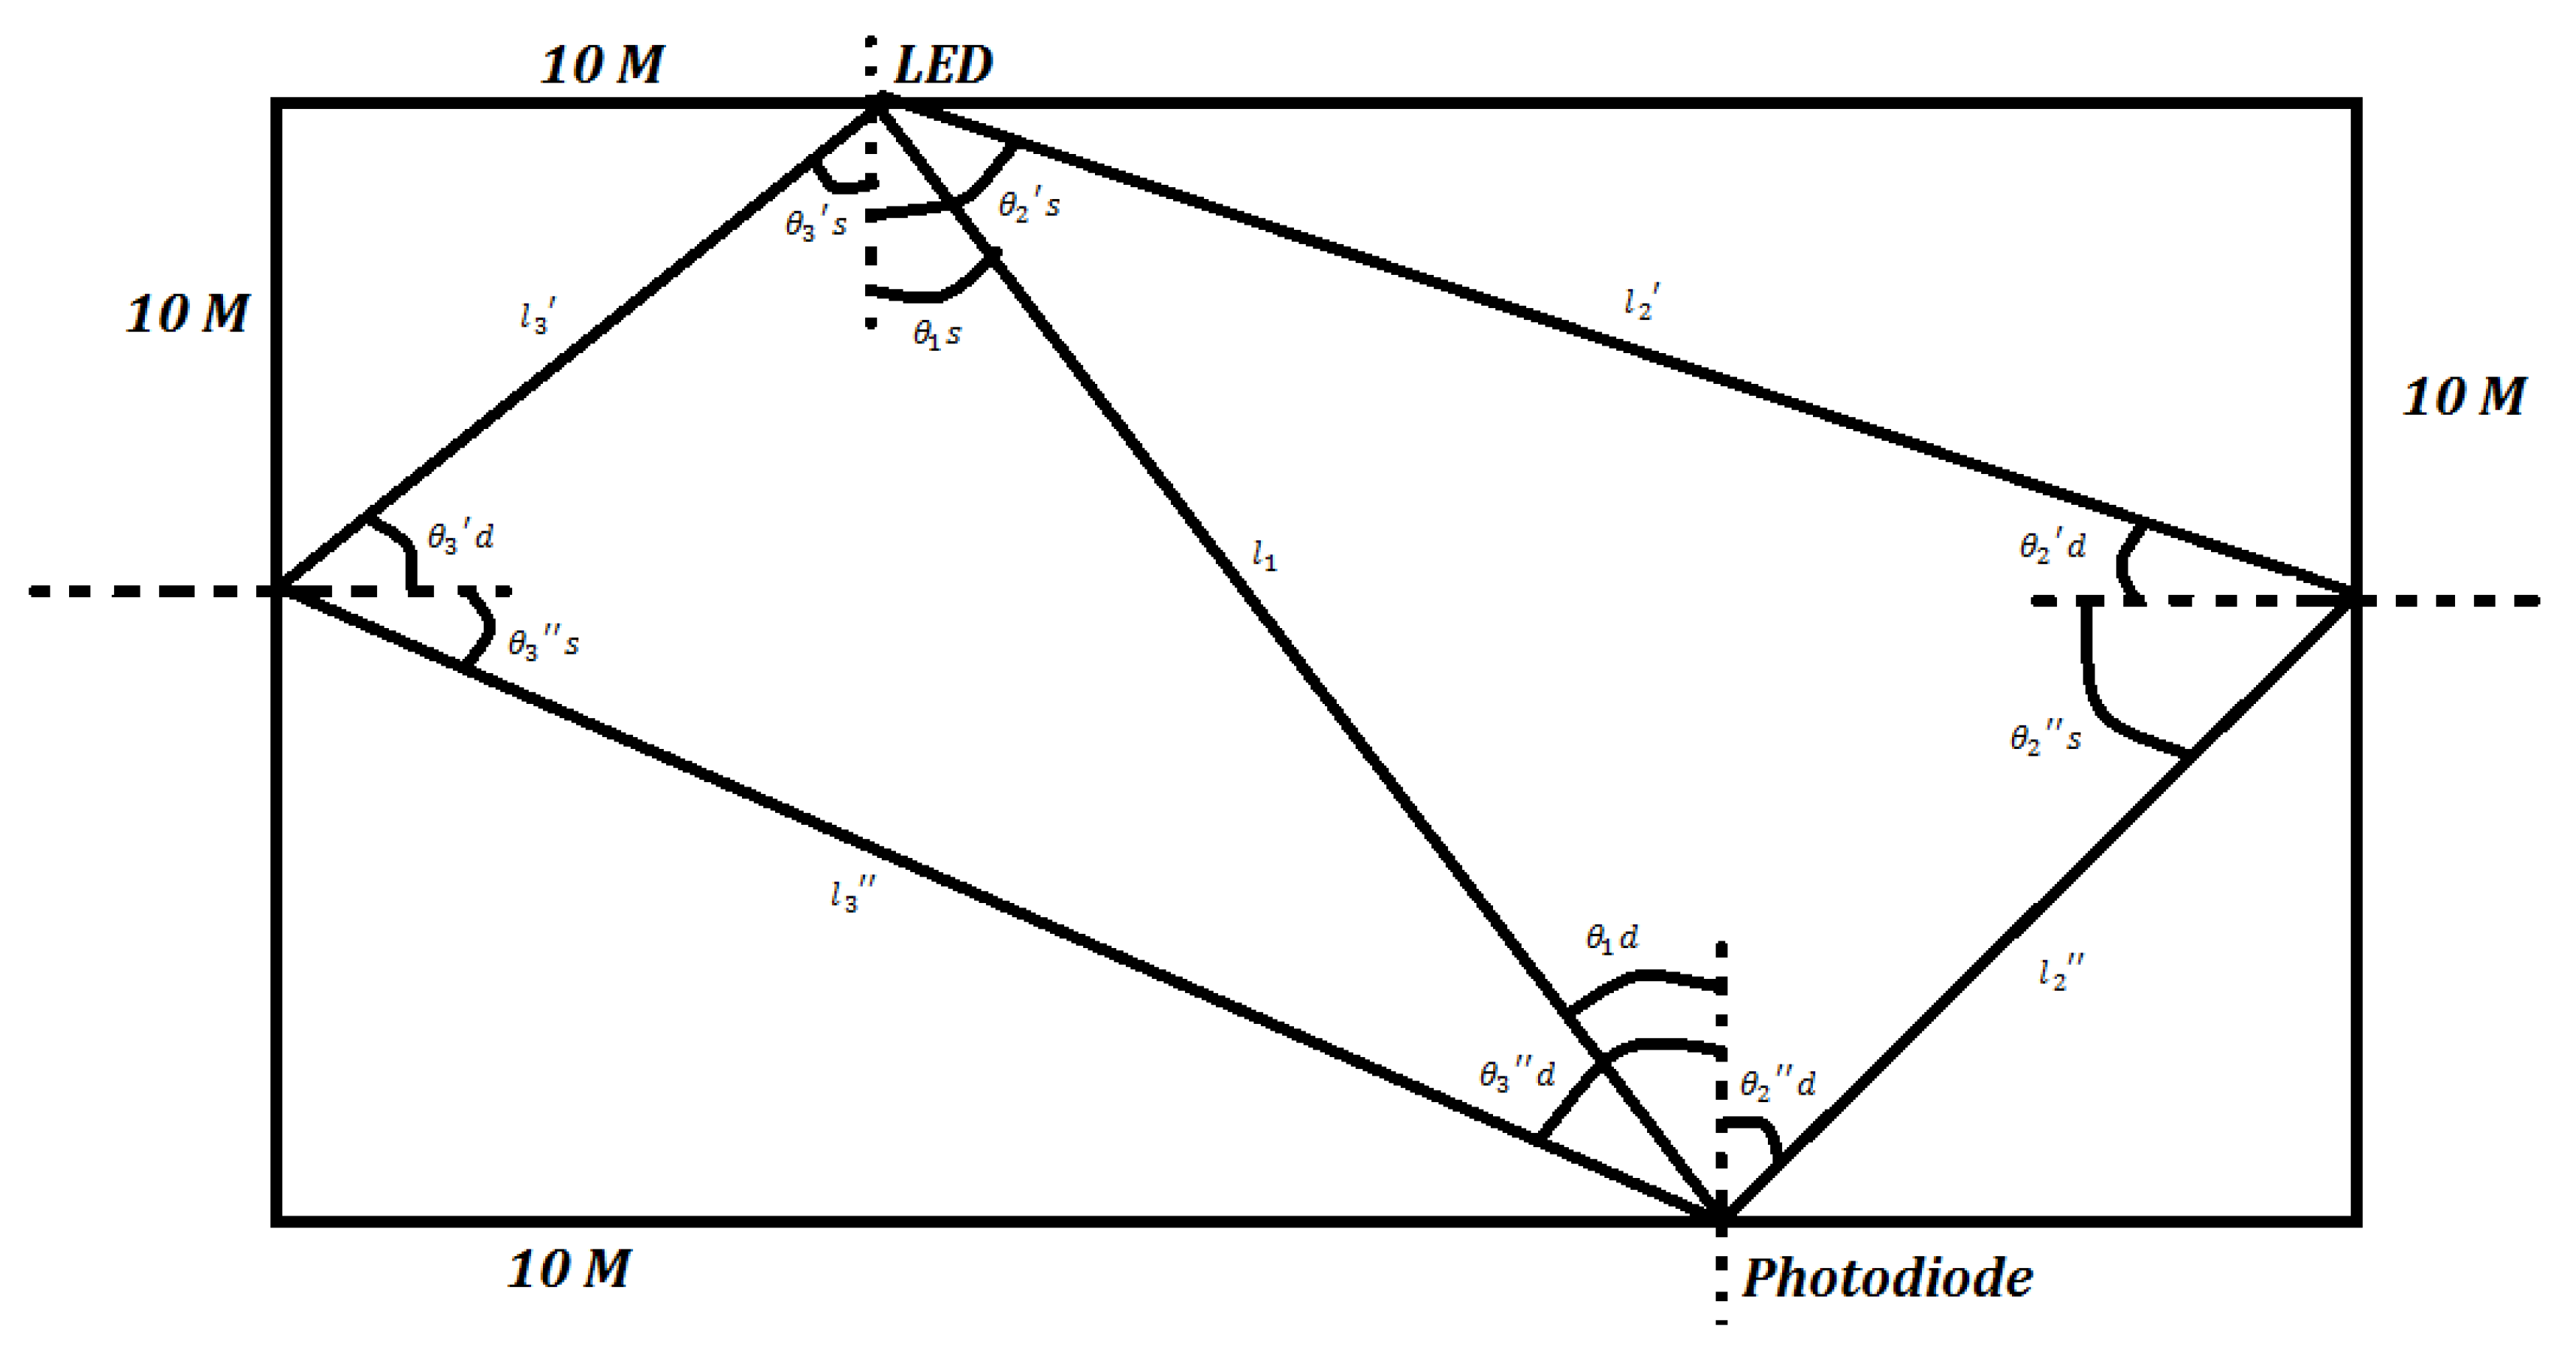
Figure 4.
Single LED NLOS propagation model simulation environment in Optisystem.
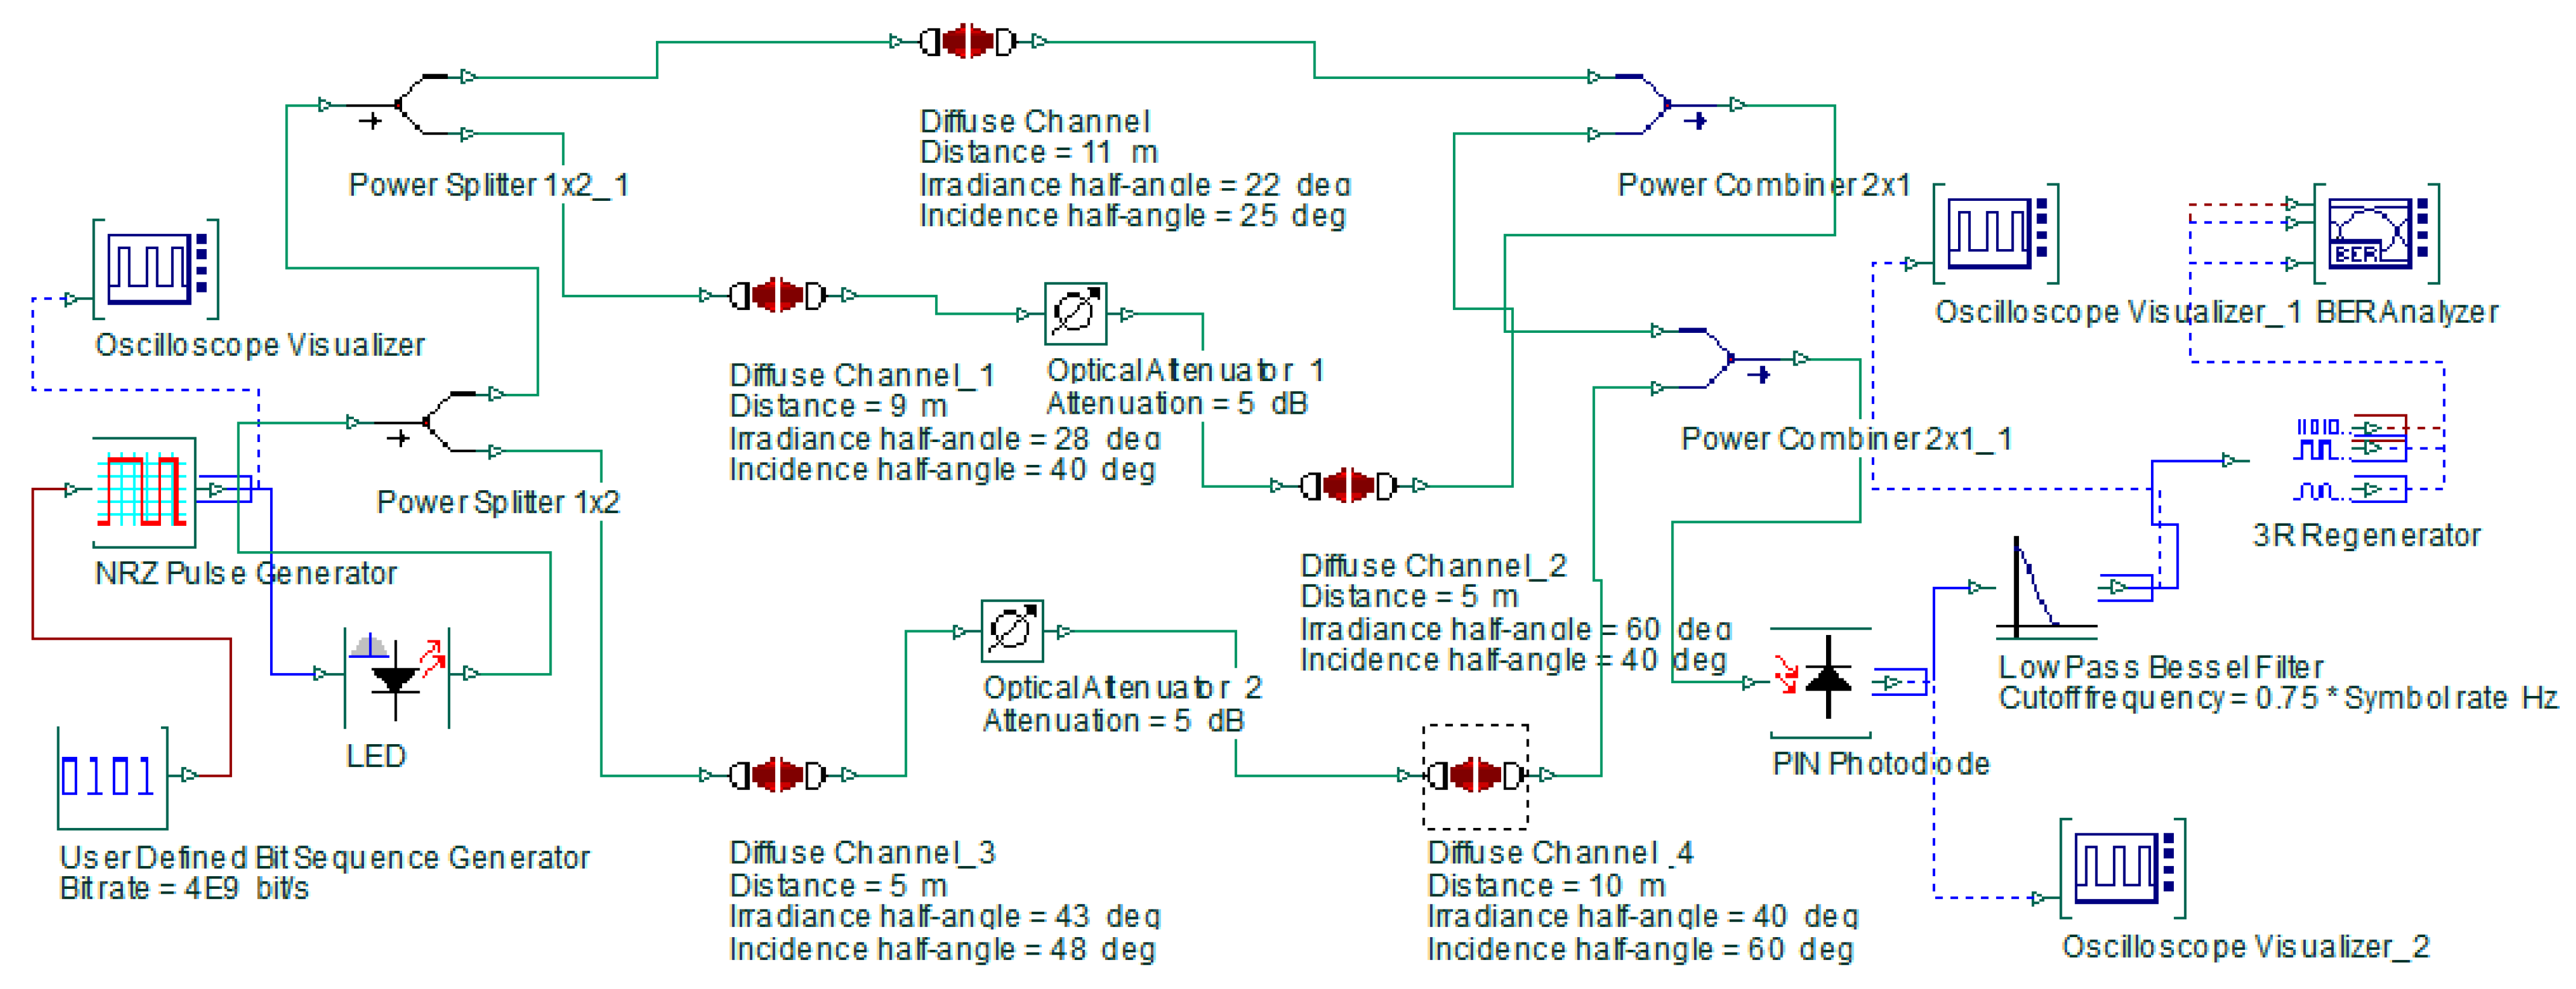
Figure 5.
Experiment design for dual LED NLOS propagation model. The experiment was 10 m long and considered a single LED and photodiode with multiple refection points.
Figure 5.
Experiment design for dual LED NLOS propagation model. The experiment was 10 m long and considered a single LED and photodiode with multiple refection points.
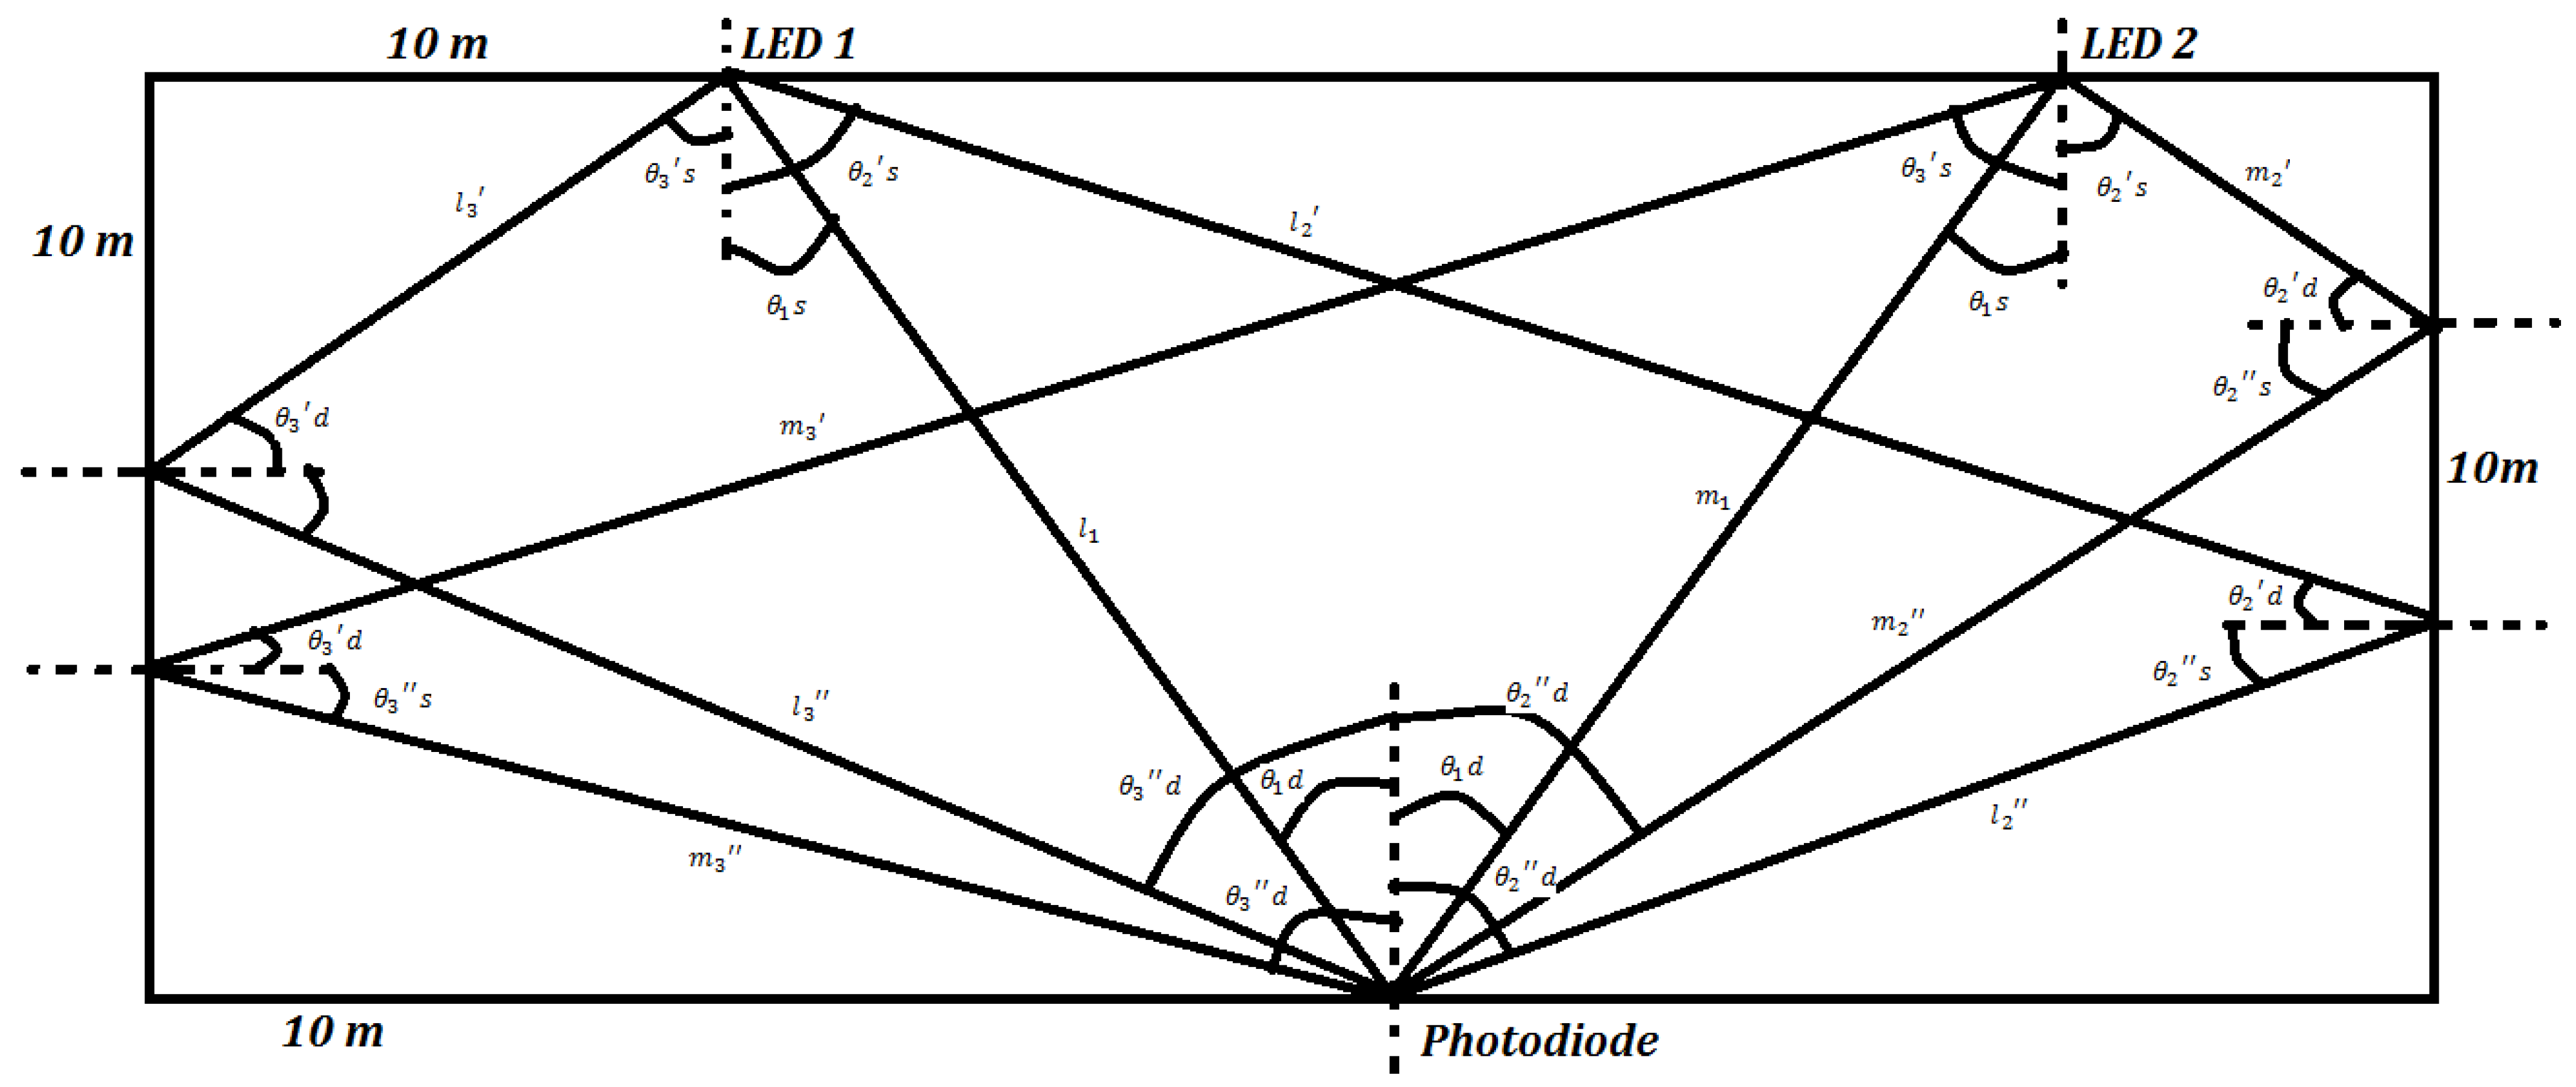
Figure 6.
Dual LED NLOS propagation model simulation environment in Optisystem.
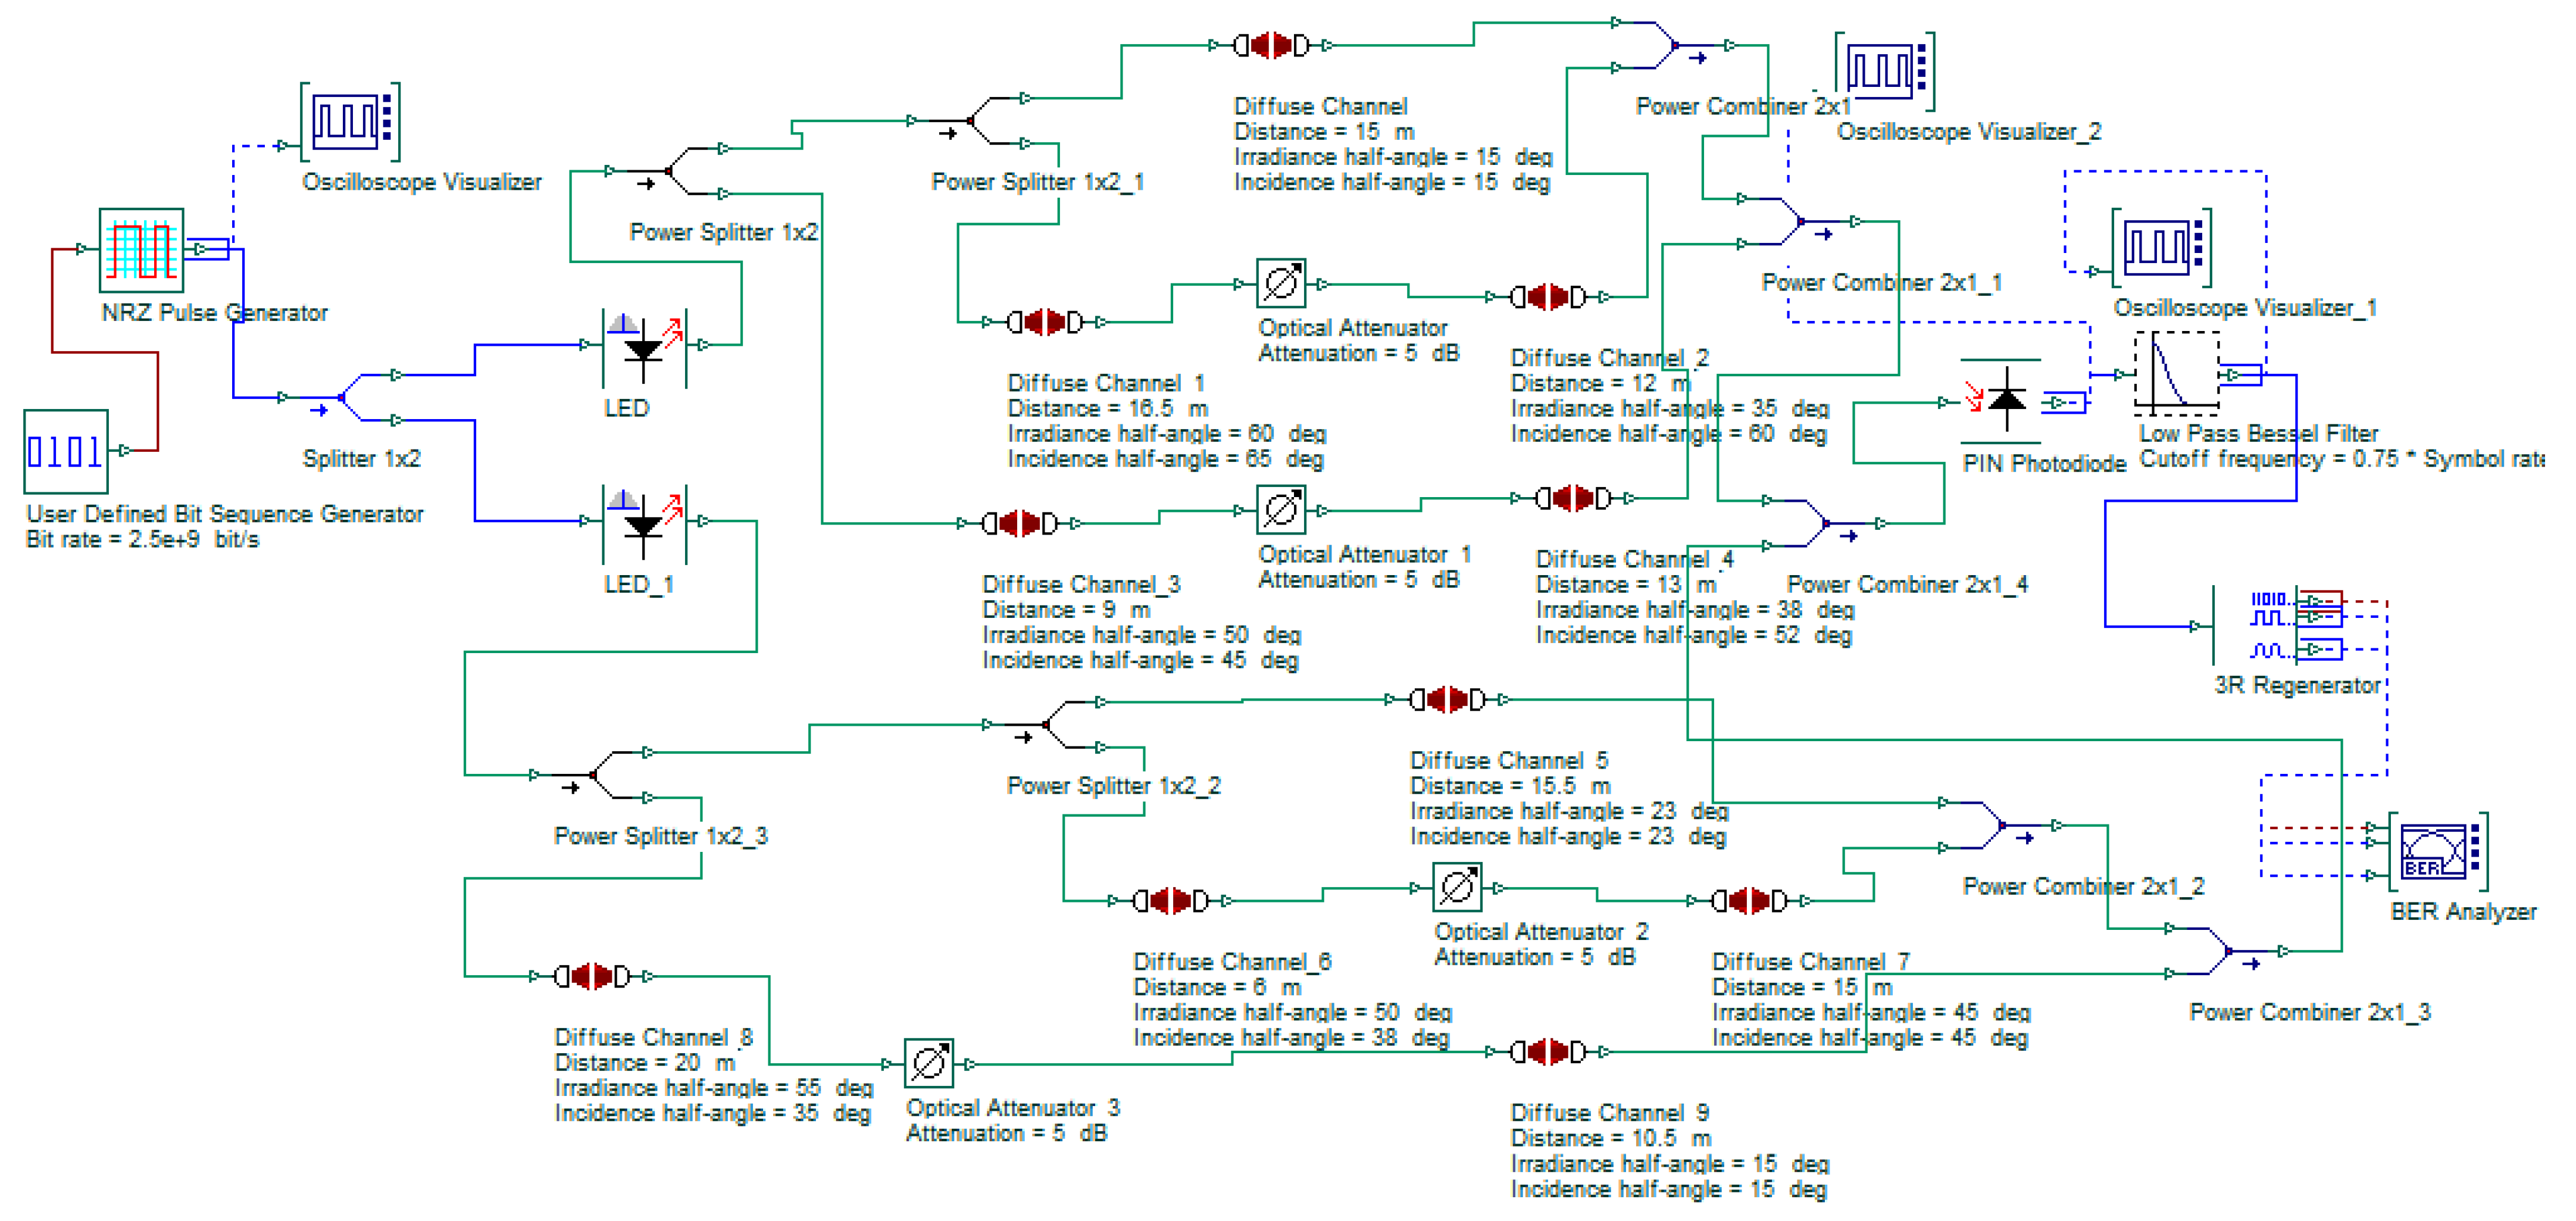
Figure 7.
VLC system model with a single reflection wall and LED is placed on the room ceiling.
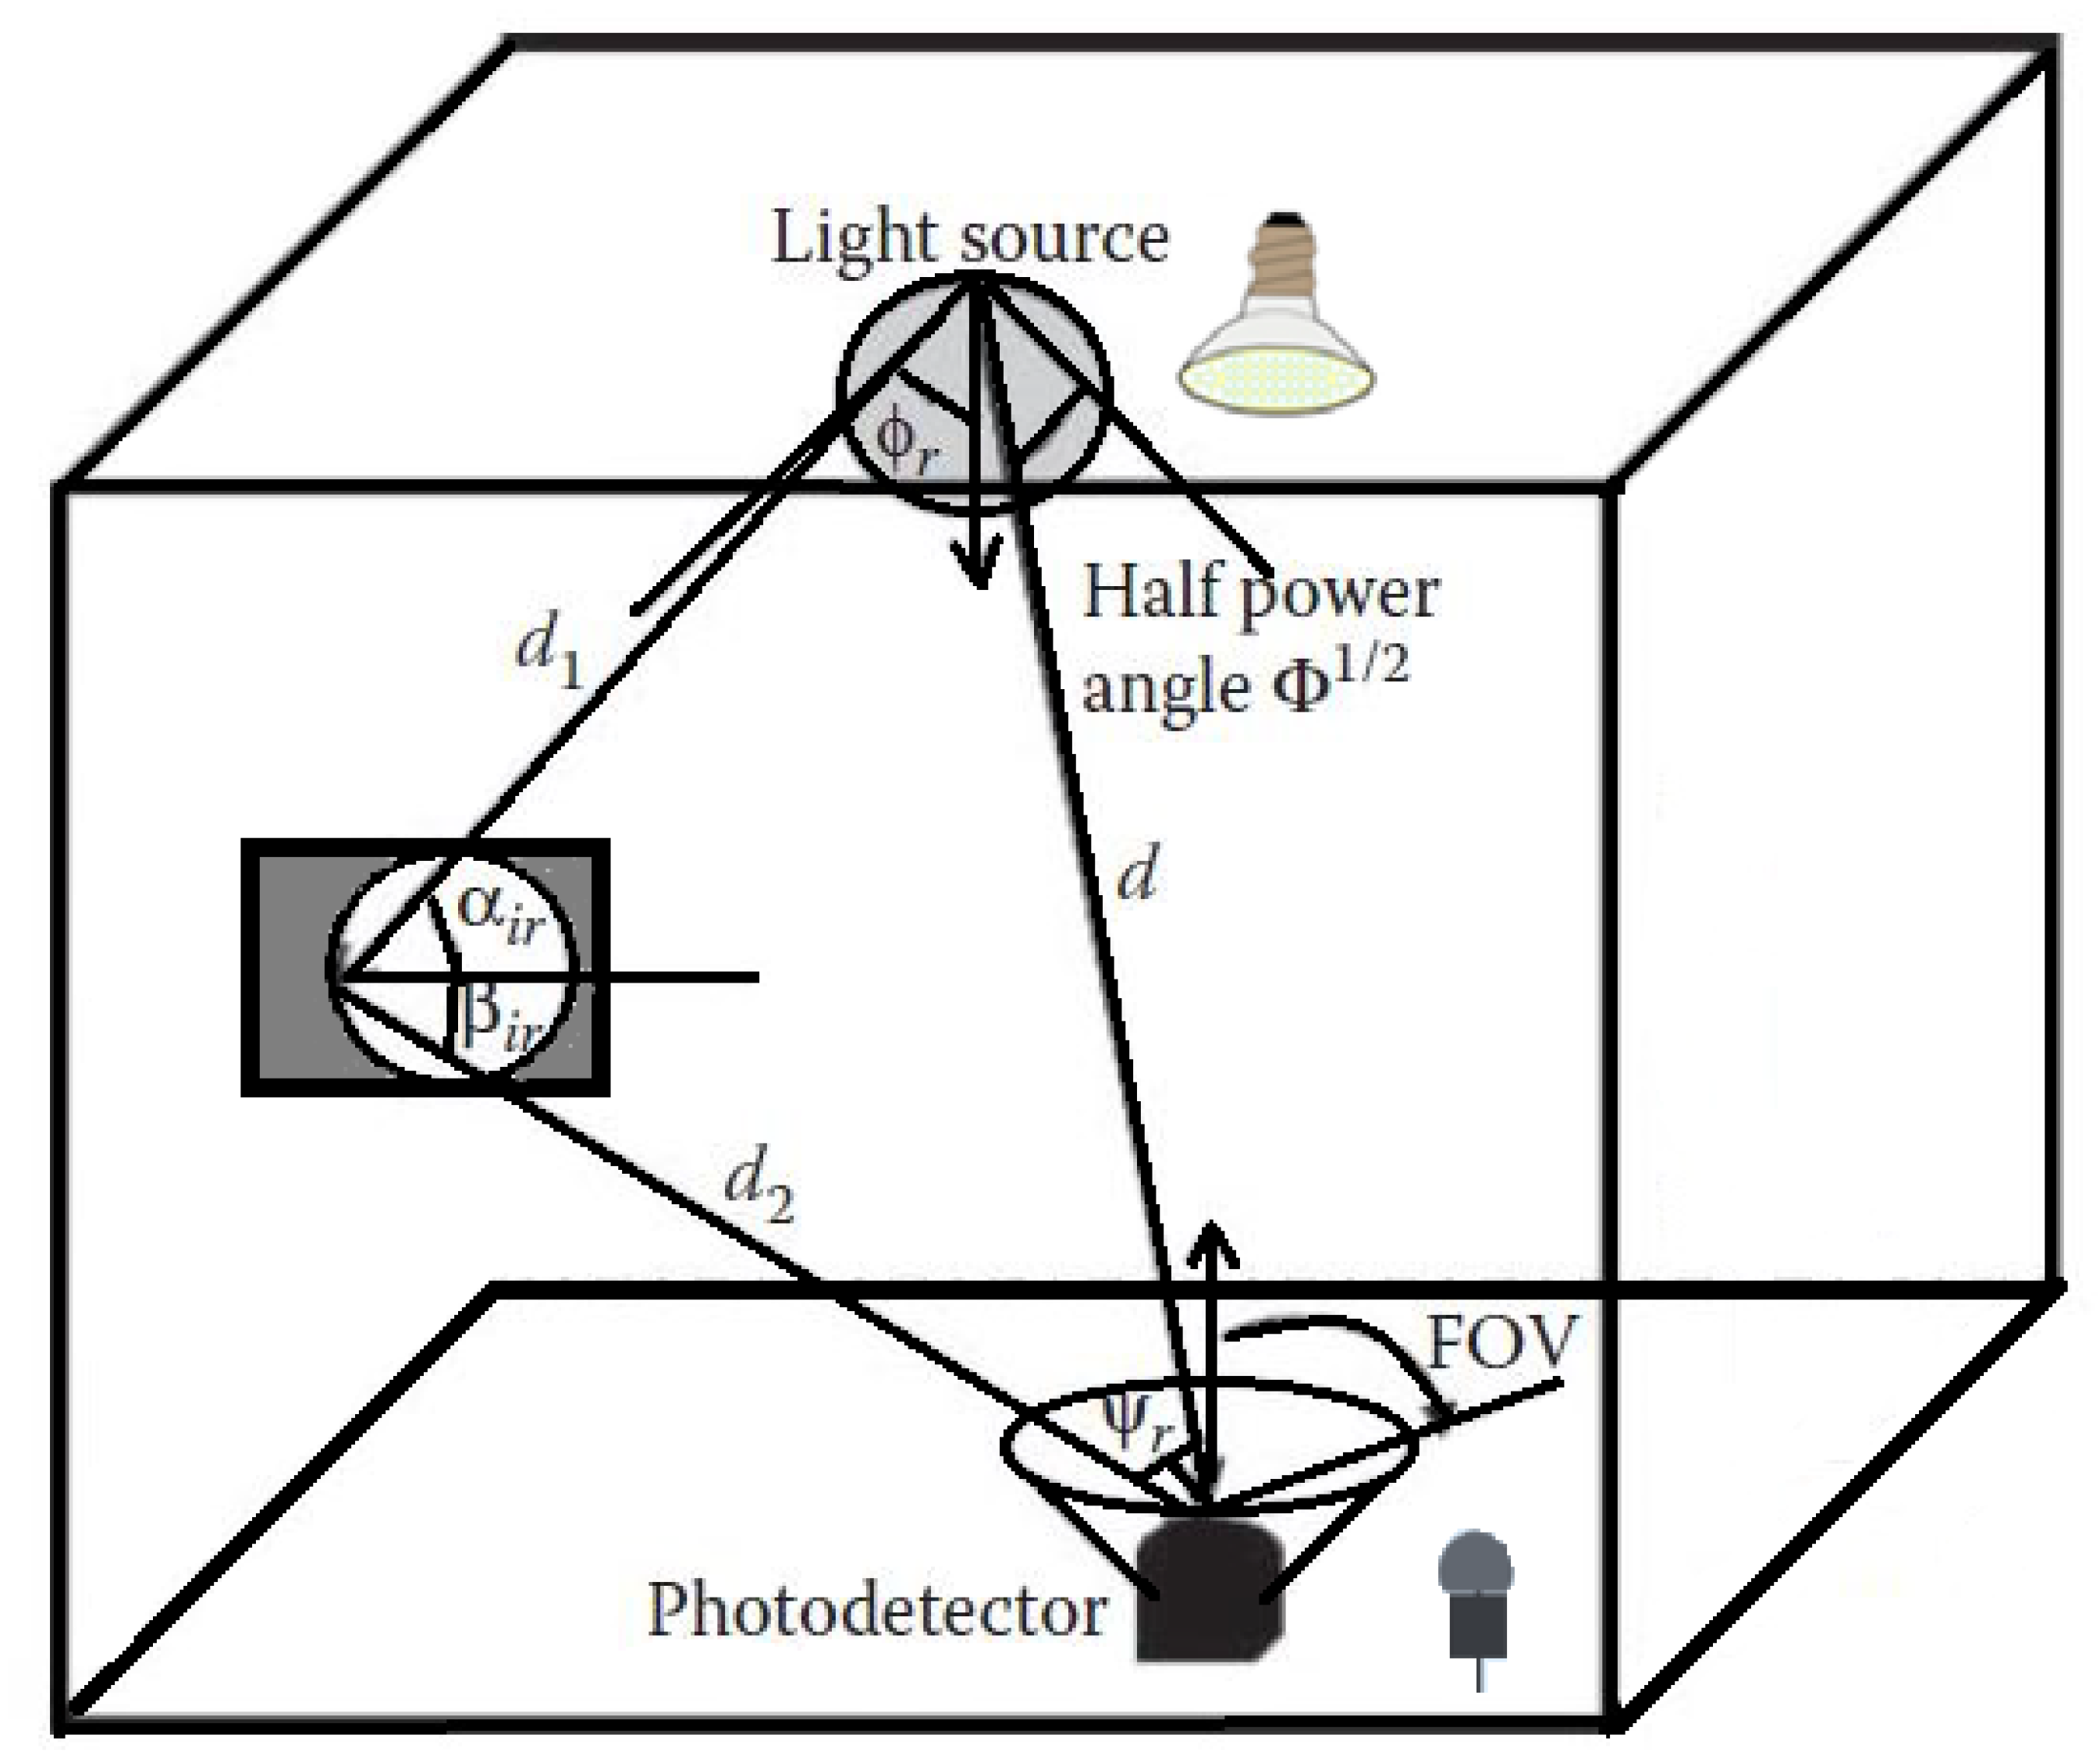
Figure 8.
VLC transmitter design for hardware implementation.
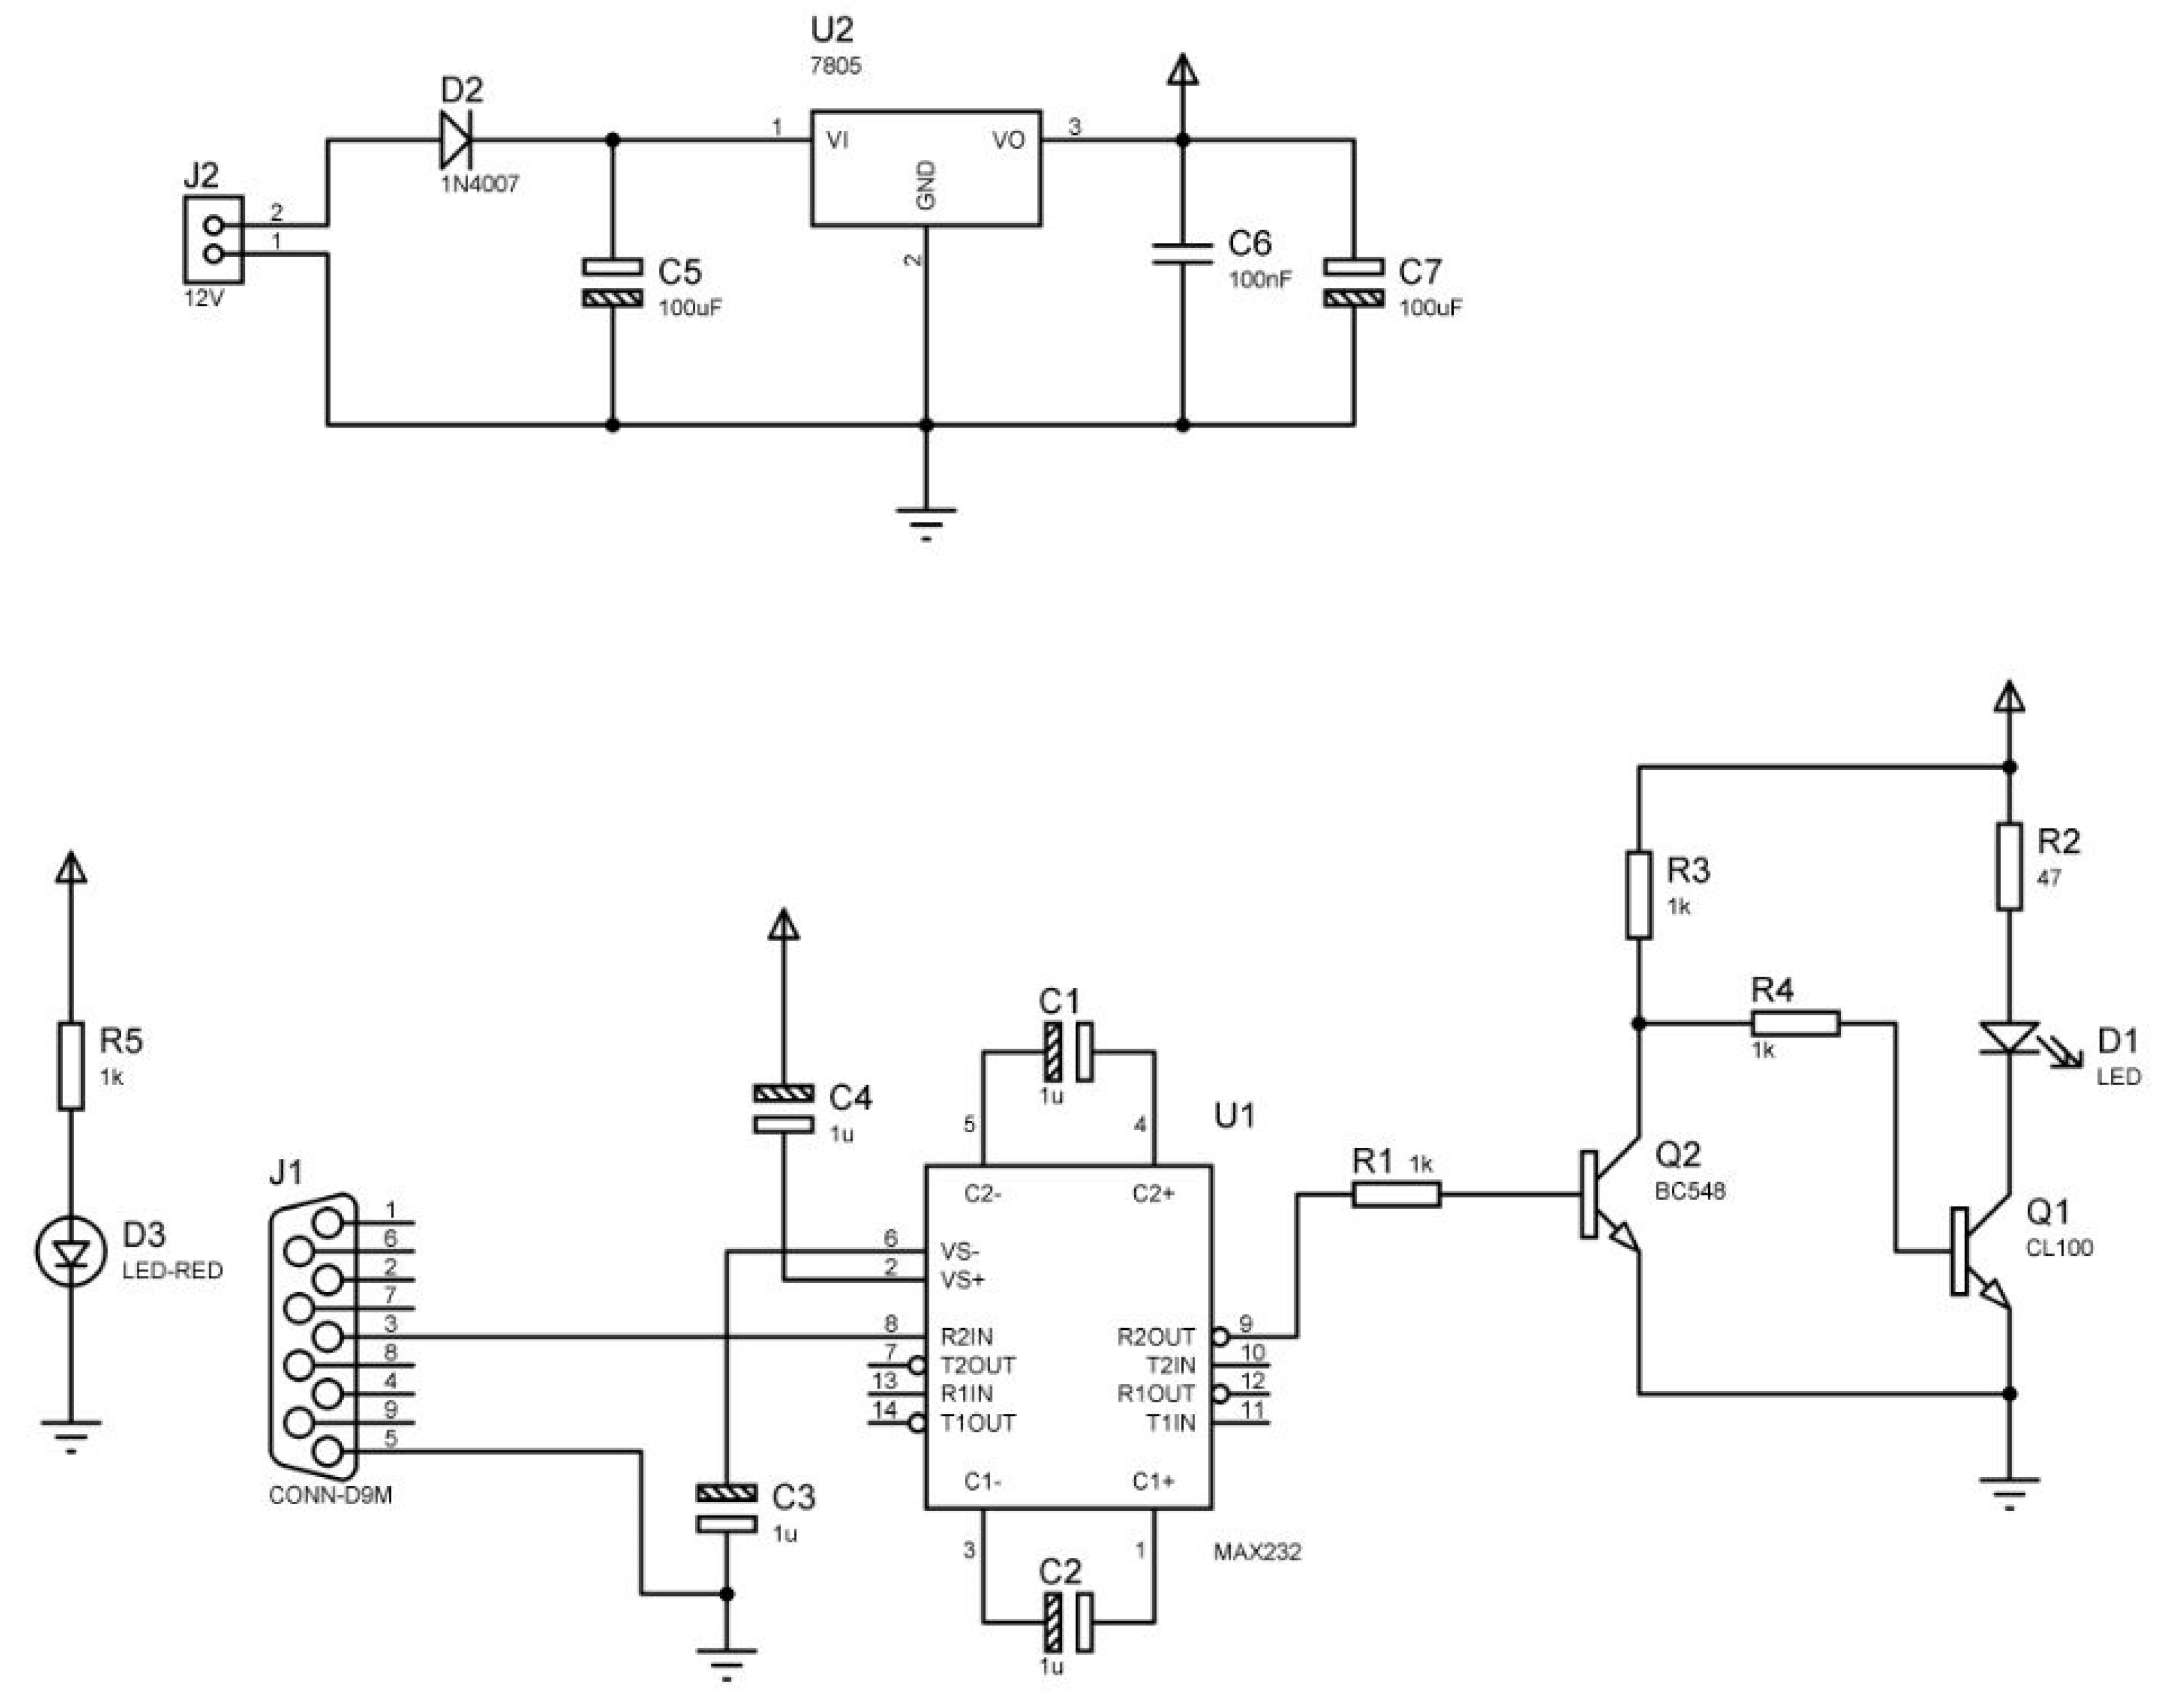
Figure 9.
XCTU terminal.

Figure 10.
VLC receiver design for hardware implementation.
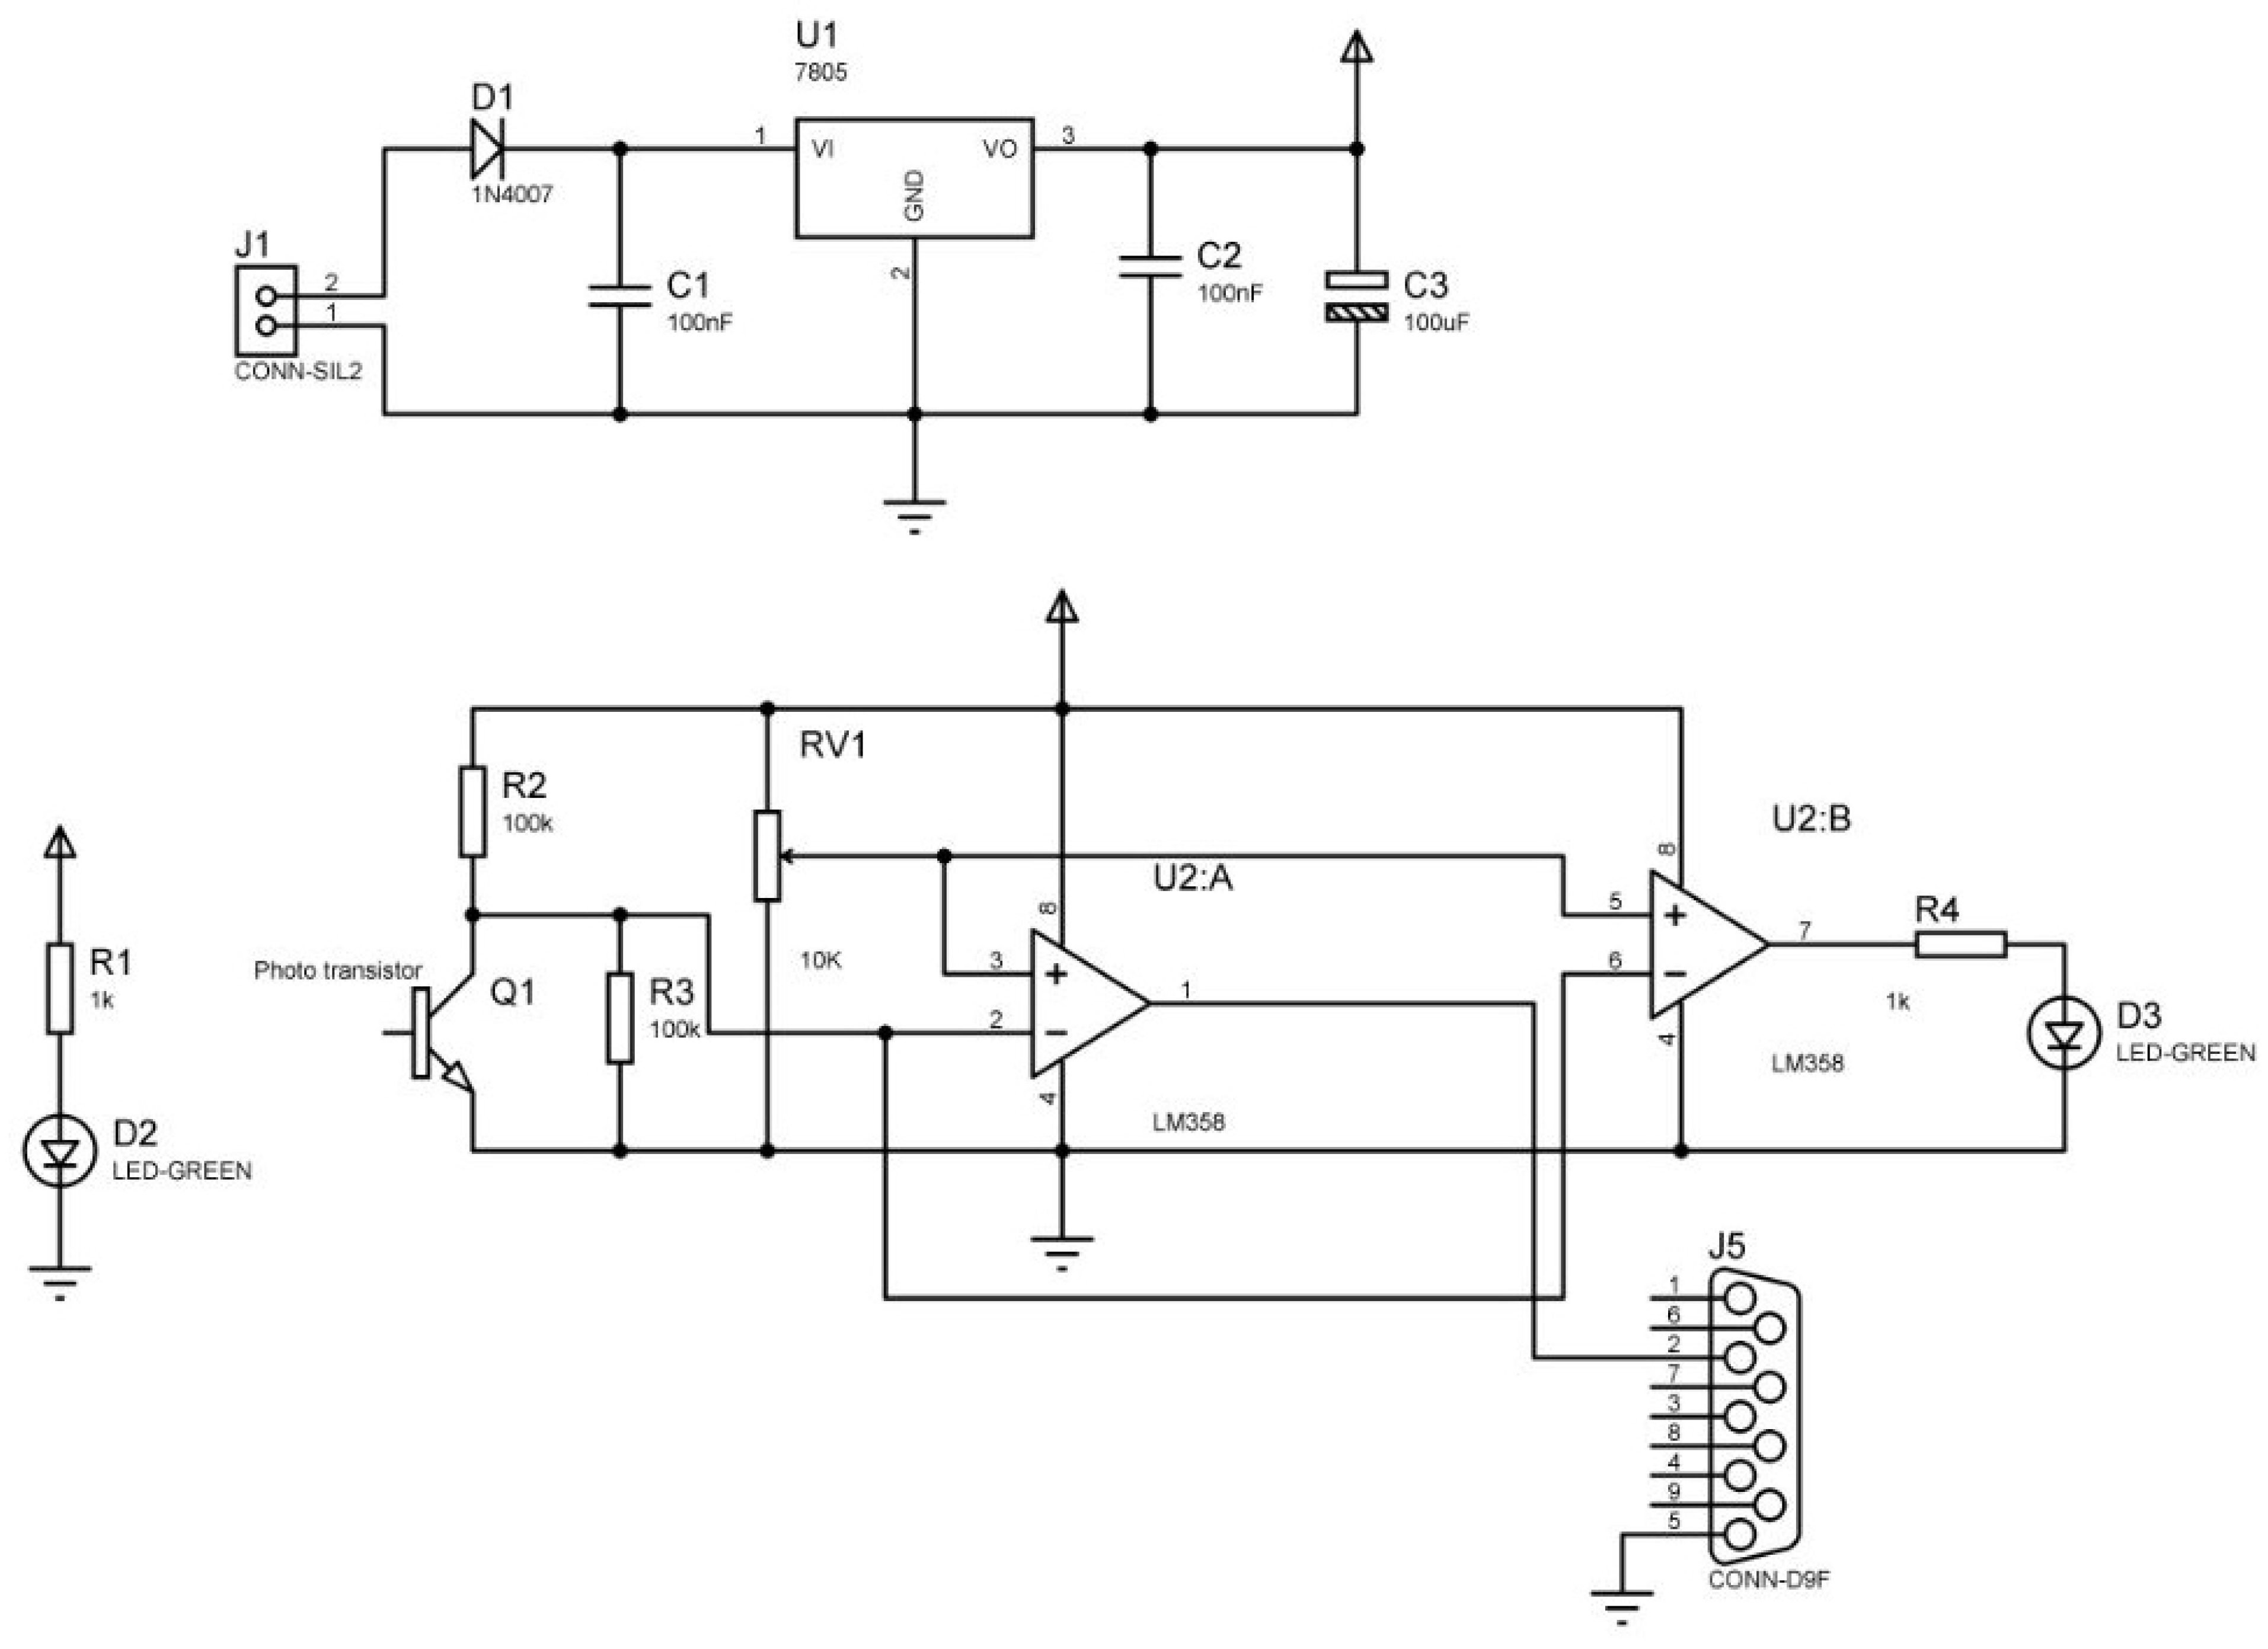
Figure 11.
Simulation results from LOS propagation model. (a) Input signal. (b) Output signal.
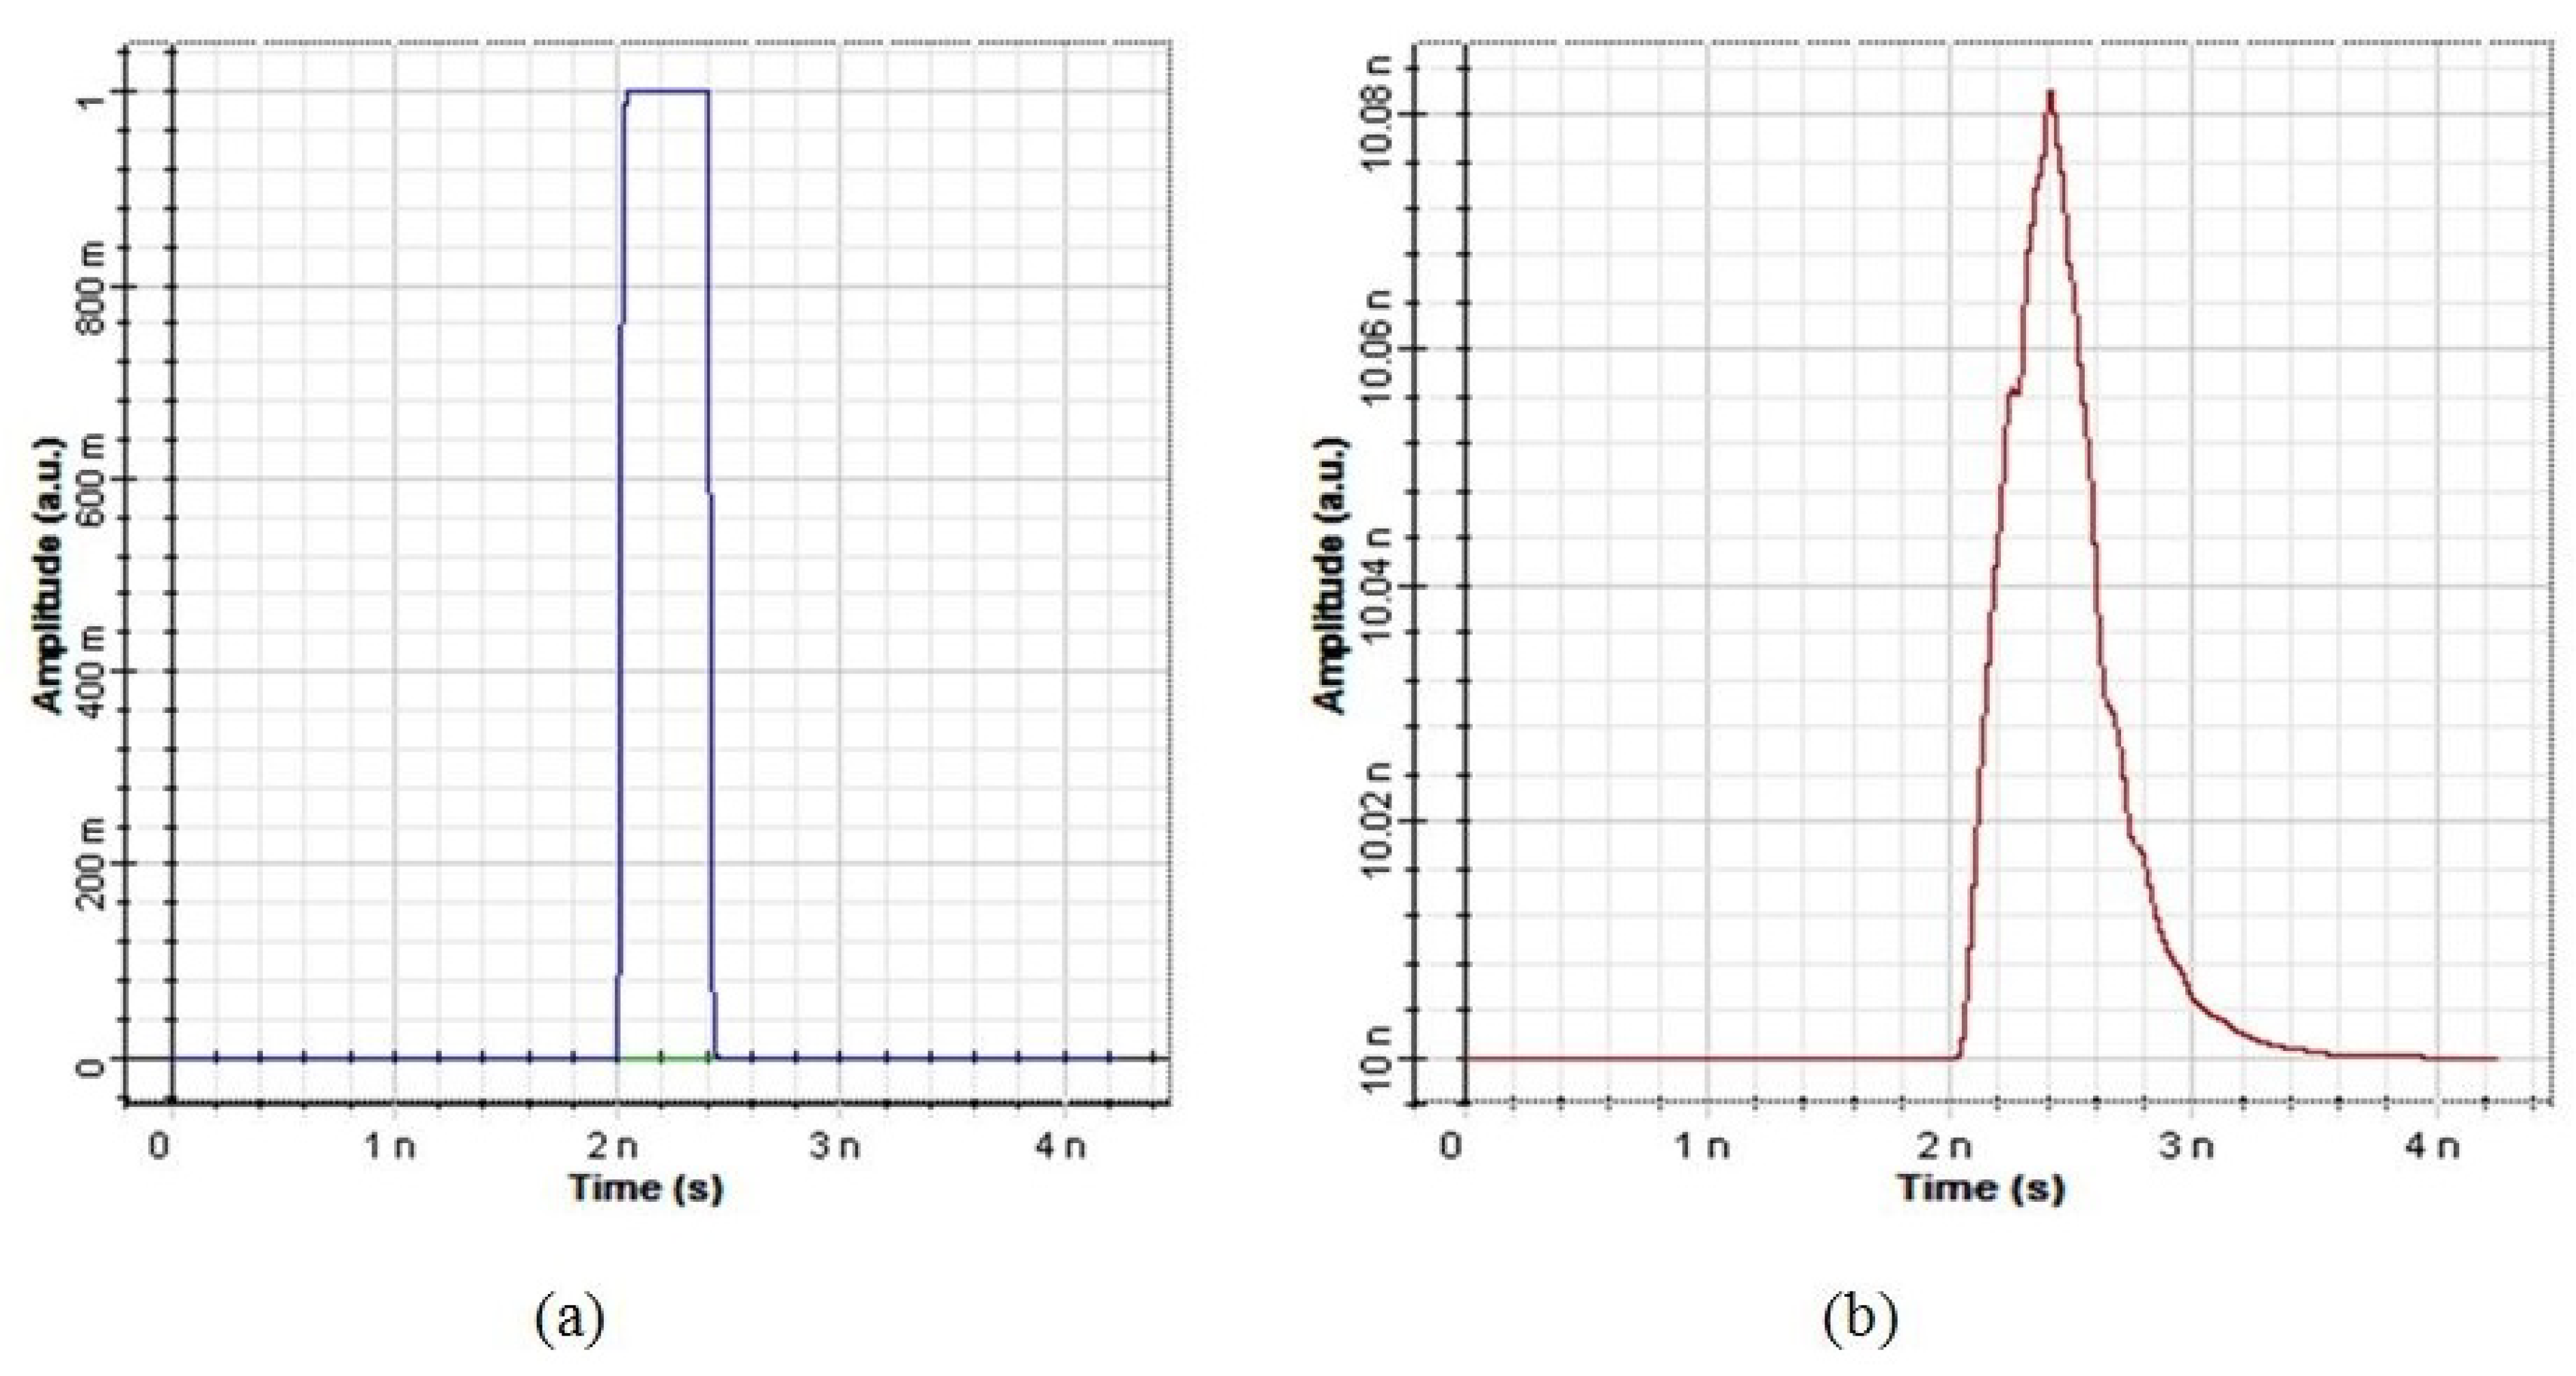
Figure 12.
Simulation results from a single LED NLOS propagation model. (a) Input signal. (b) Output signal.
Figure 12.
Simulation results from a single LED NLOS propagation model. (a) Input signal. (b) Output signal.

Figure 13.
Simulation results from a dual LED NLOS propagation model. (a) Input signal. (b) Output signal.
Figure 13.
Simulation results from a dual LED NLOS propagation model. (a) Input signal. (b) Output signal.
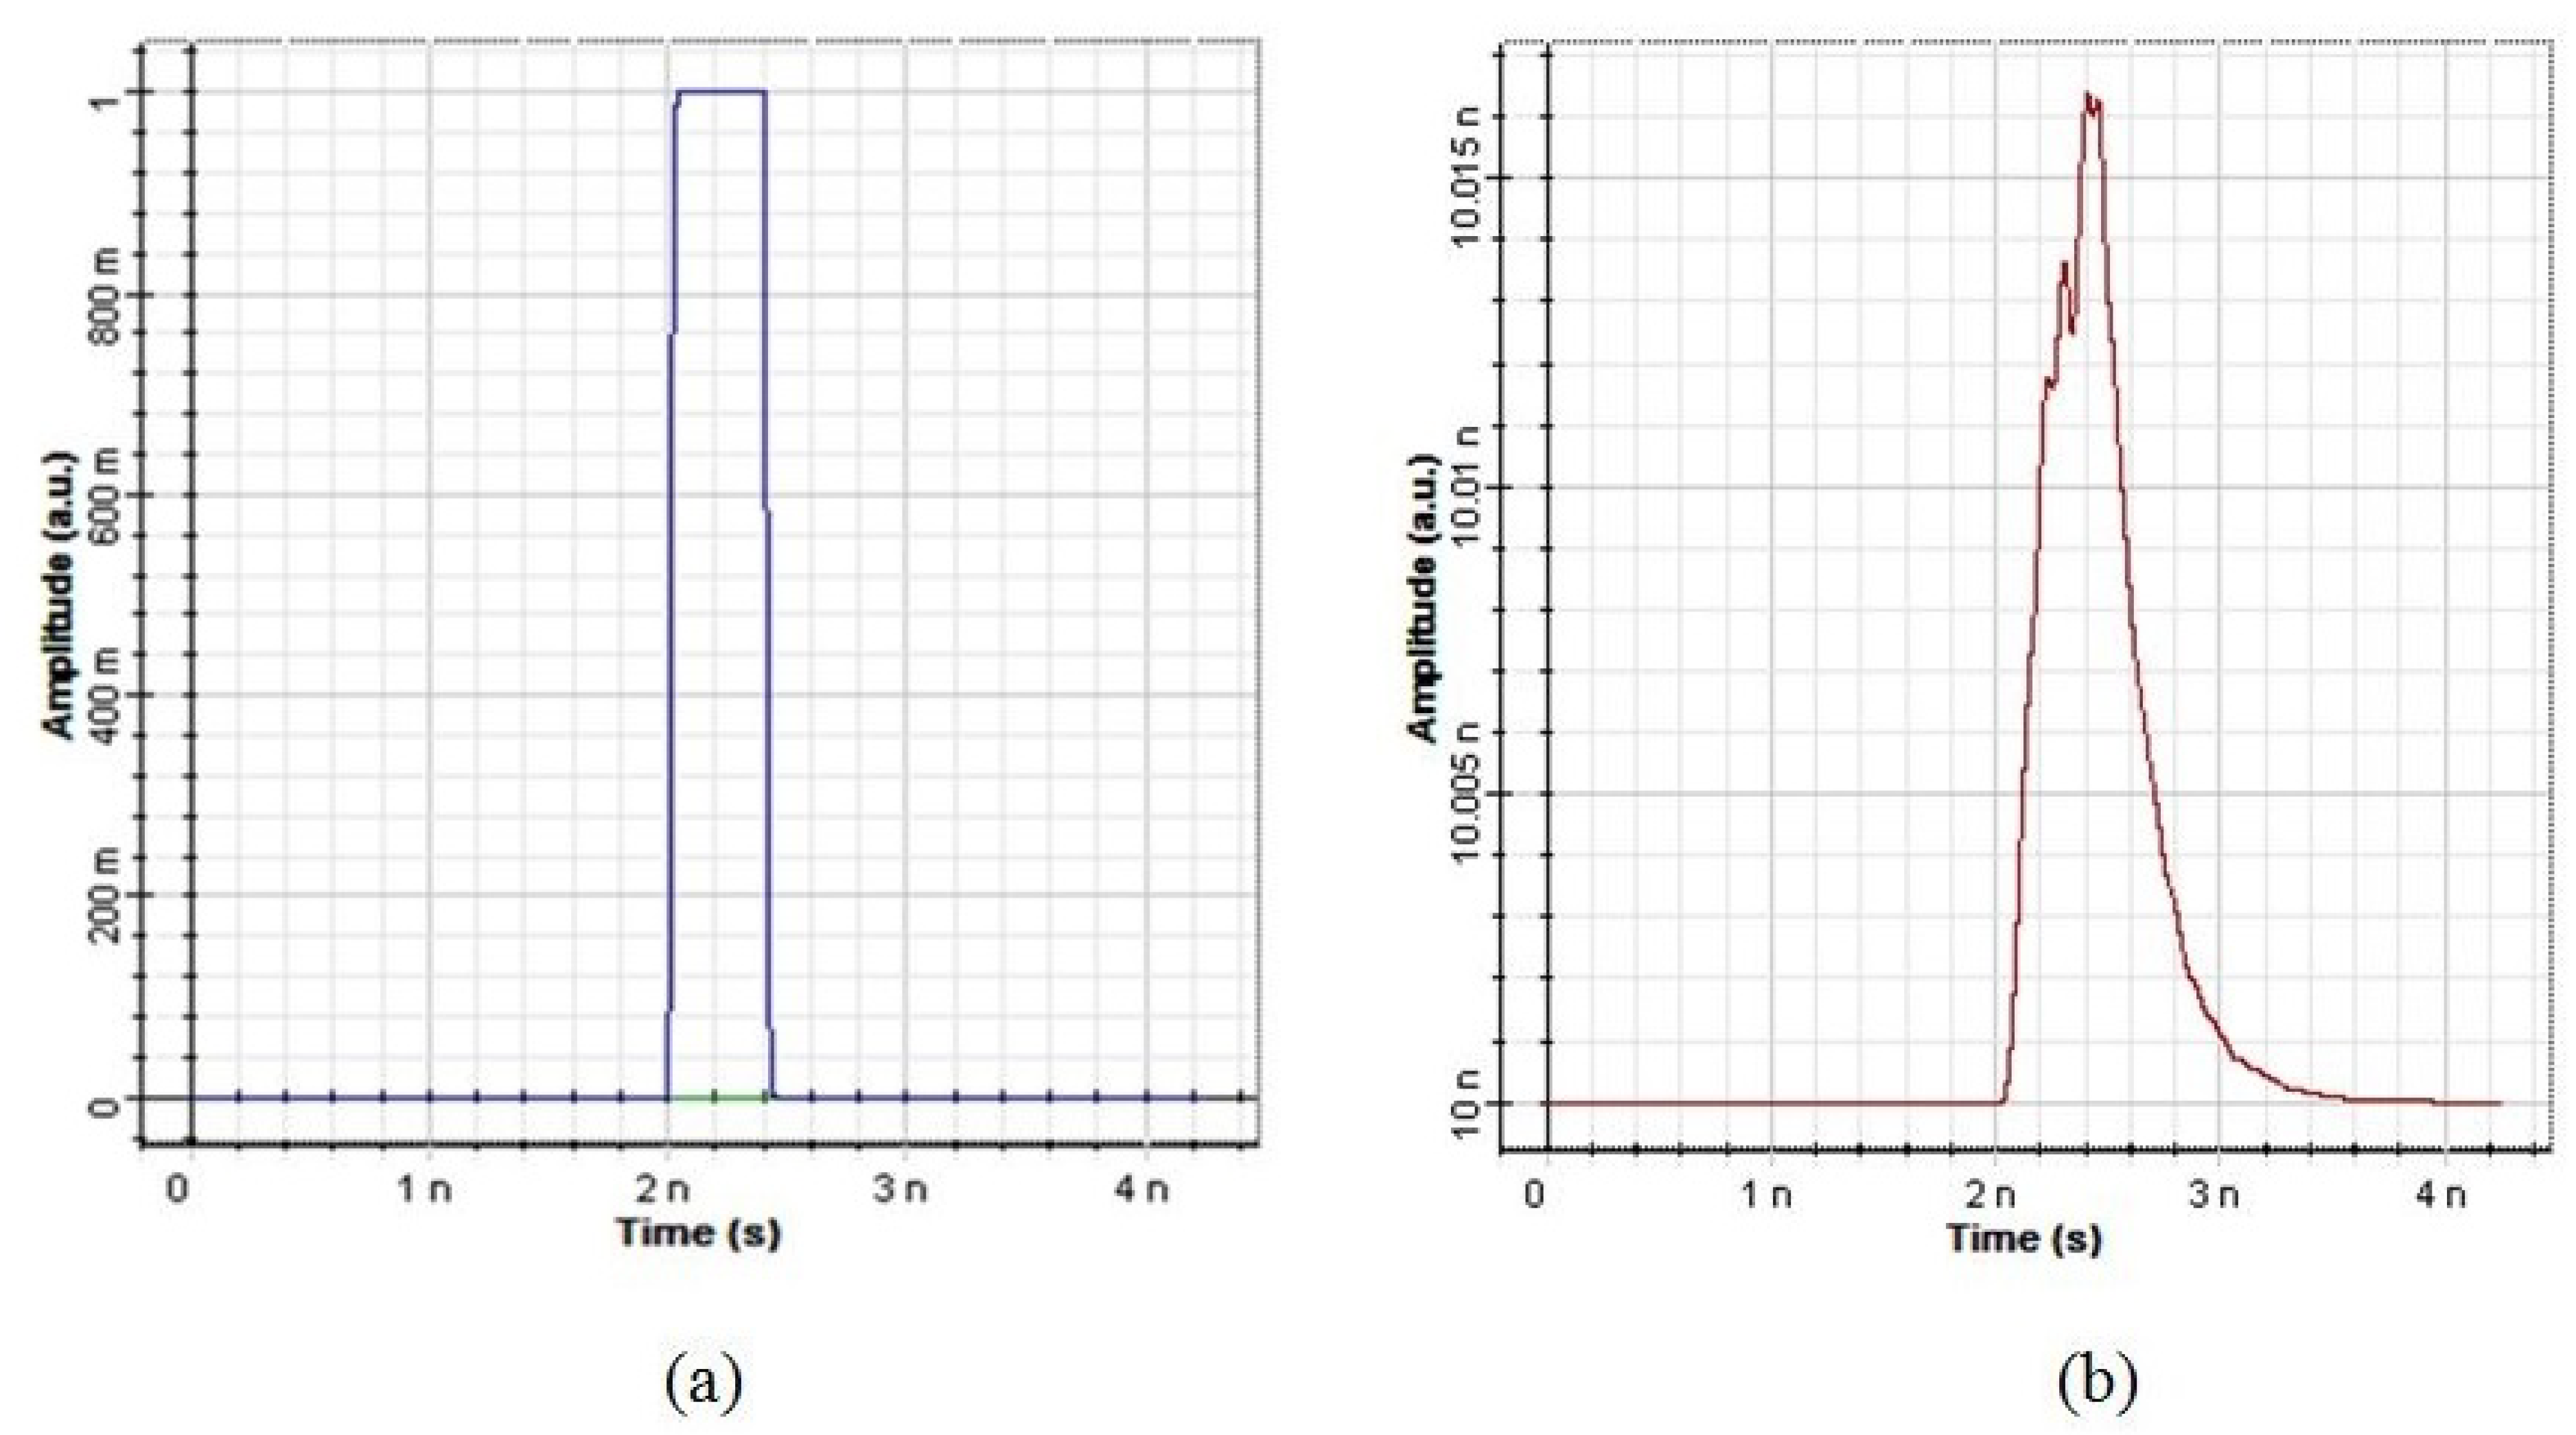
Figure 14.
Eye diagram results. (a) LOS. (b) Single LED NLOS. (c) Dual LED NLOS.
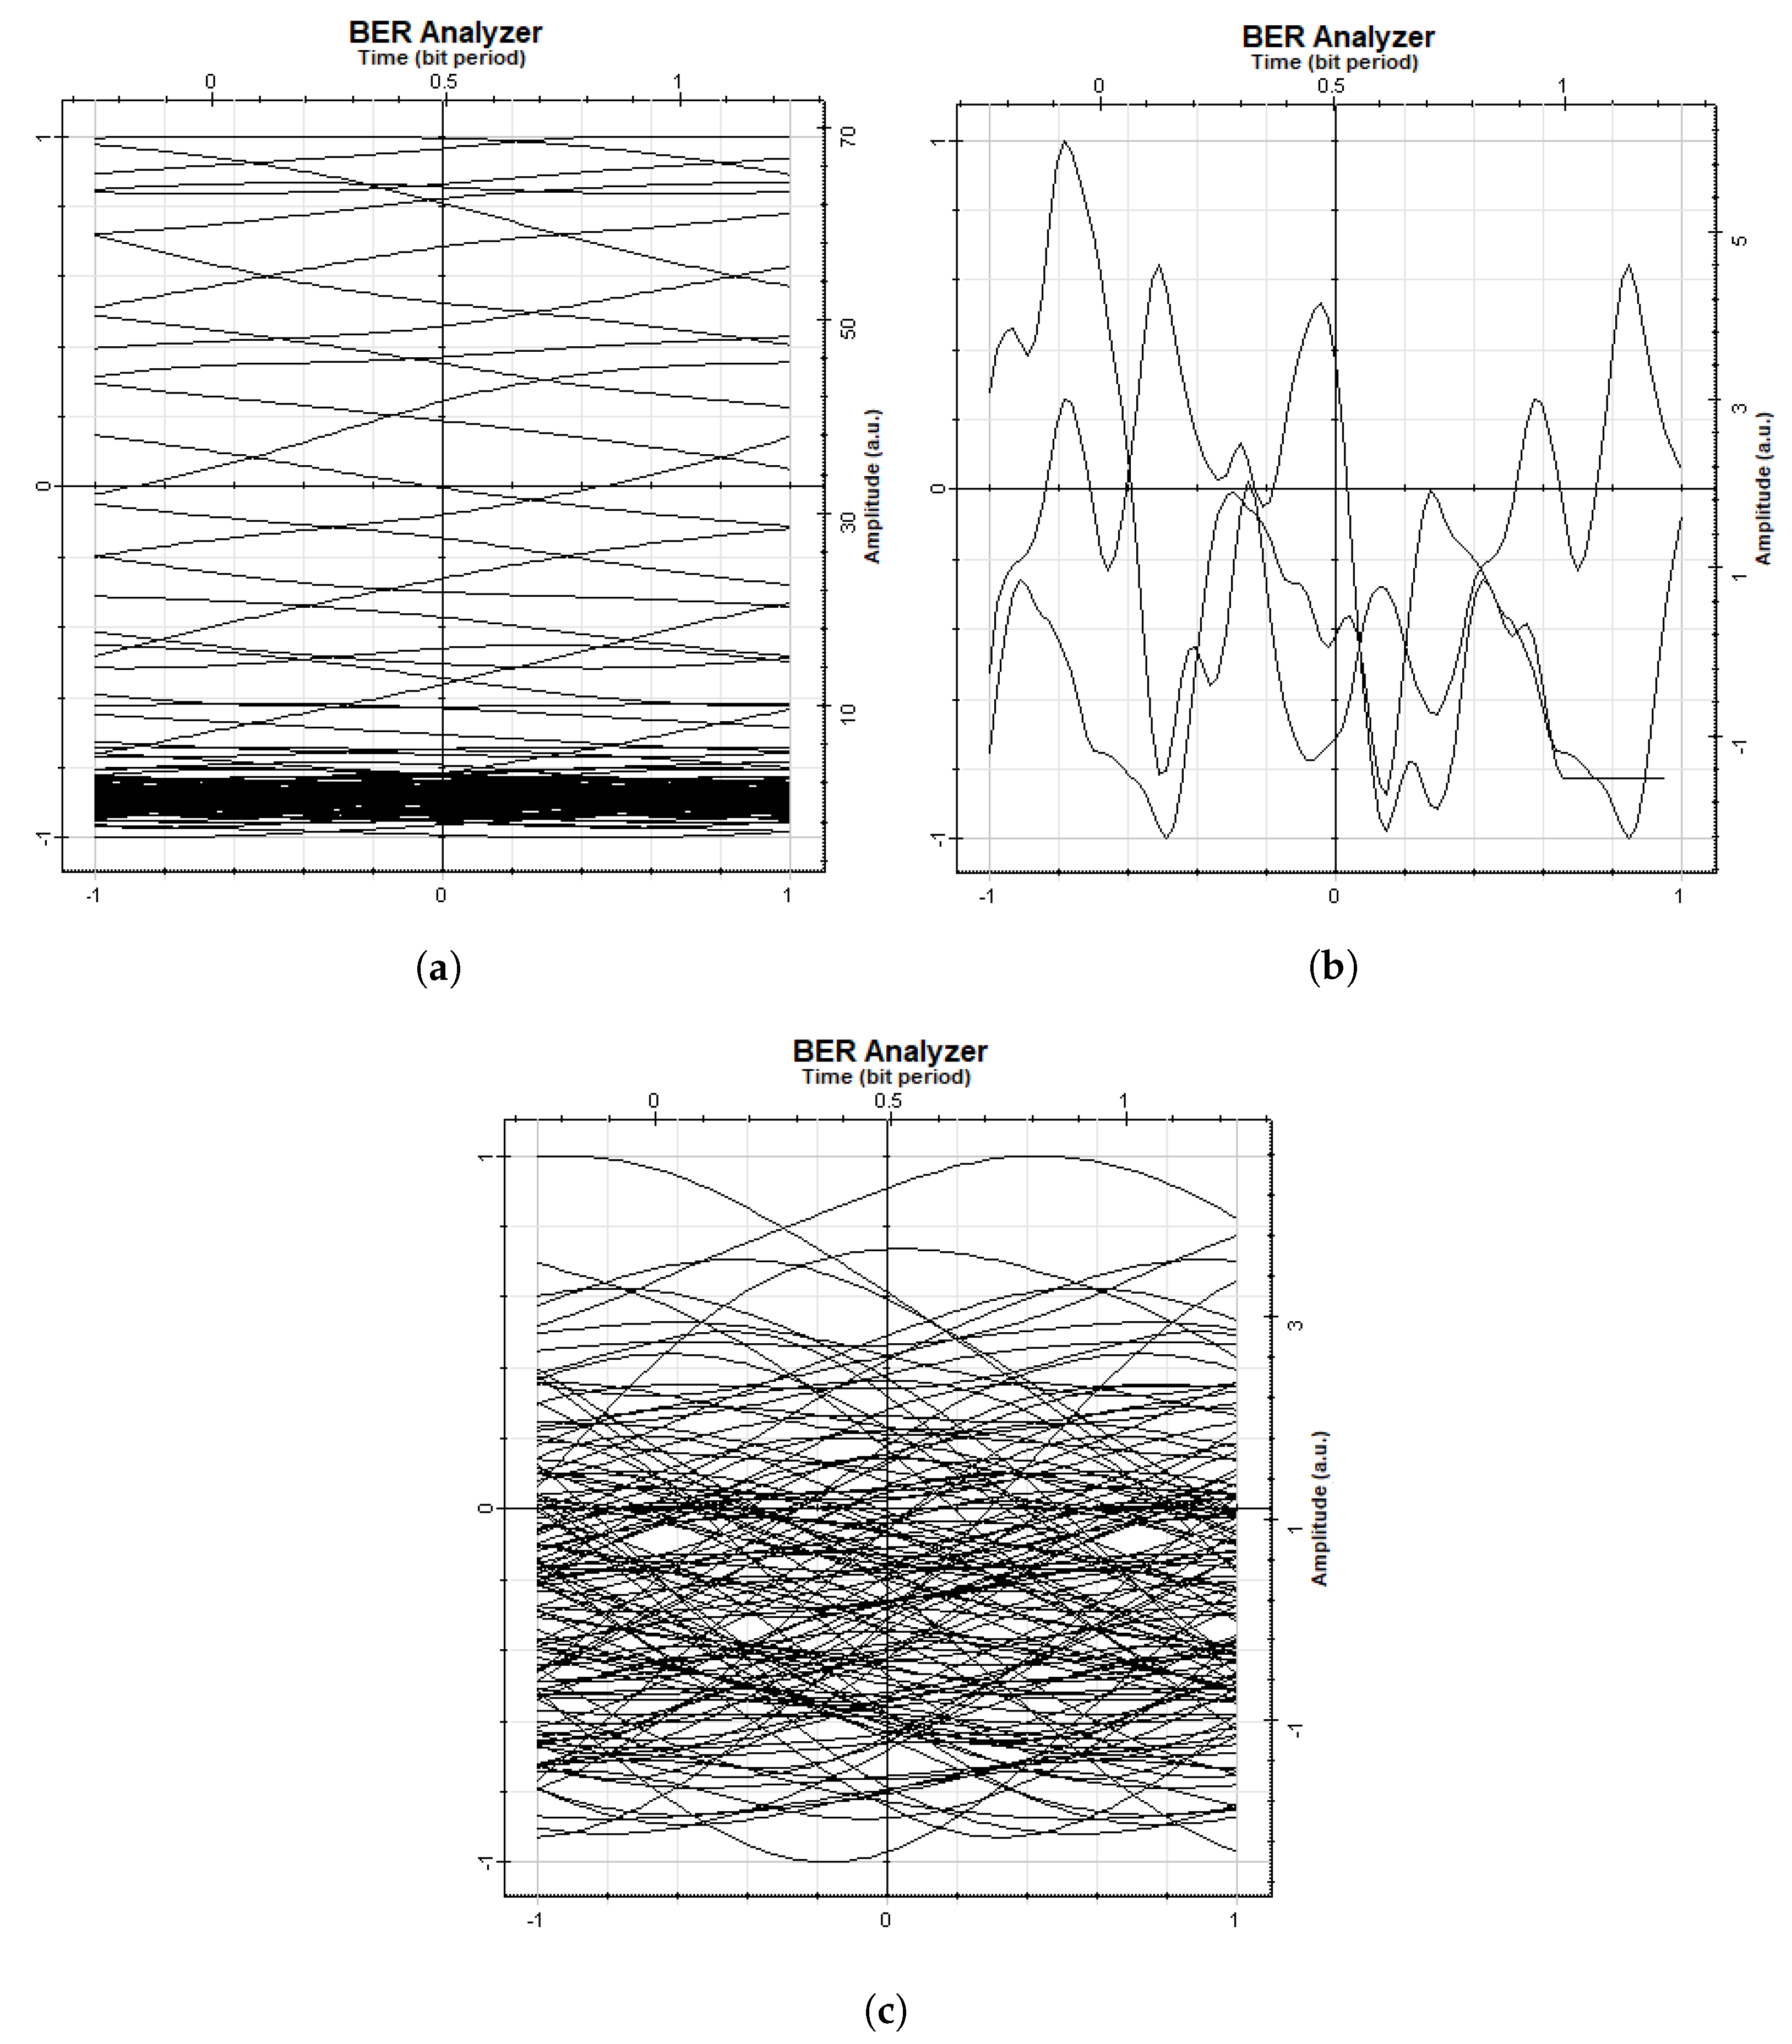
Figure 15.
Irradiance angle () effect on an LOS propagation model ( changes from to ).
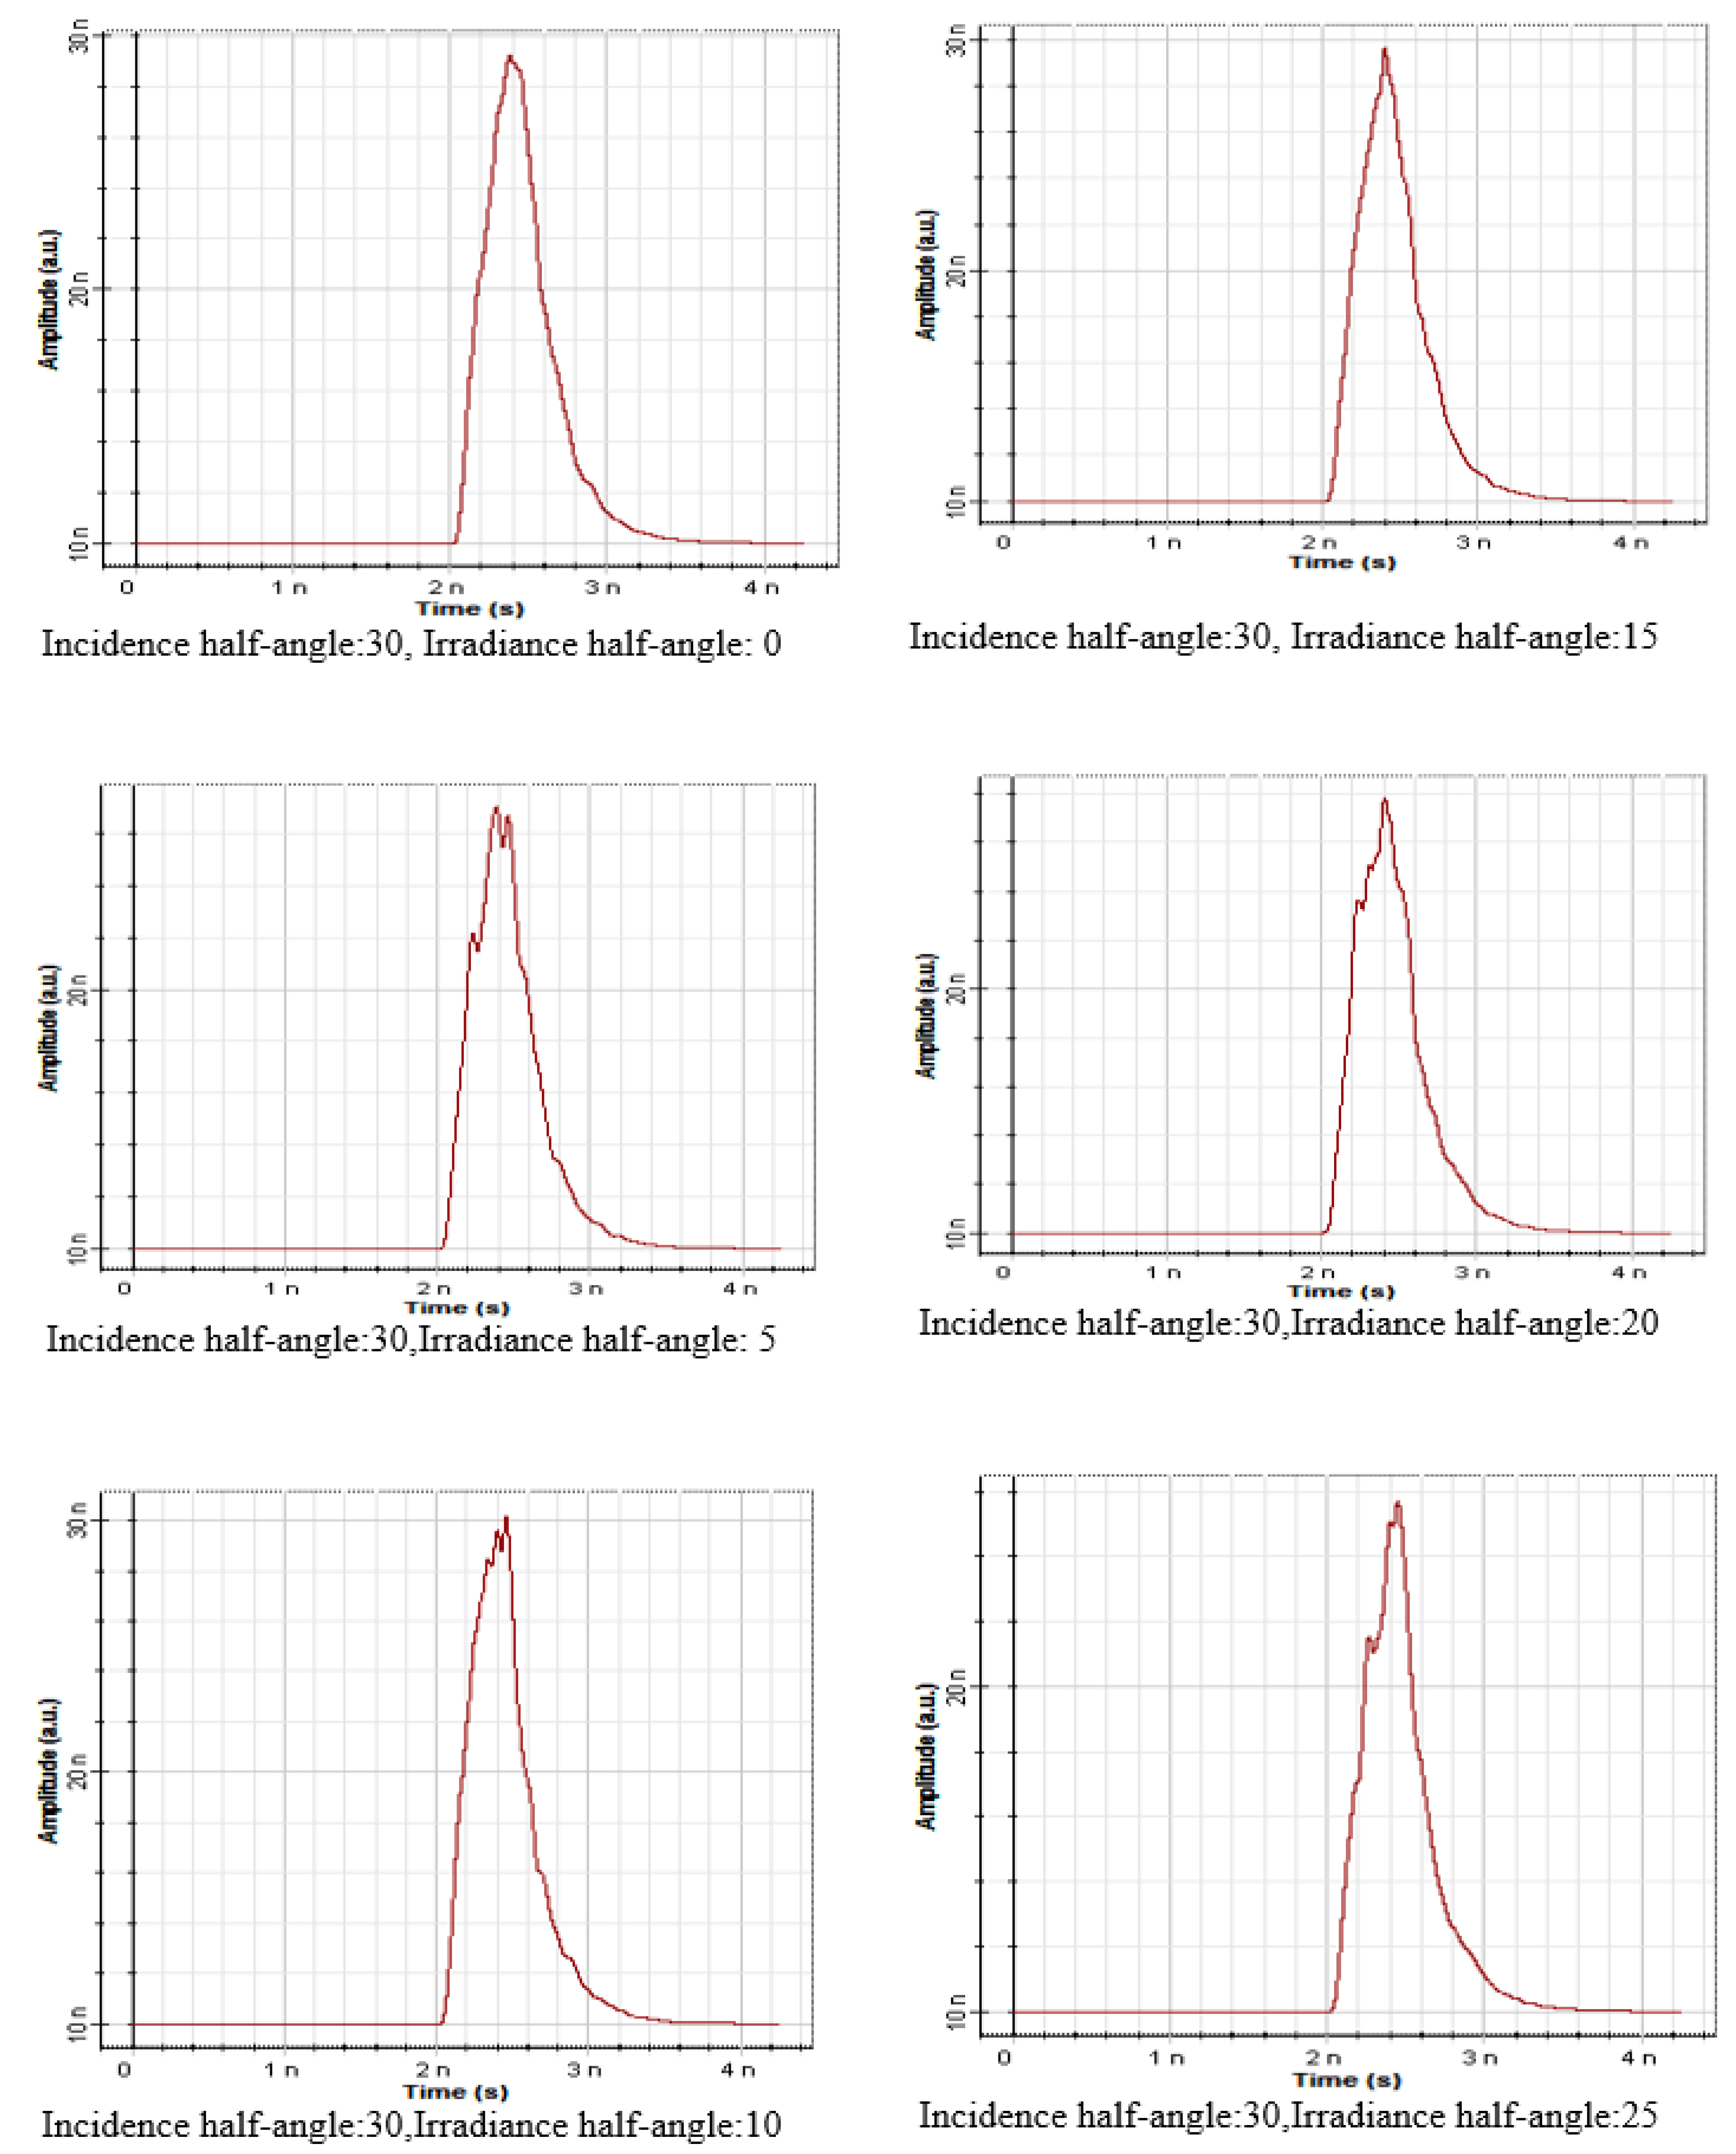
Figure 16.
Irradiance angle () effect on an LOS propagation model ( changes from to ).

Figure 17.
Incident angle () effect on the LOS propagation model ( changes from to ).
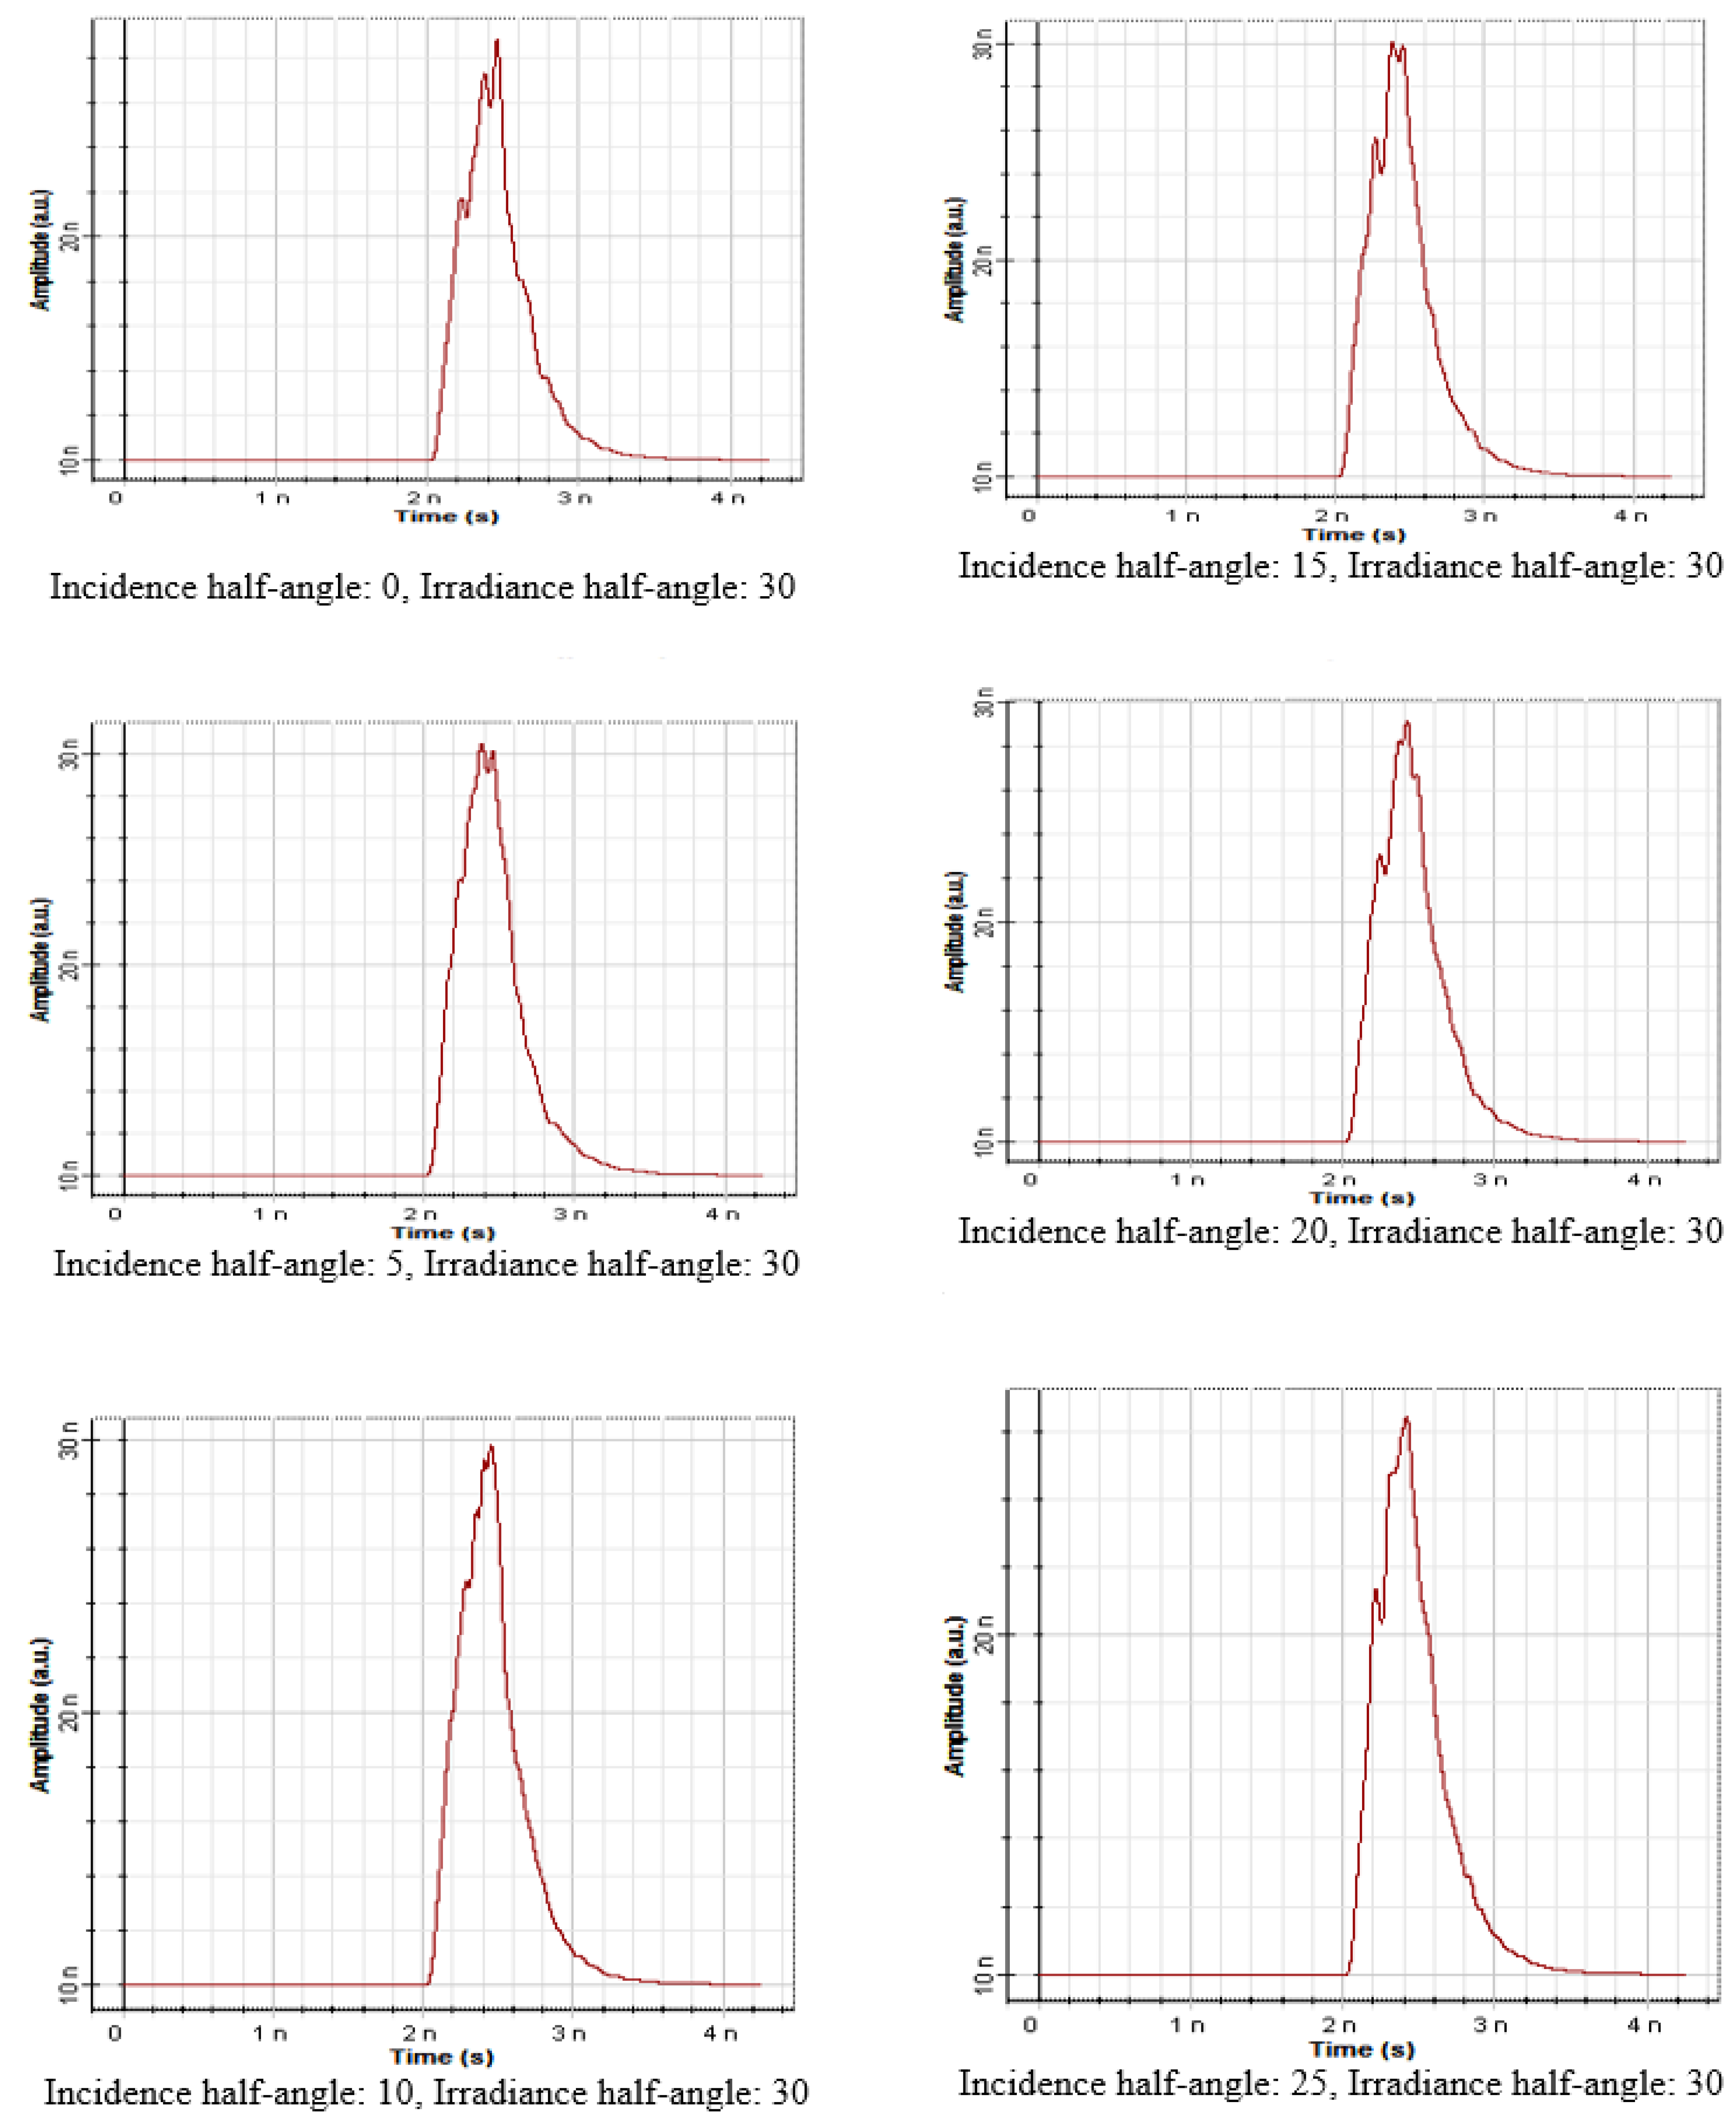
Figure 18.
Incident angle () effect on the LOS propagation model ( changes from to ).

Figure 19.
Angle effects on the received signal amplitude.
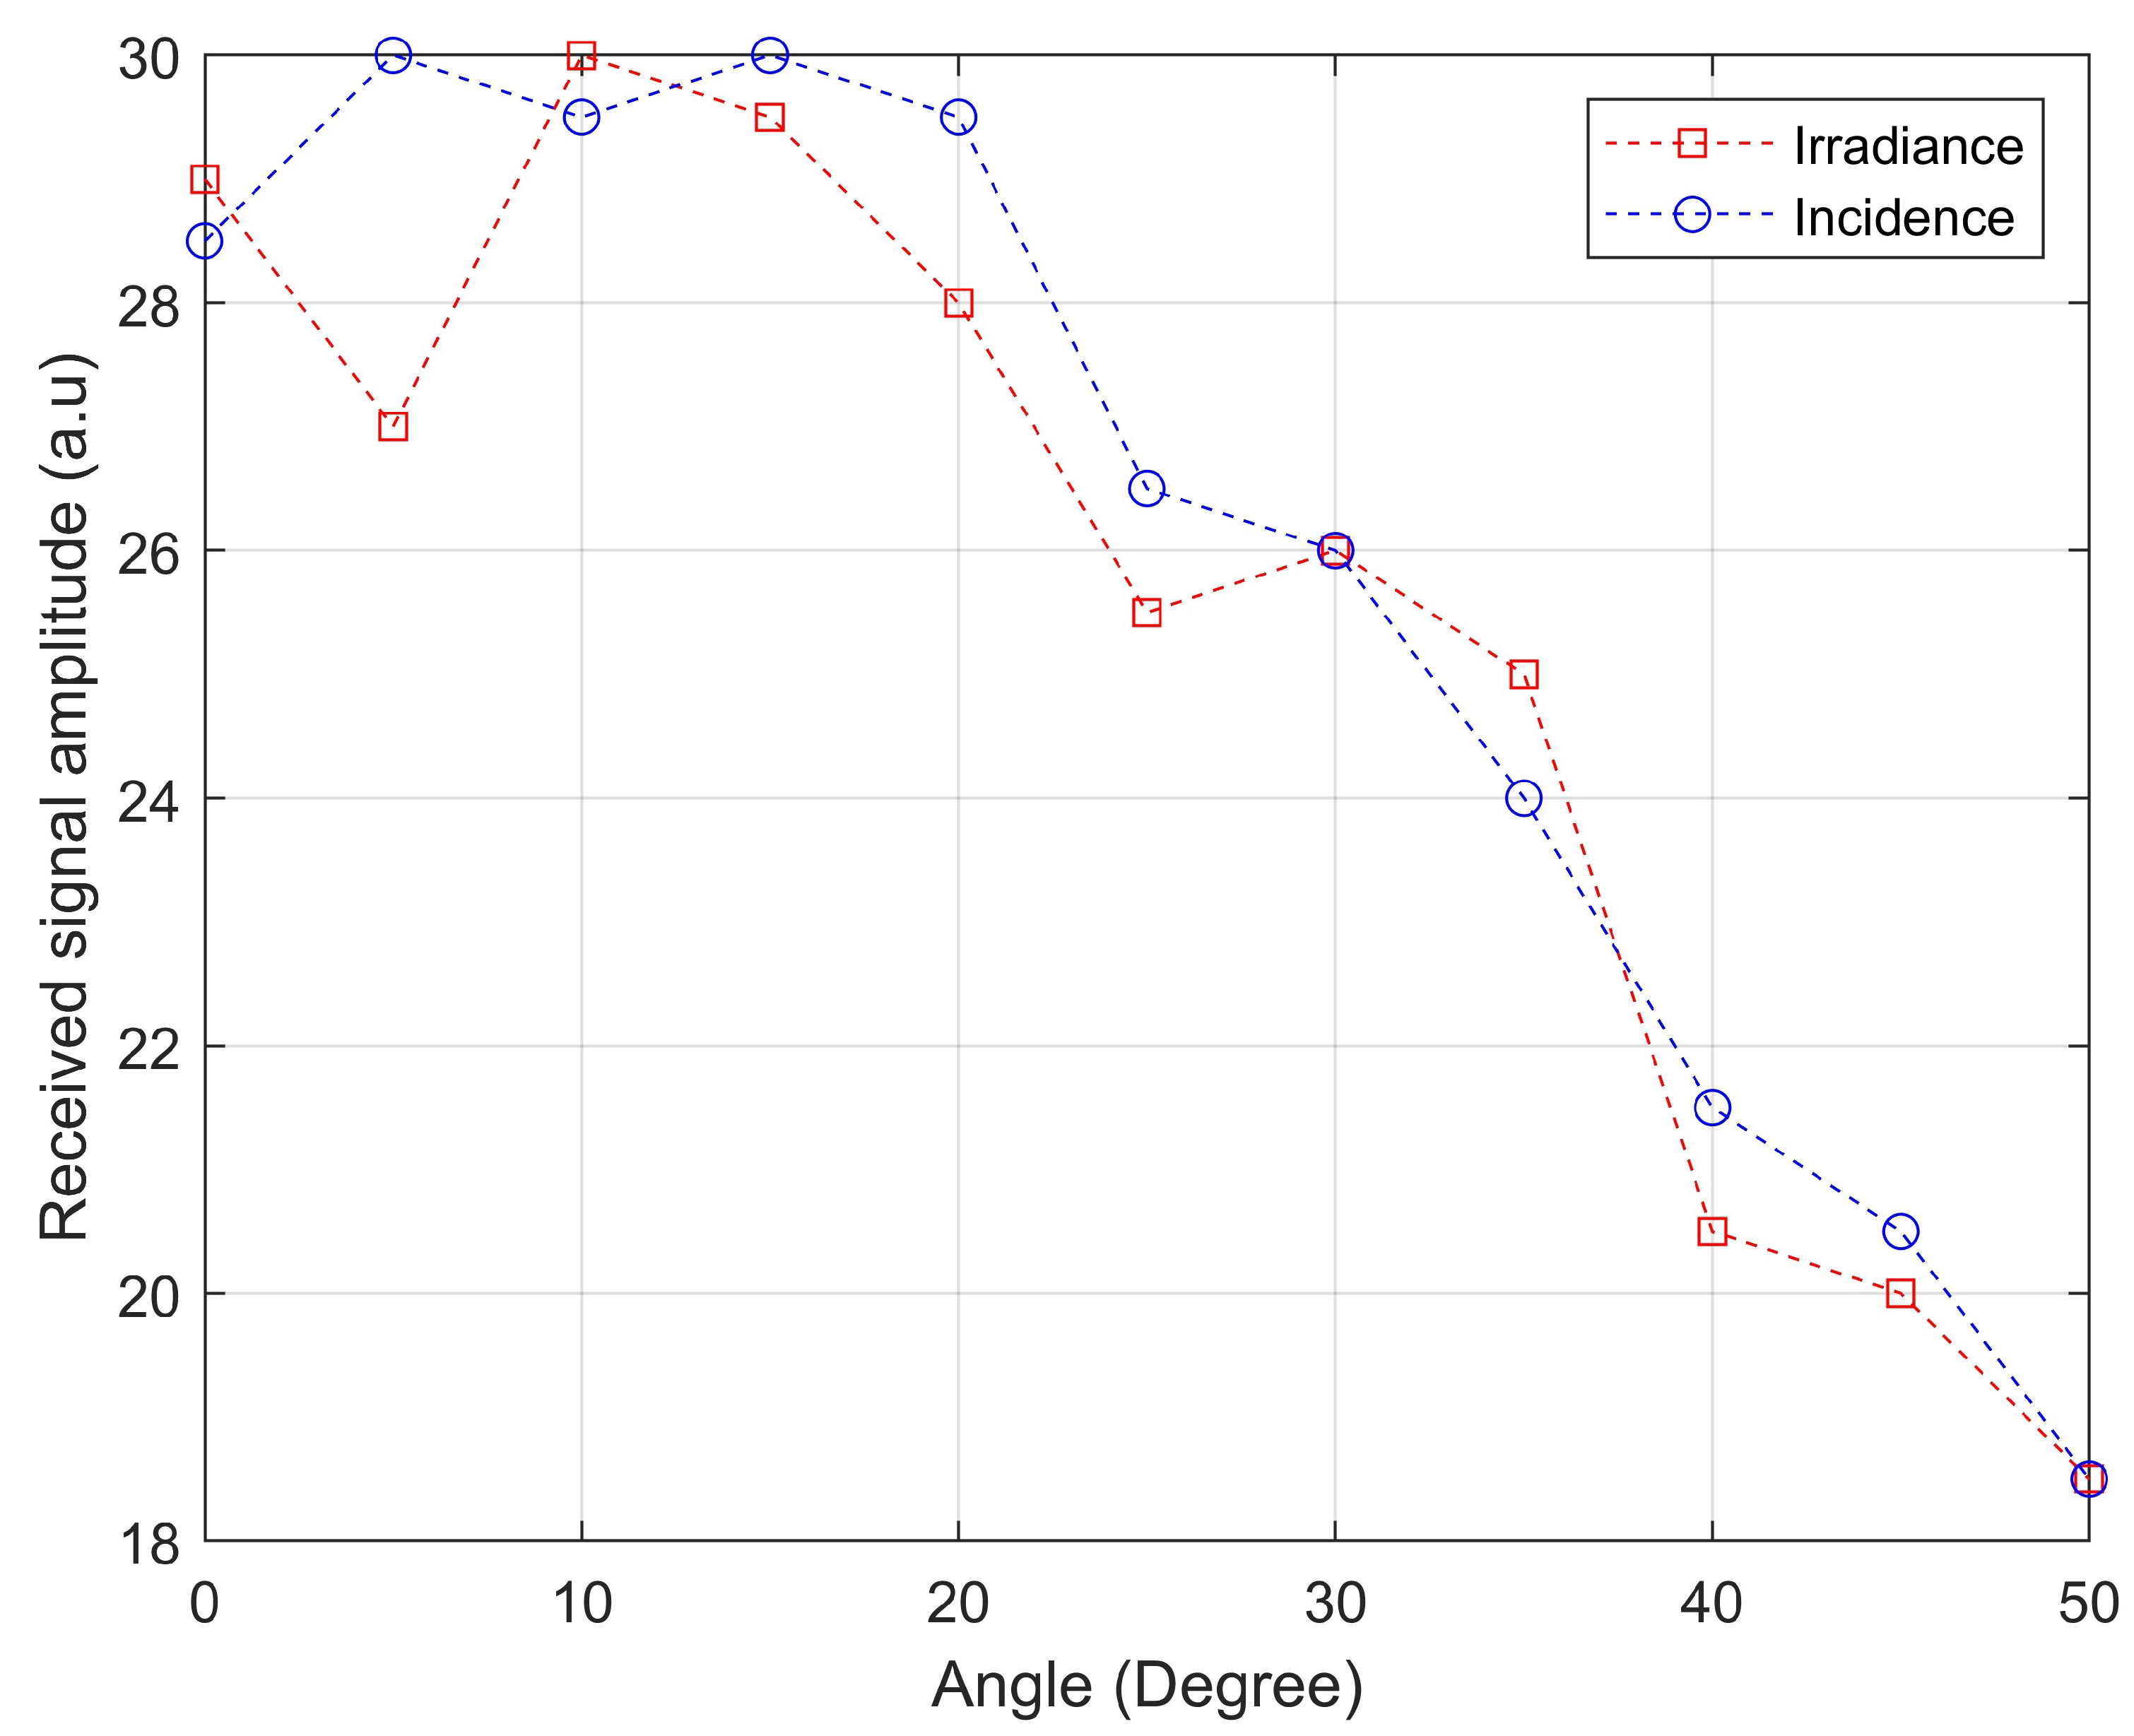
Figure 20.
Example of a single LED NLOS propagation model.
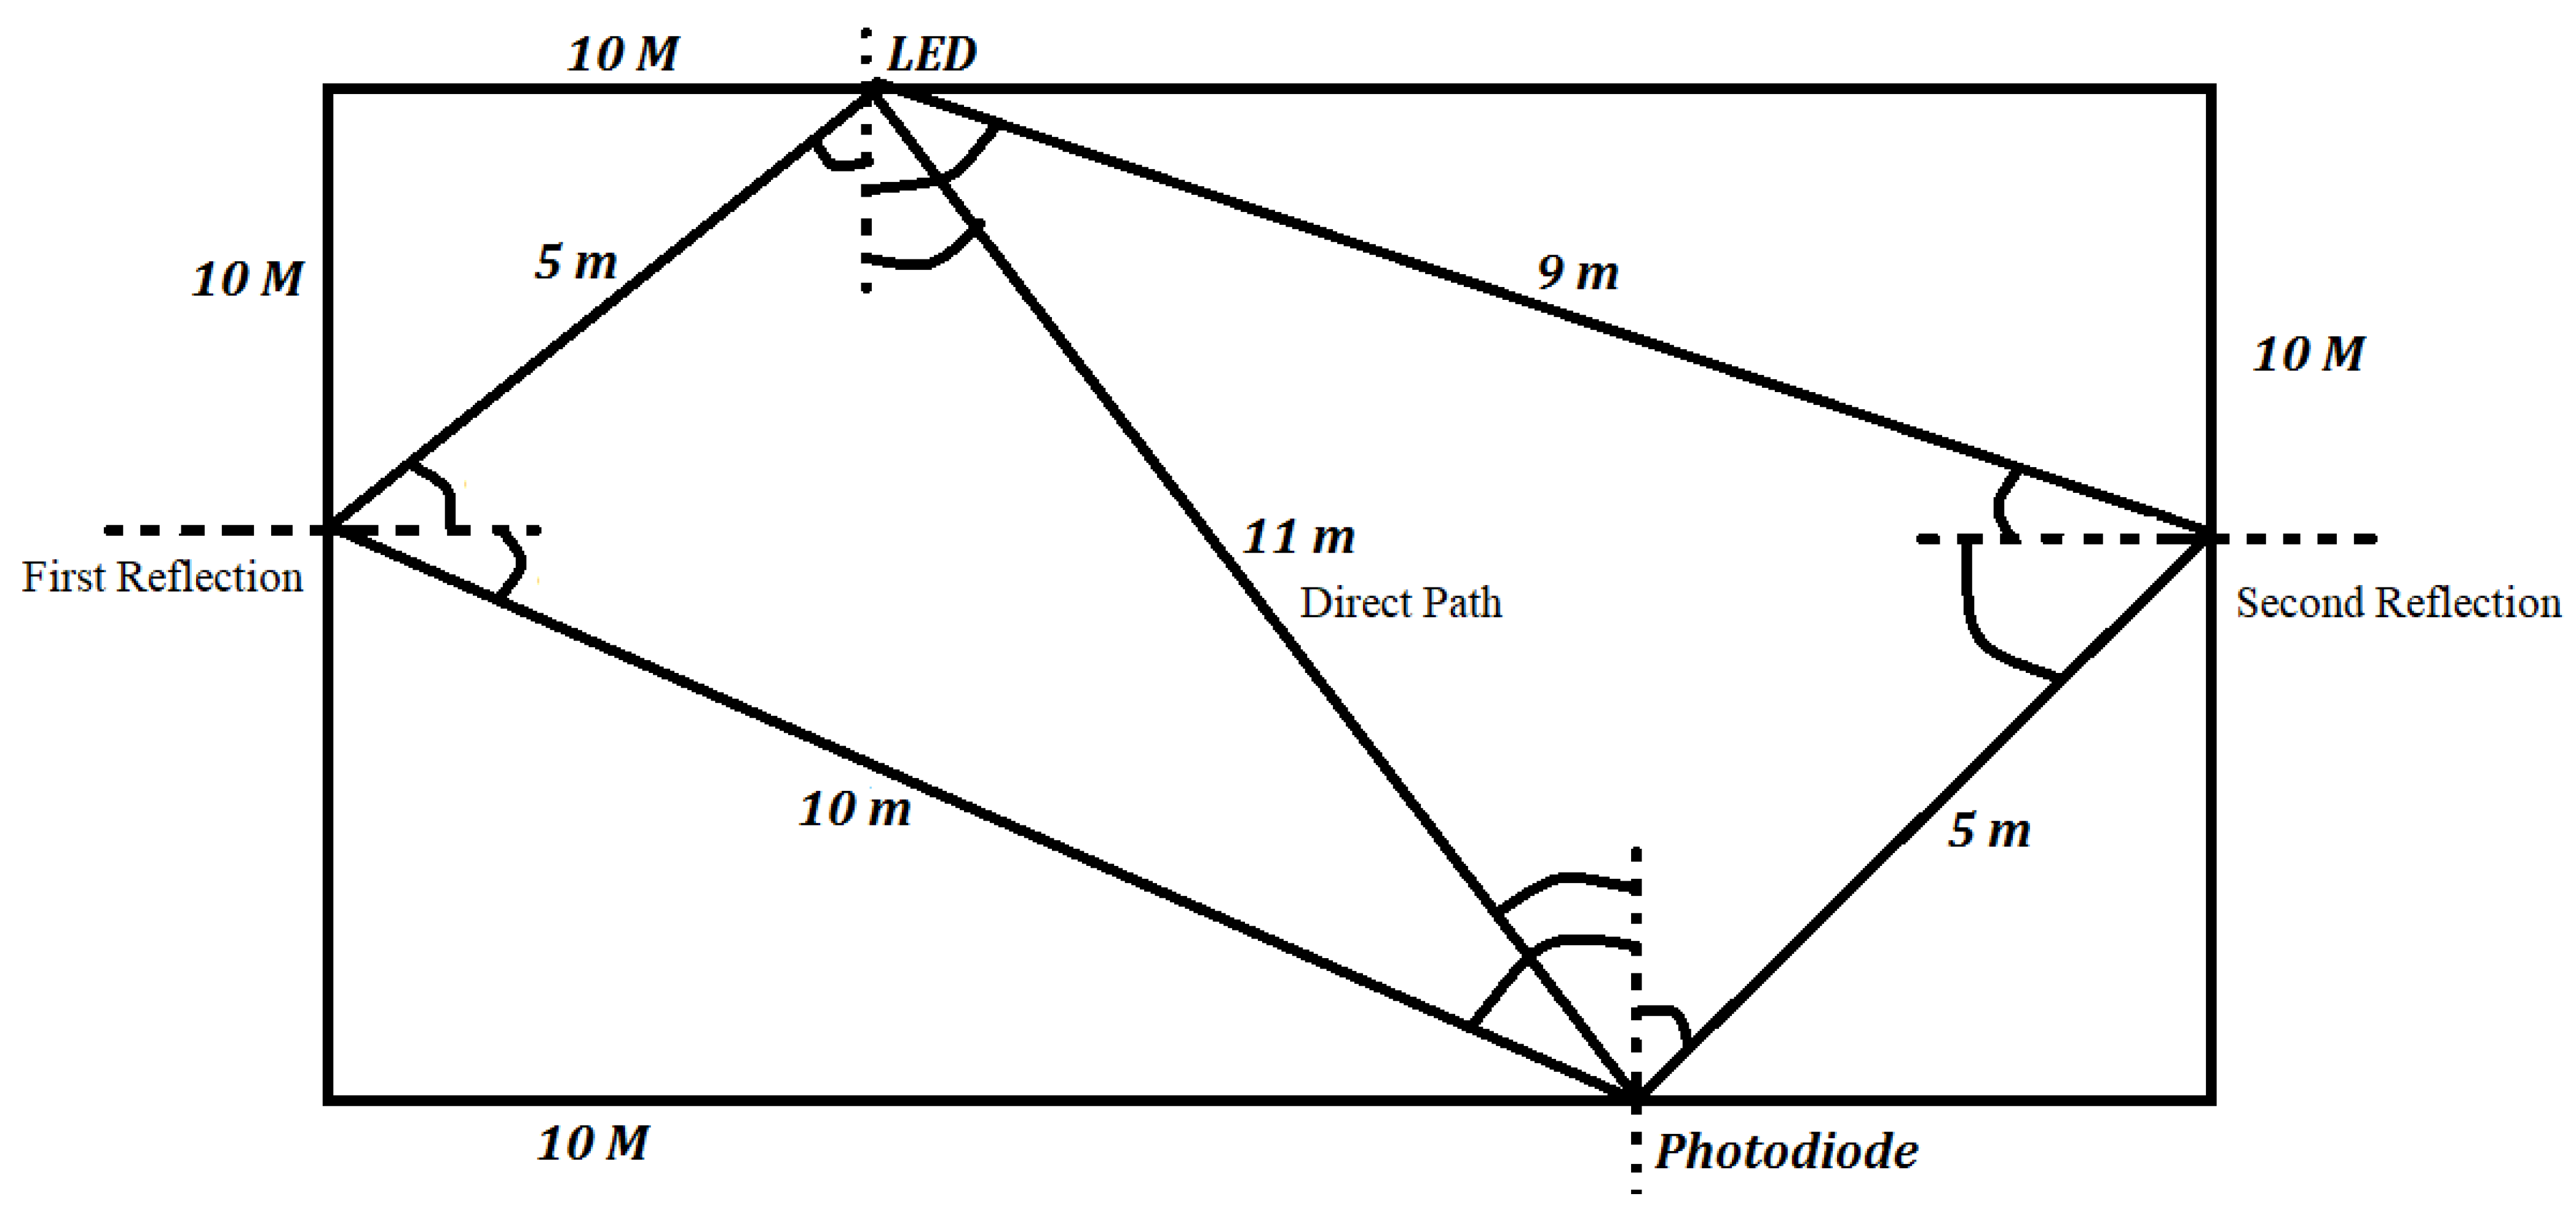
Figure 21.
FOV effect on bitrate estimation.

Figure 22.
VLC hardware test results.

Table 1.
Components specification used in the Optisystem simulation tool.
| LED | Specification |
|---|---|
| Frequency | 550 nm |
| Electron life time | s |
| RC time constant | s |
| Slope efficiency | 0.5 W/A |
| Quantum efficiency | 0.65 |
| Spectral line profile | Gaussian |
| Bandwidth | 6 THz |
| Bit Sequence Generator | Specification |
| Bit rate | |
| Bit sequence | 100 |
| Non-zero bit locations | 1 |
| Number of leading zeros | (Time window × 3/100) × Bit rate |
| Number of trailing zeros | (Time window × 3/100) × Bit rate |
| NRZ Pulse generator | Specification |
| Rectangle shape | Exponential |
| Format for pulse range | Min/Max |
| Maximum | 1 a.u |
| Minimum | 0 a.u |
| Amplitude (wrt DC) | 1 a.u |
| DC bias | 0 a.u |
| Rise time | 0.05 bit |
| Fall time | 0.05 bit |
| Diffuse Channel | Specification |
| Detection surface area | 1 mm |
| Optical concentration factor | 1 |
| Index concentration factor | 1.5 |
| propagation delay | 0 ps/m |
| Low Pass Bessel Filter | Specification |
| Cutoff frequency | 0.75 × symbol rate |
| Insertion loss | 0 dB |
| Depth | 100 dB |
| Order | 4 |
| PIN Photodiode | Specification |
| Responsivity type | Silicon |
| Responsivity | 1 A/W |
| Dark current | 10 nA |
| Thermal power density | W/Hz |
| Absolute temperature | 298 K |
| Load resistance | 50 ohm |
| Shot noise distribution | Gaussian |
| Junction capacitance | 3 pF |
| Modulation bandwidth | 2 GHz |
| Center frequency | 193.1 THz |
| 3R Regenerator | Specification |
| Delay compensation | 0 s |
| Decision instant | 0.5 Bit |
| Absolute threshold | 0.5 a.u |
Table 2.
Parameters used in the dual LED NLOS propagation model.
| LED1 | LED2 |
|---|---|
Table 3.
Effect of FOV on the bitrate.
| FOV (Degree) | Bitrate (bits/s) |
|---|---|
Publisher’s Note: MDPI stays neutral with regard to jurisdictional claims in published maps and institutional affiliations. |
© 2022 by the author. Licensee MDPI, Basel, Switzerland. This article is an open access article distributed under the terms and conditions of the Creative Commons Attribution (CC BY) license (https://creativecommons.org/licenses/by/4.0/).
Share and Cite
MDPI and ACS Style
Poulose, A. Simulation of an Indoor Visible Light Communication System Using Optisystem. Signals 2022, 3, 765-793. https://doi.org/10.3390/signals3040046
AMA Style
Poulose A. Simulation of an Indoor Visible Light Communication System Using Optisystem. Signals. 2022; 3(4):765-793. https://doi.org/10.3390/signals3040046
Chicago/Turabian StylePoulose, Alwin. 2022. "Simulation of an Indoor Visible Light Communication System Using Optisystem" Signals 3, no. 4: 765-793. https://doi.org/10.3390/signals3040046