
Grammatical Evolution-Based Feature Extraction for Hemiplegia Type Detection

 ,
, 
 , ,
, ,  , ,
, ,  ,
,
Abstract
:1. Introduction
2. Literature Review
3. The FSC4RBF Algorithm
- The differentiation of non-terminal symbols from terminal letters is conducted using special brackets containing them.
- The definition alternatives are bundled together.
- Left is distinguished from right by adopting the “::=” symbol.
- The alternatives are distinguished with the “|” symbol.
| Algorithm 1 The FSC4RBF Method |
|
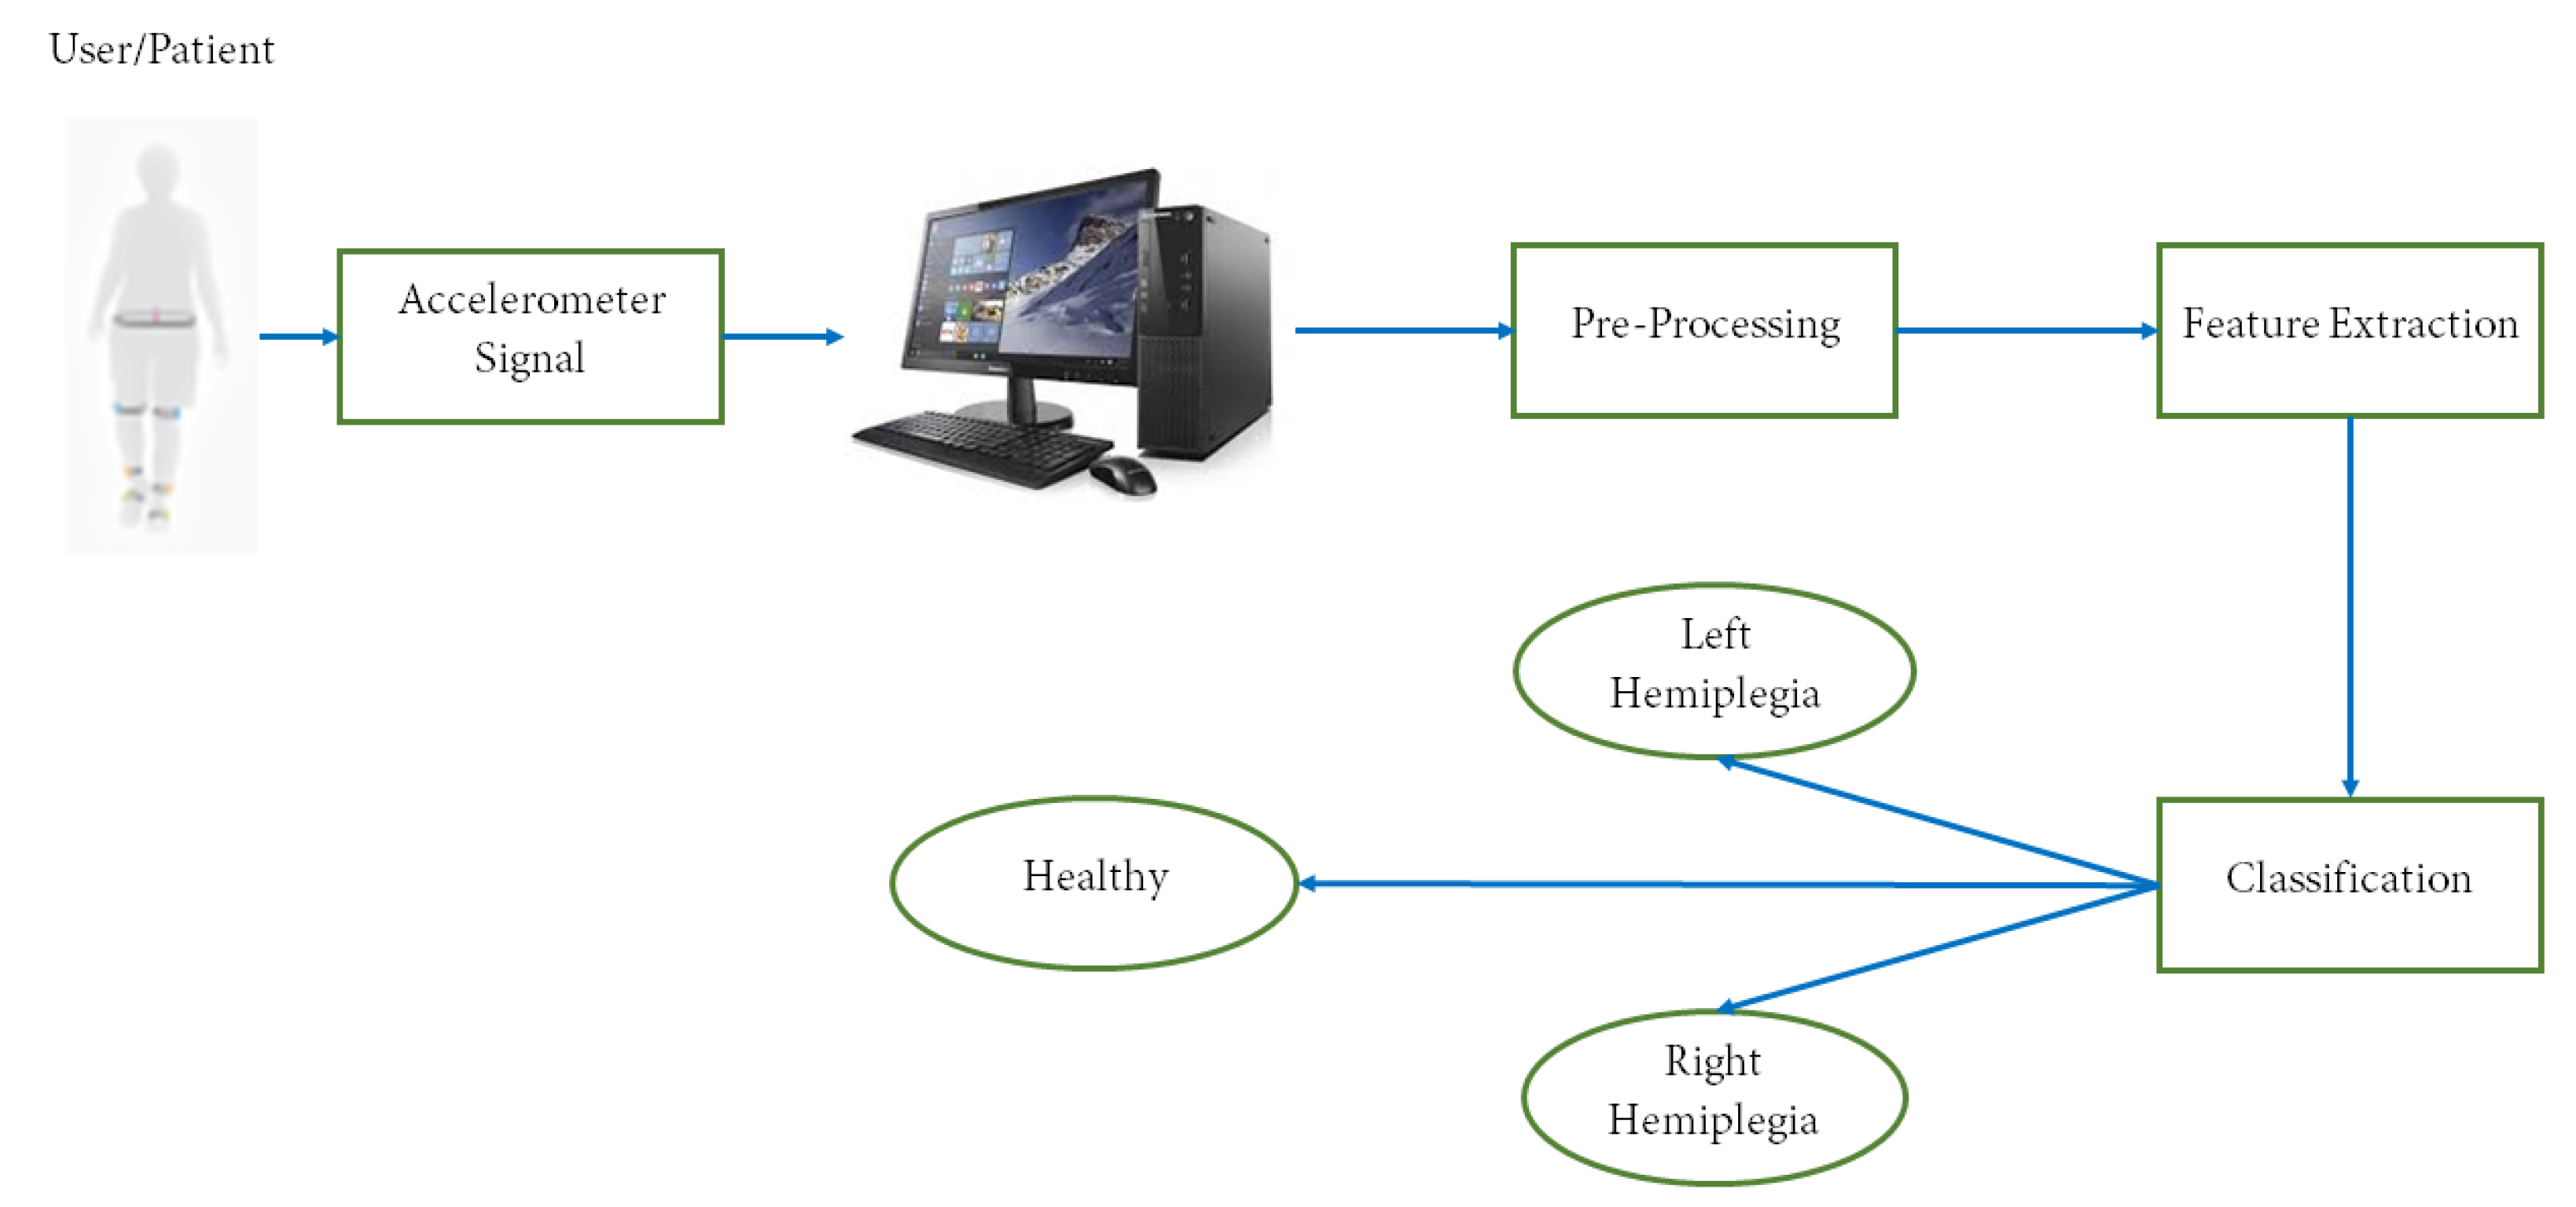
4. System Architecture
5. Experimental Results
5.1. Parameter Details
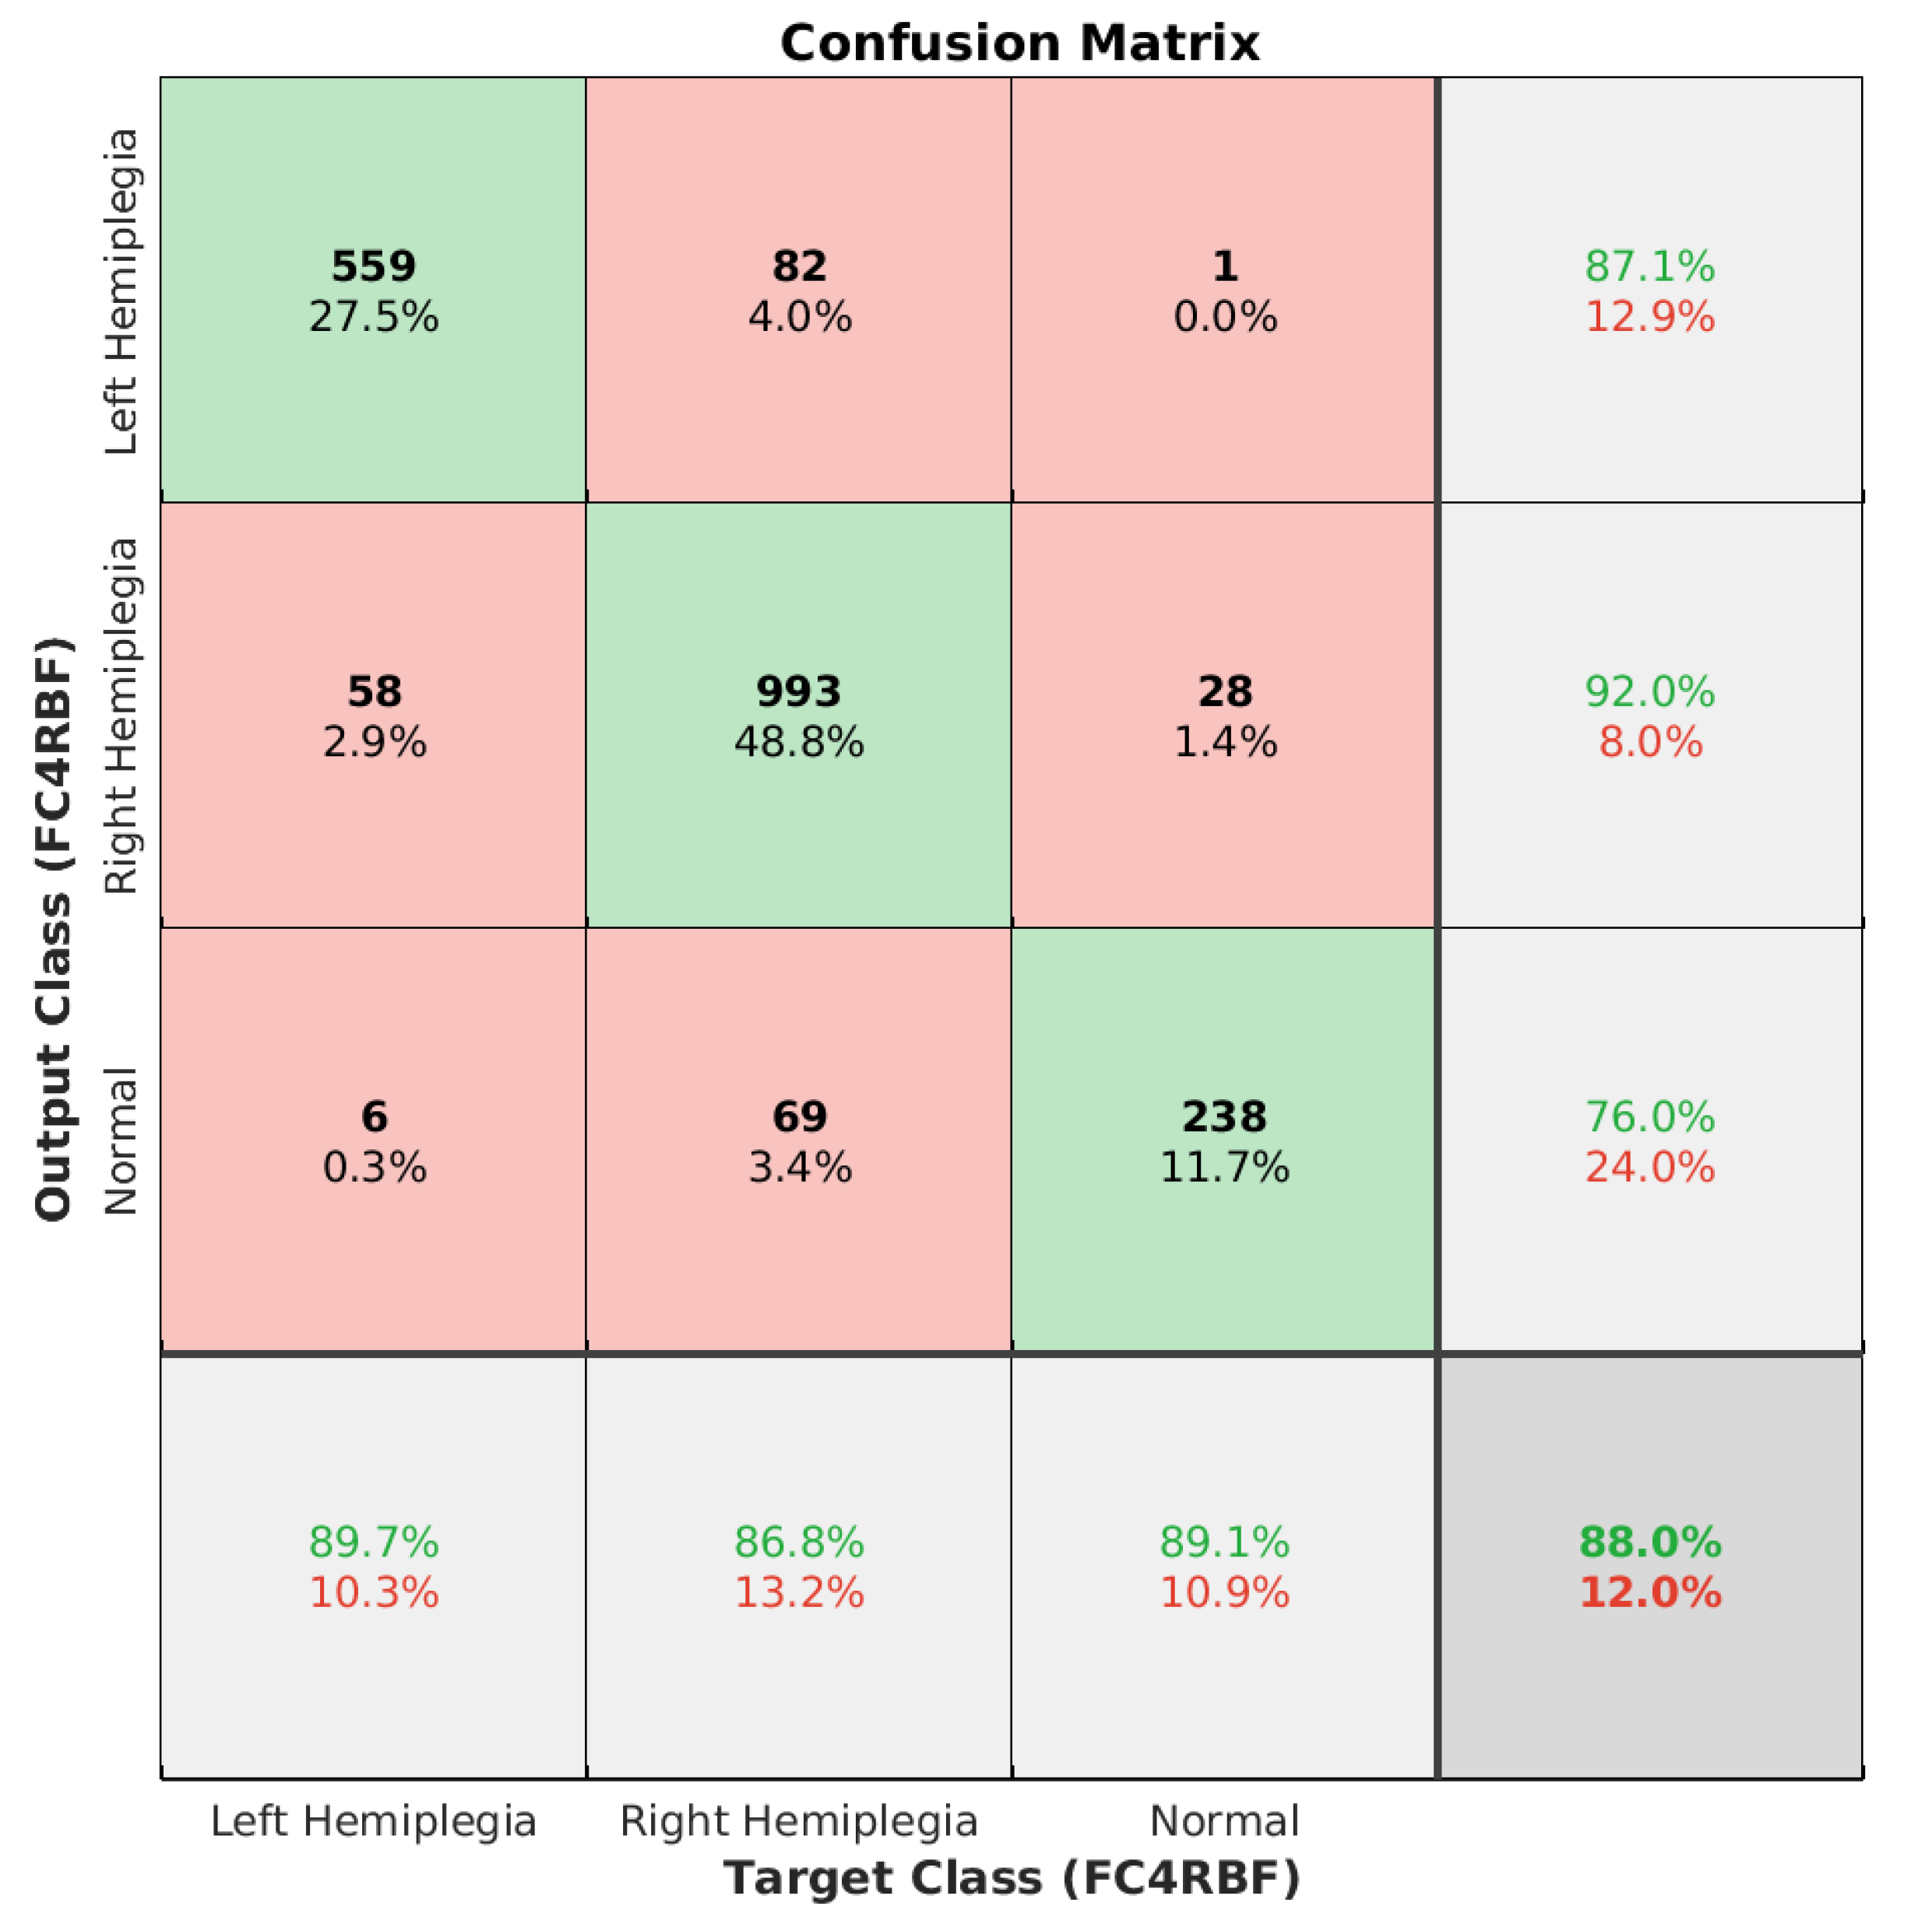
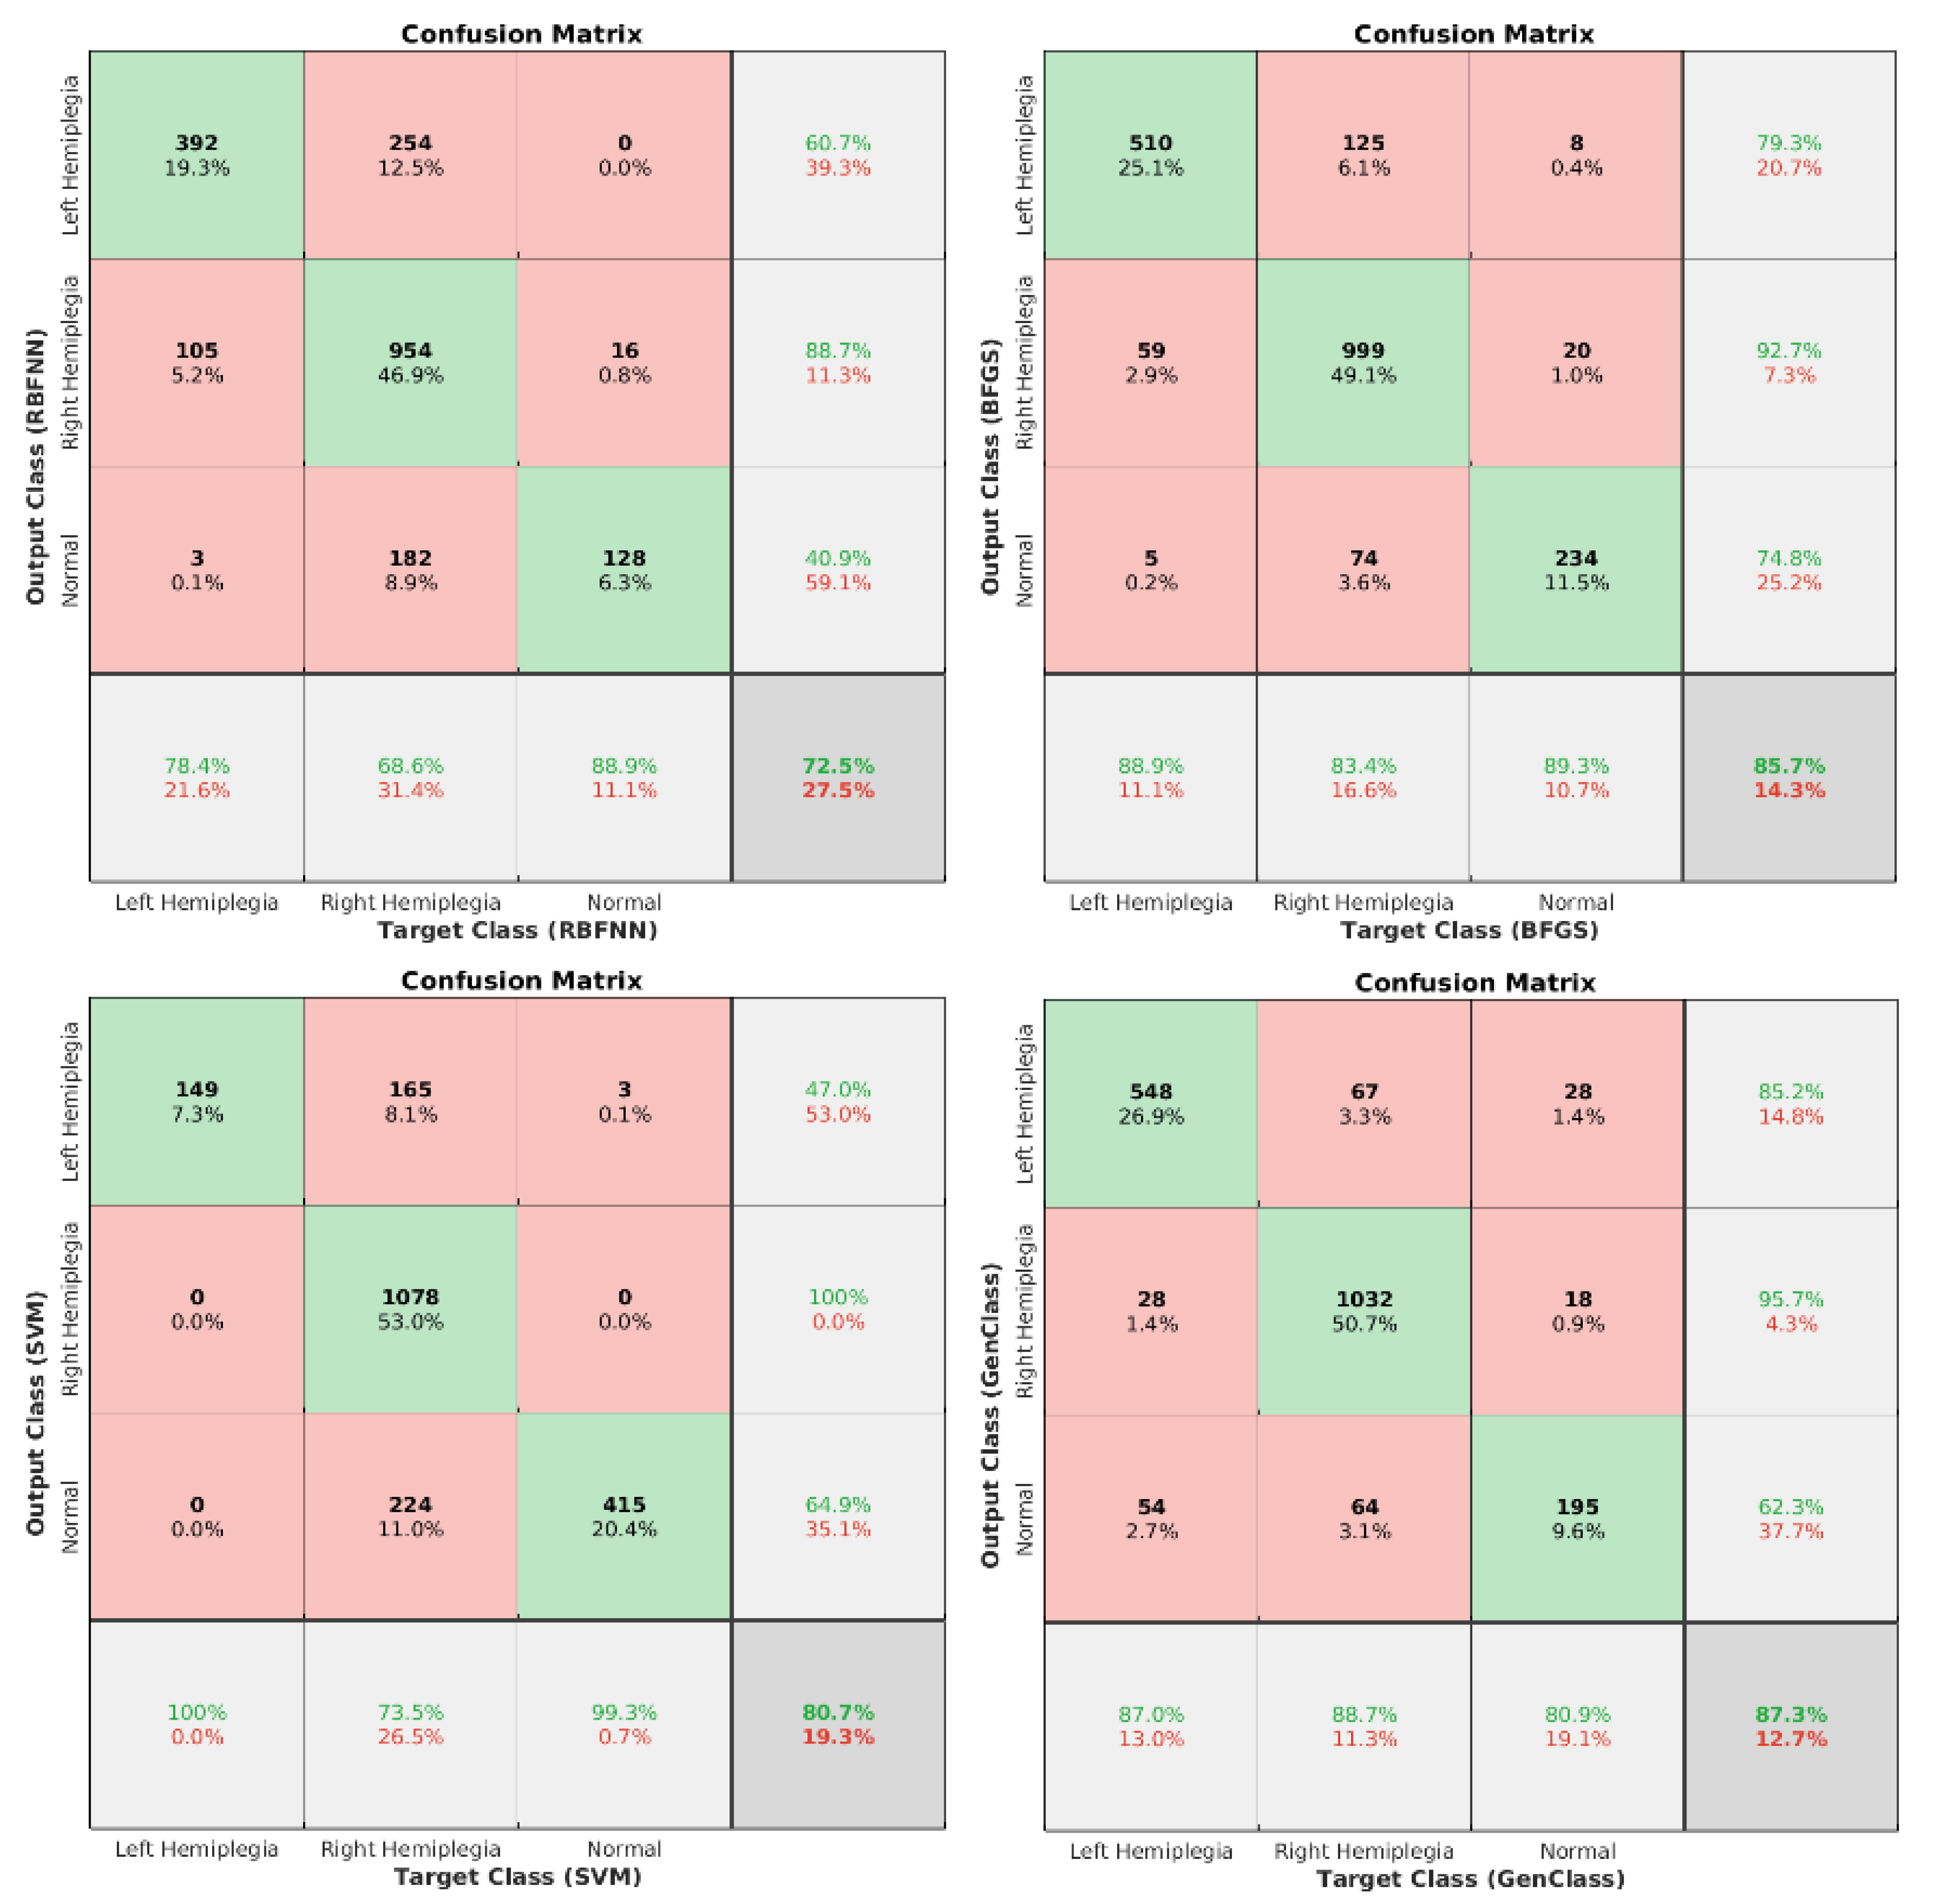
5.2. Comparison Results
6. Discussion
7. Conclusions
Author Contributions
Funding
Institutional Review Board Statement
Informed Consent Statement
Data Availability Statement
Conflicts of Interest
References
- Davies, P.M. Right in the Middle: Selective Trunk Activity in the Treatment of Adult Hemiplegia; Springer Science & Business Media: Berlin/Heidelberg, Germany, 1990. [Google Scholar]
- Bobath, B. Adult Hemiplegia: Evaluation and Treatment, 3 ed.; Butterworth-Heinemann: Oxford, UK, 1990. [Google Scholar]
- Ruskin, A. Understanding stroke and its rehabilitation. Stroke 1983, 14, 438–442. [Google Scholar] [CrossRef] [PubMed] [Green Version]
- Davies, P.M. Steps to Follow: The Comprehensive Treatment of Patients with Hemiplegia; Springer Science & Business Media: Berlin/Heidelberg, Germany, 2000. [Google Scholar]
- Donath, L.; Faude, O.; Lichtenstein, E.; Pagenstert, G.; Nüesch, C.; Mündermann, A. Mobile inertial sensor based gait analysis: Validity and reliability of spatiotemporal gait characteristics in healthy seniors. Gait Posture 2016, 49, 371–374. [Google Scholar] [CrossRef] [PubMed]
- HASOMED. RehaGait—Mobile Gait Analysis. 2022. Available online: https://hasomed.de/en/products/rehagait/ (accessed on 6 May 2022).
- Schwesig, R.; Fischer, D.; Lauenroth, A.; Becker, S.; Leuchte, S. Can falls be predicted with gait analytical and posturographic measurement systems? A prospective follow-up study in a nursing home population. Clin. Rehabil. 2013, 27, 183–190. [Google Scholar] [CrossRef] [PubMed]
- Lee, J.; Park, S.; Shin, H. Detection of hemiplegic walking using a wearable inertia sensing device. Sensors 2018, 18, 1736. [Google Scholar] [CrossRef] [Green Version]
- Gavrilis, D.; Tsoulos, I.G.; Dermatas, E. Selecting and constructing features using grammatical evolution. Pattern Recognit. Lett. 2008, 29, 1358–1365. [Google Scholar] [CrossRef]
- Patil, S.; Shah, A.; Dalvi, S.; Sisodia, J. Early detection of hemiplegia by analyzing the gait characteristics and walking patterns using convolutional neural networks. In Proceedings of the International Conference on Soft Computing and Signal Processing, Dalian, China, 20–23 September 2019; Springer: Singapore, 2019; pp. 39–51. [Google Scholar]
- Yardimci, A. Fuzzy logic based gait classification for hemiplegic patients. In Proceedings of the International Symposium on Intelligent Data Analysis, Ljubljana, Slovenia, 6–8 September 2007; Springer: Berlin/Heidelberg, Germany, 2007; pp. 344–354. [Google Scholar]
- Manca, M.; Ferraresi, G.; Cosma, M.; Cavazzuti, L.; Morelli, M.; Benedetti, M. Gait patterns in hemiplegic patients with equinus foot deformity. BioMed Res. Int. 2014, 2014, 939316. [Google Scholar] [CrossRef] [Green Version]
- Mulroy, S.; Gronley, J.; Weiss, W.; Newsam, C.; Perry, J. Use of cluster analysis for gait pattern classification of patients in the early and late recovery phases following stroke. Gait Posture 2003, 18, 114–125. [Google Scholar] [CrossRef]
- Straudi, S.; Manca, M.; Aiello, E.; Ferraresi, G.; Cavazza, S.; Basaglia, N. Sagittal plane kinematic analysis of the six-minute walk test: A classification of hemiplegic gait. Eur. J. Phys. Rehabil. Med. 2009, 45, 341–347. [Google Scholar]
- Luo, G.; Zhu, Y.; Wang, R.; Tong, Y.; Lu, W.; Wang, H. Random forest–based classsification and analysis of hemiplegia gait using low-cost depth cameras. Med. Biol. Eng. Comput. 2020, 58, 373–382. [Google Scholar] [CrossRef]
- Zhu, Y.; Xu, W.; Wang, R.; Tong, Y.; Lu, W.; Wang, H. Automatic recognition and analysis of hemiplegia gait. Sheng wu yi xue Gong Cheng xue za zhi= J. Biomed. Eng.= Shengwu Yixue Gongchengxue Zazhi 2019, 36, 306–314. [Google Scholar]
- Pauk, J.; Minta-Bielecka, K. Gait patterns classification based on cluster and bicluster analysis. Biocybern. Biomed. Eng. 2016, 36, 391–396. [Google Scholar] [CrossRef]
- Wang, H.; Wang, X.; Zhang, X.; Qiu, C.; Li, Q.; Zhao, T. Classification of Stroke Disease Assessment based on Body Surface Electrical Signals at Acupuncture Points. J. Phys. 2021, 1924, 012022. [Google Scholar] [CrossRef]
- Wong, A.M.; Pei, Y.C.; Hong, W.H.; Chung, C.Y.; Lau, Y.C.; Chen, C.P. Foot contact pattern analysis in hemiplegic stroke patients: An implication for neurologic status determination. Arch. Phys. Med. Rehabil. 2004, 85, 1625–1630. [Google Scholar] [CrossRef] [PubMed]
- Wang, F.C.; Chen, S.F.; Lin, C.H.; Shih, C.J.; Lin, A.C.; Yuan, W.; Li, Y.C.; Kuo, T.Y. Detection and Classification of Stroke Gaits by Deep Neural Networks Employing Inertial Measurement Units. Sensors 2021, 21, 1864. [Google Scholar] [CrossRef] [PubMed]
- Jung, S.; Bong, J.H.; Kim, S.J.; Park, S. DNN-Based FES Control for Gait Rehabilitation of Hemiplegic Patients. Appl. Sci. 2021, 11, 3163. [Google Scholar] [CrossRef]
- Di Nardo, F.; Strazza, A.; Mengarelli, A.; Cardarelli, S.; Tigrini, A.; Verdini, F.; Nascimbeni, A.; Agostini, V.; Knaflitz, M.; Fioretti, S. EMG-based characterization of walking asymmetry in children with mild hemiplegic cerebral palsy. Biosensors 2019, 9, 82. [Google Scholar] [CrossRef] [PubMed] [Green Version]
- Aguilera, A.; Subero, A. Automatic gait classification patterns in spastic hemiplegia. Adv. Data Anal. Classif. 2020, 14, 897–925. [Google Scholar] [CrossRef]
- Abaid, N.; Cappa, P.; Palermo, E.; Petrarca, M.; Porfiri, M. Gait detection in children with and without hemiplegia using single-axis wearable gyroscopes. PLoS ONE 2013, 8, e73152. [Google Scholar] [CrossRef]
- Wang, X.; Wang, Y. Gait analysis of children with spastic hemiplegic cerebral palsy. Neural Regen. Res. 2012, 7, 1578. [Google Scholar]
- Zhang, Y.; Ma, Y. Application of supervised machine learning algorithms in the classification of sagittal gait patterns of cerebral palsy children with spastic diplegia. Comput. Biol. Med. 2019, 106, 33–39. [Google Scholar] [CrossRef]
- Ferrari, A.; Bergamini, L.; Guerzoni, G.; Calderara, S.; Bicocchi, N.; Vitetta, G.; Borghi, C.; Neviani, R.; Ferrari, A. Gait-based diplegia classification using lsmt networks. J. Healthc. Eng. 2019, 2019, 3796898. [Google Scholar] [CrossRef] [Green Version]
- Ferrari, A.; Alboresi, S.; Muzzini, S.; Pascale, R.; Perazza, S.; Cioni, G. The term diplegia should be enhanced. Part I: A new rehabilitation oriented classification of cerebral palsy. Eur. J. Phys. Rehabil. Med. 2008, 44, 195. [Google Scholar]
- Kamruzzaman, J.; Begg, R.K. Support vector machines and other pattern recognition approaches to the diagnosis of cerebral palsy gait. IEEE Trans. Biomed. Eng. 2006, 53, 2479–2490. [Google Scholar] [CrossRef]
- Orozco, M.d.P.D.; Abousamra, O.; Church, C.; Lennon, N.; Henley, J.; Rogers, K.J.; Sees, J.P.; Connor, J.; Miller, F. Reliability and validity of Edinburgh visual gait score as an evaluation tool for children with cerebral palsy. Gait Posture 2016, 49, 14–18. [Google Scholar] [CrossRef] [PubMed]
- Strohrmann, C.; Patel, S.; Mancinelli, C.; Deming, L.C.; Chu, J.J.; Greenwald, R.; Tröster, G.; Bonato, P. Automated assessment of gait deviations in children with cerebral palsy using a sensorized shoe and active shape models. In Proceedings of the 2013 IEEE International Conference on Body Sensor Networks, Cambridge, MA, USA, 6–9 May 2013; IEEE: Piscataway, NJ, USA, 2013; pp. 1–6. [Google Scholar]
- Verlekar, T.T.; Correia, P.L.; Soares, L.D. Using transfer learning for classification of gait pathologies. In Proceedings of the 2018 IEEE International Conference on Bioinformatics and Biomedicine (BIBM), Madrid, Spain, 3–6 December 2018; IEEE: Piscataway, NJ, USA, 2018; pp. 2376–2381. [Google Scholar]
- Pandit, T.; Nahane, H.; Lade, D.; Rao, V. Abnormal gait detection by classifying inertial sensor data using transfer learning. In Proceedings of the 2019 18th IEEE International Conference on Machine Learning and Applications (ICMLA), Boca Raton, FL, USA, 16–19 December 2019; IEEE: Piscataway, NJ, USA, 2019; pp. 1444–1447. [Google Scholar]
- Nieto-Hidalgo, M.; García-Chamizo, J.M. Classification of Pathologies Using a Vision Based Feature Extraction. In Proceedings of the Ubiquitous Computing and Ambient Intelligence, Philadelphia, PA, USA, 7–10 November 2017; Ochoa, S.F., Singh, P., Bravo, J., Eds.; Springer International Publishing: Cham, Switzerland, 2017; pp. 265–274. [Google Scholar]
- Goyal, D.; Jerripothula, K.R.; Mittal, A. Detection of gait abnormalities caused by neurological disorders. In Proceedings of the 2020 IEEE 22nd International Workshop on Multimedia Signal Processing (MMSP), Tampere, Finland, 21–24 September 2020; IEEE: Piscataway, NJ, USA, 2020; pp. 1–6. [Google Scholar]
- Nithyakani, P. Classification Of Gait Pathology Using Enhanced Convolutional Neural Network. In Proceedings of the 2022 International Conference on Computer Communication and Informatics (ICCCI), Coimbatore, India, 25–27 January 2022; IEEE: Piscataway, NJ, USA, 2022; pp. 1–5. [Google Scholar]
- Pogorelc, B.; Gams, M. Identification of gait patterns related to health problems of elderly. In Proceedings of the International Conference on Ubiquitous Intelligence and Computing, Xi’an China, 26–29 October 2010; Springer: Berlin/Heidelberg, Germany, 2010; pp. 179–191. [Google Scholar]
- Hall, M.; Frank, E.; Holmes, G.; Pfahringer, B.; Reutemann, P.; Witten, I.H. The WEKA data mining software: An update. ACM SIGKDD Explor. Newsl. 2009, 11, 10–18. [Google Scholar] [CrossRef]
- Frank, E.; Hall, M.A.; Witten, I.H. Data Mining: Practical Machine Learning Tools and Techniques, 4th ed.; Morgan Kaufmann: Burlington, MA, USA, 2016. [Google Scholar]
- Zhang, P.; Zhang, J. Deep learning analysis based on multi-sensor fusion data for hemiplegia rehabilitation training system for stoke patients. Robotica 2022, 40, 780–797. [Google Scholar] [CrossRef]
- Dose, H.; Møller, J.S.; Iversen, H.K.; Puthusserypady, S. An end-to-end deep learning approach to MI-EEG signal classification for BCIs. Expert Syst. Appl. 2018, 114, 532–542. [Google Scholar] [CrossRef]
- Buckley, C.; Micó-Amigo, M.E.; Dunne-Willows, M.; Godfrey, A.; Hickey, A.; Lord, S.; Rochester, L.; Del Din, S.; Moore, S.A. Gait asymmetry post-stroke: Determining valid and reliable methods using a single accelerometer located on the trunk. Sensors 2019, 20, 37. [Google Scholar] [CrossRef] [Green Version]
- Kaku, A.; Parnandi, A.; Venkatesan, A.; Pandit, N.; Schambra, H.; Fernandez-Granda, C. Towards data-driven stroke rehabilitation via wearable sensors and deep learning. Proc. Mach. Learn. Healthc. Conf. PMLR 2020, 126, 143–171. [Google Scholar]
- Panwar, M.; Biswas, D.; Bajaj, H.; Jöbges, M.; Turk, R.; Maharatna, K.; Acharyya, A. Rehab-net: Deep learning framework for arm movement classification using wearable sensors for stroke rehabilitation. IEEE Trans. Biomed. Eng. 2019, 66, 3026–3037. [Google Scholar] [CrossRef] [PubMed]
- Kashi, S.; Polak, R.F.; Lerner, B.; Rokach, L.; Levy-Tzedek, S. A machine-learning model for automatic detection of movement compensations in stroke patients. IEEE Trans. Emerg. Top. Comput. 2020, 9, 1234–1247. [Google Scholar] [CrossRef]
- Lin, W.Y.; Chen, C.H.; Tseng, Y.J.; Tsai, Y.T.; Chang, C.Y.; Wang, H.Y.; Chen, C.K. Predicting post-stroke activities of daily living through a machine learning-based approach on initiating rehabilitation. Int. J. Med. Inform. 2018, 111, 159–164. [Google Scholar] [CrossRef] [PubMed]
- Broomhead, D.S.; Lowe, D. Radial Basis Functions, Multi-Variable Functional Interpolation and Adaptive Networks; Technical Report; Royal Signals and Radar Establishment: Malvern, UK, 1988. [Google Scholar]
- Schwenker, F.; Kestler, H.A.; Palm, G. Three learning phases for radial-basis-function networks. Neural Netw. 2001, 14, 439–458. [Google Scholar] [CrossRef]
- Hery, M.A.; Ibrahim, M.; June, L. BFGS method: A new search direction. Sains Malays. 2014, 43, 1591–1597. [Google Scholar]
- Zahir, N.; Mahdi, H. Snow depth estimation using time series passive microwave imagery via genetically support vector regression (case study urmia lake basin). Int. Arch. Photogramm. Remote Sens. Spat. Inf. Sci. 2015, 40, 555. [Google Scholar] [CrossRef] [Green Version]
- Suthaharan, S. Support Vector Machine. In Machine Learning Models and Algorithms for Big Data Classification: Thinking with Examples for Effective Learning; Springer: Boston, MA, USA, 2016; pp. 207–235. [Google Scholar] [CrossRef]
- Tsoulos, I.G. Creating classification rules using grammatical evolution. Int. J. Comput. Intell. Stud. 2020, 9, 161–171. [Google Scholar]
- Anastasopoulos, N.; Tsoulos, I.G.; Tzallas, A. GenClass: A parallel tool for data classification based on Grammatical Evolution. SoftwareX 2021, 16, 100830. [Google Scholar] [CrossRef]
- Soricone, R.; Neville, M. Comparative analysis of genetic algorithm implementations. ACM SIGAda Ada Lett. 2004, 24, 35–38. [Google Scholar] [CrossRef]
- Kramer, O. Genetic algorithms. In Genetic Algorithm Essentials; Springer: Cham, Switzerland, 2017; pp. 11–19. [Google Scholar]
- O’Neill, M.; Ryan, C. Grammatical evolution. IEEE Trans. Evol. Comput. 2001, 5, 349–358. [Google Scholar] [CrossRef] [Green Version]
- Noorian, F.; de Silva, A.M.; Leong, P.H. Grammatical Evolution: A Tutorial Using gramEvol; Massachusetts Institute of Technology: Cambridge, MA, USA, 2016. [Google Scholar]
- Knuth, D.E. Backus normal form vs. backus naur form. Commun. ACM 1964, 7, 735–736. [Google Scholar] [CrossRef]
- McCracken, D.D.; Reilly, E.D. Backus-naur form (bnf). In Encyclopedia of Computer Science; John Wiley and Sons Ltd.: Chichester, UK, 2003; pp. 129–131. [Google Scholar]

| Parameter Name | Symbol | Values/Types |
|---|---|---|
| Experiments Repeats for Neural Network Methods | 30 | |
| Number of Hidden Layer Nodes | h | 10 |
| Number of Folds | k | 10 |
| Generations No | 200 | |
| Population Size | 500 | |
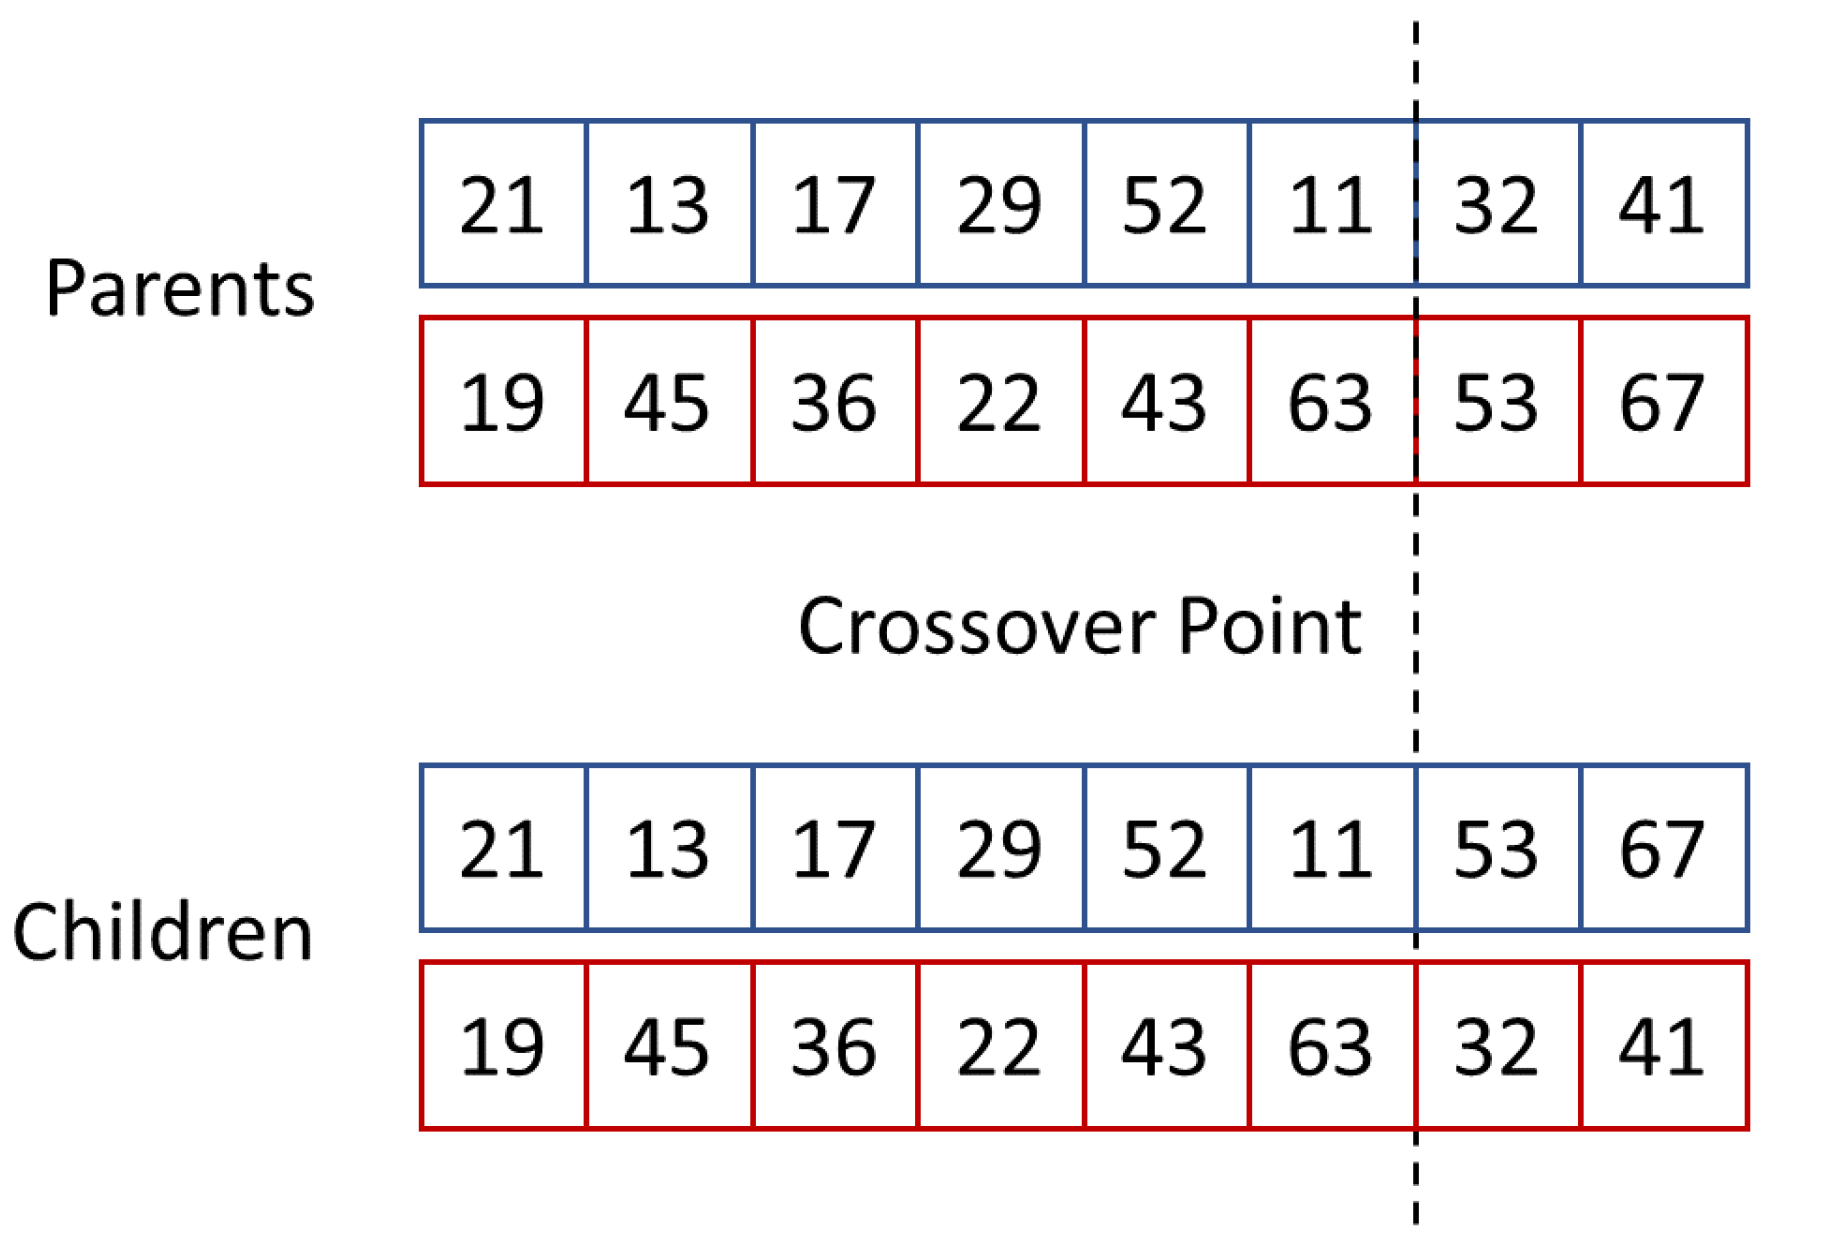
| Crossover | one-point | |
| Mutation Rate |
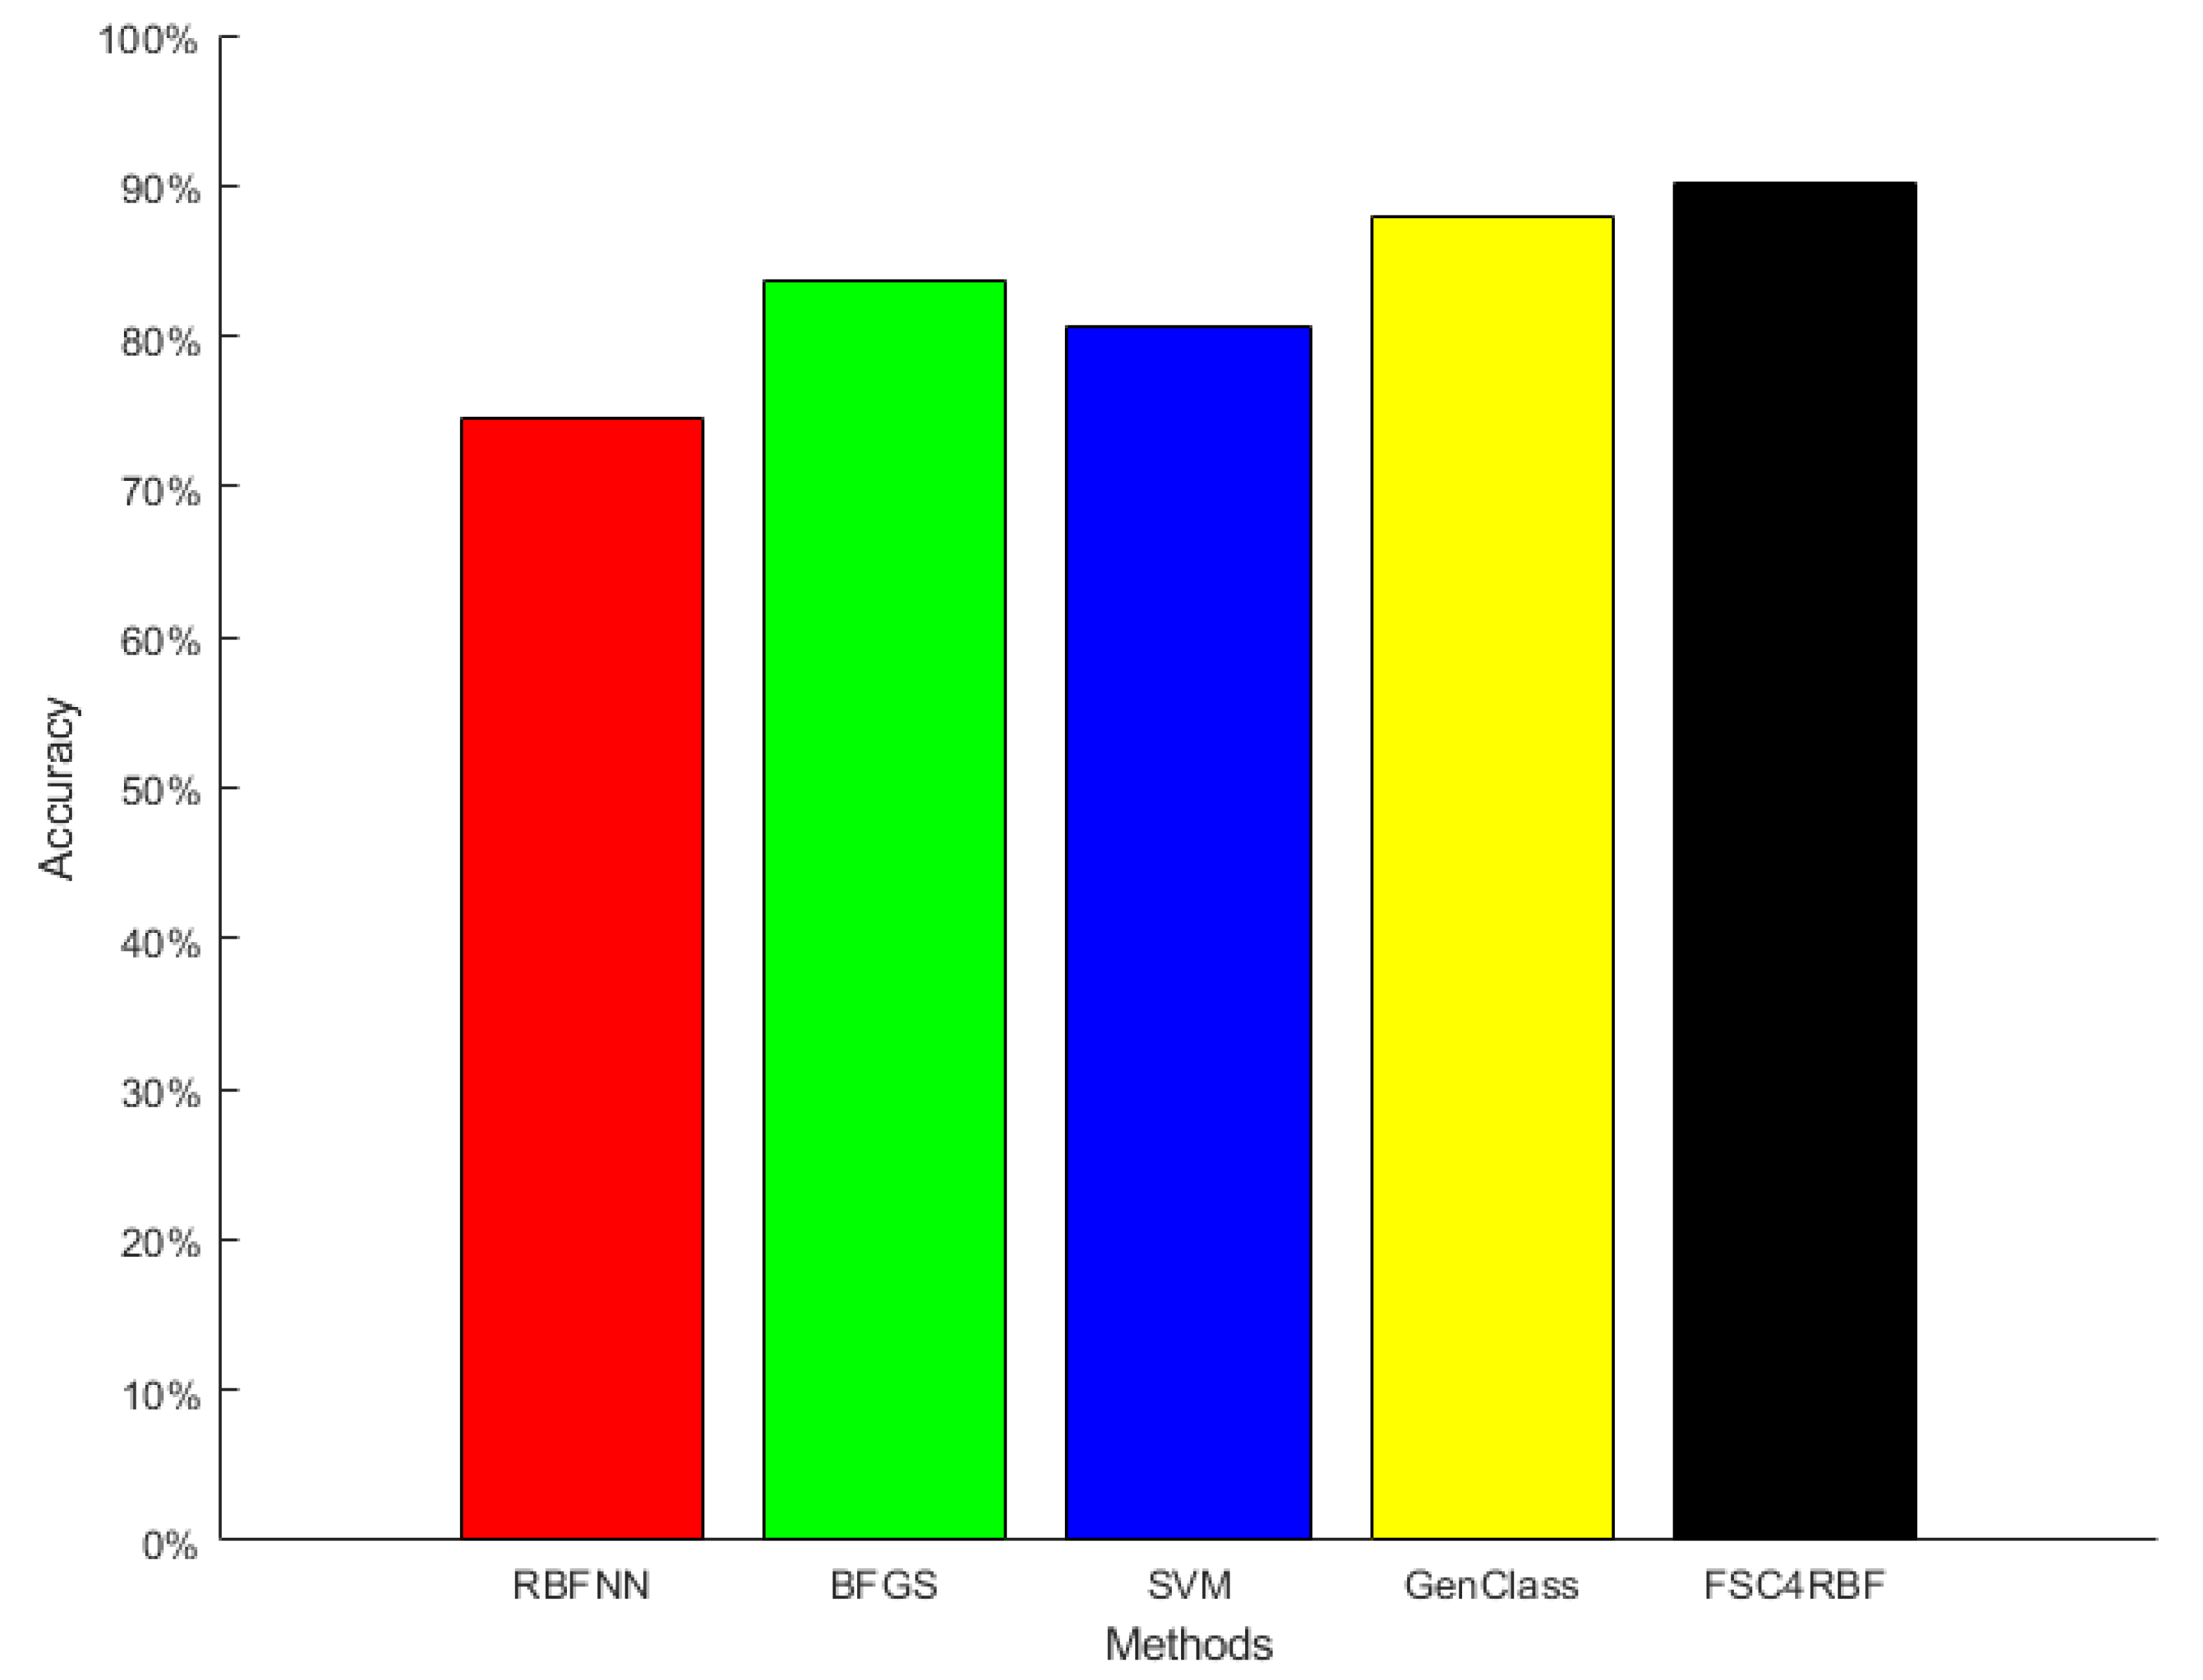
| RBFNN | BFGS | SVM | GenClass | FSC4RBF |
|---|---|---|---|---|
| 74.53% | 83.71% | 80.69% | 87.98% | 90.07% |
Publisher’s Note: MDPI stays neutral with regard to jurisdictional claims in published maps and institutional affiliations. |
© 2022 by the authors. Licensee MDPI, Basel, Switzerland. This article is an open access article distributed under the terms and conditions of the Creative Commons Attribution (CC BY) license (https://creativecommons.org/licenses/by/4.0/).
Share and Cite
Christou, V.; Tsoulos, I.; Arjmand, A.; Dimopoulos, D.; Varvarousis, D.; Tzallas, A.T.; Gogos, C.; Tsipouras, M.G.; Glavas, E.; Ploumis, A.; et al. Grammatical Evolution-Based Feature Extraction for Hemiplegia Type Detection. Signals 2022, 3, 737-751. https://doi.org/10.3390/signals3040044
Christou V, Tsoulos I, Arjmand A, Dimopoulos D, Varvarousis D, Tzallas AT, Gogos C, Tsipouras MG, Glavas E, Ploumis A, et al. Grammatical Evolution-Based Feature Extraction for Hemiplegia Type Detection. Signals. 2022; 3(4):737-751. https://doi.org/10.3390/signals3040044
Chicago/Turabian StyleChristou, Vasileios, Ioannis Tsoulos, Alexandros Arjmand, Dimitrios Dimopoulos, Dimitrios Varvarousis, Alexandros T. Tzallas, Christos Gogos, Markos G. Tsipouras, Evripidis Glavas, Avraam Ploumis, and et al. 2022. "Grammatical Evolution-Based Feature Extraction for Hemiplegia Type Detection" Signals 3, no. 4: 737-751. https://doi.org/10.3390/signals3040044