
Performance Evaluation of Nord2000, RTN-96 and CNOSSOS-EU against Noise Measurements in Central Jutland, Denmark
 ,
,
Abstract
:1. Introduction
2. Materials and Methods
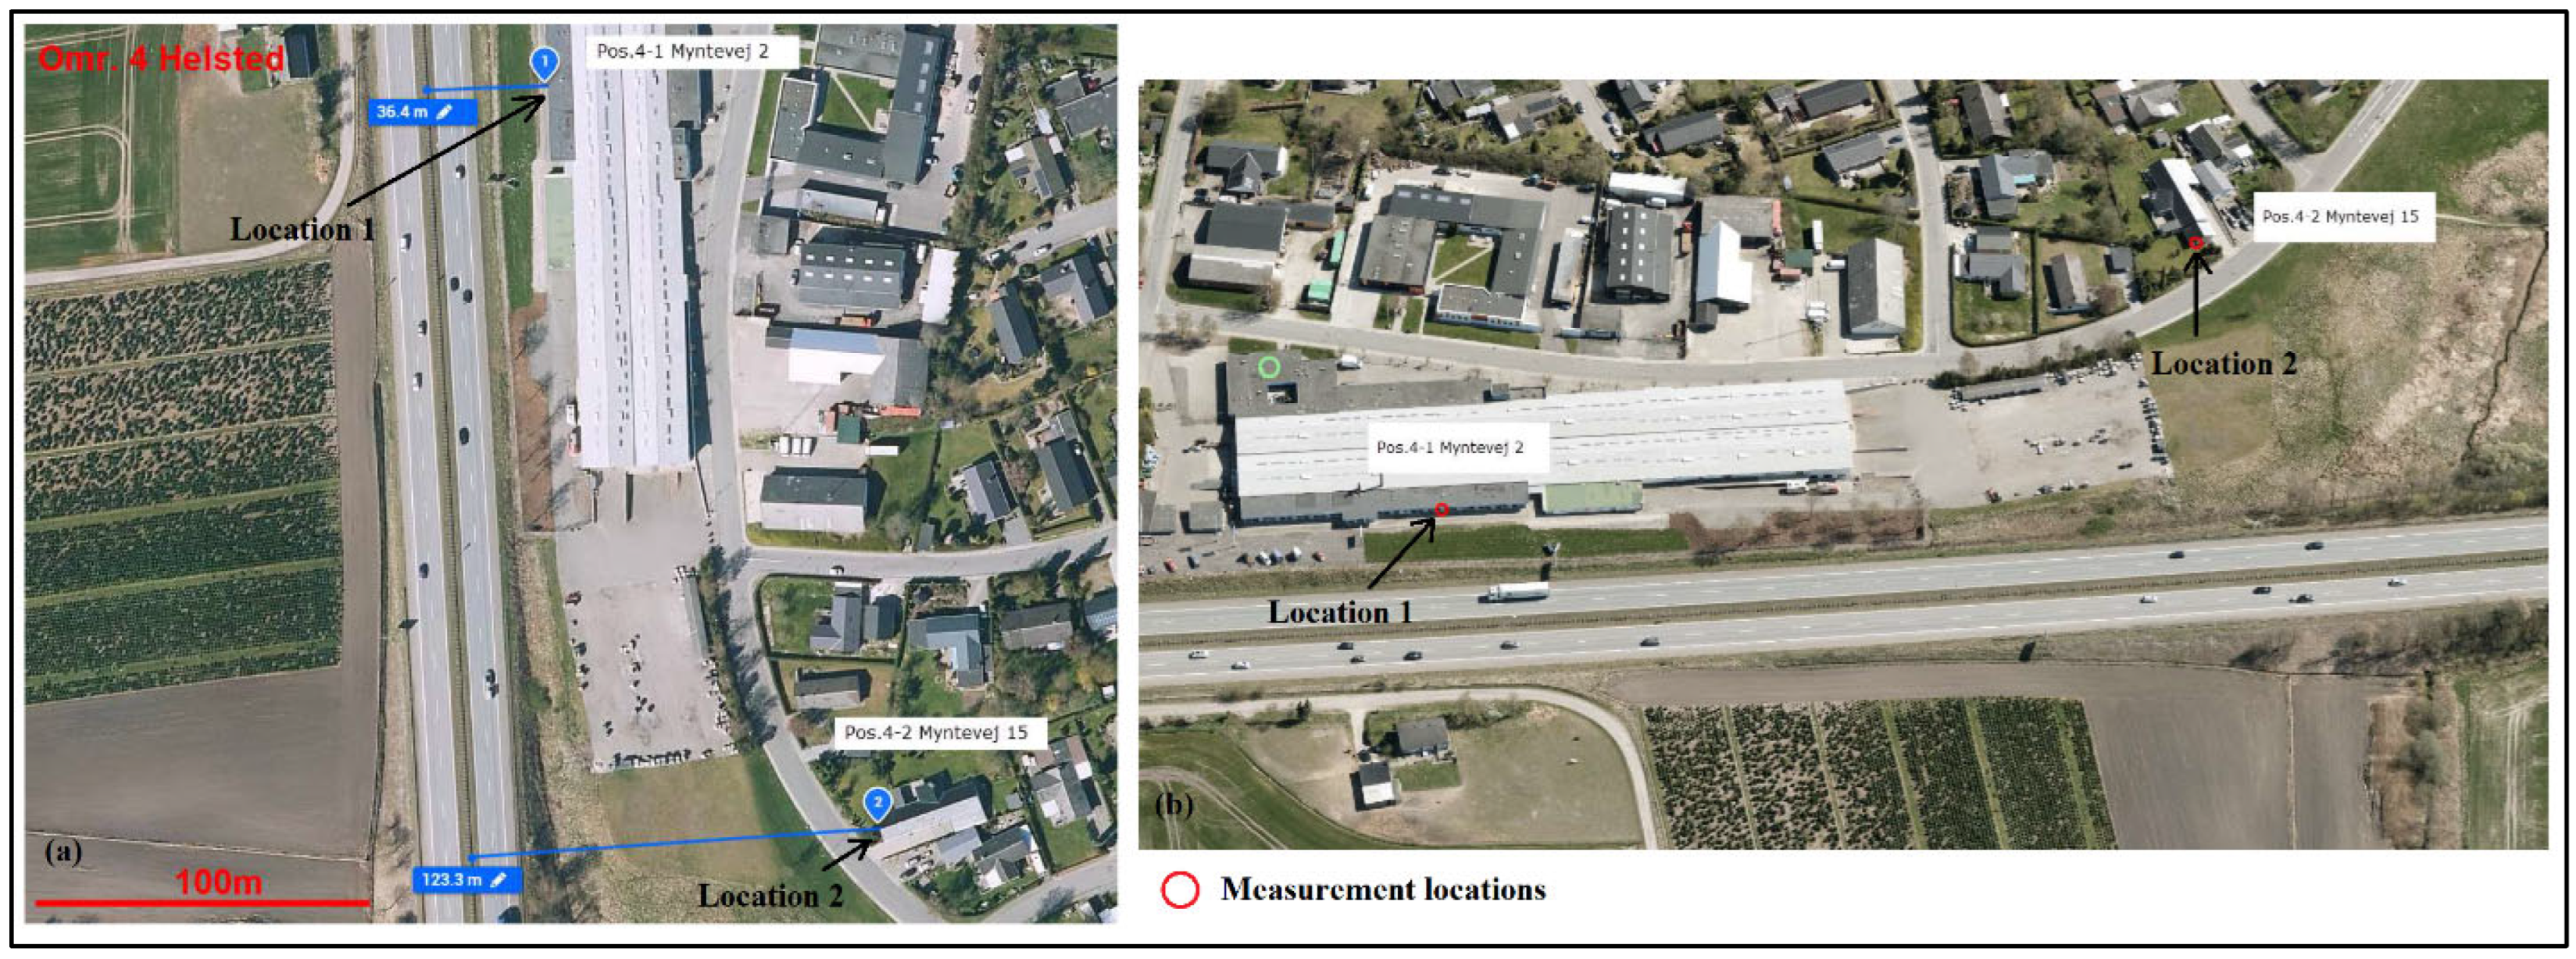
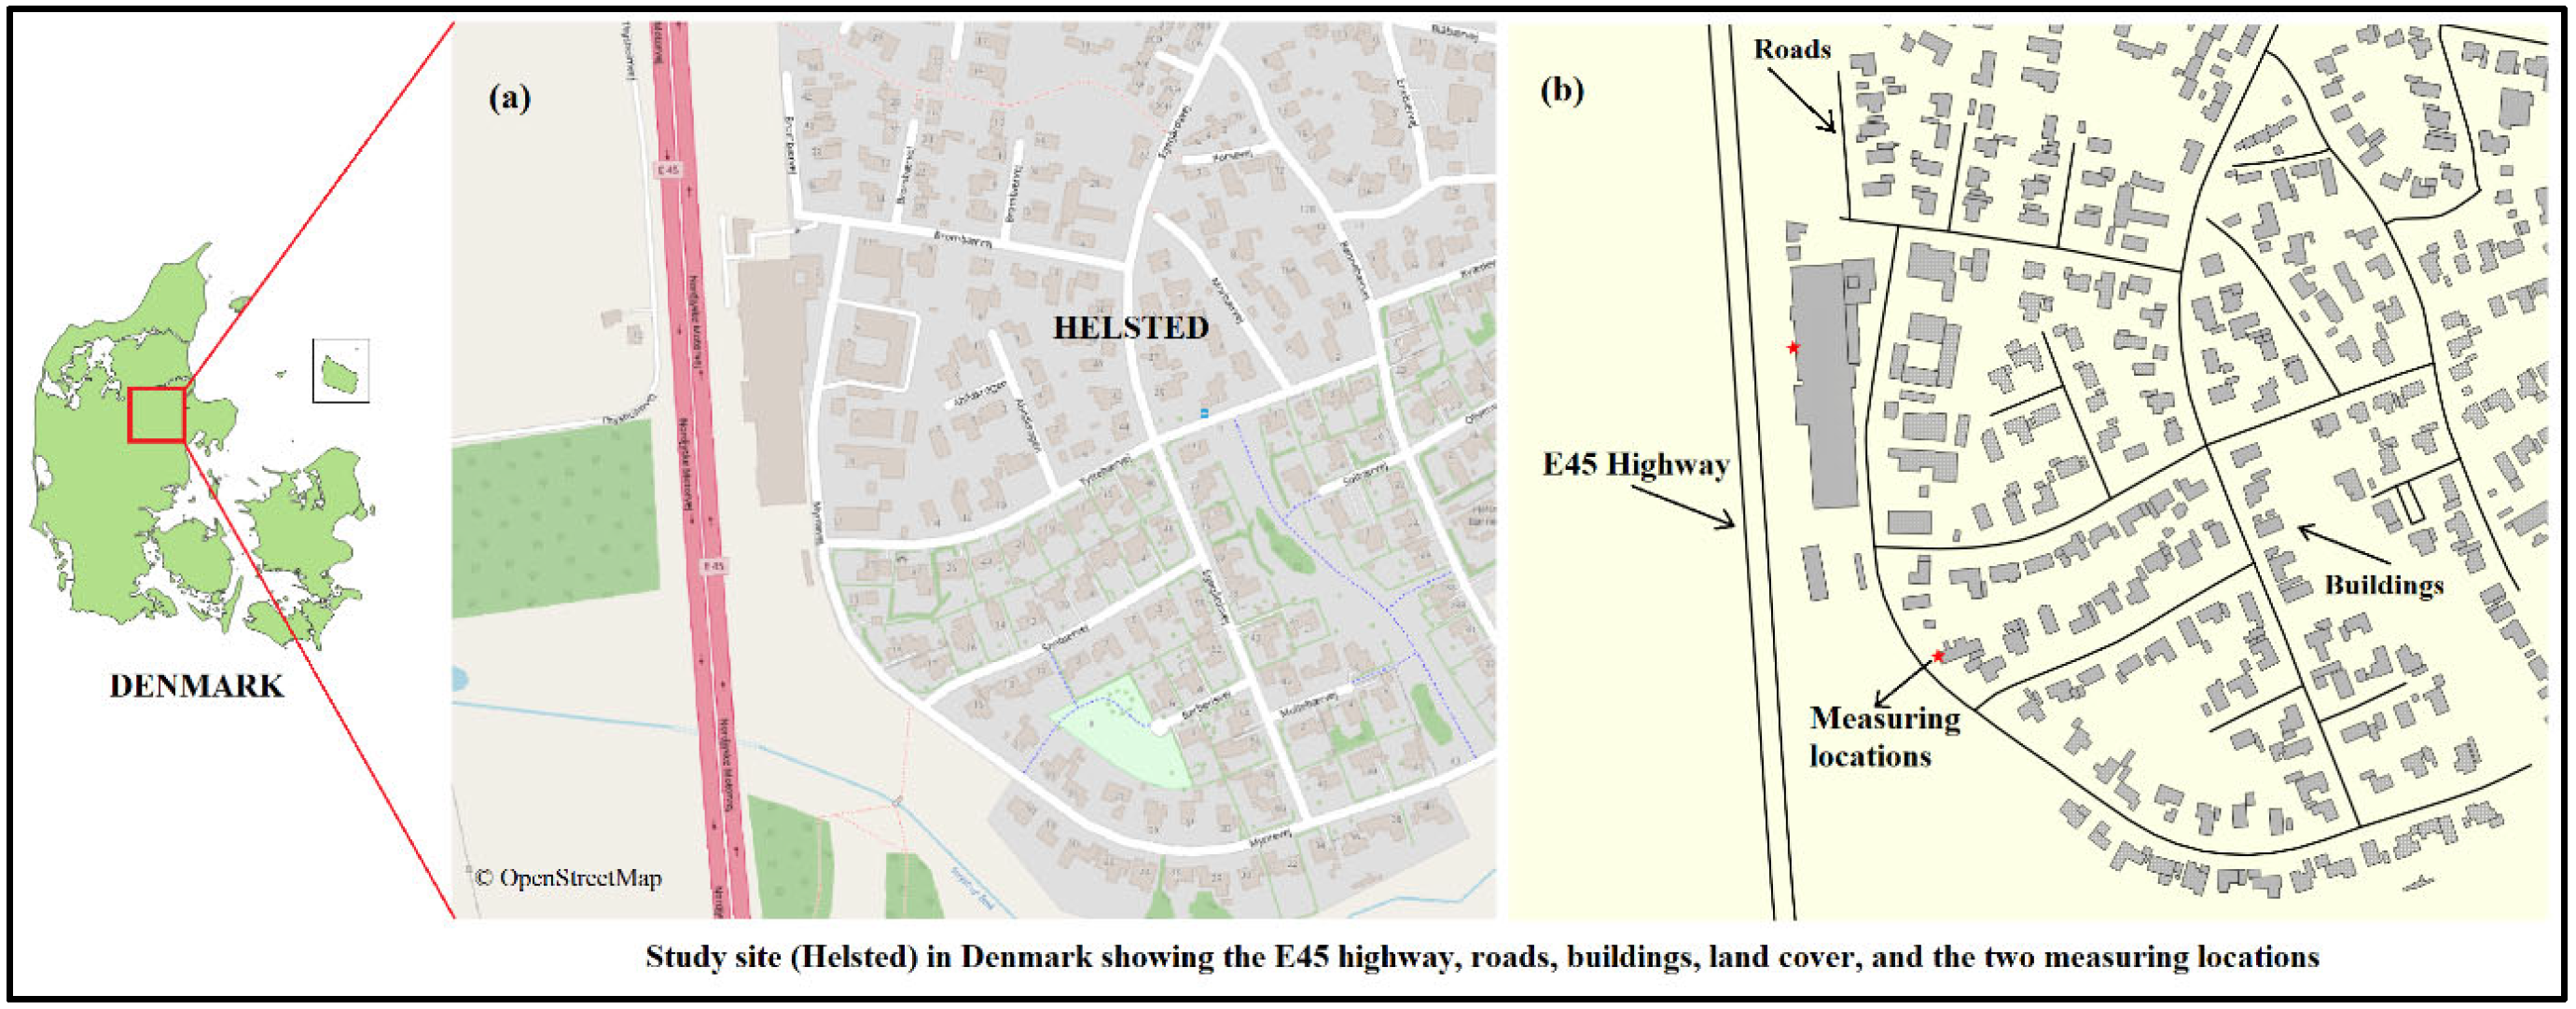
2.1. Study Site
2.2. Noise Measurements and Data Processing
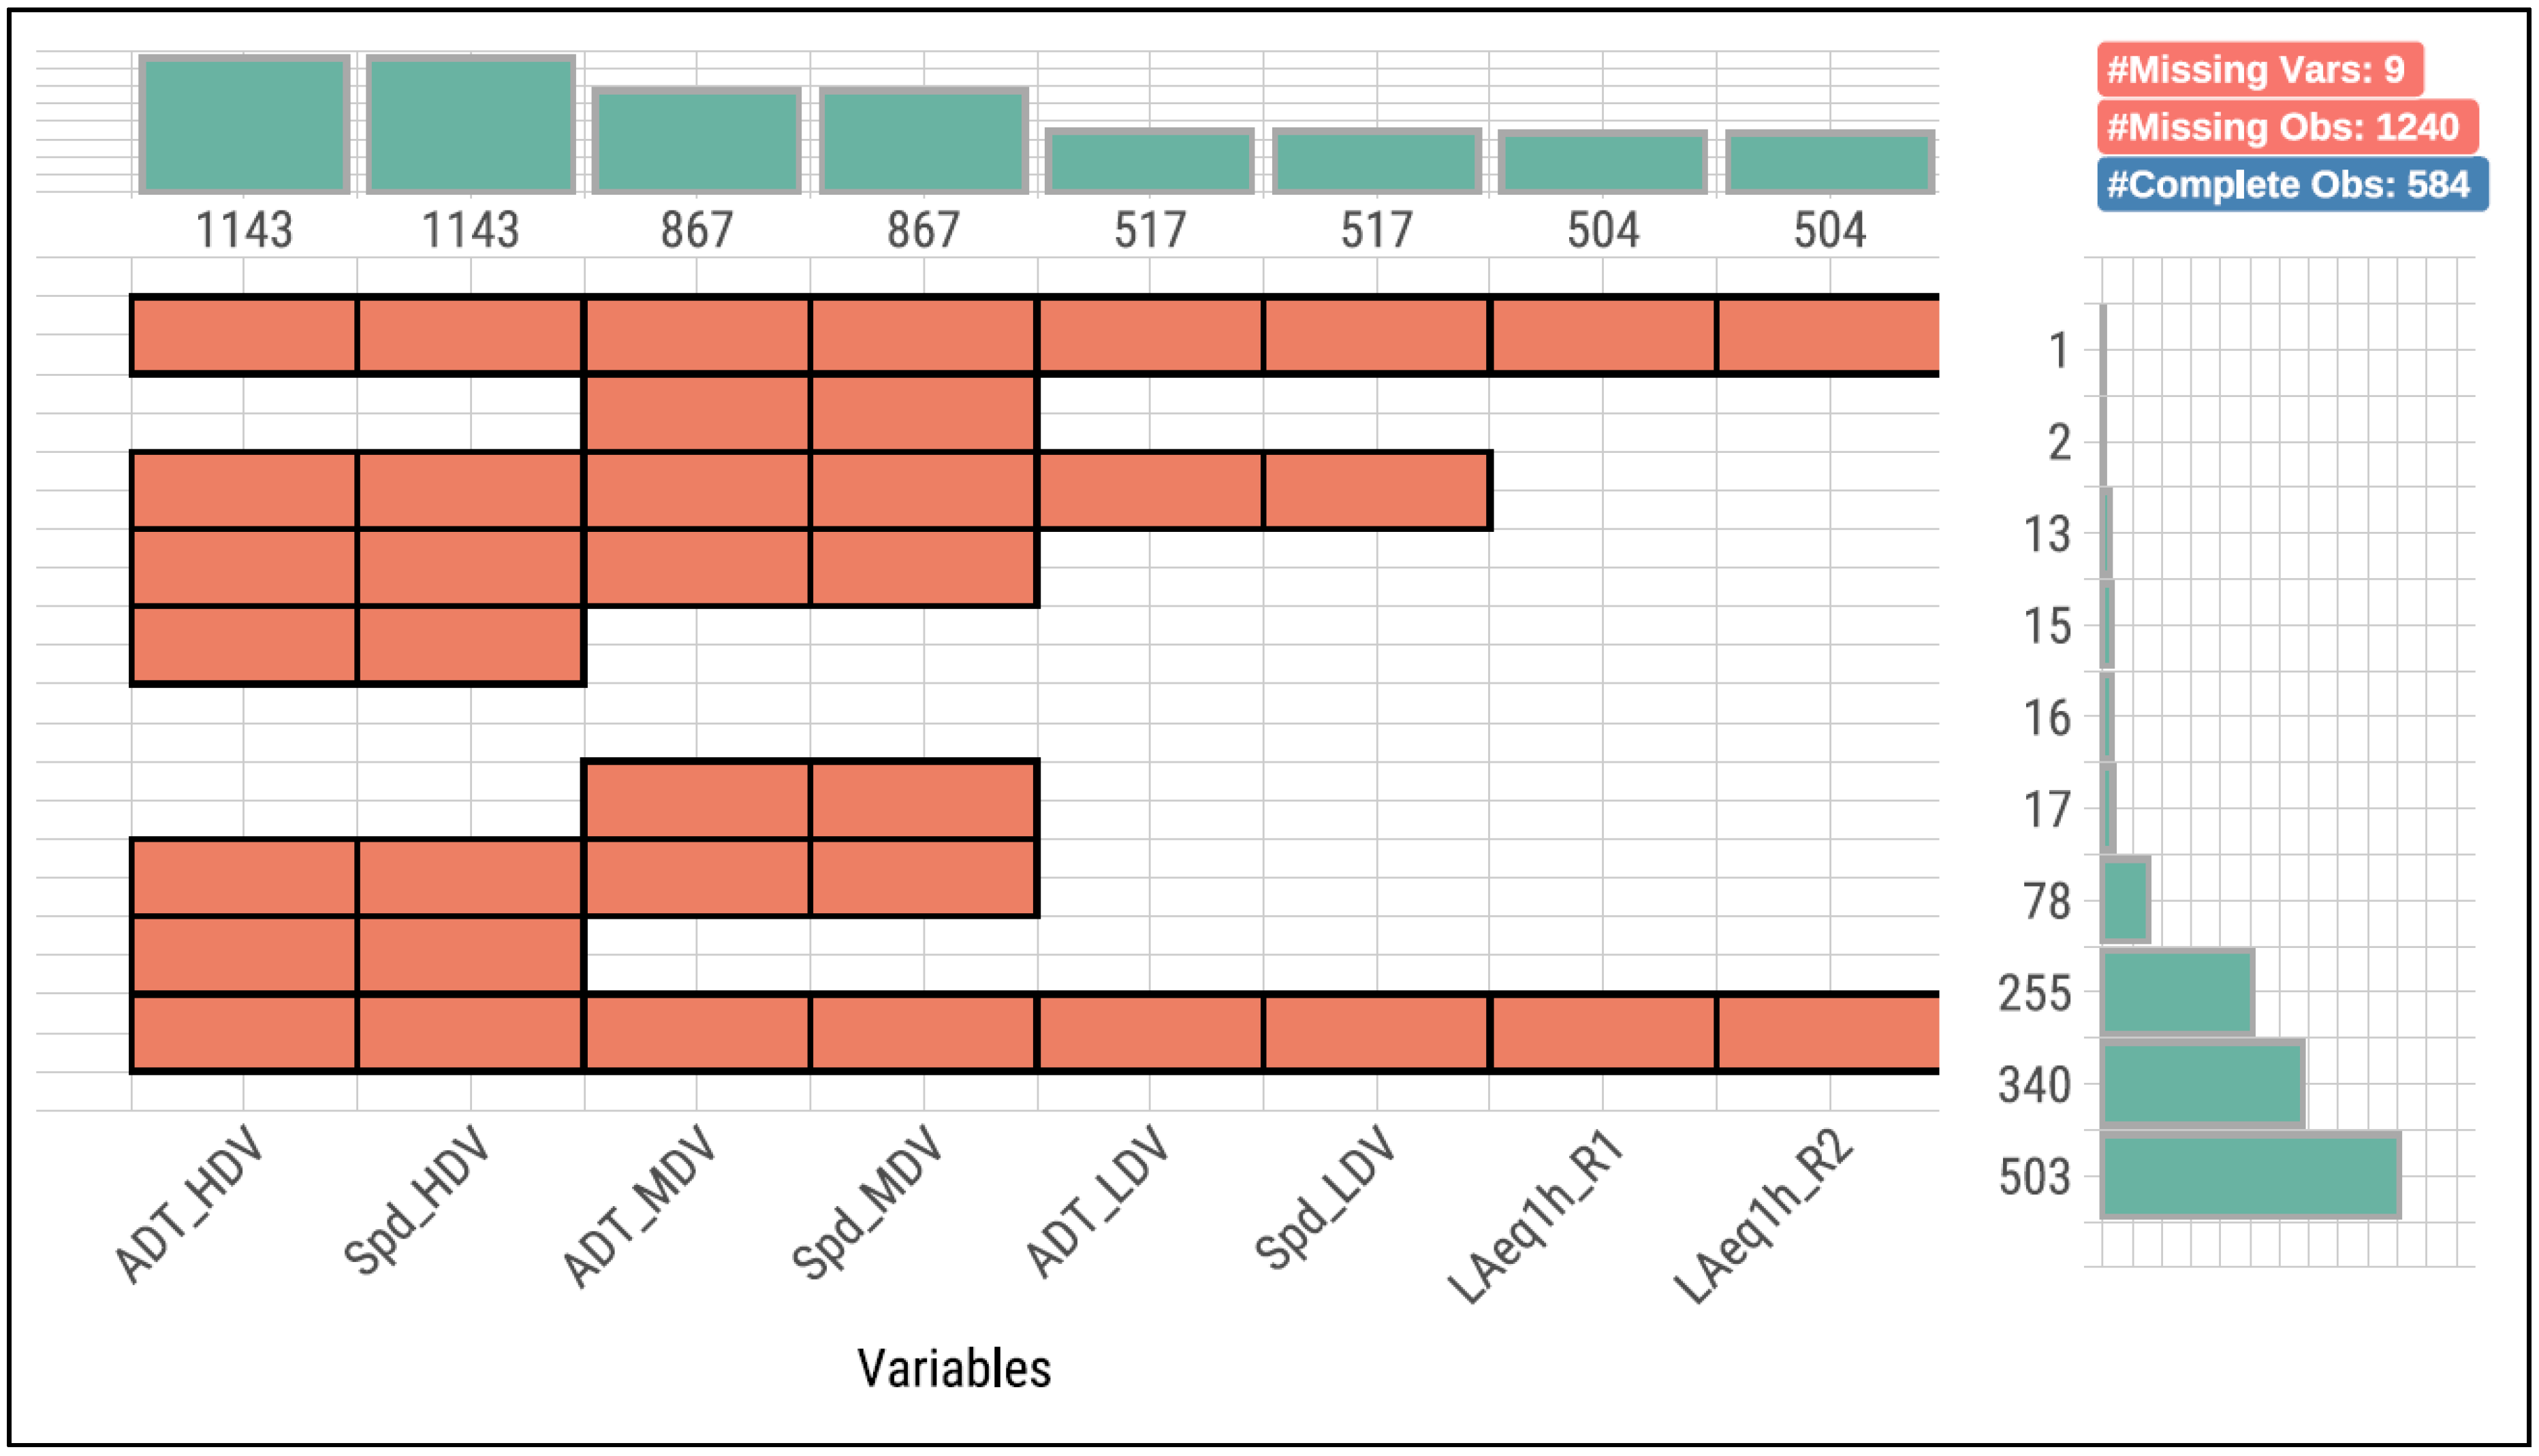
2.3. Data Imputation
2.4. Model Simulations
2.4.1. Nord2000
2.4.2. RTN-96
2.4.3. CNOSSOS
2.5. Noise Assessment and Model Evaluations
2.6. High-Resolution Noise Mapping
2.7. Data Fusion
3. Results
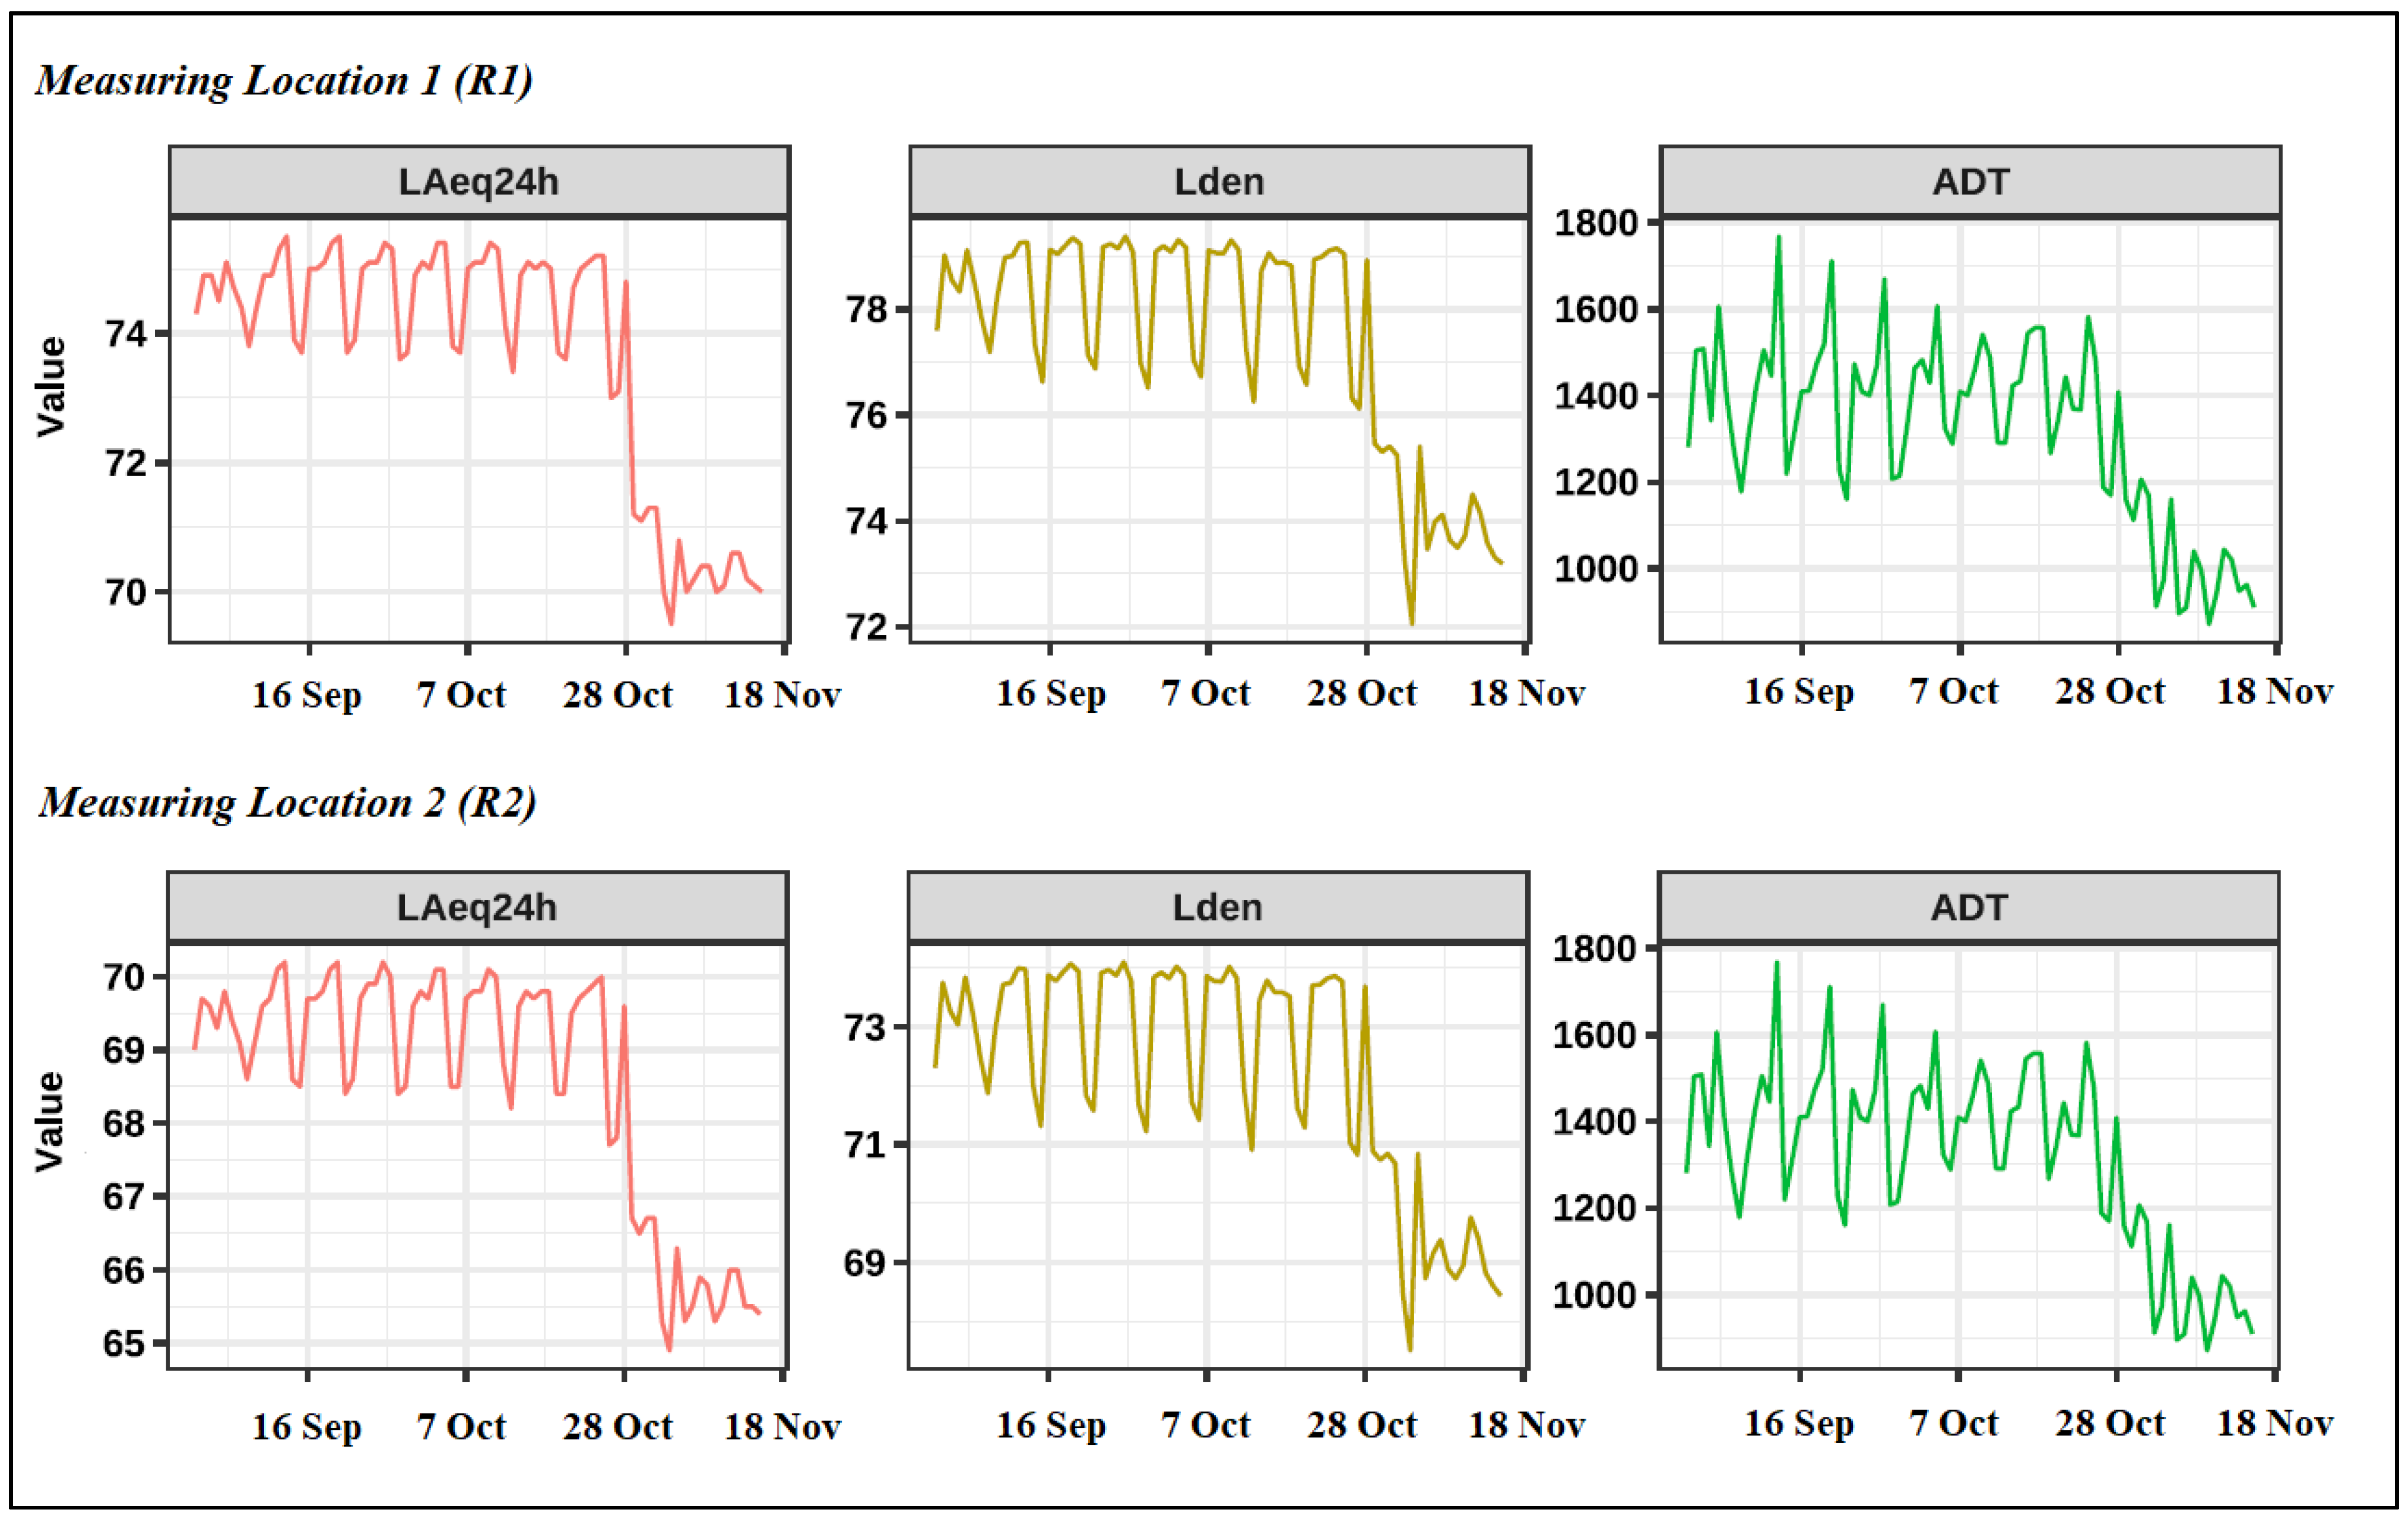
3.1. Measurements Results
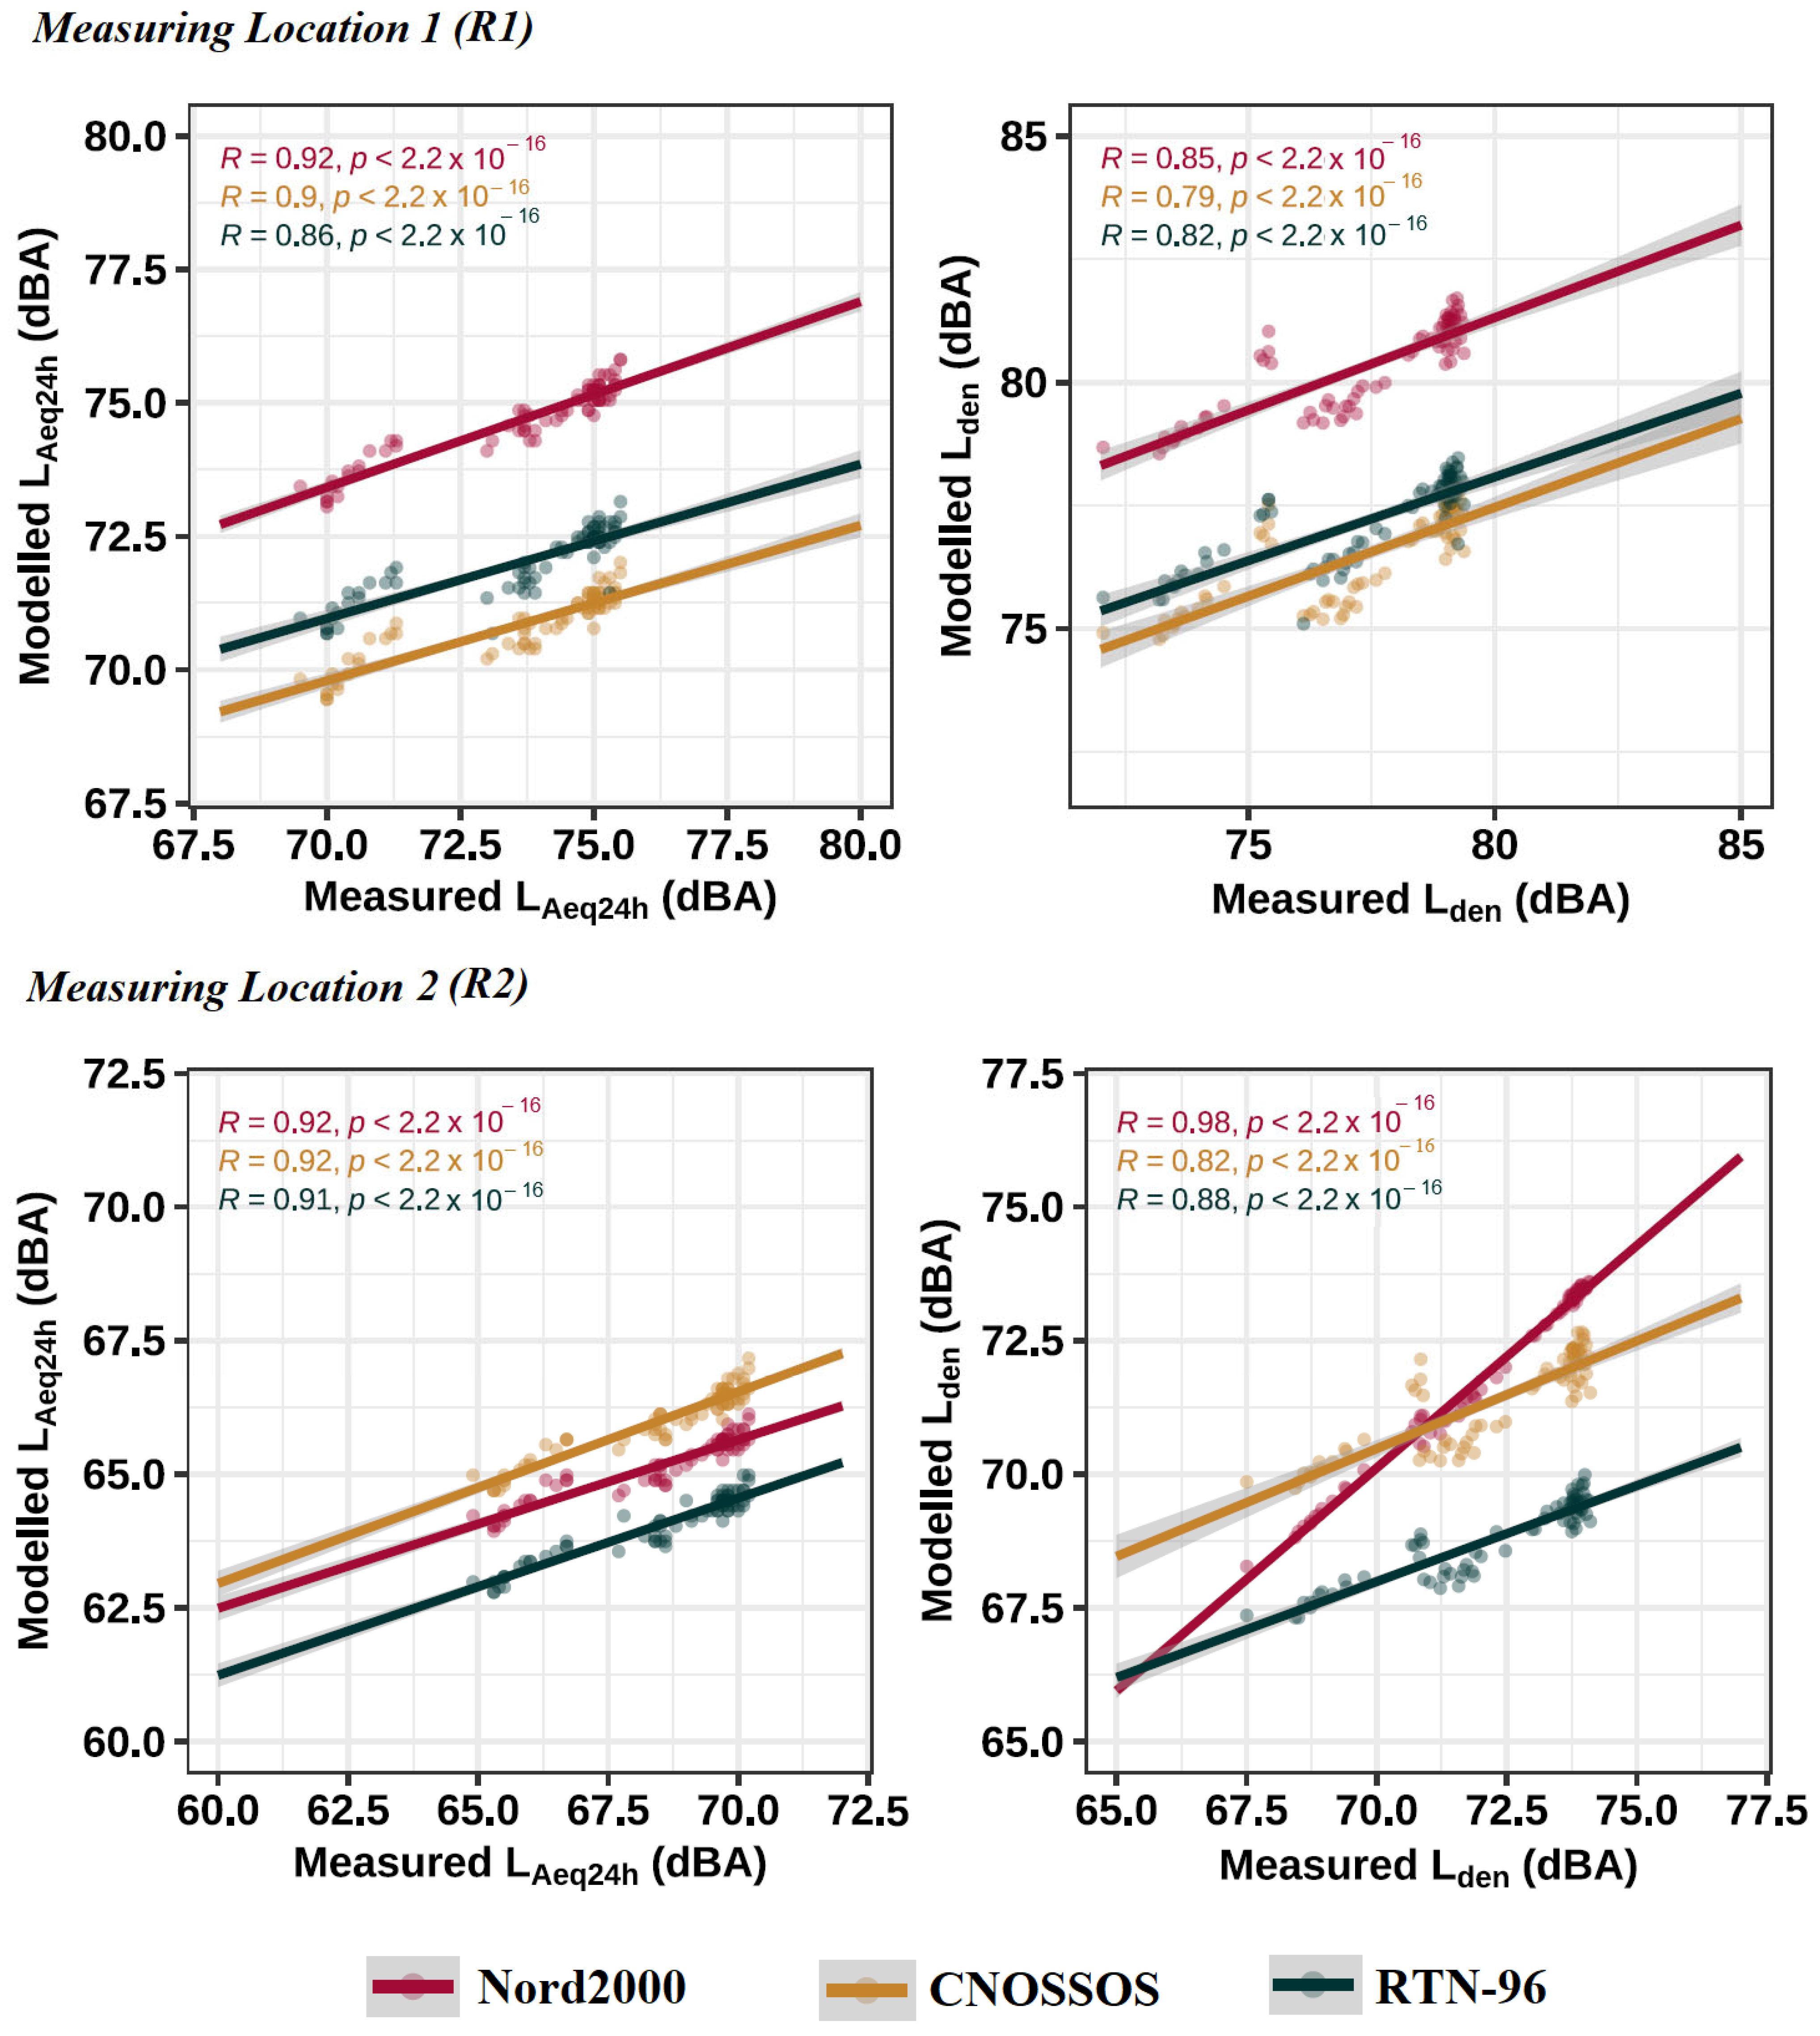
3.2. Measured vs. Simulated Noise
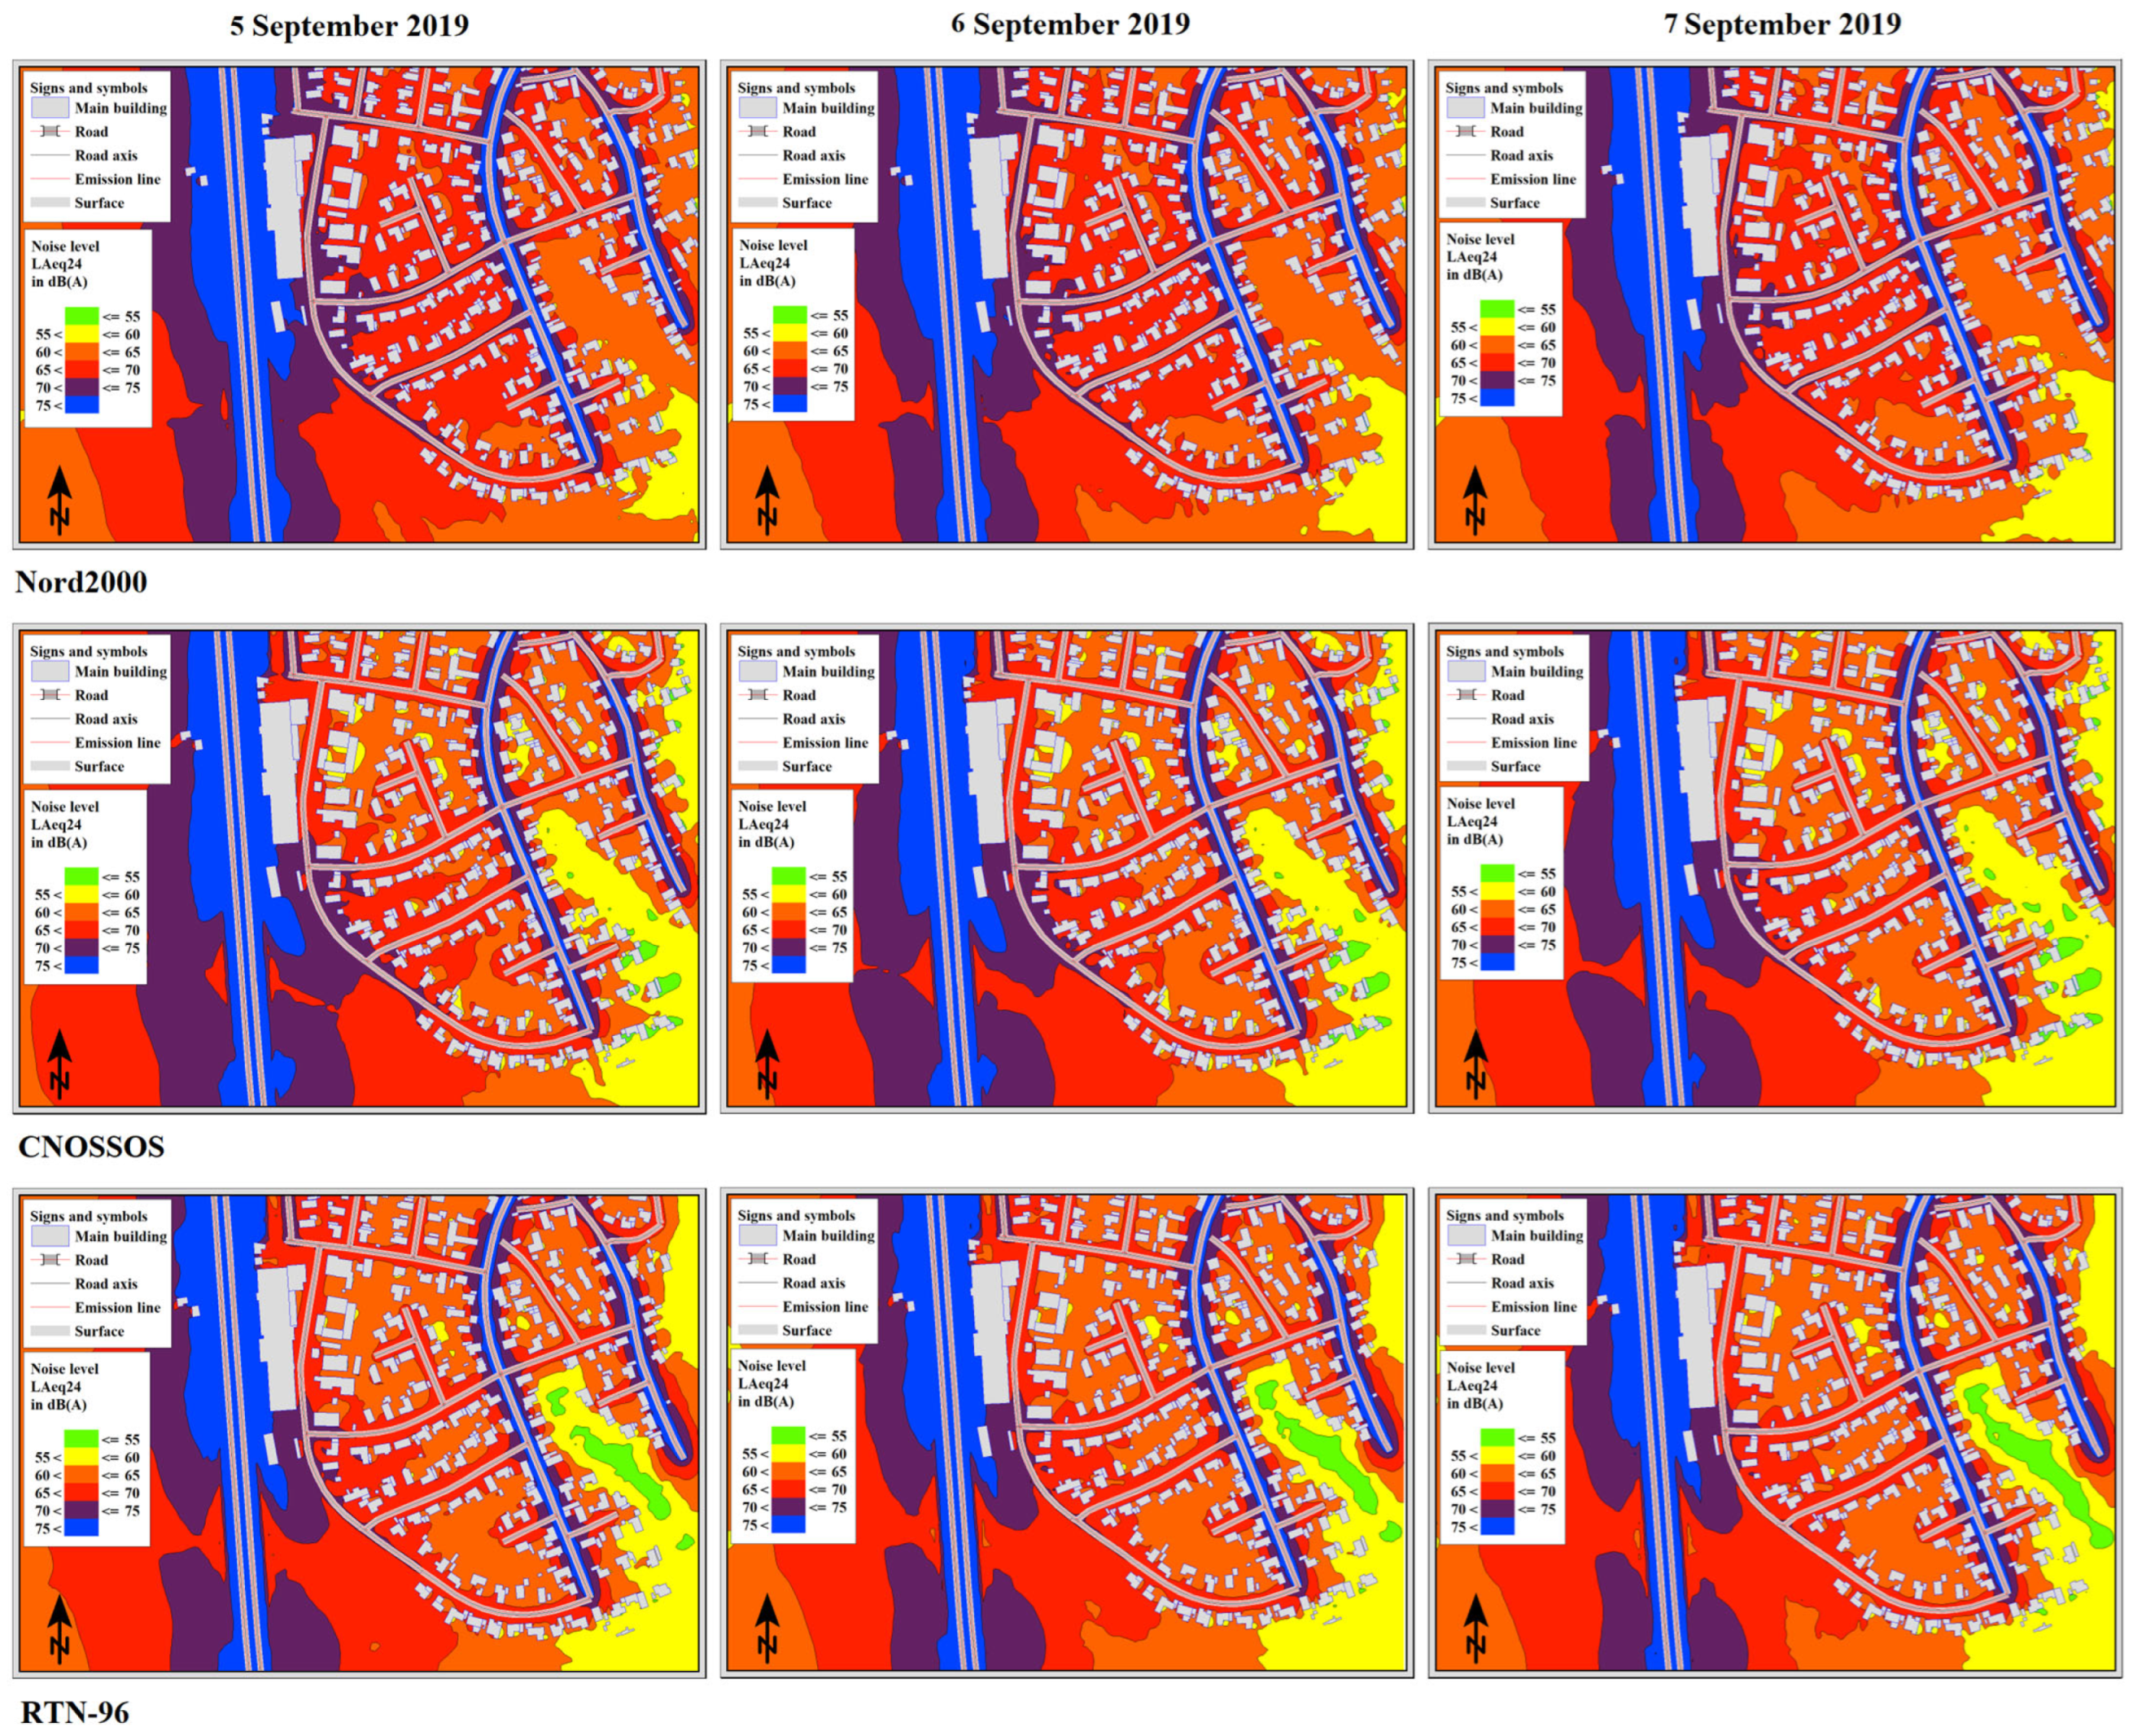
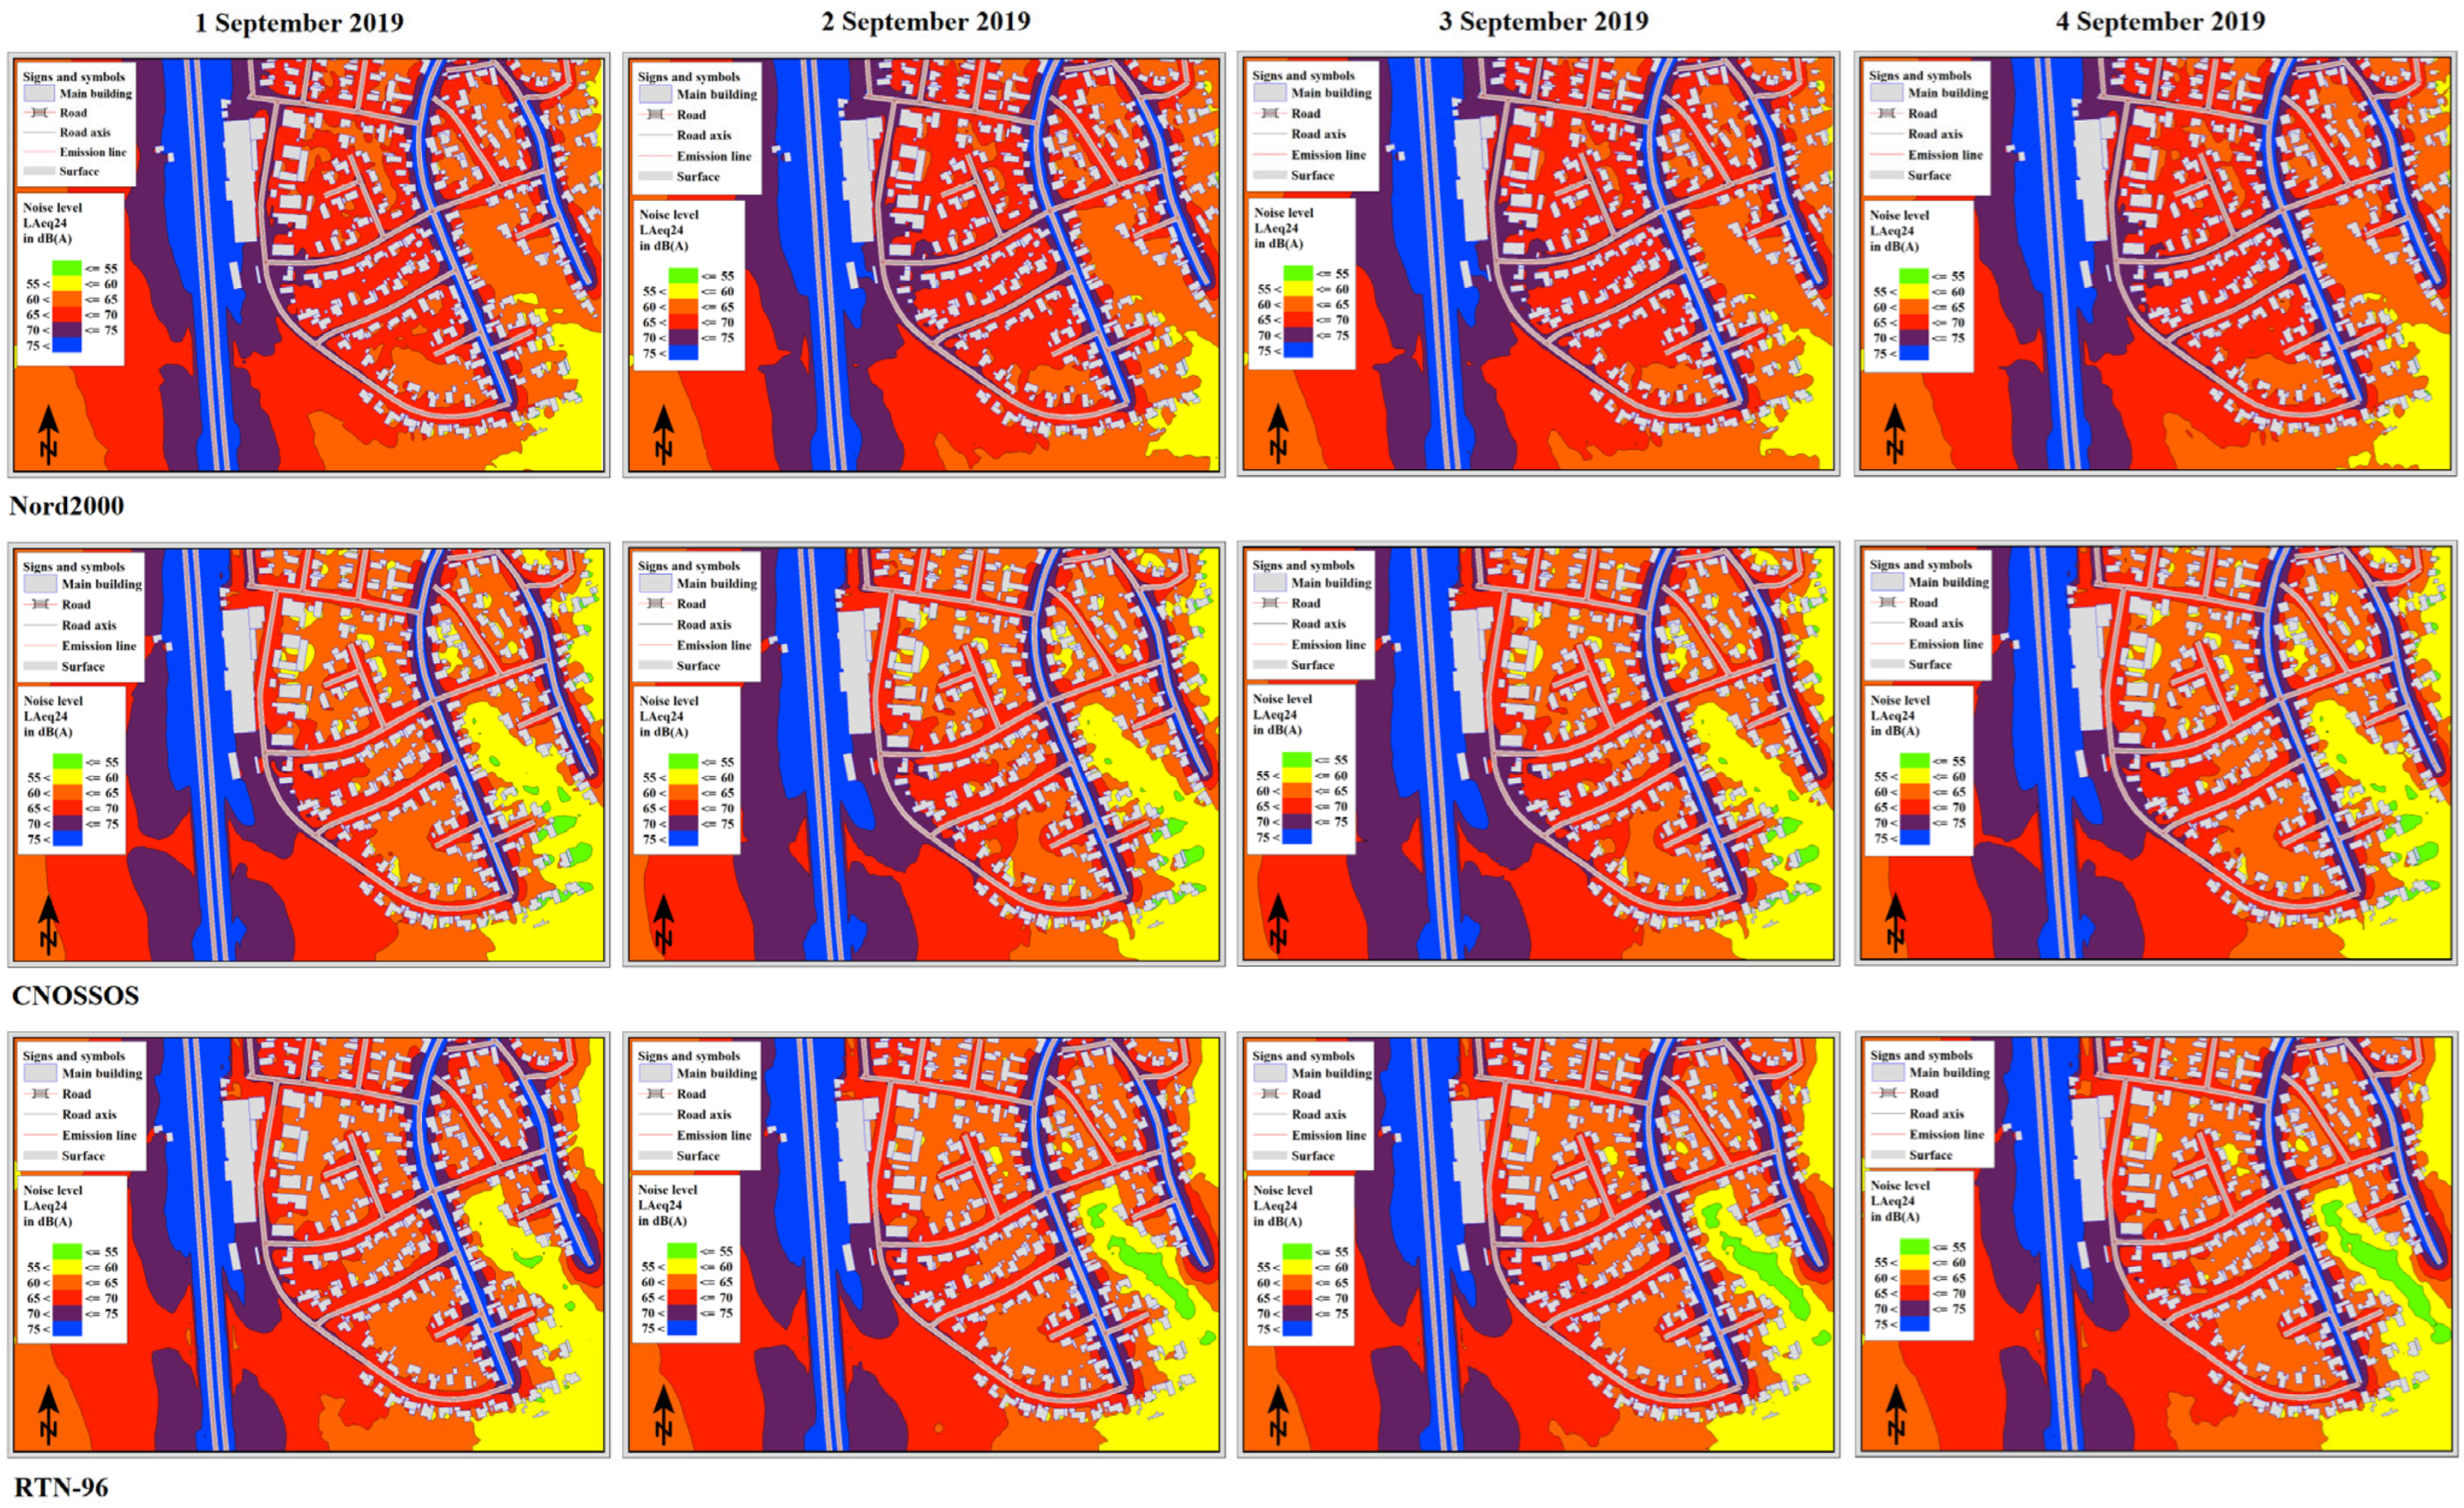
3.3. Results of Noise Mapping
3.4. Results of Data Fusion
4. Discussions
5. Strengths and Limitations
6. Conclusions
7. Outlook
Author Contributions
Funding
Data Availability Statement
Acknowledgments
Conflicts of Interest
Abbreviations
Appendix A
Appendix B


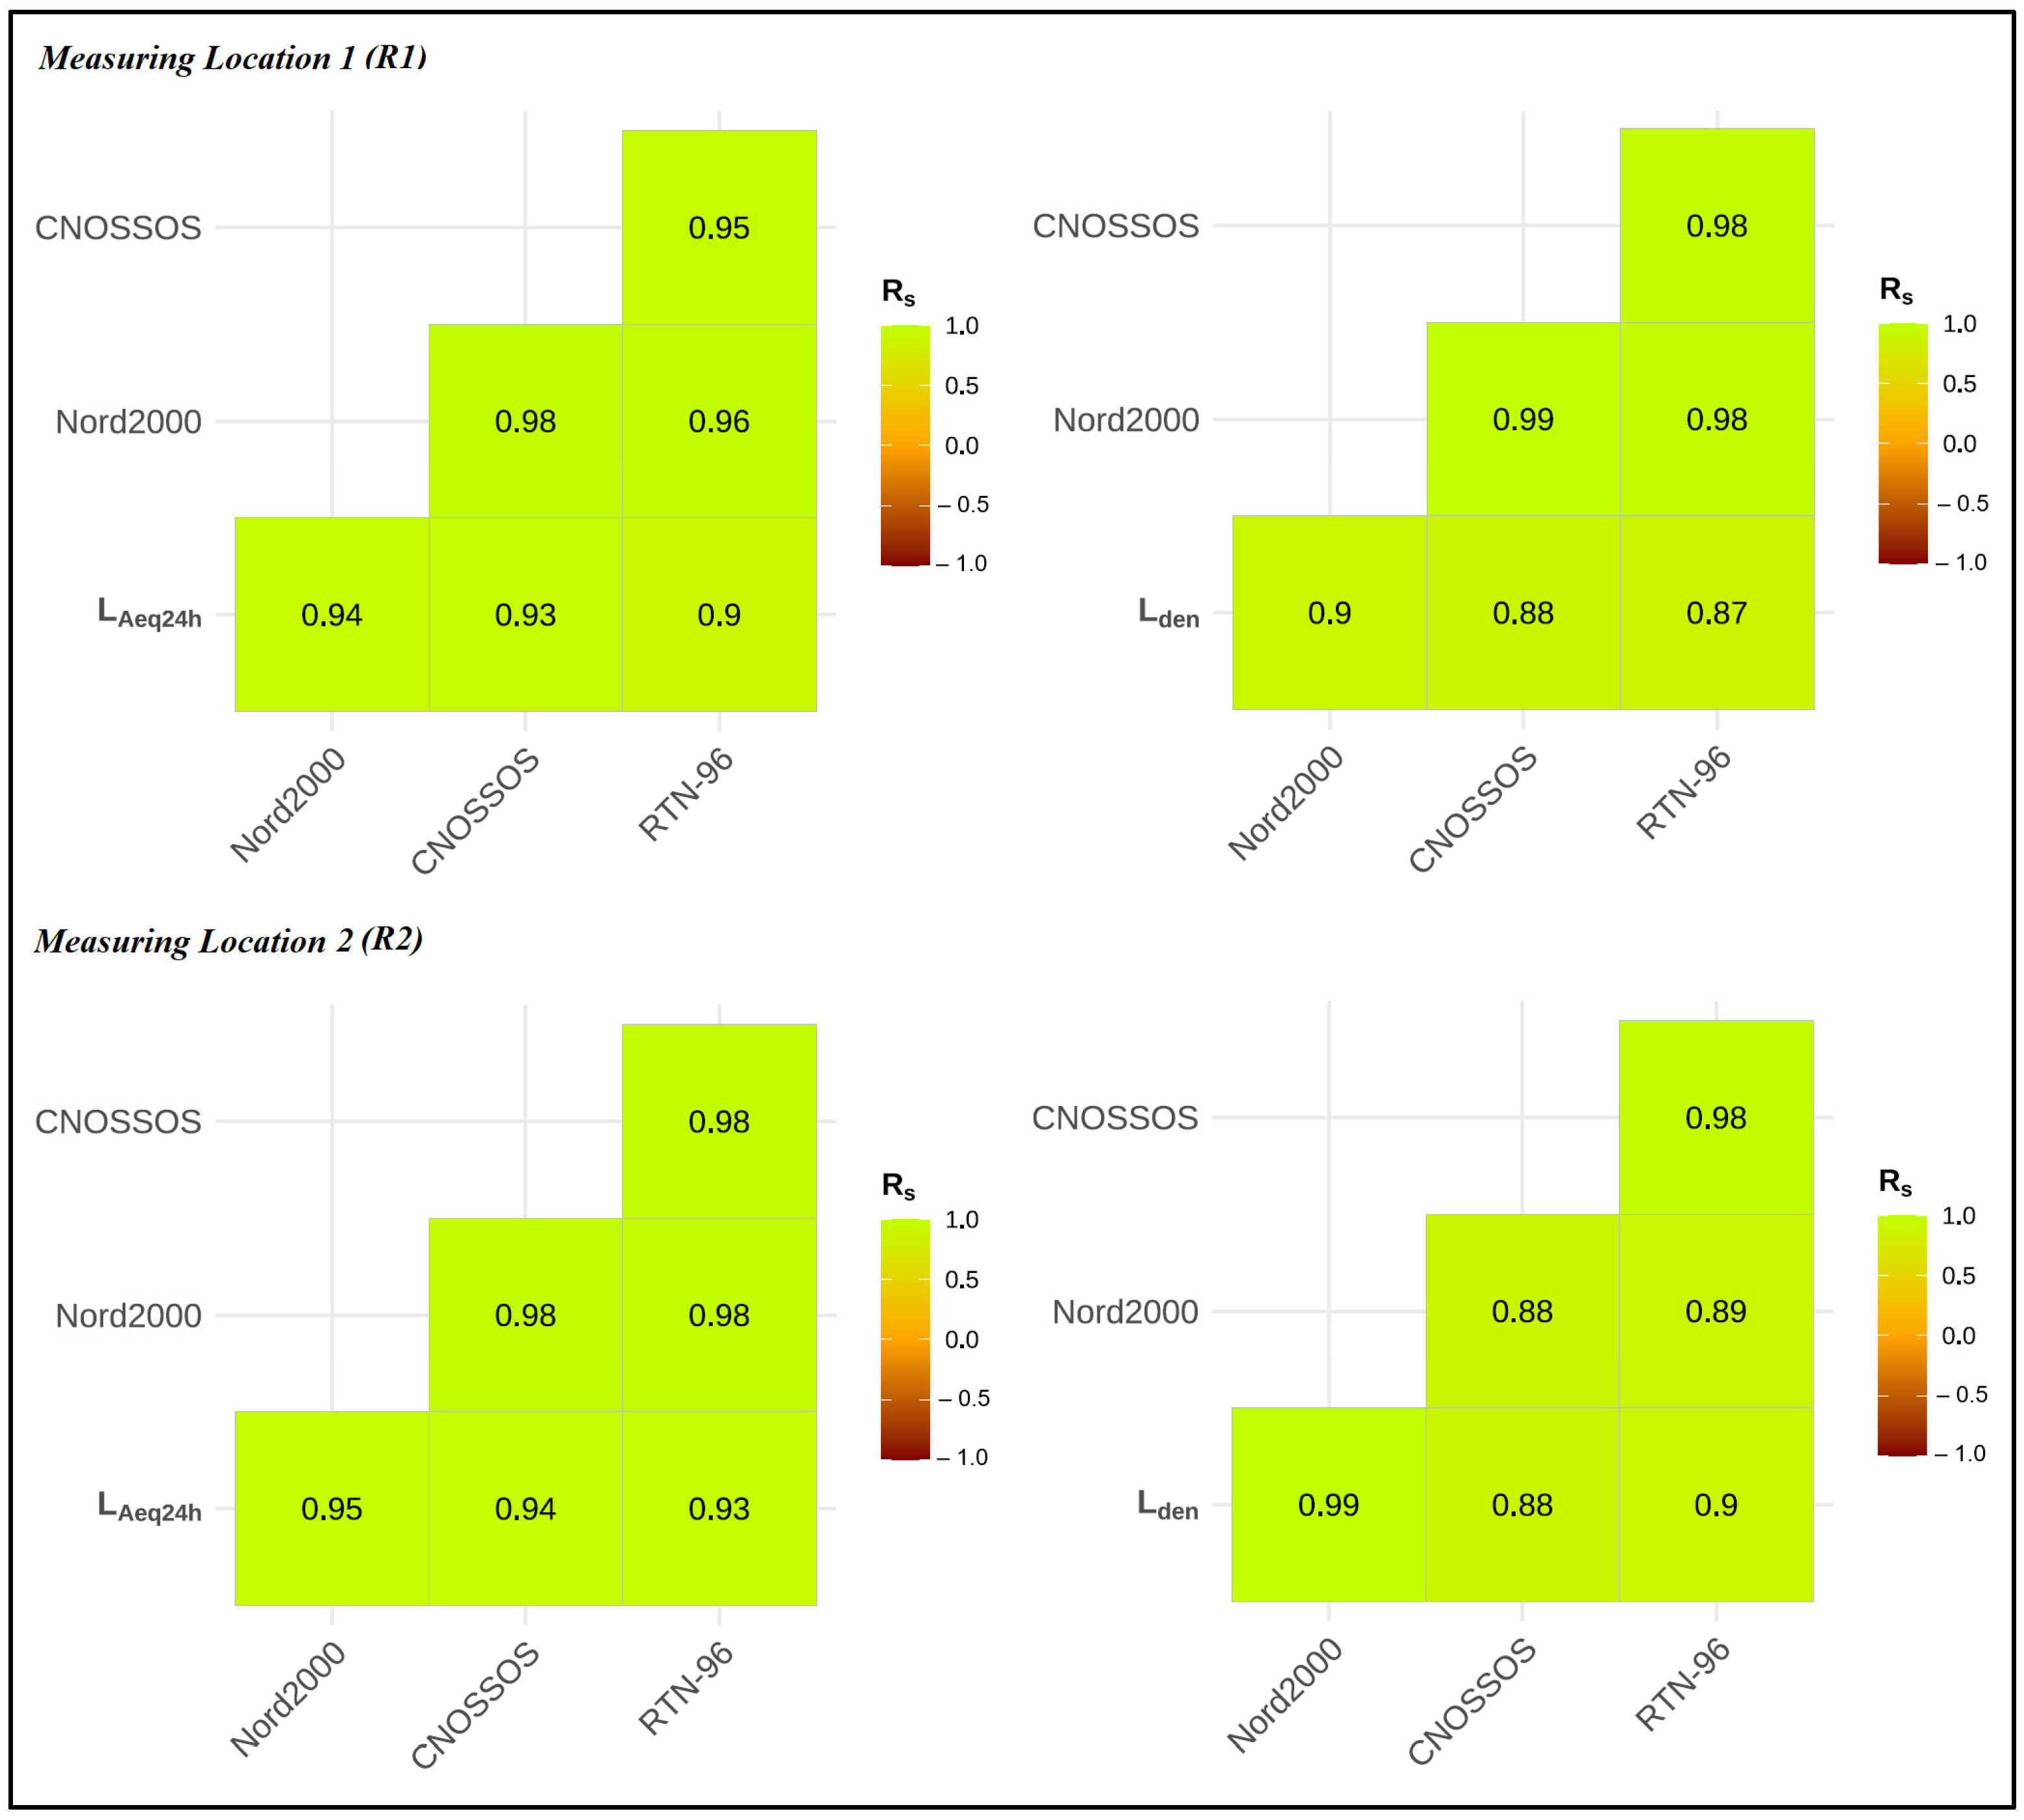
| Min | Mean | Med | Max | Rs | R2 | RMSE | MAE | Var | SD | |
|---|---|---|---|---|---|---|---|---|---|---|
| Measuring location 1 (R1) | ||||||||||
| LAeq24h (dBA) | ||||||||||
| Nord2000 | 72.7 | 74.6 | 74.9 | 75.7 | 0.94 | 0.89 | 1.4 | 0.8 | 0.71 | 0.84 |
| CNOSSOS | 69.5 | 71.1 | 71.4 | 72.3 | 0.93 | 0.87 | 2.6 | 2.2 | 0.54 | 0.73 |
| RTN-96 | 70.7 | 72.2 | 72.5 | 73.4 | 0.90 | 0.81 | 2.0 | 1.8 | 0.57 | 0.75 |
| Lden (dBA) | ||||||||||
| Nord2000 | 77.6 | 79.9 | 80.2 | 81.3 | 0.90 | 0.81 | 2.7 | 2.4 | 1.17 | 1.08 |
| CNOSSOS | 74.4 | 76.7 | 77.1 | 78.1 | 0.88 | 0.77 | 1.4 | 1.2 | 1.21 | 1.10 |
| RTN-96 | 75.1 | 77.2 | 77.6 | 78.6 | 0.87 | 0.76 | 1.3 | 1.1 | 1.03 | 1.02 |
| Measuring location 2 (R2) | ||||||||||
| LAeq24h (dBA) | ||||||||||
| Nord2000 | 64.1 | 65.5 | 65.9 | 66.5 | 0.95 | 0.90 | 3.0 | 2.7 | 0.44 | 0.66 |
| CNOSSOS | 64.7 | 66.3 | 66.6 | 67.6 | 0.94 | 0.88 | 2.2 | 1.9 | 0.56 | 0.75 |
| RTN-96 | 63.1 | 64.6 | 64.9 | 65.6 | 0.93 | 0.87 | 4.0 | 3.7 | 0.48 | 0.69 |
| Lden (dBA) | ||||||||||
| Nord2000 | 68.0 | 72.1 | 73.0 | 73.8 | 0.99 | 0.98 | 0.2 | 0.1 | 2.96 | 1.72 |
| CNOSSOS | 69.4 | 71.5 | 71.9 | 72.8 | 0.88 | 0.79 | 1.2 | 1.0 | 1.07 | 1.03 |
| RTN-96 | 67.4 | 69.3 | 69.6 | 70.5 | 0.90 | 0.80 | 3.1 | 2.9 | 0.77 | 0.88 |
References
- Khomenko, S.; Cirach, M.; Barrera-Gómez, J.; Pereira-Barboza, E.; Iungman, T.; Mueller, N.; Foraster, M.; Tonne, C.; Thondoo, M.; Jephcote, C.; et al. Impact of road traffic noise on annoyance and preventable mortality in European cities: A health impact assessment. Environ. Int. 2022, 162, 107160. [Google Scholar] [CrossRef] [PubMed]
- Meng, Z.L.; Chen, F.; Zhao, F.; Gu, H.L.; Zheng, Y. Early detection of noise-induced hearing loss. World J. Clin. Cases 2022, 10, 1815. Available online: https://www.ncbi.nlm.nih.gov/pmc/articles/PMC8891767/ (accessed on 16 October 2023). [CrossRef]
- Jagniatinskis, A.; Fiks, B.; Dimitriu, D. Annual assessment of highway traffic noise using two-channel short-term measurements. Transport 2014, 29, 204–211. [Google Scholar] [CrossRef]
- Bendtsen, H.; Pedersen, T.H. Noise annoyance from motorways is worse than annoyance from urban roads. In Proceedings of the EuroNoise2021 (Online Conference), Madeira, Portugal, 25–27 October 2021; Available online: http://www.sea-acustica.es/fileadmin/Madeira21/ID169.pdf (accessed on 16 October 2023).
- Van Renterghem, T.; Aletta, F.; Botteldooren, D. Changes in the soundscape of the public space close to a highway by a noise control intervention. Sustainability 2021, 13, 5284. [Google Scholar] [CrossRef]
- Begou, P.; Kassomenos, P.; Kelessis, A. Effects of road traffic noise on the prevalence of cardiovascular diseases: The case of Thessaloniki, Greece. Sci. Total Environ. 2020, 703, 134477. [Google Scholar] [CrossRef]
- European Environment Agency (EEA). Health Risks Caused by Environmental Noise in Europe. 2020. Available online: https://www.eea.europa.eu/publications/health-risks-caused-by-environmental (accessed on 16 October 2023).
- European Environment Agency. Road Traffic Remains Biggest Source of Noise Pollution in Europe. 2020. Available online: https://www.eea.europa.eu/highlights/road-traffic-remains-biggest-source (accessed on 16 October 2023).
- Danish Environmental Protection Agency (EPA). Traffic Noise. 2022. Available online: https://eng.mst.dk/air-noise-waste/noise/traffic-noise/ (accessed on 16 October 2023).
- Melo, R.A.; Pimentel, R.L.; Lacerda, D.M.; Silva, W.M. Applicability of models to estimate traffic noise for urban roads. J. Environ. Health Sci. Eng. 2015, 13, 83. [Google Scholar] [CrossRef] [PubMed]
- Bravo-Moncayo, L.; Chávez, M.; Puyana, V.; Lucio-Naranjo, J.; Garzón, C.; Pavón-García, I. A cost-effective approach to the evaluation of traffic noise exposure in the city of Quito, Ecuador. Case Stud. Transp. Policy 2019, 7, 128–137. [Google Scholar] [CrossRef]
- Khan, J.; Ketzel, M.; Kakosimos, K.; Sørensen, M.; Jensen, S.S. Road traffic air and noise pollution exposure assessment–A review of tools and techniques. Sci. Total Environ. 2018, 634, 661–676. [Google Scholar] [CrossRef]
- Craven, N.J.; Kerry, G. A Good Practice Guide on the Sources and Magnitude of Uncertainty Arising in the Practical Measurement of Environmental Noise; University of Salford: Salford, UK, 2007; Available online: https://usir.salford.ac.uk/id/eprint/20640/1/Good_Practice_Guide_May_2007.pdf (accessed on 16 October 2023).
- Liguori, C.; Paolillo, A.; Ruggiero, A.; Russo, D. Outlier detection for the evaluation of the measurement uncertainty of environmental acoustic noise. IEEE Trans. Instrum. Meas. 2015, 65, 234–242. [Google Scholar] [CrossRef]
- Peters, R. (Ed.) Uncertainty in Acoustics: Measurement, Prediction and Assessment; CRC Press: Boca Raton, FL, USA, 2020; ISBN #9780429470622. Available online: https://www.routledge.com/Uncertainty-in-Acoustics-Measurement-Prediction-and-Assessment/Peters/p/book/9780367492472 (accessed on 16 October 2023).
- Lyse Nielsen, H. Road Traffic Noise: Nordic Prediction Method: No. 1996-525; (TemaNord). Nordic Council of Ministers’ Technical Report #1996-525 (Revised); Nordic Council of Ministers: Copenhagen, Denmark, 1997; Available online: https://books.google.dk/books/about/Road_Traffic_Noise.html?id=icIiN15oFPUC&redir_esc=y (accessed on 16 October 2023).
- Plovsing, B. Nord2000—Comprehensive Outdoor Sound Propagation Model. Part 1: Propagation in an Atmosphere without Significant Refraction; Technical Report #AV1849/00 (Revised); DELTA Acoustics and Vibrations: Hørsholm, Danmark, 2006; Available online: https://forcetechnology.com/-/media/force-technology-media/pdf-files/projects/nord2000/nord2000-comprehensive-outdoor-sound-propagation.pdf (accessed on 16 October 2023).
- Plovsing, B. Nord2000. Comprehensive Outdoor Sound Propagation Model. Part 2: Propagation in an Atmosphere with Refraction; Technical Report #AV1851/00 (Revised); DELTA Acoustics and Vibrations: Hørsholm, Danmark, 2006; Available online: https://forcetechnology.com/-/media/force-technology-media/pdf-files/projects/nord2000/nord2000-comprehensive-outdoor-sound-propagation-model---part-2-propagation-in-an-atmosphere-with-re.pdf (accessed on 16 October 2023).
- Plovsing, B. Proposal for Nordtest Method: Nord2000—Prediction of Outdoor Sound Propagation; Technical Report #1106/07 (Revised); DELTA Acoustics and Vibrations: Hørsholm, Danmark, 2014; Available online: https://forcetechnology.com/-/media/force-technology-media/pdf-files/projects/nord2000/nord2000-nordtestproposal-rev4.pdf (accessed on 16 October 2023).
- Khan, J.; Ketzel, M.; Jensen, S.S.; Gulliver, J.; Thysell, E.; Hertel, O. Comparison of Road Traffic Noise prediction models: CNOSSOS-EU, Nord2000 and TRANEX. Environ. Pollut. 2021, 270, 116240. [Google Scholar] [CrossRef]
- Danish Environmental Protection Agency (EPA) Nord2000: Nordic Noise Prediction Method. 2022. Available online: https://eng.mst.dk/air-noise-waste/noise/traffic-noise/nord2000-nordic-noise-prediction-method/ (accessed on 16 October 2023).
- Thacher, J.D.; Poulsen, A.H.; Raaschou-Nielsen, O.; Hvidtfeldt, U.A.; Brandt, J.; Christensen, J.H.; Khan, J.; Levin, G.; Münzel, T.; Sørensen, M. Exposure to transportation noise and risk for cardiovascular disease in a nationwide cohort study from Denmark. Environ. Res. 2022, 211, 113106. [Google Scholar] [CrossRef] [PubMed]
- Erdmann, F.; Raaschou-Nielsen, O.; Hvidtfeldt, U.A.; Ketzel, M.; Brandt, J.; Khan, J.; Schüz, J.; Sørensen, M. Residential road traffic and railway noise and risk of childhood cancer: A nationwide register-based case-control study in Denmark. Environ. Res. 2022, 212, 113180. [Google Scholar] [CrossRef] [PubMed]
- Danish EPA. Støj fra veje (Noise from Roads). Road Noise Guidelines Report #04/2007. 2007. Available online: https://www2.mst.dk/Udgiv/publikationer/2007/978-87-7052-542-8/pdf/978-87-7052-542-8.pdf (accessed on 16 October 2023). (In Danish).
- Kephalopoulos, S.; Paviotti, M.; Anfosso-Lédée, F.; Van Maercke, D.; Shilton, S.; Jones, N. Advances in the development of common noise assessment methods in Europe: The CNOSSOS-EU framework for strategic environmental noise mapping. Sci. Total Environ. 2014, 482, 400–410. [Google Scholar] [CrossRef] [PubMed]
- European Commission. Common Noise Assessment Methods for the EU Member States (CNOSSOS-EU) (Annex II). Commission Delegated Directive (EU) #2021/1226. Amendments for Annex II to Directive 2002/49/EC of the European Parliament and of the Council as Regards Common Noise Assessment Methods. 2021. Available online: https://eur-lex.europa.eu/legal-content/EN/TXT/HTML/?uri=CELEX:32021L1226 (accessed on 16 October 2023).
- Kokkonen, A. CNOSSOS-EU noise model implementation in Finland and experience of it in 3rd END round. In Proceedings of the EuroNoise 2018, Crete, Greece, 27–31 May 2018; pp. 27–31. Available online: https://www.euronoise2018.eu/docs/papers/207_Euronoise2018.pdf (accessed on 16 October 2023).
- Salomons, E.; Eisses, A. Investigations of the cnossos sound propagation model. In Proceedings of the EuroNoise 2018, Heraklion, Greece, 27–31 May 2018; pp. 1253–1260. Available online: https://www.euronoise2018.eu/docs/papers/212_Euronoise2018.pdf (accessed on 16 October 2023).
- Kok, A. Refining the CNOSSOS-EU calculation method for environmental noise. In Proceedings of the InterNoise 2019, Madrid, Spain, 16–19 June 2019; Available online: http://www.sea-acustica.es/fileadmin/INTERNOISE_2019/Fchrs/Proceedings/1418.pdf (accessed on 16 October 2023).
- Kok, A.; van Beek, A. Amendments for CNOSSOS-EU: Description of Issues and Proposed Solutions; RIVM Letter Report 2019-0023; Rijksinstituut voor Volksgezondheid en Milieu RIVM: Utrecht, The Netherlands, 2019; Available online: https://rivm.openrepository.com/handle/10029/623095 (accessed on 16 October 2023).
- Danish EPA Ny Strategisk EU Støjkortlægning 2022 (In English: New Strategic EU Noise Mapping 2022). 2023. Available online: https://tinyurl.com/7yztsnx9 (accessed on 16 October 2023).
- Jónsson, G.B.; Jacobsen, F. A comparison of two engineering models for outdoor sound propagation: Harmonoise and Nord2000. Acta Acust. United Acust. 2008, 94, 282–289. [Google Scholar] [CrossRef]
- Kragh, J. Noise Classification—Asphalt Pavement; Danish Road Directorate’s Technical Note #61, 2007; Road Directorate, Danish Road Institute: Hedehusene, Denmark, 2007; Available online: https://www.vejdirektoratet.dk/sites/default/files/publications/noise_classification.pdf (accessed on 16 October 2023).
- Kragh, J. Traffic Noise Prediction with Nord2000—An Update; Danish Road Directorate’s Technical Report #195-2011; Road Directorate, Danish Road Institute: Hedehusene, Denmark, 2011; ISBN 9788770607612. Available online: https://www.vejdirektoratet.dk/api/drupal/sites/default/files/publications/traffic_noise_prediction_with_nord2000.pdf (accessed on 16 October 2023).
- Bendtsen, H. The Nordic prediction method for road traffic noise. Sci. Total Environ. 1999, 235, 331–338. [Google Scholar] [CrossRef]
- Ström, T. Vägtrafikbuller-Bestämning av Berägningsosäkerhet (Road Traffic Noise—An Estimate of Prediction Uncertainty); Nordtest projekt 1273–96. SP Report; Swedish National Testing and Research Institute: Borås, Sweden, 1997; p. 24. (In Swedish) [Google Scholar]
- Faulkner, J.P.; Murphy, E. Road traffic noise modelling and population exposure estimation using CNOSSOS-EU: Insights from Ireland. Appl. Acoust. 2022, 192, 108692. [Google Scholar] [CrossRef]
- Larsson, K. Updated road traffic noise emission models in Sweden. In Proceedings of the INTER-NOISE and NOISE-CON Congress and Conference, Hamburg, Germany, 21–24 August 2016; Volume 253, pp. 7180–7191. Available online: https://www.diva-portal.org/smash/get/diva2:1059678/FULLTEXT01.pdf (accessed on 16 October 2023).
- Nakamura, E.F.; Loureiro, A.A.; Frery, A.C. Information fusion for wireless sensor networks: Methods, models, and classifications. ACM Comput. Surv. CSUR 2007, 39, 9-es. [Google Scholar] [CrossRef]
- Gressent, A.; Malherbe, L.; Colette, A.; Rollin, H.; Scimia, R. Data fusion for air quality mapping using low-cost sensor observations: Feasibility and added value. Environ. Int. 2020, 143, 105965. [Google Scholar] [CrossRef]
- Becerra, M.A.; Tobón, C.; Castro-Ospina, A.E.; Peluffo-Ordóñez, D.H. Information quality assessment for data fusion systems. Data 2021, 6, 60. [Google Scholar] [CrossRef]
- Khaleghi, B.; Khamis, A.; Karray, F.O.; Razavi, S.N. Multisensor data fusion: A review of the state-of-the-art. Inf. Fusion 2013, 14, 28–44. [Google Scholar] [CrossRef]
- Elmenreich, W. Fusion of continuous-valued sensor measurements using confidence-weighted averaging. J. Vib. Control 2007, 13, 1303–1312. [Google Scholar] [CrossRef]
- GeoView Info Denmark Helsted. 2022. Available online: https://dk.geoview.info/helsted,2620467 (accessed on 16 October 2023).
- Cambridge Dictionary. Motorway. 2023. Available online: https://dictionary.cambridge.org/dictionary/english/motorway (accessed on 16 October 2023).
- Wiki Voyage. E45 through Europe. 2023. Available online: https://en.wikivoyage.org/wiki/E45_through_Europe (accessed on 16 October 2023).
- Danish Road Directorate. Traffic Info. 2023. (In Danish). Available online: https://trafikkort.vejdirektoratet.dk/ (accessed on 16 October 2023).
- Kragh, J.; Backalarz, C. Langtidsmålinger af støj fra Motorvej E45 (In English: “Long-Term Measurements of Noise from E45 Highway”); Report #TC-101612 Revision 1 (Case #119-26135), Prepared for the Danish Road Directorate; FORCE Technology: Hørsholm, Denmark, 2021. [Google Scholar]
- ISO 1996-2:2017; Acoustics—Description, Measurement, and Assessment of Environmental Noise—Part 2: Determination of Sound Pressure Levels. International Organization for Standardization (ISO): Geneva, Switzerland, 2023. Available online: https://tinyurl.com/35b26ftx (accessed on 16 October 2023).
- Sigicom. Infra S50 Sound Level Meter. Datasheet. 2023. Available online: https://www.sigicom.com/products/noise/infra-s50-sound-level-meter/ (accessed on 16 October 2023).
- Sigicom. Infra D10 Data Logger. Datasheet. 2023. Available online: https://www.sigicom.com/products/vibration/data-logger-infra-d10/ (accessed on 16 October 2023).
- R Core Team. R: A Language and Environment for Statistical Computing; R Foundation for Statistical Computing: Vienna, Austria, 2023; Available online: https://www.R-project.org/ (accessed on 16 October 2023).
- CRAN—The R Project’s Package Repository. missRanger: Fast Imputation of Missing Values. 2023. Available online: https://cran.r-project.org/web/packages/missRanger/index.html (accessed on 16 October 2023).
- Breiman, L. Random forests. Mach. Learn. 2001, 45, 5–32. [Google Scholar] [CrossRef]
- Wright, M.N.; Ziegler, A. Ranger: A fast implementation of random forests for high dimensional data in C++ and R. arXiv 2015, arXiv:1508.04409. [Google Scholar] [CrossRef]
- Danish EPA. Støjkortlægning og Støjhandlingsplaner (Noise Mapping and Action Plans). Vejledning fra Miljøstyrelsen, 4/2006. 2006. Available online: https://mst.dk/service/publikationer/publikationsarkiv/2006/aug/stoejkortlaegning-og-stoejhandlingsplaner/ (accessed on 16 October 2023).
- Jensen, S.S.; Plejdrup, M.S.; Hillig, K. GIS-Based National Road and Traffic Database 1960–2020; Technical Report #151; Danish Centre for Environment and Energy (DCE), Aarhus University: Aarhus, Denmark, 2019; p. 25. Available online: http://dce2.au.dk/pub/TR151.pdf (accessed on 16 October 2023).
- Nielsen, E.; Raaberg, J.; Bendtsen, H. Noise Reducing SMA Pavements—Mix Design for Silence Report # F2. 2006; Technical note #39; Danish Road Directorate: Copenhagen, Denmark, 2006; ISBN 87-9117787-1. Available online: https://www.vejdirektoratet.dk/api/drupal/sites/default/files/publications/noise_reducing_sma_pavements.pdf (accessed on 16 October 2023).
- Jonasson, H.G. Acoustic Source Modelling of Nordic Road Vehicles; Report #12; SP Technical Research Institute of Sweden: Borås, Sweden, 2006; Available online: https://www.ingentaconnect.com/contentone/dav/aaua/2007/00000093/00000002/art00002 (accessed on 16 October 2023).
- Kragh, J.; Jonasson, H.; Plovsing, B.; Sarinen, A. User’s Guide Nord2000 Road; Technical Report #AV1171/06; DELTA Acoustics: Hørsholm, Danmark, 2006; Available online: https://referencelaboratoriet.dk/wp-content/uploads/2006_av117106-Users-Guide-Nord2000-Road.pdf (accessed on 16 October 2023).
- Gulliver, J.; Morley, D.; Vienneau, D.; Fabbri, F.; Bell, M.; Goodman, P.; Fecht, D. Development of an open-source road traffic noise model for exposure assessment. Environ. Model. Softw. 2015, 74, 183–193. [Google Scholar] [CrossRef]
- Danish Road Directorate. Håndbog Nord2000 (The Nord2000 Handbook); Report #434-2013, in Danish with English Summary; Danish Road Directorate: Copenhagen, Denmark, 2013; Available online: https://www.vejdirektoratet.dk/sites/default/files/publications/nord2000_hndbog.pdf (accessed on 16 October 2023).
- Danish EPA. New Noise Mapping Order (In Danish “Ny Støjkortlægningsbekendtgørelse”, BEK # 2092 of 18/11/2021). 2021. Available online: https://mst.dk/service/nyheder/nyhedsarkiv/2021/nov/ny-stoejkortlaegningsbekendtgoerelse/ (accessed on 16 October 2023).
- FORCE Technology A/S. Kildedata til CNOSSOS (In English: “Source data for CNOSSOS”); Technical Note #TC-101635 prepared for the Danish EPA; FORCE Technology: Hørsholm, Denmark, 2021. [Google Scholar]
- FORCE Technology A/S. Kravspecifikation for EU-støjkortlægning, iht. Bilag 4 I Bekendtgørelse nr. 2092 af 18-11-2021 (In English: “Specification Requirements for EU Noise Map Prepation, Appendix 4 in the Executive Noise Mapping Order #2092 of 18-11-2021”); Technical Note #TC-101877 prepared for the Danish EPA; FORCE Technology: Hørsholm, Denmark, 2022. [Google Scholar]
- Ma, J.; Li, C.; Kwan, M.P.; Kou, L.; Chai, Y. Assessing personal noise exposure and its relationship with mental health in Beijing based on individuals’ space-time behavior. Environ. Int. 2020, 139, 105737. [Google Scholar] [CrossRef] [PubMed]
- European Environment Agency (EEA). Good Practice Guide on Noise Exposure and Potential Health Effects; EEA’s Technical Report #11/2010; European Environment Agency (EEA): Copenhagen, Denmark, 2010; Available online: https://www.eea.europa.eu/publications/good-practice-guide-on-noise/at_download/file (accessed on 16 October 2023).
- Brink, M.; Schäffer, B.; Pieren, R.; Wunderli, J.M. Conversion between noise exposure indicators Leq24h, LDay, LEvening, LNight, Ldn and Lden: Principles and practical guidance. Int. J. Hyg. Environ. Health 2018, 221, 54–63. [Google Scholar] [CrossRef] [PubMed]
- European Environment Agency. Lden. 2001. Available online: https://www.eea.europa.eu/help/glossary/eea-glossary/lden (accessed on 16 October 2023).
- World Health Organization. Compendium of WHO and Other UN Guidance on Health and Environment—2022 Update. 2022. Available online: https://cdn.who.int/media/docs/default-source/who-compendium-on-health-and-environment/who_compendium_noise_01042022.pdf?sfvrsn=bc371498_3 (accessed on 16 October 2023).
- Wang, J.; Mao, Y.; Li, J.; Xiong, Z.; Wang, W.X. Predictability of road traffic and congestion in urban areas. PLoS ONE 2015, 10, e0121825. [Google Scholar] [CrossRef]
- Ingård, U. A review of the influence of meteorological conditions on sound propagation. J. Acoust. Soc. Am. 1953, 25, 405–411. [Google Scholar] [CrossRef]
- Larsson, C.; Israelsson, S. Effects of meteorological conditions and source height on sound propagation near the ground. Appl. Acoust. 1991, 33, 109–121. [Google Scholar] [CrossRef]
- Trikootam, S.C.; Hornikx, M. The wind effect on sound propagation over urban areas: Experimental approach with an uncontrolled sound source. Build. Environ. 2019, 149, 561–570. [Google Scholar] [CrossRef]
- Gozalo, G.R.; Escobar, V.G. Uncertainty evaluation of road traffic noise models in two Ibero-American cities. Appl. Acoust. 2021, 180, 108134. [Google Scholar] [CrossRef]
- Bąkowski, A.; Radziszewski, L. Measurements of urban traffic parameters before and after road reconstruction. Open Eng. 2021, 11, 365–376. [Google Scholar] [CrossRef]
- Vergoed, T.; van Leeuwen, H.J.A. Evaluation and Validation of the CNOSSOS calculation method in The Netherlands. In Proceedings of the Euronoise 2018, Heraklion, Greece, 27–31 May 2018; Available online: https://www.euronoise2018.eu/docs/papers/209_Euronoise2018.pdf (accessed on 16 October 2023).
- Chang, T.Y.; Lin, H.C.; Yang, W.T.; Bao, B.Y.; Chan, C.C. A modified Nordic prediction model of road traffic noise in a Taiwanese city with significant motorcycle traffic. Sci. Total Environ. 2012, 432, 375–381. [Google Scholar] [CrossRef]

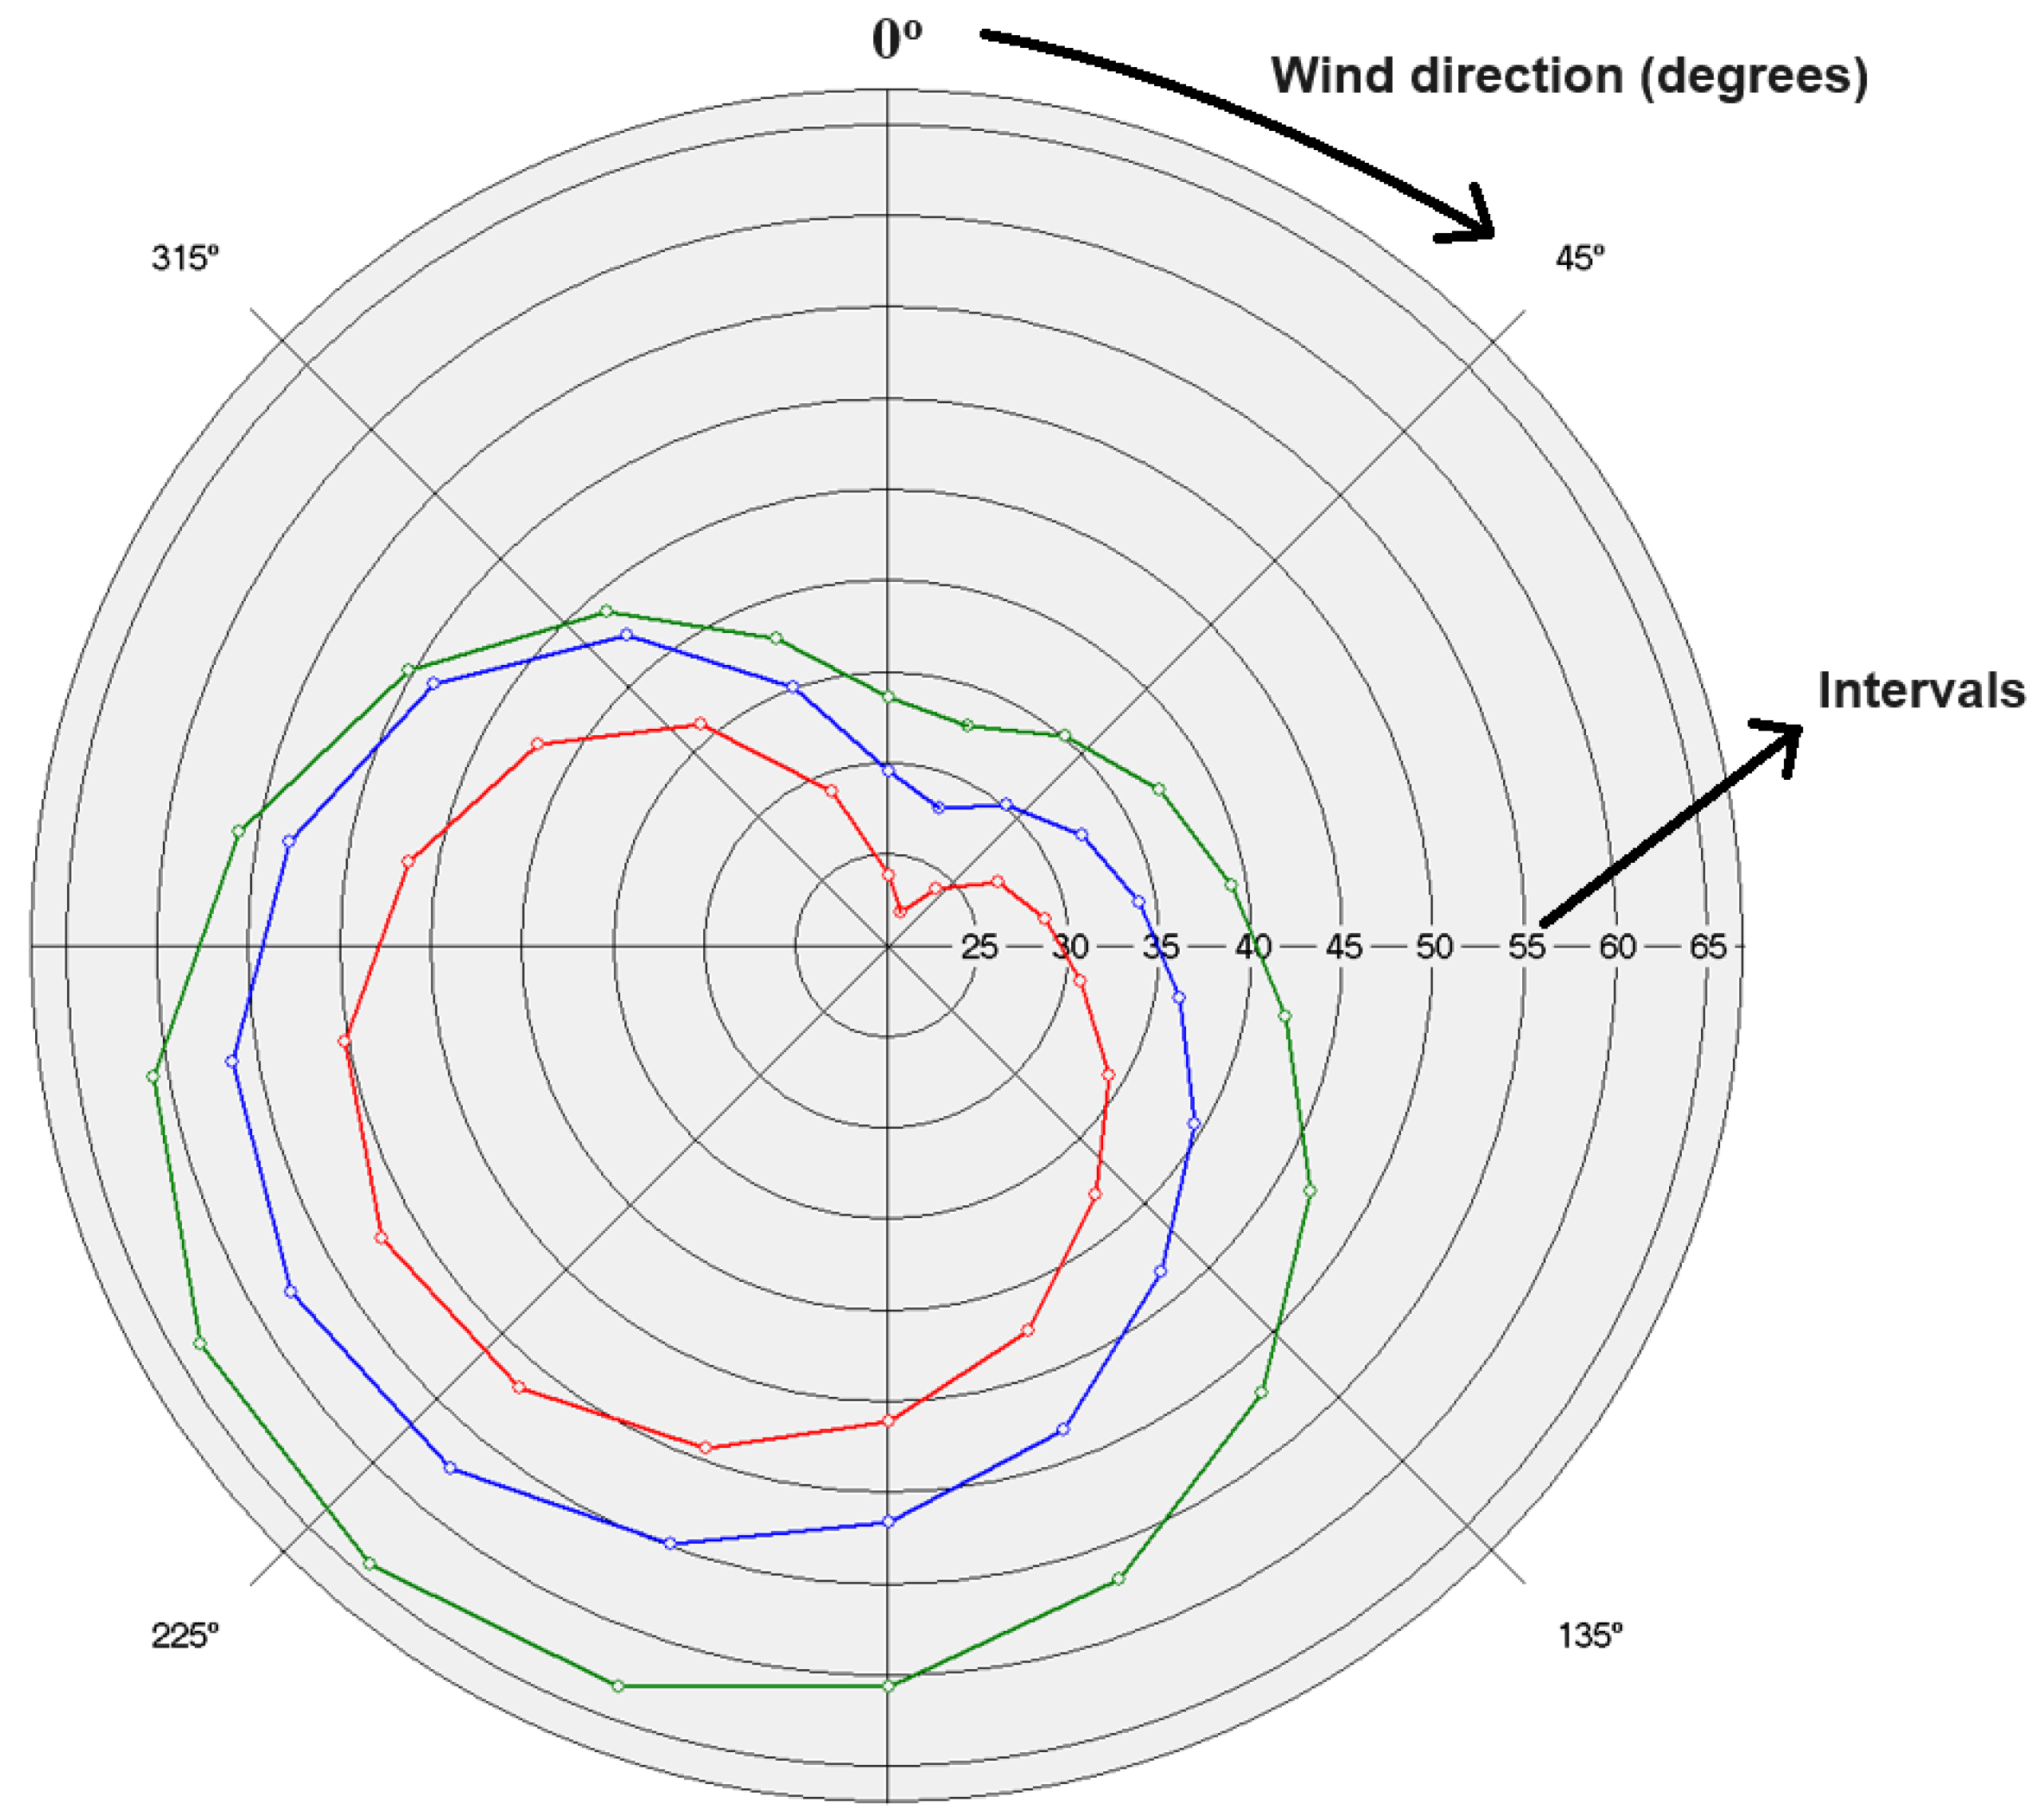
| Interval | Degrees | Day | Evening | Night |
|---|---|---|---|---|
| 1 | 20 | 22.0 | 28.1 | 32.9 |
| 2 | 40 | 24.1 | 30.1 | 35.1 |
| 3 | 60 | 27.0 | 32.3 | 37.2 |
| 4 | 80 | 28.7 | 34.0 | 39.1 |
| 5 | 100 | 30.7 | 36.2 | 42.1 |
| 6 | 120 | 34.0 | 39.4 | 46.7 |
| 7 | 140 | 37.7 | 43.3 | 51.9 |
| 8 | 160 | 42.4 | 48.2 | 56.9 |
| 9 | 180 | 46.0 | 51.5 | 60.6 |
| 10 | 200 | 49.2 | 54.8 | 63.2 |
| 11 | 220 | 51.5 | 57.3 | 64.2 |
| 12 | 240 | 52.0 | 57.8 | 63.5 |
| 13 | 260 | 50.2 | 56.5 | 60.9 |
| 14 | 280 | 46.7 | 53.3 | 56.1 |
| 15 | 300 | 42.2 | 48.8 | 50.3 |
| 16 | 320 | 35.9 | 42.3 | 44.0 |
| 17 | 340 | 29.1 | 35.1 | 38.0 |
| 18 | 360 | 23.9 | 29.6 | 33.7 |
| Min | Mean | Max | Var | SD | p25 | p50 | p75 | IQR | |
|---|---|---|---|---|---|---|---|---|---|
| Measuring location 1 (R1) | |||||||||
| LAeq24h | 69.5 | 73.6 | 75.5 | 3.7 | 1.9 | 73.1 | 74.7 | 75.1 | 2.0 |
| Lden | 72.1 | 77.4 | 79.4 | 4.5 | 2.2 | 72.1 | 78.5 | 79.1 | 2.4 |
| Measuring location 2 (R2) | |||||||||
| LAeq24h | 64.9 | 68.6 | 70.2 | 2.8 | 1.7 | 67.8 | 69.5 | 69.8 | 2.1 |
| Lden | 67.5 | 72.2 | 74.1 | 3.7 | 2.0 | 67.6 | 73.2 | 73.9 | 3.0 |
| Min | Mean | Med | Max | RS | R2 | RMSE | MAE | Var | SD | 95% CI | |
|---|---|---|---|---|---|---|---|---|---|---|---|
| Measuring location 1 (R1) | |||||||||||
| LAeq24h (dBA) | |||||||||||
| Nord2000 | 73.1 | 74.7 | 74.9 | 75.9 | 0.92 | 0.85 | 1.6 | 1.1 | 0.50 | 0.71 | [0.92, 0.97] |
| CNOSSOS | 69.5 | 70.1 | 71.0 | 72.0 | 0.90 | 0.82 | 2.8 | 2.5 | 0.40 | 0.63 | [0.84, 0.94] |
| RTN-96 | 70.6 | 72.2 | 72.3 | 73.1 | 0.86 | 0.75 | 2.3 | 2.1 | 0.41 | 0.64 | [0.79, 0.91] |
| Lden (dBA) | |||||||||||
| Nord2000 | 78.5 | 80.3 | 80.7 | 81.8 | 0.85 | 0.73 | 3.2 | 2.9 | 0.86 | 0.97 | [0.78, 0.91] |
| CNOSSOS | 74.5 | 76.6 | 76.9 | 77.9 | 0.79 | 0.62 | 1.7 | 1.6 | 0.91 | 0.96 | [0.70, 0.87] |
| RTN-96 | 75.1 | 77.2 | 77.5 | 78.5 | 0.82 | 0.67 | 1.5 | 1.3 | 0.77 | 0.88 | [0.73, 0.88] |
| Measuring location 2 (R2) | |||||||||||
| LAeq24h (dBA) | |||||||||||
| Nord2000 | 64.0 | 65.2 | 65.5 | 66.1 | 0.92 | 0.85 | 3.3 | 3.1 | 0.32 | 0.58 | [0.91, 0.97] |
| CNOSSOS | 64.7 | 66.0 | 66.2 | 67.2 | 0.92 | 0.85 | 2.7 | 2.4 | 0.41 | 0.63 | [0.92, 0.97] |
| RTN-96 | 62.8 | 64.1 | 64.3 | 65.0 | 0.91 | 0.82 | 4.2 | 4.0 | 0.35 | 0.58 | [0.92, 0.96] |
| Lden (dBA) | |||||||||||
| Nord2000 | 68.3 | 72.0 | 72.8 | 73.6 | 0.98 | 0.96 | 0.4 | 0.4 | 2.54 | 1.60 | [0.98, 0.99] |
| CNOSSOS | 69.8 | 71.4 | 71.7 | 72.7 | 0.82 | 0.68 | 1.5 | 1.4 | 0.78 | 0.89 | [0.80, 0.92] |
| RTN-96 | 67.3 | 68.8 | 69.0 | 70.0 | 0.88 | 0.77 | 3.7 | 3.5 | 0.55 | 0.74 | [0.88, 0.95] |
Disclaimer/Publisher’s Note: The statements, opinions and data contained in all publications are solely those of the individual author(s) and contributor(s) and not of MDPI and/or the editor(s). MDPI and/or the editor(s) disclaim responsibility for any injury to people or property resulting from any ideas, methods, instructions or products referred to in the content. |
© 2023 by the authors. Licensee MDPI, Basel, Switzerland. This article is an open access article distributed under the terms and conditions of the Creative Commons Attribution (CC BY) license (https://creativecommons.org/licenses/by/4.0/).
Share and Cite
Khan, J.; Thysell, E.; Backalarz, C.; Finne, P.; Hertel, O.; Jensen, S.S. Performance Evaluation of Nord2000, RTN-96 and CNOSSOS-EU against Noise Measurements in Central Jutland, Denmark. Acoustics 2023, 5, 1099-1122. https://doi.org/10.3390/acoustics5040062
Khan J, Thysell E, Backalarz C, Finne P, Hertel O, Jensen SS. Performance Evaluation of Nord2000, RTN-96 and CNOSSOS-EU against Noise Measurements in Central Jutland, Denmark. Acoustics. 2023; 5(4):1099-1122. https://doi.org/10.3390/acoustics5040062
Chicago/Turabian StyleKhan, Jibran, Erik Thysell, Claus Backalarz, Per Finne, Ole Hertel, and Steen Solvang Jensen. 2023. "Performance Evaluation of Nord2000, RTN-96 and CNOSSOS-EU against Noise Measurements in Central Jutland, Denmark" Acoustics 5, no. 4: 1099-1122. https://doi.org/10.3390/acoustics5040062