Article

Reducing Data Requirements for Simple and Effective Noise Mapping: A Case Study of Noise Mapping Using Computational Methods and GIS for the Raebareli City Intersection

1
Geoinformatics Lab, Department of Computer Science and Engineering, Rajiv Gandhi Institute of Petroleum Technology, Amethi 229304, India
2
Department of Computer Science and Engineering, United College of Engineering and Research, Prayagraj 211009, India
3
Department of Chemical Engineering, Rajiv Gandhi Institute of Petroleum Technology, Amethi 229304, India
*
Author to whom correspondence should be addressed.
These authors contributed equally to this work.
Acoustics 2023, 5(4), 1066-1098; https://doi.org/10.3390/acoustics5040061
Submission received: 14 March 2023 / Revised: 11 August 2023 / Accepted: 14 September 2023 / Published: 14 November 2023
(This article belongs to the Special Issue Vibration and Noise)

Abstract

:
The accurate prediction of noise levels at outdoor locations requires detailed data of the noise sources and terrain parameters and an efficient model for prediction. However, the possibility of predicting noise with reasonable accuracy using less input data is a challenge and needs to be studied scientifically. The qualities of the noise data, terrain parameters, and prediction model can impact the accuracy of the prediction significantly. This study primarily focuses on the dependency of noise data for efficient noise prediction and mapping. This research article proposes a detailed methodology to predict and map the noise and exposure levels in Ratapur, Uttar Pradesh, India, with various granularities of noise data inputs. The noise levels were measured at various places and at different times of the day at 10 min intervals. Different data input proportions and qualities were used for noise prediction, namely, (1) a large data-based method, (2) a small data-based method, (3) a source point average data-based method, (4) a Google navigation data-based method, and (5) accurate modelling using an ANN-based method, integrating accurate noise data with a sophisticated modelling algorithm for noise prediction. The analysis of the variation between the predicted and measured noise levels was conducted for all five of the methods using the ANOVA technique. Various methods based on less noise data methods predicted the noise levels with accuracies within the ±4–10 dB(A) range, while the ANN-based technique predicted it with an accuracy of ±0.5–2.5 dB(A). Interestingly, the estimation of the noise exposure levels (>85 dB(A)) and the identification of hazard zones around the studied road intersection could also be performed efficiently even when using the data-deficient models. This paper also showcased the possibility of predicting an accurate 3D map for an area by extracting vehicles and terrain features from satellite images without any direct recording of noise data. This paper thus demonstrated approaches to reduce the noise data dependency for noise prediction and mapping and to enable accurate noise-hazard zonation mapping.

1. Introduction

Noise is a general problem that has serious health implications associated with it [1]. The rapid growth in the amount of vehicular traffic combined with increased vehicular speeds has resulted in increased noise pollution in cities [2,3,4,5,6,7,8]. Road traffic noise levels above 65 dB(A) disturb nearly 50 million people in the European Union [9,10]. Noise travels through deflection, diffraction, and reflection. Noise values reaching a receiver’s position decrease significantly as the distance increases. Sound has three fundamental physical indices: (1) sound pressure: a sound wave’s steady shift in static pressure; (2) sound power: the pace of transferring acoustic energy from a vibrating source to a medium; (3) sound intensity: the average rate of sound energy transmission perpendicular to a given direction. The decibel (dB), which is one-tenth of a bel (B), is the first and most widely used scientific index for measuring sound. A decibel (dB) is a logarithmic measure used to express how loud something is concerning a reference level. Because humans interpret exponential magnitude increases linearly, doubling the sound intensity causes the perceived intensity to increase by approximately the same amount. As a result, decibels (dB) are useful for measuring sound levels. Because of their logarithmic structure, they can represent very large or very small ratios of sound pressure (or intensity or power) by an amount that humans can perceive [11].
Noise pollution is a critical concern for human habitation today, and its health impacts have drawn the attention of many urban planners. Noise exposure has been associated with a variety of auditory and non-auditory health impacts, such as cardiovascular illness, annoyance, sleep disturbance, and impaired cognitive function in children [12,13,14,15,16].
Noise propagation modeling can predict noise levels at different locations. Noise predictions need noise data, terrain data, and a noise prediction model. Noise data collected through noise sampling can be carried out at different time intervals for a long duration and short duration. Similarly, noise data can also be collected over many sampling points or by using a limited number of sampling points located close to important noise sources. There are research studies where the impacts of variations in noise monitoring durations for noise modeling were studied. M.S. Alam et al., 2021 [17] conducted a study to evaluate the spatial variation in the average noise level, Lden (Lequivalent day–evening–night level), in Dublin City and to look into the effects of the temporal aspect of the data on the noise predictions. In this study, the Lden was considered as the predominant ambient noise level at the location of monitoring. The Lden was typically utilized as a measure of the ambient noise level or as an indicator for the overall level of annoyance in the area. The Lden was estimated over a year. Ldens have also been determined on an hourly, daily, and monthly basis to model temporal fluctuations in predictions. In the above study, the authors created several land use regression (LUR) noise prediction models [18] using hourly, daily, and monthly time frames of noise prediction. To determine the best working model, the models were created in a series, using the lowest to the highest resolutions of noise data.
In this research, the authors also used an artificial intelligence (AI)-based artificial neural network (ANN) method to accurately predict the noise value for the entire study area using the source noise dB value, terrain information, and environmental data as the input variables [19].
R. Anthony Alani et al., 2020 [20] studied the spatial variation in noise levels within a portion of the Festac residential area in Lagos. The information used in their study was gathered through a field investigation. Data on the noise level measurements were collected over three weeks at six stations (S1 to S6) using a digital sound pressure level meter. The location was chosen based on various criteria like the proximity to the roadside, land use, and population density. The data collection was conducted at three different times, from 7:00 to 8:30 in the morning, from 12:00 to 2:00 in the afternoon, and from 7:00 to 8:30 in the evening, respectively, for 10 min in each sample [21,22,23]. A questionnaire-based study was conducted at the six locations with over two-hundred responders. These questions were similar to those found in the works of Okokon et al., 2018 [24], Paiva et al., 2019 [25], and WHO 2018. Analysis of variance (ANOVA) statistics and the Kriging geostatistical interpolation method were used to analyze the measured noise levels. According to the findings, the noise levels ranged from 53.50 to 81.6 dB(A) in the morning, from 55.00 to 94.00 dB(A) in the evening, and from 55.30 to 92.00 dB(A) in the afternoon. Results showed that the authors did not select the stations in the correct strategic form to maintain the proper distance between each station to obtain the best noise prediction value rather than a random selection which affected the accuracy of noise prediction and is observed in the noise map. The area away from the noise source had a similar value to the area of the noise source [26,27,28]. When predicting traffic noise with a limited number of station points, it is critical to choose the station points strategically for the best noise prediction. This study failed to predict the best noise value using a limited number of station points, so the current authors obtained evidence that the selection of station points is important for the best noise prediction using a limited number of station points [29,30].
Based on this literature review, the authors found that there are less attempts at noise prediction using noise data variation. The variation in noise levels are related with the factors of (i) time, (ii) location, and (iii) types of noise sources. The prediction of noise levels needs consideration of the above variables. Understanding the above factors, the authors have determined the following objectives for the research.

Objectives of the Research

Noise mapping, which involves using variable noise inputs, necessitates selecting a site characterized by varying traffic flow and obstructions that affect noise levels. The researchers chose a site located around the Raebareli City Intersection in India, a significant traffic hub.
The study required the development of a methodology for collecting noise and terrain data, as well as the adoption of a prediction model for estimating noise levels. Various methods were employed to derive noise data with different levels of granularity. These noise data, varying in density and quality, were then integrated with terrain data from the Raebareli intersection for prediction using a standard prediction model.
The approach had to be adapted to enable predictions and facilitate result comparisons. In summary, the study aimed to predict noise levels conveniently using computational methods and Geographic Information Systems (GIS). By reducing the quantity of noise data used in the modeling, the researchers aimed to assess the effectiveness of prediction and noise mapping. The study primarily focused on the following aspects:
(a)
Determining the noise prediction value using large data sets.
(b)
Determining the noise prediction value with a small number of data points and comparing the results to those from many data points to determine the deviation.
(c)
Determining the noise prediction value using the same source point average value and comparing the results with many noise prediction methods to find the deviation.
(d)
Determining the noise prediction value using Google Navigation data methods and comparing the results with large data noise prediction methods to find the deviation.
(e)
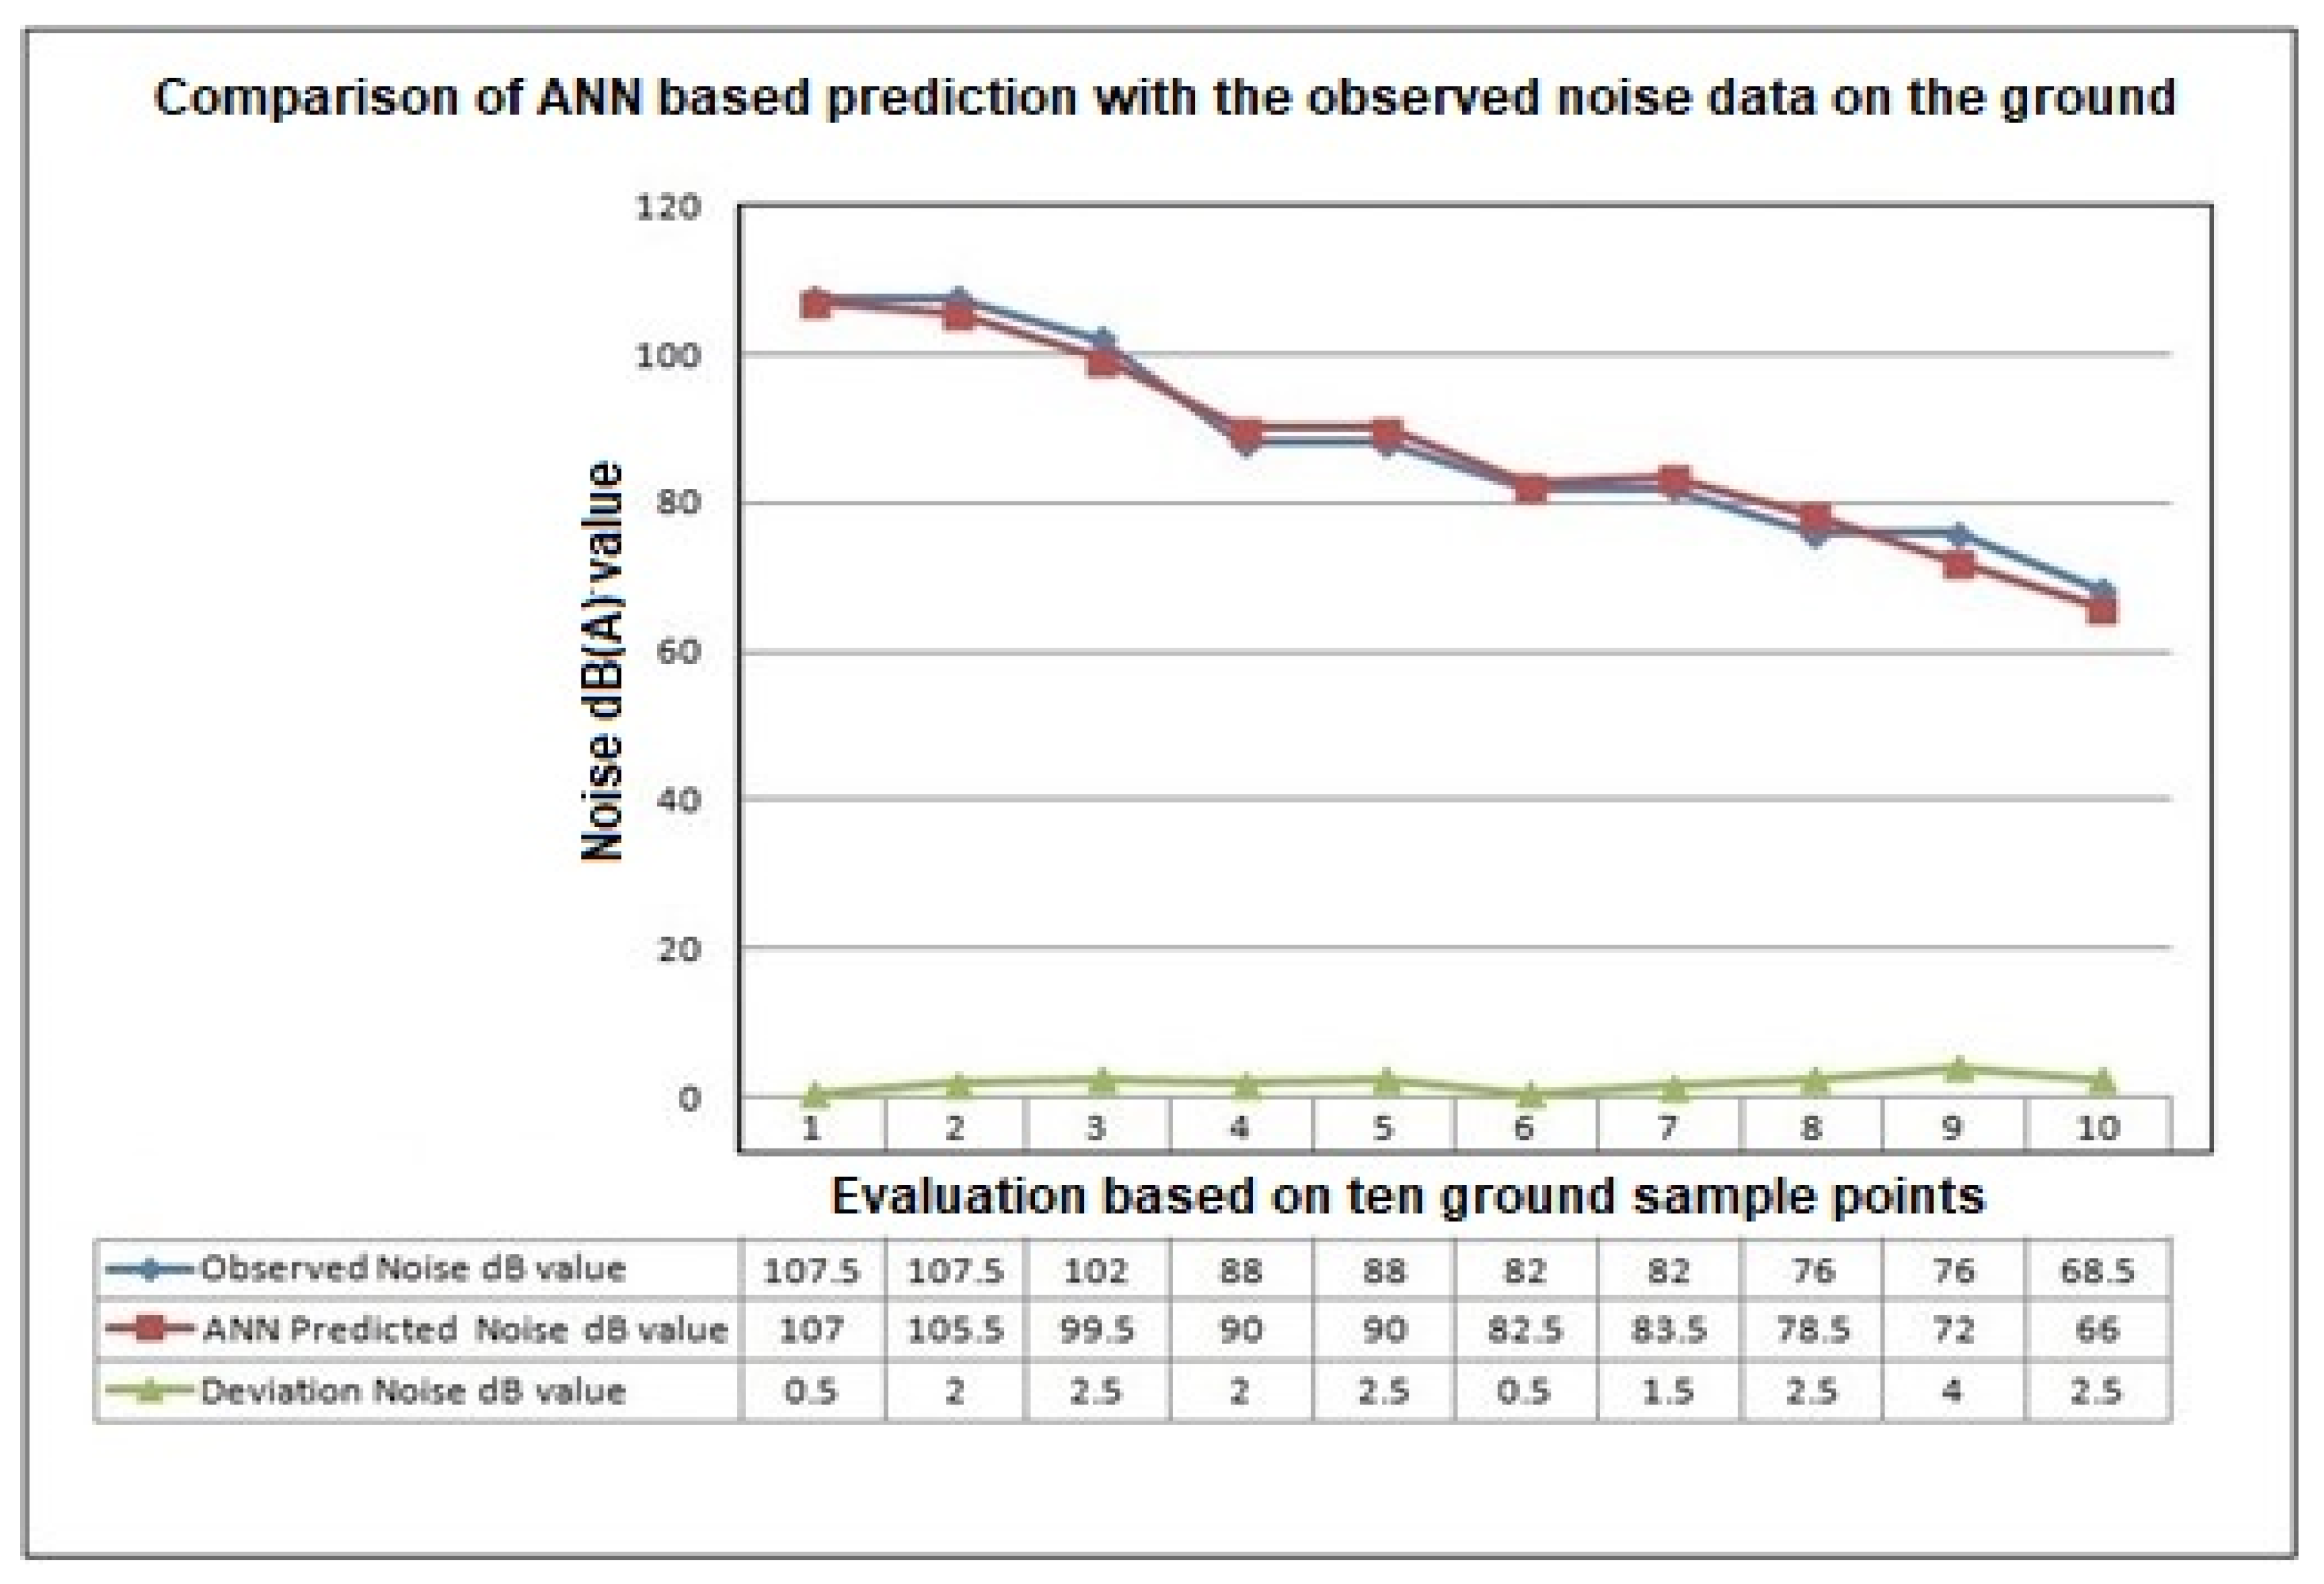
Determining the accurate noise prediction value using the ANN (artificial neural network) method and comparing the results with all other methods to find the deviation. ANN results are also compared to the observed value to check the accuracy of the method.
(f)
Determining the noise prediction value using an automated method based on the machine learning approach and freely available Google data.
(g)
Determining the noise exposure value for the study area for a 12-h exposure to noise for the people living in this vicinity.

2. Materials and Methods

2.1. Study Area

The study area covers an area of 301 m in length and 179 m in width, situated within the Rae Bareli district of Uttar Pradesh. It is located at a central geographical position with a latitude of 26.2427° N and a longitude of 81.2429° E (see Figure 1). This area is significant because it is where the Lucknow–Allahabad highway intersects with the Jagdishpur–Raebareli city road, making it a high-traffic zone accommodating various types of vehicles.
Furthermore, the region encompasses Ratapur Market, which is a diverse linear urban settlement featuring market areas, residential zones, educational institutions such as schools and colleges, as well as healthcare facilities like hospitals. The area is also home to a substantial number of roadside shops and huts. The selection of this site for the study was motivated by the need to investigate the impact of traffic noise on the local residents.

2.2. Data Collection and Processing

2.2.1. High-Grade Sound Pressure Level Meter

Acoustic measurements involved the quantitative measurements of sound pressure levels at important locations. The authors used the CESVA SC-310, a Class 1 Sound Pressure level meter, for their study. The equipment was set to record sound levels, frequencies, etc., at specific times. Before collecting the data, the authors calibrated the sound pressure level meter to ensure accurate measurement of sound levels with frequencies. The instrument was placed at strategic locations (close to noise sources and to noise receiving locations), fixed at a height of 1.5 m and 1.5 m away from the road edge. The authors ensured that the microphones were directed towards the source points. Data were collected at various locations throughout the study intervals in weeks, from Monday to Saturday for a duration of 10 min SPL noise values. The noise data were collected at three different time intervals: morning (9:00 to 11:00 a.m.), afternoon (1:00 to 3:00 p.m.), and evening (4:00 to 6:00 p.m.) for different average grades of noise levels (low-moderate-high) Table A1 in Appendix A. The detailed data schedule is available in Table A2 in Appendix A. Generally, the data were collected within a temperature range of 38° to 40° Celsius and a wind speed of 9 KPH. However, the above atmospheric conditions did not impact significantly on noise level computation.

2.2.2. Total Station and GPS

The total station was used for collecting ground coordinates of selected locations in the local coordinate system, and it was fixed with a tripod at 1.5 m from the source and at a height of 1.5 m. Trimble Juno handheld GPS (Global Positioning System) was used for collecting coordinates in the Global coordinate system. Total Station and GPS were used to determine the geographic locations of noise source points (road points) and away points (noise receiving points). The location information was used for generating a noise map as well as testing the noise prediction.

2.2.3. Mapping Software

The authors employed GIS simulation software to predict sound pressure levels in their study. They utilized their knowledge of sound propagation modeling, referring to ISO 9613-2 for all their predictions. The authors used their in-house sound propagation simulation models to predict noise levels at different levels of granularity in the data. The in-house noise model, based on MATLAB, was extensively tested by the authors in various other studies conducted at IIT Kanpur and RGIPT Jais. The model incorporates various attenuation models from ISO 9613-2. The hardware and software used are summarized in Table 1.
MATLAB’s neural network tool—the “ANN tool”—and others were also used for accurate training of the model and prediction of noise levels [29].
For the automated noise dB value calculation based on traffic load, a machine learning approach was used, developed in MATLAB.

3. Methodology

It was planned to collect the noise data from Raebareli road intersections medium, low, and high traffic volumes in three separate time slots: 9 to 11 a.m., 1 to 3 p.m., and 4 to 6 p.m., over the course of multiple days spanning a month. Noise measurements were taken both near the road and at more distant points (referred to as noise receiving points). Some of the distant points were later used to test the accuracy of the predictions.
Ground data for roads, houses, and trees were obtained from Google Earth images to create a GIS (Geographical Information System) map of the Raebareli intersection. The authors employed their in-house sound propagation simulation models to predict noise levels at various levels of data granularity, drawing from their knowledge of sound propagation modeling as detailed in ISO 9613-2.
The in-house noise model, based on MATLAB, underwent extensive testing in various studies conducted by the authors at IIT Kanpur and RGIPT Jais. The model incorporates various attenuation models, such as those for distance, ground, atmosphere, barriers, and reflectors. The predicted results were visualized in a GIS environment to generate noise maps, with data of different granularities integrated into the models to improve accuracy.
In addition to simulation-based methods, the authors also employed ANN (artificial neural network) methods to predict noise values using the same dataset. A machine learning method was also used to automatically calculate noise dB values from Google image data for noise prediction.
Noise exposure measurements were conducted using a high-grade sound pressure level meter in SPL mode, measuring equivalent continuous sound pressure levels in A-weighted decibels on a logarithmic scale (Leq dB(A)). Before taking measurements, the internal sound level was calibrated to adjust the device. Data were collected along the road corridor, at intersections, in market areas, and at distant locations. LA (A-weighted sound pressure level) measurements were taken at 10-min intervals for each sample location during morning (9:00 to 11:00 a.m.), afternoon (1:00 to 3:00 p.m.), and evening (4:00 to 6:00 p.m.) sessions.
The research included predictions of noise pollution levels in over 60 different locations within Ratapur Raebareli. A-weighted equivalent sound pressure level Leq (dB(A)) and noise exposure levels were calculated based on these predictions. Five different methods, each accounting for data variation, were applied in this research, as illustrated in Figure 2.

3.1. Large Data-Based Noise Prediction Method (LDBM)

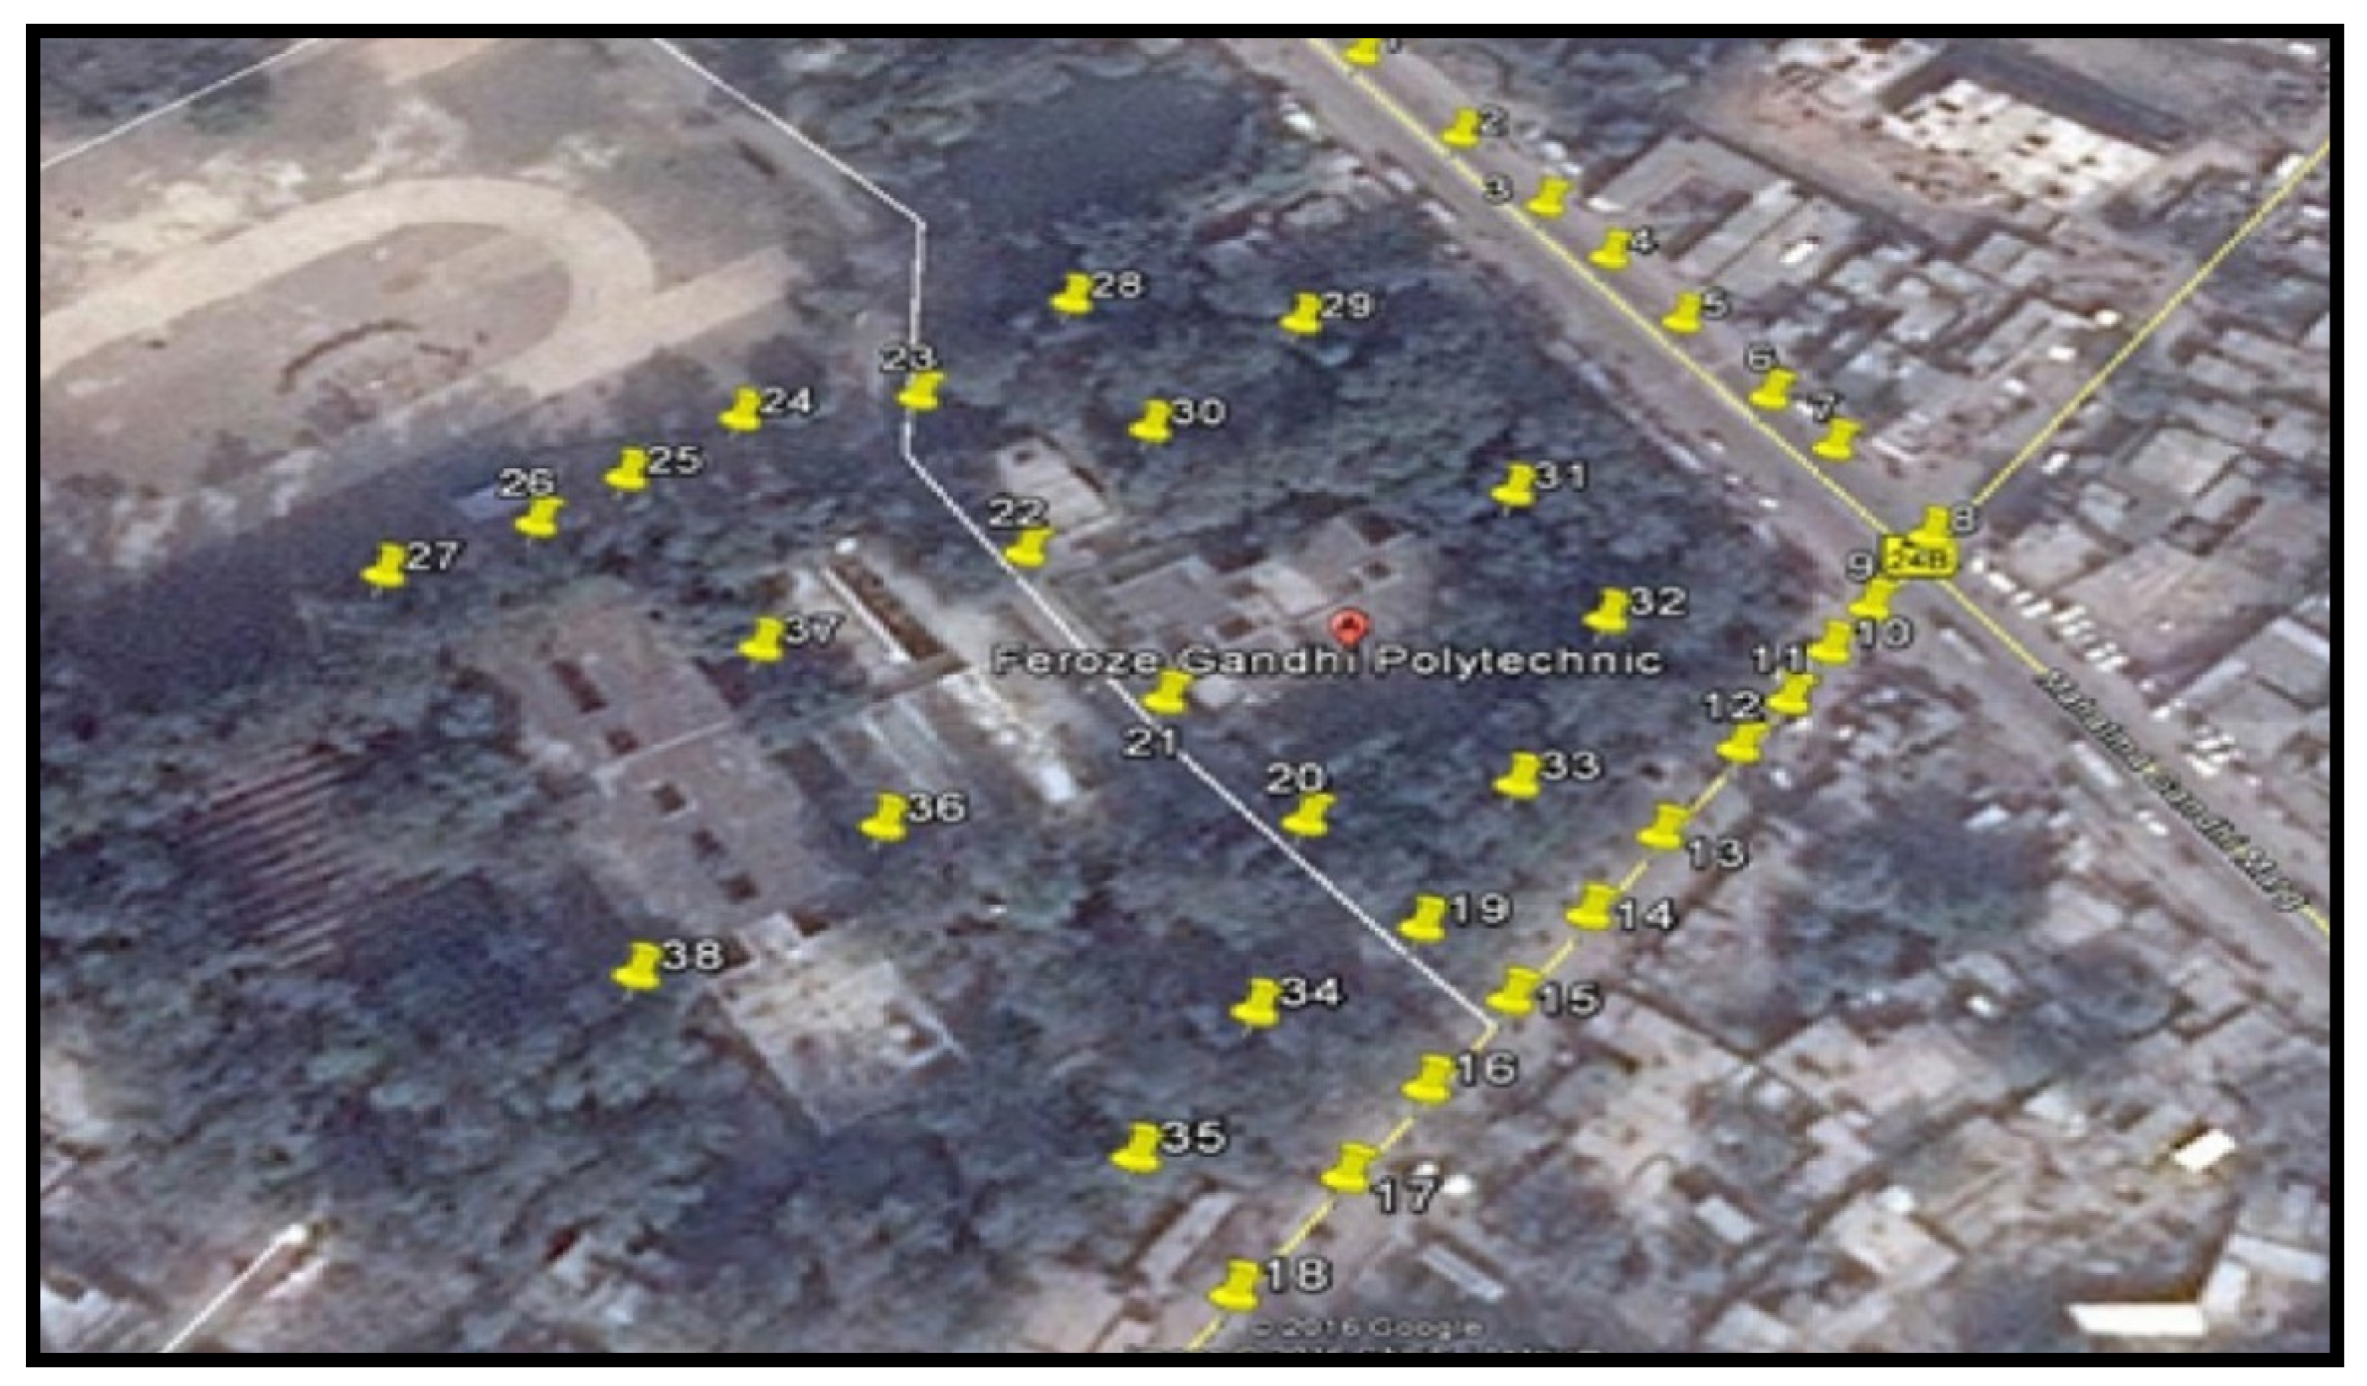
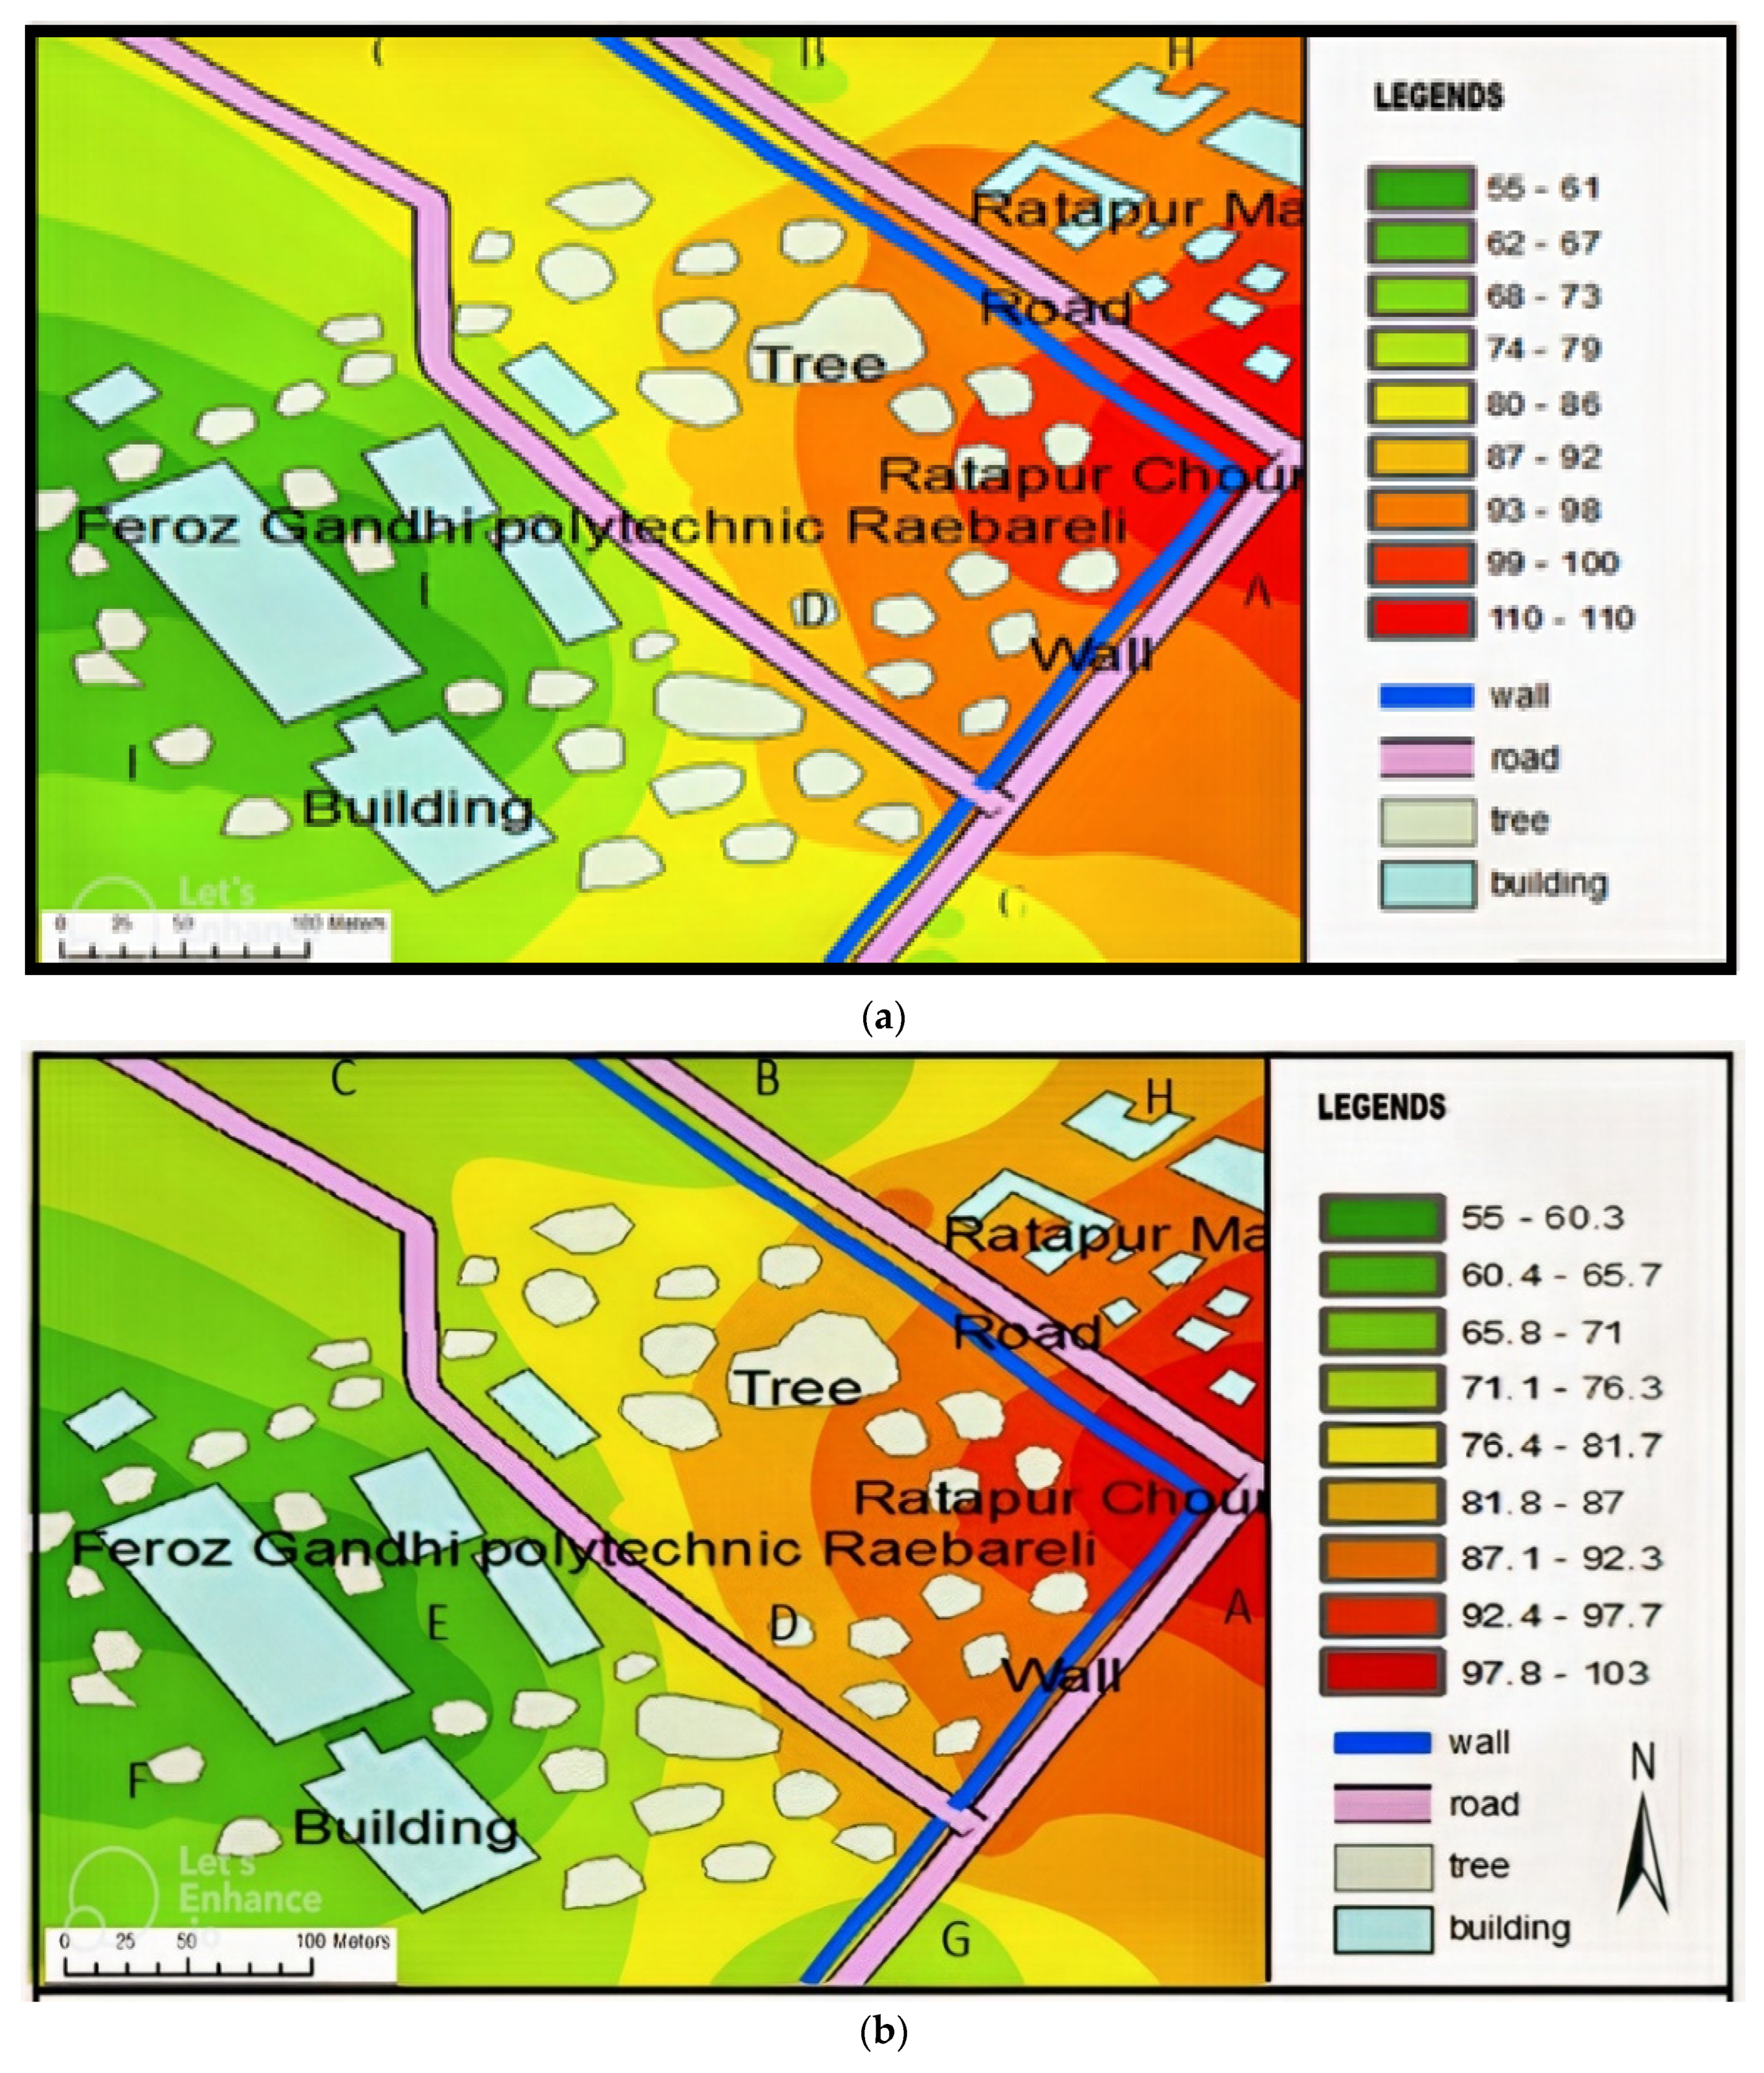
  • In this study, a noise map was developed using GIS for selected noisy areas around Ratapur Chauraha in Raebareli. Noise data were collected from 60 points, consisting of 40 points along roads and 20 points away from roads, considered as a large dataset (LD). Predictions were also made for three different time intervals based on traffic load: high, medium, and low traffic load [31]. Researchers deemed these data points sufficient for reasonably accurate predictions. Equivalent noise levels were determined for each point and integrated spatially in GIS using IDW interpolation to determine noise levels at various locations. All the data were collected over a period of 6 months, and noise levels were monitored daily in a cyclic manner from Monday to Saturday. Each day, data were collected at 10 different points, varying in traffic loads. Locations were marked with a permanent marker to ensure accurate identification and data collection of noise levels.
  • A total of 40 data points were within the road corridor 1.5 m away from the noise source point on the road.
  • Out of 40 points, 25 points were taken at Lucknow–Allahabad highway and 15 points were taken as Ratapur–Raebareli city road.
  • All points were at equal distance maintaining a gap of 12 m from each other.
  • The total road length for the Lucknow–Allahabad highway was 301 m whereas at Ratapur–Raebareli city road, it was 179 m.
  • Noise data were collected at three different levels: high traffic and noise levels (H), moderate traffic and noise levels (M), and low traffic and noise levels (L).

3.2. Small Data-Based Noise Prediction Method (SDBM)

  • In this method, the number of noise monitoring points was reduced from 60 locations to 30 locations, considered as small data (SD). The methodology was implemented to evenly distribute data points around Ratapur Chauraha in Raebareli City. The reduced noise data points were input into GIS to generate an equivalent noise level map using interpolation. The study aimed to demonstrate the impact of using a smaller dataset for noise prediction (NP) compared to a larger dataset employed in another scheme for the same region. Maintaining uniform spacing between data points is a time-consuming task, involving extensive physical and mental calculations [32]. Predictions were also made for three different time intervals at each location, followed by GIS-based mapping. The authors utilized the GIS model IDW (inverse distance weighting) interpolation to predict noise values and create noise level maps (MNL). Out of 30 points, 20 points were taken as road points (noise source points) while 10 points were away points (noise receiving points).
  • Out of these 20 points, 12 points were taken at Allahabad–Lucknow highway and 8 points were taken at Ratapur city road.
  • All points were at an equal distance of 24 m from each other.
  • The same method is also applied as a large data prediction method for data collection.

3.3. Source Point Averaging (Using One Source Noise Level Data) Based Method of Noise Prediction (SPANV)

In this method, noise mapping relies on averaging noise values from source points, where all data points along the road contribute to a single dB(A) value. To predict noise levels in Raebareli, a total of 20 locations along the road were strategically selected as data source points, while 3 locations were designated as points away from the road. The noise dB value average method was applied to all 20 source points. This technique estimates the noise dB value for the entire study area based on a single, uniform noise value. While this method simplifies the task, precision remains a concern because a single strategic source point value is used to predict noise dB values for the entire area, even though conditions at each location may change over time. These values were then distributed across the entire road corridor at three different time intervals with varying traffic loads: high, medium, and low noise values (H, M, and L) were determined based on the strategically selected 20 road source points and 3 away points, which contributed background noise values for GIS noise mapping.
  • All points were distributed at equal distances of 24-m spatial intervals.
  • A total of 12 points were taken on Lucknow–Allahabad Highway and 8 points were taken at Raebareli city road.

3.4. Google Navigation Data Method for Noise Prediction (GNBM)

Noise data for 20 points along the road corridor were indirectly obtained using Google Navigation-based traffic congestion color codes. This method proved cost-effective, as it eliminated the need for expensive sound pressure level meters for noise monitoring. The data can be easily predicted using pre-existing information that can be calibrated for noise mapping. This technique is valuable for predicting noise dB values in specific areas, especially for individuals who may not be experts in this field but have an interest in understanding the predicted noise levels near their homes or localities. It contributes to improving public perception and supports government efforts to reduce noise pollution.
The color code in Google Navigation is directly related to traffic congestion and noise dB values. For high, medium, and low traffic noise conditions, Google Navigation data represent noise dB values through colors, such as red, orange, green, or blue, as shown in Table 2. The Google color code in Figure 3 was calibrated to correspond to noise dB levels using accurately monitored noise data collected over a month at ten different locations along the road, using a sound pressure level meter. This calibrated navigation color code is applicable across India.
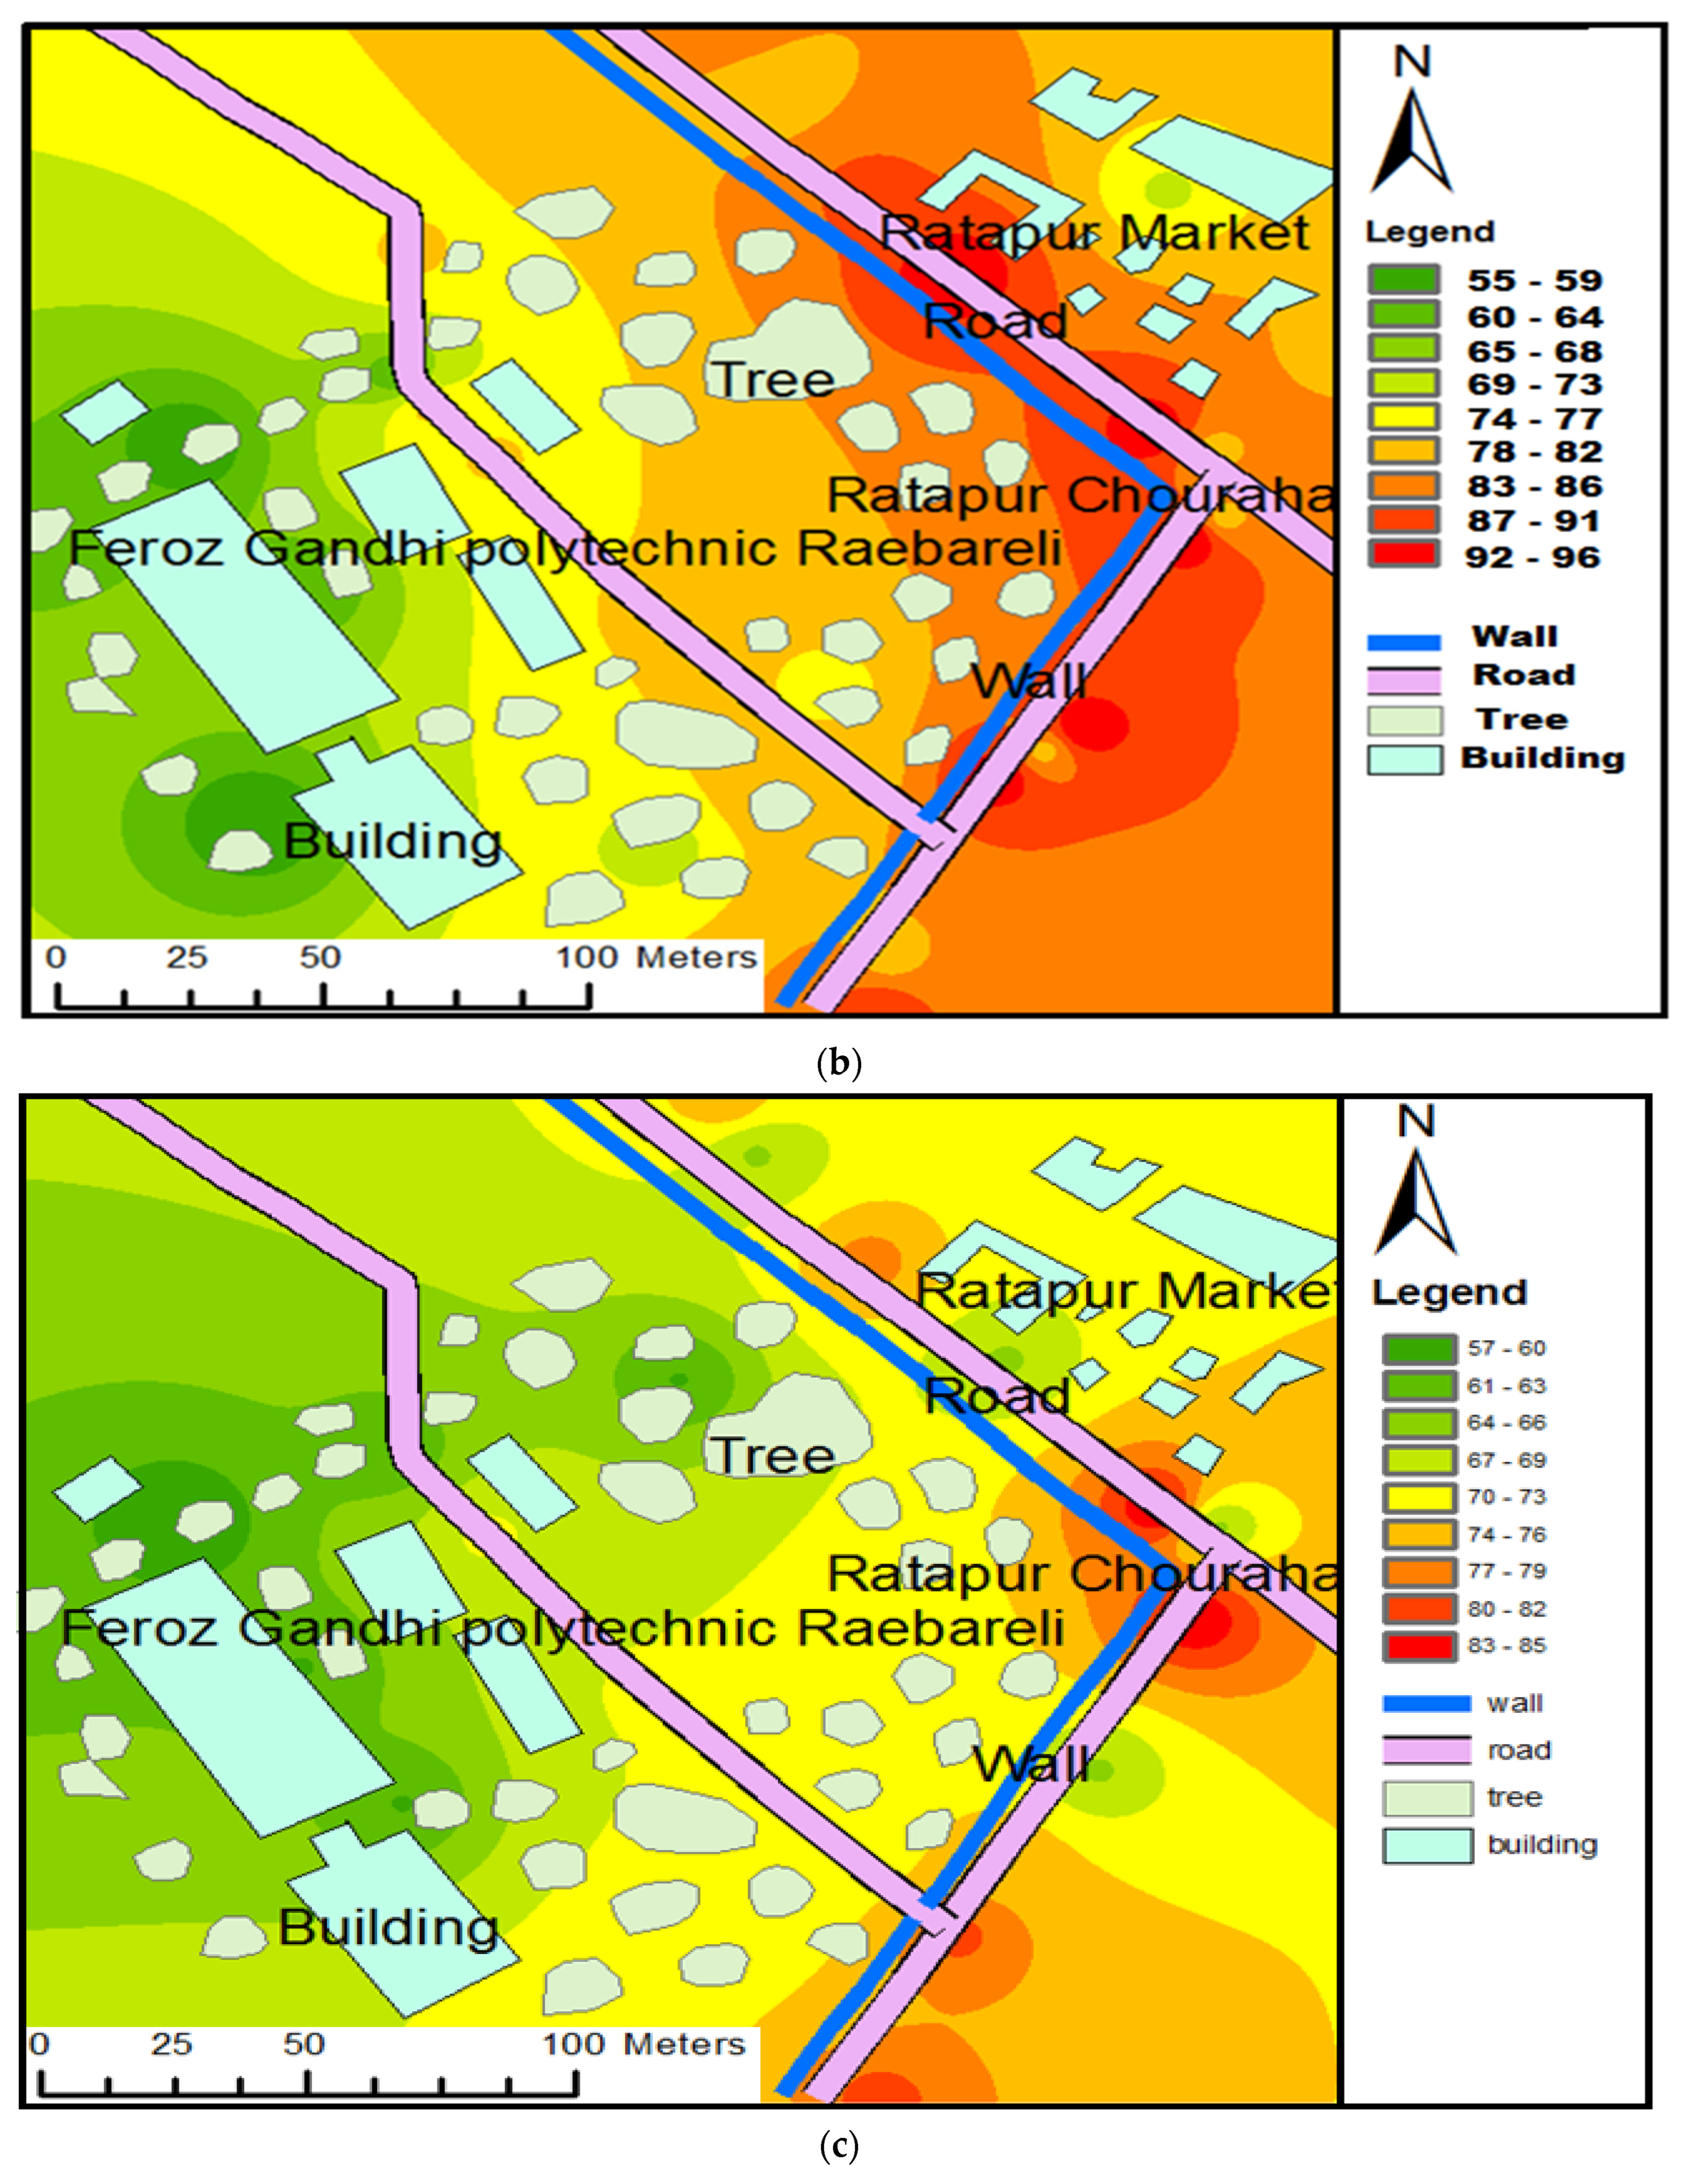
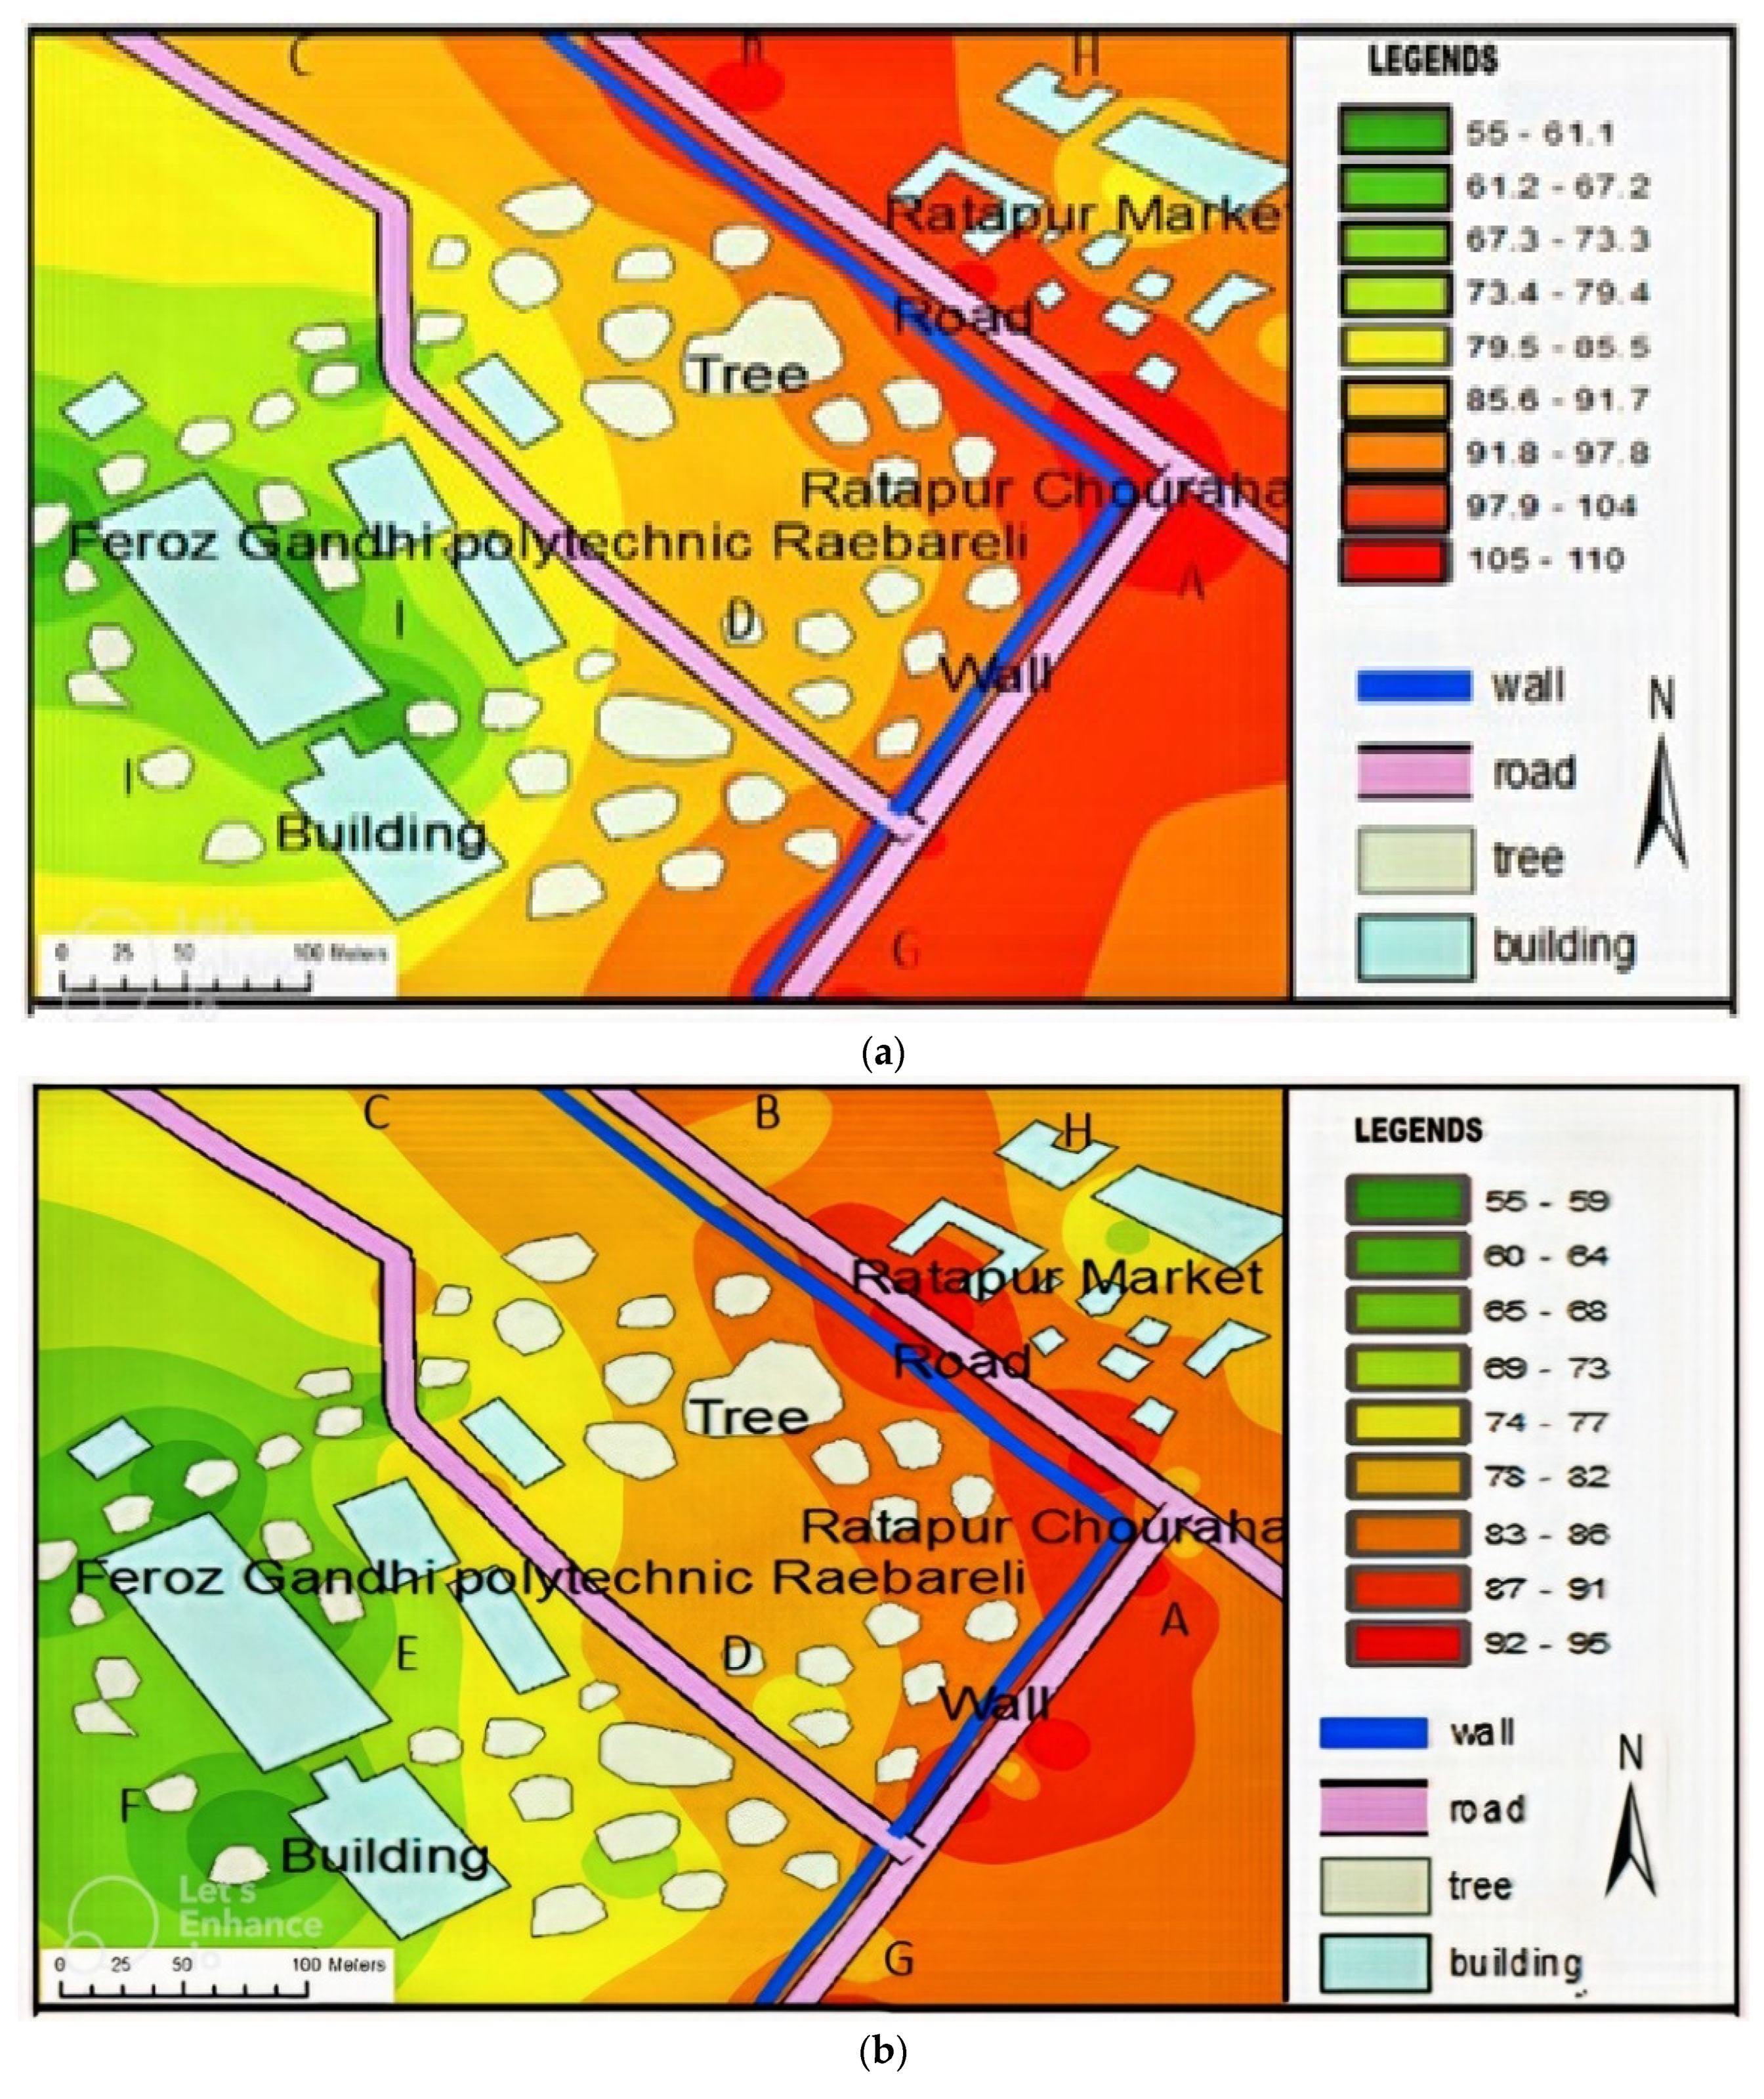
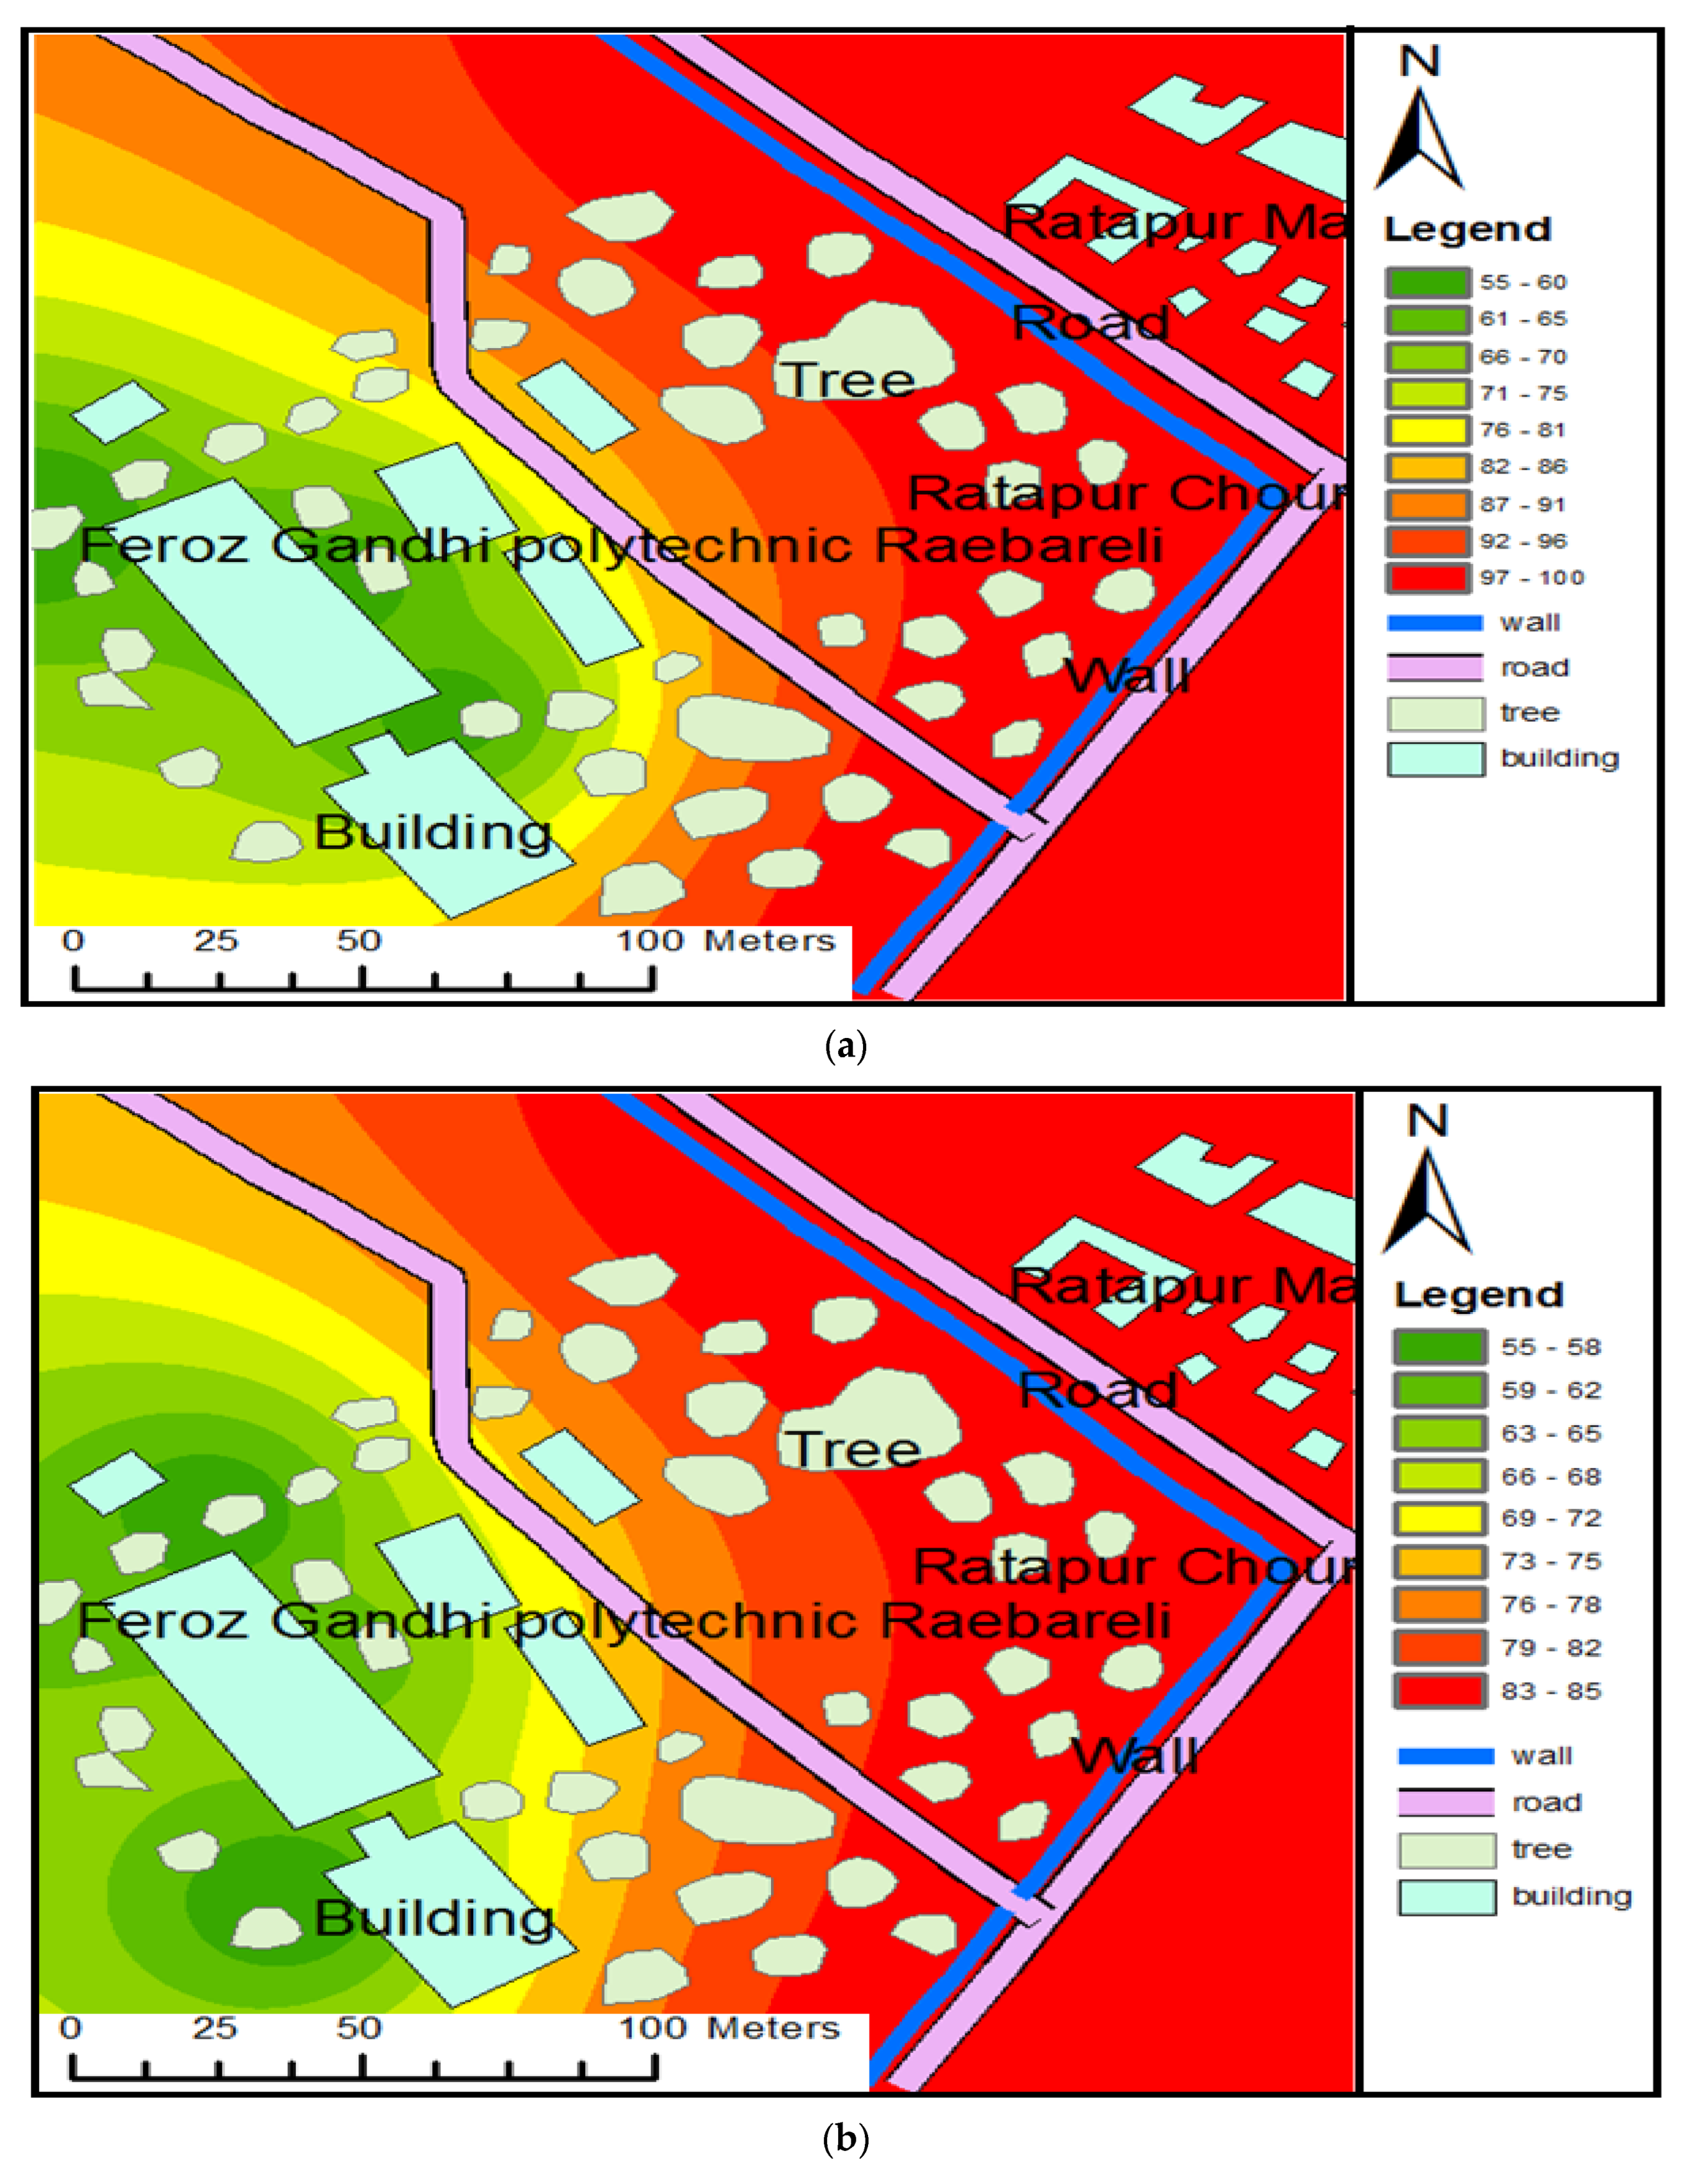
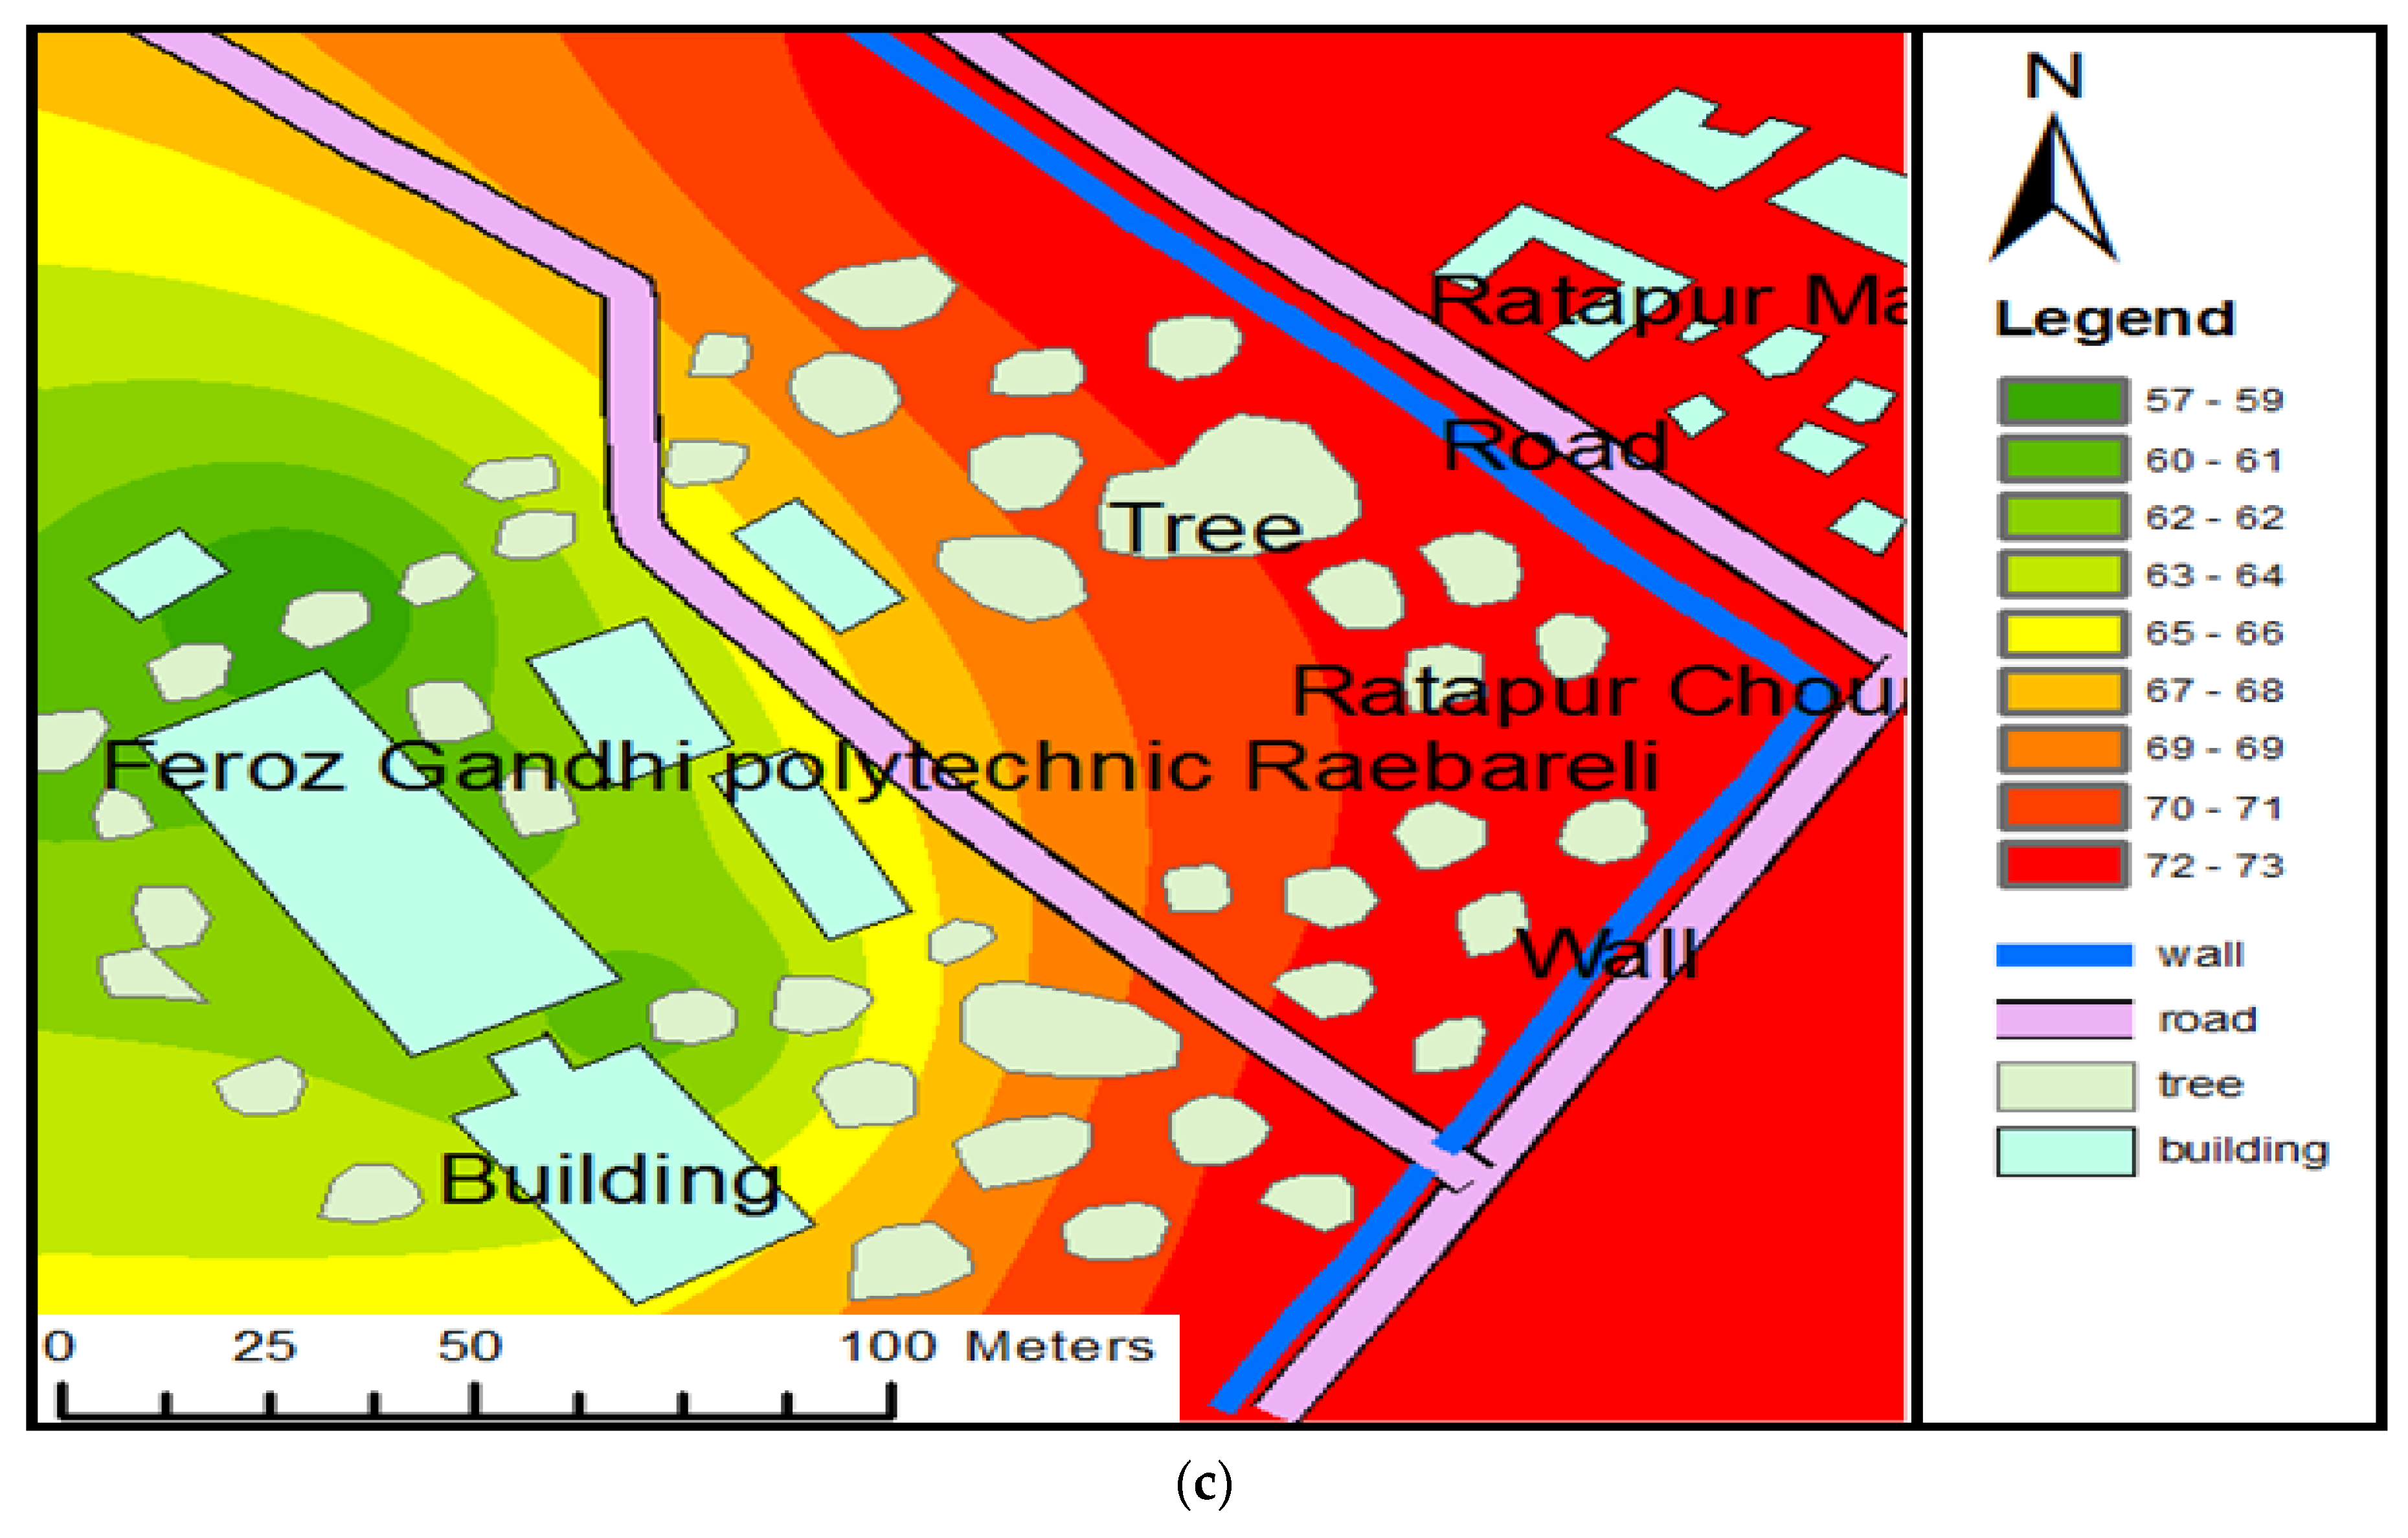
  • Google Navigation color codes provide different dB values for noise based on the calibrated value in Table 2. For red, it gives 96–110 dB, orange, 81–95 dB, and green or blue, 65–79 dB, at the summation of different time intervals with a varying range of 7 dB from its average value. For the traffic noise prediction of the entire study area, the authors considered a low range of dB for (1–3 p.m.) where traffic load is minimal, an average dB value for medium traffic load (9–11 a.m.), and a high dB value for maximum traffic load (4–6 p.m.).
  • Out of 23 points, 20 points were road or source points, and 3 points were away, or noise receiver points (background noise) used for GIS mapping.

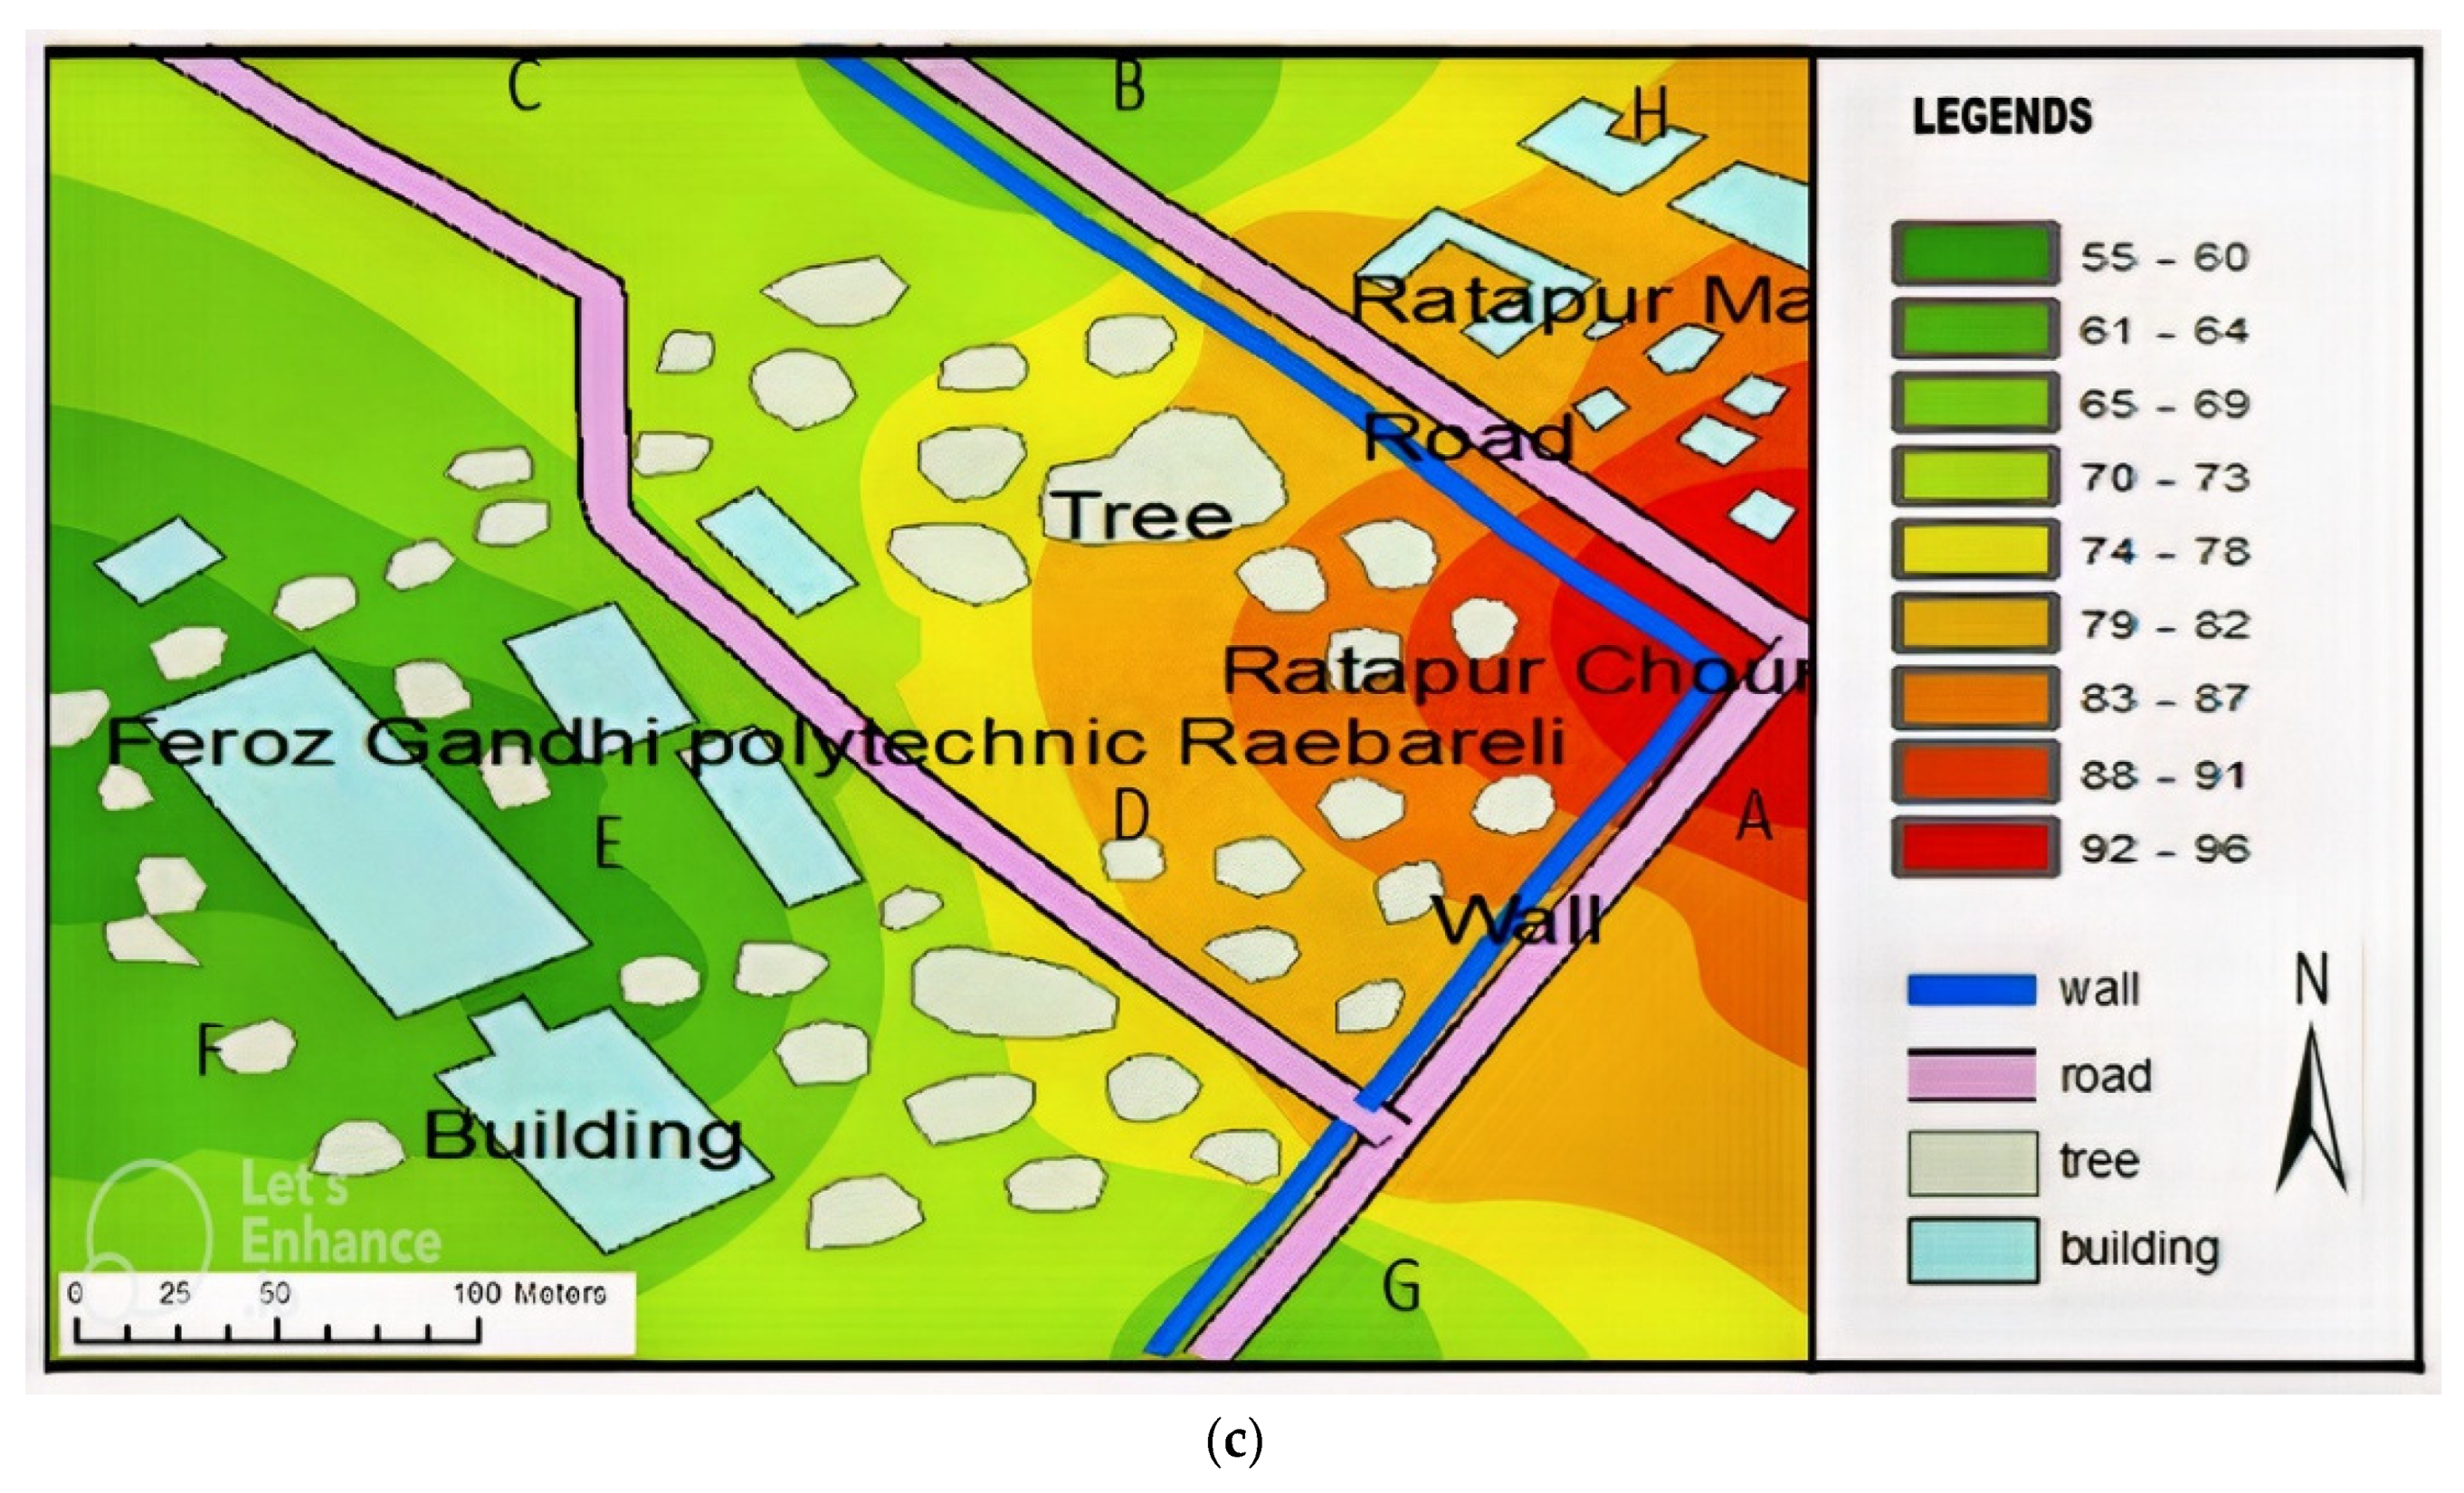
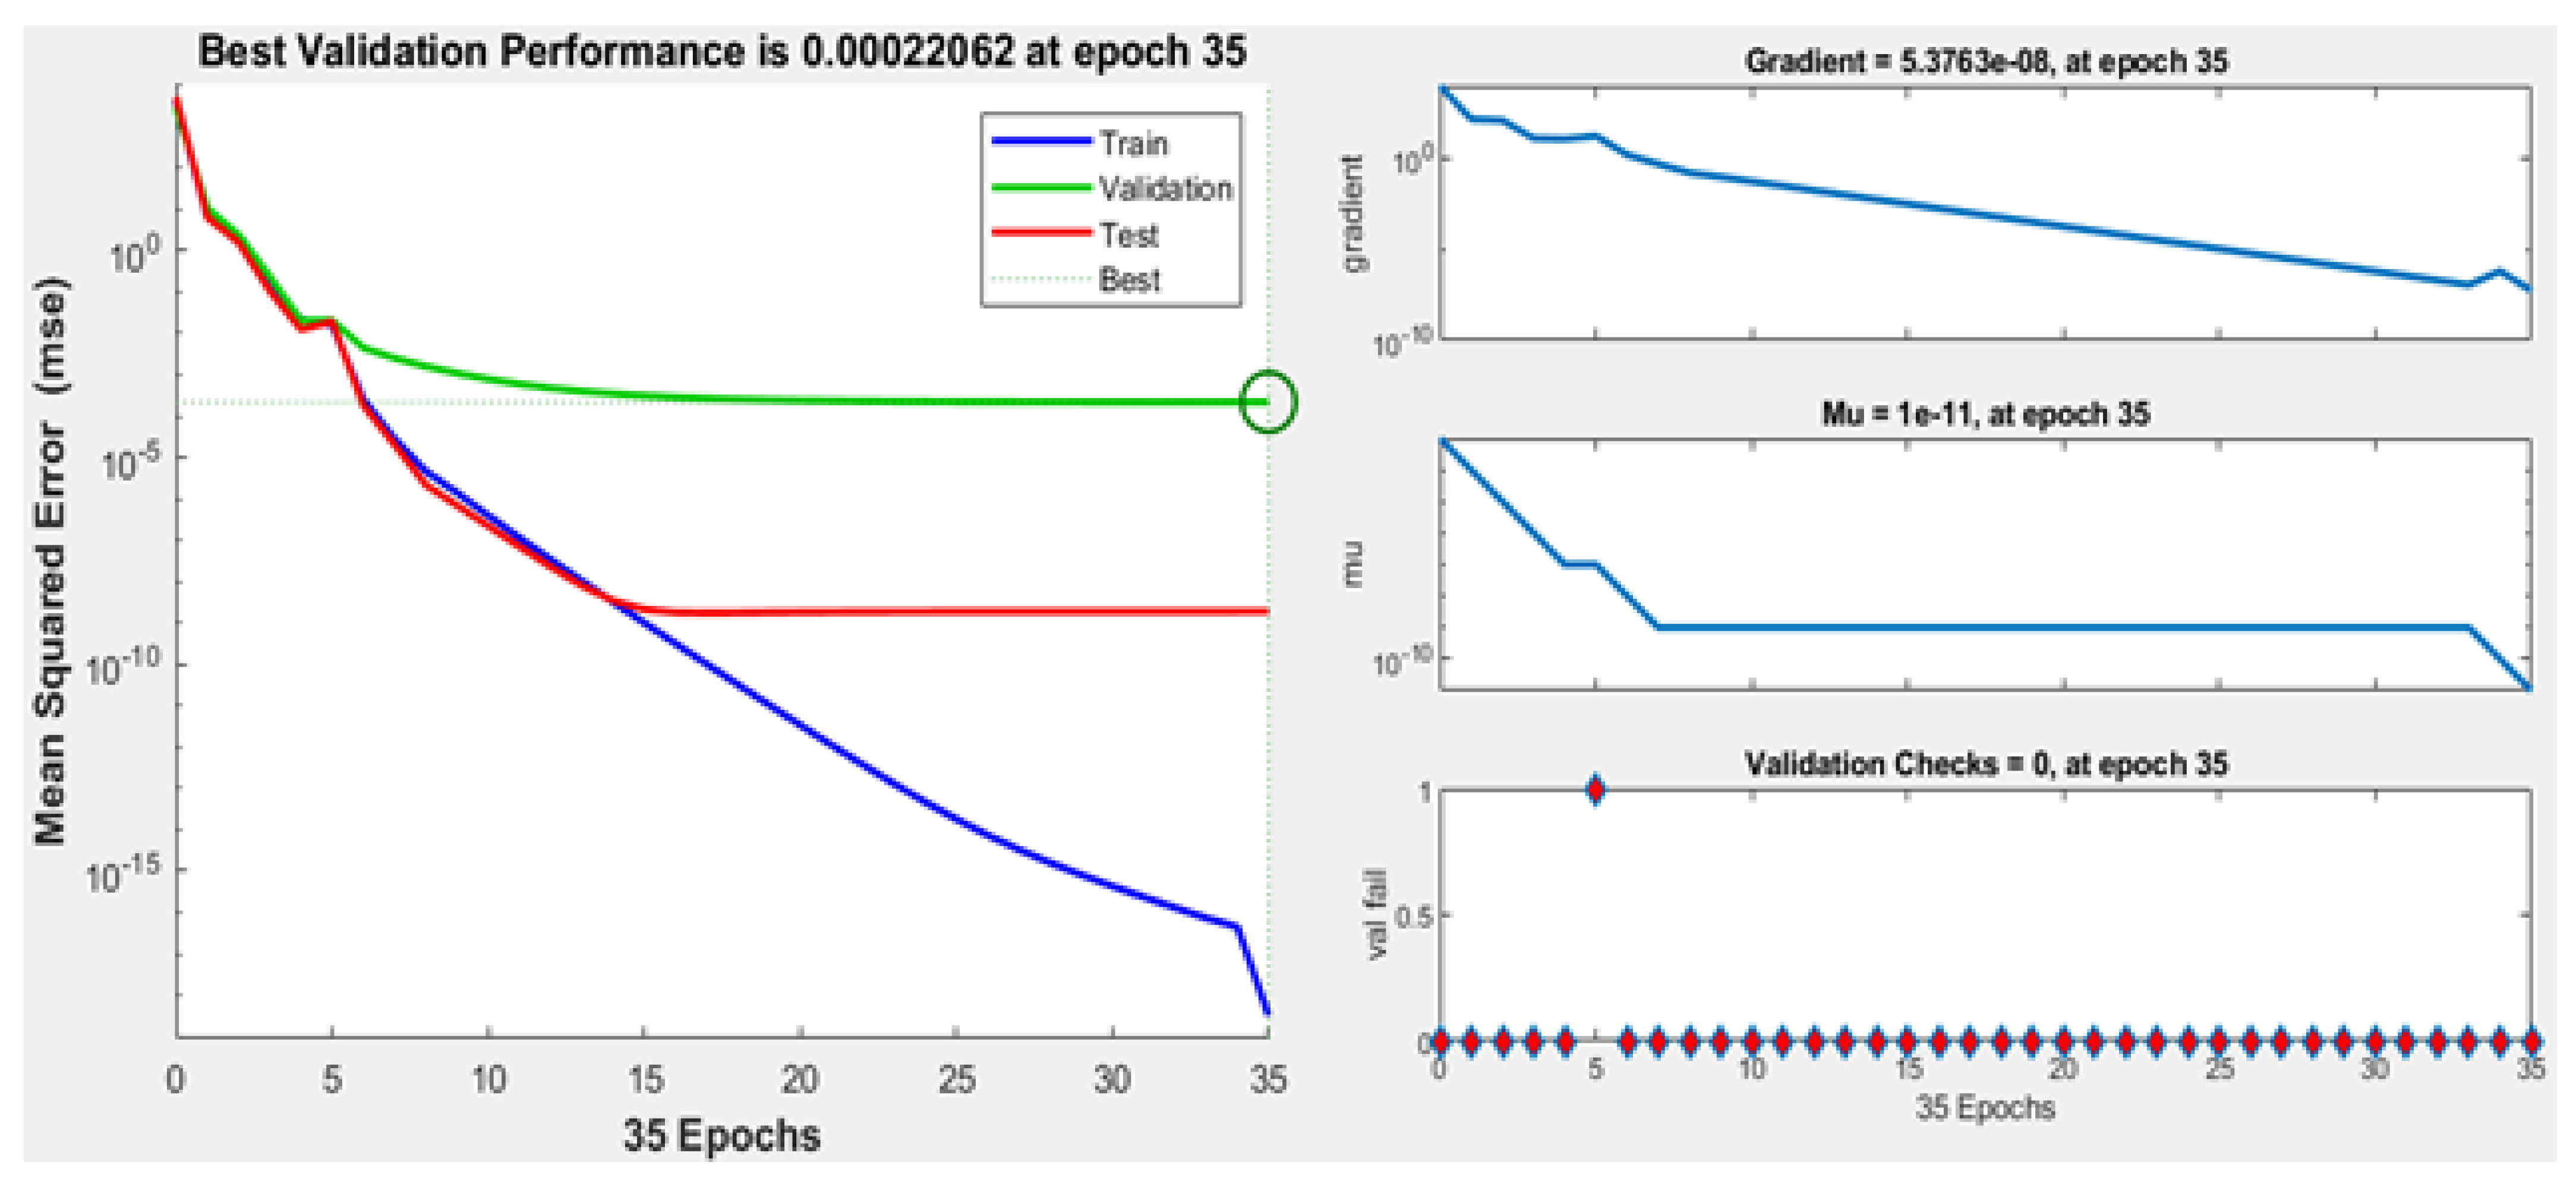
3.5. Accurate Modelling for ANN-Based Prediction with Fine Data (ANN-BNM)

A natural-inspired, intelligent paradigm based on human brain cells is known as an ANN (artificial neural network). It is made up of numerous nodes, which are information processing units. Layers are created by combining connecting nodes, and layers are then combined to create neural networks. Neuron units are also known as neural nodes. Weights were assigned to each neuron connection and are tweaked during training to provide an approximation function that minimizes error for classification or estimation tasks. Input, hidden, and output layers make up the multilayer structure that characterizes an ANN [19,25]. However, the number of hidden layers may change depending on how complicated the data training set is. The input layer receives the field data first and then sends the unprocessed information to hidden levels for processing. The output layer is where the results that emerged from the hidden layers’ processing are compared to the precise target values.
Accurate noise prediction used a variety of terrain and noise parameters to precisely predict noise levels, considering the impacts of building, building heights (BH), objects, trees, and ground at various distances from the road and away (receiving) points referred to as terrain data (TD). Over 60 points of noise data were monitored and integrated along with terrain parameters (5) to determine noise levels for all the receiving points using an artificial neural network (ANN)-based technique [33]. Terrain points’ locations, their noise levels, types of ground, elevation of buildings, dimensions of buildings, and obstructions were fed as input to train the ANN model considering the attenuation parameters (AP). Essentially, the impacts of every noise point on every noise receiving point were determined in Figure 4.
The ANN-based noise prediction model was built over three layers. The hidden layer was associated with 20 neurons. TRAINLM was used as a training function whereas LEARNGDM was used as an adaptation learning function [19]. The training information and training parameters for the training network are shown in Figure 4.

3.6. Automated Noise dB Calculation Method for Noise Prediction

The proposed methodology for automated noise dB calculation works in several stages, primarily avoiding the direct use of noise data. These stages are data acquisition, segmentation, classification, characterization, clustering, and noise mapping, extraction of terrain features from the geospatial raster data and further processing for noise prediction modelling application. The flow diagram for the proposed methodology is shown in Figure 5. The method does not need to directly record the noise data; however, it used the calibrated scale to predict the noise levels for different vehicles present on the road at a time.
The actual images used for automated noise prediction were collected from Google Earth and consisted of road intersections and areas. The collected image was first subjected to semantic segmentation to classify different vehicles with ranges of dB values, and then a noise map was created using the algorithm described in this paper. High-definition data were collected from Google Earth in the form of Google Raster images of three major cities in Uttar Pradesh. These images contained information on buildings, vehicles, roads, water, vegetation, and other features. The dataset consisted of 1000 images, each with a resolution of 4800 × 2751 pixels. The results obtained using this dataset were cross-validated by using 2/3 of the images for training and 1/3 for testing.
Firstly, the collected image was given as input, semantic segmentation was performed (which classified different vehicles with ranges of dB values), and lastly, a noise map was created from the algorithm determined in this paper [32,34]. The segmentation process in automated noise prediction is semantic segmentation which accordingly provides feature extraction in three different categories. Semantic segmentation is used for different types of vehicle extraction. These vehicles are categorized into three categories small (bike), medium (car), and large (truck, bus).
The classification task is applied by the logistic regression layer of the traditional U-Net model using the regression-based Softmax function, and its loss function is a probabilistic model considering all available data. The feature space data were normalized, and the classification results are displayed as probabilities in Equation (1). It is described as follows: Imagine that the sample data come in N different categories. The final convolution layer’s output is Y = ( y 1 , y 2 , y N ) T and the output after Softmax calculation is   S = ( s 1 , s 2 , , s N ) T where
S j = e x p ( y j ) j = 1 N e x p ( y j )  
Compared to Softmax, SVM performs better. The fundamental concept behind an SVM is the addition of a kernel function that transforms features that are linearly indistinguishable into high-dimensional feature spaces, making the feature data linearly distinguishable.
The image was classified using a convolutional neural network (CNN). The author will take into account a pre-trained CNN on ImageNet and polish the dataset of vehicle image from Google Maps [35,36].
The clustering of images was completed based on the length and width of the cluster to identify the number of vehicles. The standard length and width of the vehicles were provided for Indian roads.

3.7. Noise Exposure Mapping

The efficacy of five noise prediction methods was compared and tested to estimate noise exposure and identify noise hazard zones. Noise exposure refers to the amount of noise a person experiences throughout the day. Permanent physical damage occurs only when individuals are exposed to high levels of noise for extended periods [37,38]. There is existing literature that provides methods for computing noise exposure levels [26]. This is particularly relevant for roadside shopkeepers or people residing in temporary roadside huts. The noise levels at the shopkeepers’ locations were calculated near the road corridor over a 12-h period. Noise exposure was calculated using Equation (2) [38]:
L e x , 8 = 10   log 10 [ I = 1 n ( t i × 10 0.1 S P L i ) ] 8  
where
  • L e x , 8 —is the equivalent sound exposure level in 8 h?
  • Σ —sum of the values in the enclosed expression for all noise incidents from i = 1 to i = n.
  • i —is a distance incident leading to noise level impacted worker/dweller.
  • t i   —is the duration in hours of i.
  • S P L i —is the sound level of in dB.
The noise exposure level is calculated for people working and staying adjacent to the roadside over 12 h following the relationship.
  • n = the total number of noise events for the people living in the area during the evaluation period.
Different noise levels and their exposure levels for 12 h were computed and are provided in Table 3 with hazard limits in Section 4.

4. Results and Discussion

4.1. Large Data-Based Noise Prediction Method (LDBM)

A predicted map was prepared for three different time intervals, revealing variations in noise levels. During the high traffic time period (4–6 p.m.), the predicted noise values reached 105–110 dB(A). In the medium traffic period (9–11 a.m.), the values ranged from 92 to 95 dB(A), while during the low traffic period (1–2 p.m.), the values ranged from 83 to 85 dB(A). This result highlights the dynamic nature of noise levels throughout the day.
Leq (Lequivalent noise levels) for the entire day over the course of a month were determined for these time intervals and presented as maps. The predicted average equivalent noise levels fell within the range of 95–101 dB(A) (Figure 6a–c). To validate the predicted noise values, measurements were taken using a sound pressure level meter at ten different locations. The prediction did not account for the effects of buildings, walls, or other local factors, leading to lower accuracy in those areas, while reasonably accurate results could be obtained in open spaces.

4.2. Small Data-Based Noise Prediction Method (SDBM)

This method is useful and can avoid time-consuming data collection processes. Surprisingly, the small data-based method predicted similar results to the large data-based method, averaging out by a few dB(A) on average. This technique indicated predicting the noise value for an area with fewer data (Figure 7a–c).

4.3. Source Point Averaging (Using One Noise Level for All Source Points)-Based Method Noise Prediction (SPANV)

This technique predicted noise levels for three different time intervals, corresponding to high, medium, and low traffic loads. It was evident that, like the prediction of large and small noise data inputs, this technique also estimated noise levels, albeit with some deviation from the actual values. The results indicated high noise levels ranging from 97 to 110 dB(A), medium noise levels ranging from 83 to 85 dB(A), and low noise levels ranging from 72 to 73 dB(A) (see Figure 8a–c). To validate these results, comparisons were made with actual data-based predictions at ten validation points, revealing discrepancies of ±5–6 dB(A) compared to others.

4.4. Google Navigation Data Based Prediction Method (GNBM)

Every color of Google Navigation data was assigned some dB(A) value as shown in Table 1 after calibration with ground data. Values were assigned based on data validation using a sound pressure level meter. The ranges for high (H) and low (L) traffic were observed to vary within ±7 dB(A) from its average value, red corresponded to 103 dB(A), orange corresponded to 88 dB(A), and green corresponded to 72 dB(A), respectively. The authors collected noise data for a duration of 10 min, three times a day for six weeks (see Table A2 in Appendix A). The three time periods were chosen in line with high, medium, and low traffic mobility conditions. The measurements were taken from the edge of the road at a distance of 1.5 m from the road center. The recorded noise levels at the road edge were used to compute the likely noise levels at the noise source, i.e., road center. During the time of high traffic conditions, the authors estimated it to be 103 dB(A) on an average. This is generally the case with high traffic levels and associated honking conditions. The recorded sound pressure levels for three traffic navigational conditions (as available in three colors) for various locations of the study area are listed in Table 2 and Table 3.
These 20 road data points were used along with the 3 away data points to determine the noise map using GIS, and IDW interpolation techniques in (Figure 9a–c). The results were also validated and compared with other prediction techniques. Generally, the predictions correlated well with other predictions. However, the results were found to deviate from large noise data points-based prediction techniques by ±3–8 dB(A). So, these results indicated the possibility of predicting noise levels without even collecting the ground noise data with a precise and costly sound pressure level meter. Thus, it can be a very useful and time and cost-saving technique.

4.5. Accurate ANN Modelling-Based Noise Prediction

The ANN-based accurate prediction model was established using 60 noise data points and related terrain data points. The best validation performance for modeling was established at the 35th epoch in Table 4. Model validation performance and gradient Mu and validation checks are exhibited up to the 35th epoch. Neural network training performance in Figure 10 and training regression results in Figure 11 indicate encouraging model fit with training, validation, and test results all giving R2 = 1. The well-trained model was then used to check the test points. The noise data observed separately over the study site were compared with the ANN-based prediction. The ANN-based technique was also compared with the other four techniques discussed in this paper. Understandably, the ANN-based prediction technique was found to be far superior (predicting within ±0.5–2.5 dB(A)) than any other technique used in the study. However, the ANN-based technique, although found to be very accurate, needed many data points, accurate noise and a sophisticated model for the above prediction. The method was expensive in terms of time, cost, and data dependency.

4.6. Automated Noise dB(A) Calculation Method for Noise Prediction without the Recording of Noise Levels of the Sources

In this method, noise dB(A) values are calculated based on the number of vehicles present in each cluster on the road. Noise dB(A) values for different categories of vehicles are recorded by a sound pressure level meter from the nearby intersection of the RGIPT campus. The recorded noise levels are then used to calibrate the noise scene from the images. The noise levels used for calibration for different vehicles were as follows: for scooters, and bikes, the noise was determined as 41.6 dB(A) at high frequency, 50.5 dB(A) at medium frequency, and 57.5 dB(A) at low frequency; for cars, the noise was determined as 62.4 dB(A) at high frequency, 72.3 dB(A) at medium frequency, and 85 dB(A) at low frequency; and for trucks and buses, the noise was determined as 76.4 dB(A) at high frequency, 85.4 dB(A) at medium frequency, and 104.3 dB(A) at low frequency.
These vehicles on the road move in various clusters, i.e., in pairs, such as two cars and two buses, one car, one bike, and one truck, or in isolation. In such cases, the number of possible vehicle pairs is determined in three different clusters: small, medium, large, and isolated clusters. Vehicle distances greater than 5 m were considered in the different clusters, and the number of vehicles in the cluster depended on the dB(A) sum of the noise levels of all vehicles. If the dB(A) sum of the noise levels of vehicles in the small cluster was greater than the dB(A) value of the large vehicle, then that cluster was considered in the large cluster. An isolated cluster was a cluster that contained a single vehicle, which might be a car, scooter, truck, or bus. Table 5 indicates information on a few clusters, including the type of vehicle, the number of vehicles, and the noise level of the cluster.
One thousand clusters with different noise levels were used to train a model for further prediction of the dB(A) (noise level) of testing images. A noise map was prepared based on the automated derived noise value in Figure 12. The study was designed to characterize traffic noise, giving importance to the frequency of noise, the source of noise, and the size of the vehicle.
Noise level measurements were validated, and users can generate a noise prediction map by simply recording and analyzing road traffic images and connecting them with calibrated noise levels. The authors automatically calculated the Leq noise value for the road intersection, determining a short-term L equivalent for 15 min. This calculation is based on Equation (3) and Table 6.
L e q = 10 log i = 1 i = n 10 L i 10 t 1
n = total number of sound samples, Li is the noise level of any ith sample, t is the time duration expressed as a fraction of the total sample time.
For the dB(A) calculation based on frequency value (31.5 Hz):
L e q = 10 log [ 10 74.5 10 × 20 60 + 10 81.2 10 × 25 60 + 62.3 10 × 15 60 ] = 80.158   dB

4.7. Noise Exposure Mapping

Primarily, the predicted noise data levels from the noise maps (generated using both large data-based and small data-based methods) were used to calculate noise exposure levels using Equation (2). The noise exposure levels are visualized in Figure 13, with zones compared to the acceptable threshold values listed in Table 7. The territory outlined in blue exhibited noise values ranging from 105 to 110 dB(A). For instance, roadside shopkeepers were predicted to be exposed to noise levels of 106.8 dB(A) when working for 12 h in that noisy environment.
Noise exposure levels exceeding 85 dB(A) were calculated for the area between the green, yellow, and blue boundaries. These regions pose a significant health threat, particularly concerning noise-induced hearing loss. The danger zones were reduced somewhat for other prediction methods. However, the road corridor consistently exhibited noise exposure levels exceeding 85 dB(A) for all prediction schemes, as indicated in Table 7.
For preventing hearing loss in commercial shopping and traffic areas, both indoors and outdoors, WHO recommends a limit of LAeq, 24 = 70 dB(A) [37,38].
WHO provides noise levels per hour for different time averages to stay within the recommended yearly average exposure in, as shown in Table A4 in Appendix A.
Thus, every prediction scheme was able to predict (even with inaccurate and lower quantities of noise data), the hazardous zone(s), which can potentially cause hearing loss [38]. The results are validated for all the methods. The noise exposure maps generated with different data were found to be nearly the same. The authors found even by the reduction in noise data, i.e., 60 data receiving points (large data method) to 30 receiving points (small data method), the hazard zone demarcation did not alter any significantly. The authors also found that there was no significant dB(A) value difference, so it offered the possibility of using the technique for hazard zone mapping using less dense noise data as well.

4.8. Comparison of Various Methods

The authors employed five different methods for noise prediction in their study. These methods varied in terms of the number of noise sources used, the quality of noise sources, and the noise modeling algorithms. The primary objective was to investigate the impact of noise data on the prediction of noise maps. By conducting this analysis, the authors aimed to determine the optimum quantity of noise data and/or the minimum resources required to predict noise values with reasonable accuracy. This research serves the purpose of enabling the public to easily predict noise levels in their respective areas.
The authors predicted the noise levels for the study area of Raebareli Intersection using five methods of noise prediction, varying in the number and quality of noise data points: (1) large noise source data; (2) small noise source data; (3) one source value-averaged noise data; (4) Google Navigation-based averaged noise dB(A) calculation technique introduced different densities (and qualities) of noise data inputs integrated into the GIS platform; and (5) ANN-based noise data prediction technique, which offered a technique to predict with finer noise data, terrain data, and a very sophisticated modeling algorithm.
The performance of different prediction models was compared with the ground observations made for the 10 points. It was found that the large data point-based technique with ISO 9613-2 modeling and GIS mapping provided the best results among the first four modeling techniques. The large noise data-based technique predicted with an accuracy of ±1–4 dB(A). The Google Navigation-based method predicted the noise levels within an accuracy of ±4–10 dB(A). Other models performed within this range, as indicated in Table 8. The performance of predictions improved significantly for the study area when higher granularities of noise data and improved modeling techniques were used. The ANN-based prediction technique with a large noise data set predicted with an accuracy of ±0.5–2.5 dB(A). The performance of models 1 to 4 was also compared with the best-performing software model (i.e., ANN) and is illustrated in Table 9. Based on these results, it was found that all the techniques tried could predict with reasonable accuracy.
Understandably, the ANN-based prediction techniques with finer noise data and a sophisticated algorithm predicted the noise levels very accurately, deviating by ±0.5–2.5 dB(A) from observed ground noise levels, on average, as shown in Figure 14. The deviations of ANN-based predictions from ground observations of noise levels for the 10 selected points are illustrated in Figure 14.
The authors also conducted a statistical comparison of the performances of the five models using one-way ANOVA (analysis of variance). Regarding the normality of the group data, one-way ANOVA can tolerate non-normal data (skewed or kurtotic distributions) with only a small effect on the Type I error rate [39]. ANOVA tests were conducted to examine the deviations in predictions using different combinations, namely: (a) considering all prediction techniques (1, 2, 3, 4, and 5); (b) considering techniques 2, 3, and 4; (c) considering techniques 2 and 4. These comparisons are illustrated in Table 10, Table 11 and Table 12. F-statistics were calculated along with the p-value or the probability of the test statistic obtaining a value greater than the computed test statistic [40,41,42]. Very low p-values for schemes (a) and (b) indicate that, overall, the prediction techniques may not be performing similarly. Higher p-values for ANOVA test schemes (b) and (c) indicate that the associated prediction techniques were performing similarly. Notably, schemes (b) and (c) involved less noise data-dependent prediction techniques, such as the small noise data-based model, single noise value-averaged prediction model, and Google Navigation-based prediction model. The performances of these models based on rough noise data were not significantly different. Moreover, their performances differed from the large noise data-based models, albeit not by more than ±3 to 6 dB(A). Therefore, it can be concluded that a model with lower noise data density can still be used for general noise prediction.
Using this study, the authors uncovered a potential reason for the decrease in the number of points and utilized some free source noise data (Google Navigation data-based noise prediction method and automated noise dB(A) calculation method for noise prediction) to predict traffic noise. In the current research, the authors also observed that the number of receiving points could be decreased with proper selection to maintain an equal distance between each point without sacrificing accuracy. Similar results were found in the current research.
An additional study was conducted to compare the noise mapping accuracies at different granularities of noise data for the locations marked as A, B, C, D, E, F, G, and H on the predicted map. The detailed deviations in noise mapping in dB(A) are listed in Table A3, in Appendix A. The analysis indicated the higher deviations in mapping with rougher noise datasets.
The study primarily considered the noise source points at an equal distance for different predictions. In future, the relative positions of noise source points may be altered to find their impact on predictions. Furthermore, the number of noise source points are reduced to half (e.g., 30) for the study site. It is possible to reduce them further at the cost of accuracy. However, the acceptable extent of dilution of accuracy can be studied separately in future.

5. Conclusions

The effectiveness of noise prediction depends on the quality of noise and terrain data used in the prediction and the quality of the modeling algorithm employed in the models. The authors primarily focused on varying the levels of granularity of noise data while keeping other factors, such as terrain data and modeling approach, unchanged. They studied in detail the impacts of various qualities of noise data on noise prediction.
Different techniques, including large data-based, small data-based, averaged one data-based, and Google Navigation-based methods, were used with noise data of varying qualities but with similar terrain data and modeling algorithms. The prediction performances deteriorated between ±4 and ±10 dB(A) as the quality of the noise data decreased from denser and accurate to rougher data. The detailed comparison of predicted results indicated that the performances of various levels of granularity of noise data were not equally effective. The differences in predictions were not very significant, but denser data provided ±1 to 4 dB(A) less deviation compared to the ground observed data.
Furthermore, ANOVA analysis clearly indicated that the performance of all the models using rough noise data was similar. Models with less granular noise data differed in terms of the lower number of accurate noise data points used in modeling or the lower quality of noise data points used in prediction (e.g., the use of averaged one noise levels or the use of Google Navigation-based noise data, managing noise source data indirectly).
The possibility of using a lesser number of noise data points or inferior quality noise data for noise prediction was further explored for noise exposure mapping. The performance in noise exposure mapping using different levels of granularity of noise data was similar. All methods similarly depicted hazardous and other zones around the road intersections.
Models requiring fewer or no ground-based noise data collection for predicting noise levels were highlighted separately. The success of using the Google Navigation-based prediction technique was an important direction in which noise prediction or modeling can be applied to urban modeling applications. This approach offers significant ease in noise prediction.
The study also demonstrated that integrating large noise data with a sophisticated noise prediction model (such as ANN-based prediction) offers the best predictions, with a deviation of ±0.5–2.5 dB(A) (on average) from the noise data recorded on the ground. This approach indicates that the prediction model can also have an impact on the quality of predictions.
Indirect noise data and sophisticated noise modeling techniques were integrated to showcase the possibility of accurate noise prediction and mapping with convenience in 3D. Google images were processed to extract vehicle data and assign noise data (through calibration). These data were then used to enable accurate noise prediction in 3D, avoiding the direct use of noise data in prediction.

Author Contributions

Conceptualization, M.I.Z., R.D. and S.B. (Susham Biswas); methodology, M.I.Z., R.D. and S.B. (Susham Biswas); software, R.D. and S.B. (Shruti Bharadwaj); validation, S.B.; formal analysis, S.B. (Shruti Bharadwaj), M.I.Z. and R.D.; investigation, R.D.; data curation, R.D. and M.I.Z.; writing—original draft preparation, M.I.Z. and S.B. (Shruti Bharadwaj); writing—review and editing, M.I.Z. and S.K.T.; visualization, M.I.Z., S.B. (Shruti Bharadwaj) and S.B. (Susham Biswas); supervision, S.B. (Susham Biswas); project administration, M.I.Z. All authors have read and agreed to the published version of the manuscript.

Funding

This research received no external funding.

Data Availability Statement

The data presented in this study are available on request from the corresponding author. The data are not publicly available due to [It is part of author thesis work].

Conflicts of Interest

The authors declare no conflict of interest.

Appendix A

Table A1. The table showing the sampling data at different coordinates for three-time schedules.
Sample NoXYH (4–6 p.m.) 10 min
Duration
M (9–11 a.m.) 10 min DurationL (1–3 p.m.) 10 min
Duration
181.2410926.244931008575
281.2412326.244741059080
381.2413326.244581038877
481.2414226.244471059080
581.2414826.24441109585
681.2416526.244331109585
781.2418226.244051109585
881.2419326.243931109585
981.2418826.243821109585
1081.2418326.243631109585
1181.241726.24341109585
1281.2417426.243581109585
1381.2415626.24331009575
1481.2414426.2431028777
1581.2414826.243141059080
1681.2413926.243021089282
1781.2413526.242791059080
1881.241326.24272958575
1981.2411626.24327928070
2081.241126.24343877575
2181.2408626.24362877570
2281.2406926.24359847263
2381.2405326.24418586161
2481.2404326.24414585555
2581.2401826.24402555557
2681.2400826.24394585558
2781.2399126.24384556060
2881.2407226.24437756560
2981.2410226.24433887060
3081.2408326.24411726560
3181.2412826.24399857565
3281.2413926.24376867570
3381.2412726.24349867570
3481.2409826.24314907071
3581.2408626.24294887072
3681.2405526.24342575560
3781.2403826.24371576060
3881.240326.2432555555
3981.2416326.24484877570
4081.2418426.24458847270
4181.2421226.24423908075
4281.2405926.2441857870
4381.2409826.24366857870
4481.2412926.24332857870
4581.2405626.24444857870
4681.2405626.24425857870
4781.2406926.244857870
4881.2412826.244661058066
4981.2411526.244811058066
5081.2417326.244211058066
5181.2419226.244011058066
5281.2418326.243721008066
5381.2417226.243491008066
5481.2415526.24321008066
5581.2413726.24291008066
5681.2416326.243351008066
5781.2412326.2434857870
5881.2419426.243861058066
5981.2415626.244371058066
6081.2411826.24481058066
Table A2. The table showing the detailed data collection (day-wise) in different weeks.
S.No.Sample No1st Week2nd Week 3rd Week4th Week5th Week6th Week
11–10MondayTuesdayWednesdayThursdayFridaySaturday
211–20TuesdayWednesdayThursdayFridaySaturdayMonday
321–30WednesdayThursdayFridaySaturdayMondayTuesday
431–40ThursdayFridaySaturdayMondayTuesdayWednesday
541–50FridaySaturdayMondayTuesdayWednesdayThursday
651–60SaturdayMondayTuesdayWednesdayThursdayFriday
Table A3. The table shows the difference in the dB(A) value over the different methods.
ZoneFull Data (60)Half Data
(30)
DifferenceSame Source (1)DifferenceAverage DifferenceGoogle NavigationDifferenceAverage Difference
A. High Traffic Noise (4–6 p.m.)
A105–110105–110097–1008–109110–1100–52.5
B97.9–10497.9–104097–1008–10974–7923.9–2524.45
C85.6–91.785.6–91.7092–966.4–4.35.380–865.6–5.75.6
D85.6–91.785.6–91.7092–966.4–4.35.387–922.6–0.31.4
E67.3–73.367.3–73.3061–656.3–8.37.362–675.3–6.35.8
F73.4–79.473.4–79.4071–752.4–4.43.462–6711.3–12.411.8
G97.9–10497.9–104097–1000.9–42.580–8617.9–1818
H91.8–97.891.8–97.8097–1006.8–2.24.593–981.2–0.20.7
B. Medium traffic noise (9–11 a.m.)
A87–9187–91083–854–6597.8–10310.8–1211.4
B78–8278–82083–853–5471.1–76.36.9–5.76.3
C74–7774–77079–825–5571.1–76.32.9–0.71.8
D78–8278–82079–820–10.581.8–873.8–54.4
E69–7369–73063–656–8760.4–65.78.6–7.315.9
F60–6460–64059–621–21.560.4–67.70.4–3.72
G83–8683–86079–824–4471.1–76.311.9–9.710.8
H78–8278–82079–820–10.581.8–873.8–54.4
C. Low traffic noise (1–3 p.m.)
A77–7977–79072–735–65.592–9615–1716
B67–6967–69072–734–54.565–690–21
C67–6967–69069–690–2170–733–43.5
D70–7370–73070–710–2179–829–99
E64–6664–66062–622–4355–606–97.5
F64–6664–66063–641–21.561–642–32.5
G77–7977–79070–717–87.565–6910–1211
H70–7370–73070–710–2179–829–99
Table A4. A yearly average LAeq is calculated by combining hourly exposure and the number of hours worked per week.
Hours of Exposure per WeekOne-Hour Exposure Level (LAeq) dB
80859095100
40 (8 h per day, 5 days per week)7479848994
168 (24 h per day, 7 days per week)80859095100
Sources: Environmental Noise Guidelines for the European Region—2018 [37].

References

  1. Oyedepo, S.O. Development of Noise Map for Ilorin Metropolis, Nigeria. Int. J. Environ. Stud. 2013, 70, 503–514. [Google Scholar] [CrossRef]
  2. Dubey, R.; Bharadwaj, S.; Zafar, M.I.; Mahajan, V.; Srivastava, A.; Biswas, S. GIS Mapping of Short-Term Noisy Event of Diwali Night in Lucknow City. ISPRS Int. J. Geo-Inf. 2021, 11, 25. [Google Scholar] [CrossRef]
  3. Nega, T.; Smith, C.; Bethune, J.; Fu, W.H. An Analysis of Landscape Penetration by Road Infrastructure and Traffic Noise. Comput. Environ. Urban Syst 2012, 36, 245–256. [Google Scholar] [CrossRef]
  4. Li, B.; Tao, S.; Dawson, R.W.; Cao, J.; Lam, K. A GIS Based Road Traffic Noise Prediction Model. Appl. Acoust. 2002, 63, 679–691. [Google Scholar] [CrossRef]
  5. Bharadwaj, S.; Dubey, R.; Zafar, M.I.; Tiwary, S.K.; Faridi, R.A.; Biswas, S. A Novel Method to Determine the Optimal Location for a Cellular Tower by Using LiDAR Data. Appl. Syst. Innov. 2022, 5, 30. [Google Scholar] [CrossRef]
  6. Bharadwaj, S.; Dubey, R. Raster Data Based Automated Noise Data Integration for Noise Raster Data Based Automated Noise Data Integration for Noise. ISPRS Int. Arch. Photogramm. Remote Sens. Spat. Inf. Sci. 2021, XLIII-B4-2, 159–166. [Google Scholar] [CrossRef]
  7. Dubey, R.; Bharadwaj, S.; Bhushan, V.S.; Biswas, S. Collaborative Noise Mapping Using Smart Phone. Int. Arch. Photogramm. Remote Sens. Spatial Inf. Sci. 2020, 43, 253–260. [Google Scholar] [CrossRef]
  8. Cai, M.; Yao, Y.; Wang, H. A Traffic-Noise-Map Update Method Based on Monitoring Data. J. Acoust. Soc. Am. 2017, 141, 2604. [Google Scholar] [CrossRef]
  9. Sonaviya, D.R.; Tandel, B.N. A Review on GIS-Based Approach for Road Traffic Noise Mapping. Indian J. Sci. Technol. 2019, 12, 1–6. [Google Scholar] [CrossRef]
  10. Colvile, R.N.; Woodfield, N.K.; Carruthers, D.J.; Fisher, B.E.A.; Rickard, A.; Neville, S.; Hughes, A. Uncertainty in Dispersion Modelling and Urban Air Quality Mapping. Environ. Sci. Policy 2002, 5, 207–220. [Google Scholar] [CrossRef]
  11. KANG, J. From DBA to Soundscape Indices: Managing Our Sound Environment. Front. Eng. Manag. 2017, 4, 184. [Google Scholar] [CrossRef]
  12. Miedema, H.M.E.; Oudshoorn, C.G.M. Annoyance from Transportation Noise: Relationships with Exposure Metrics DNL and DENL and Their Confidence Intervals. Environ. Health Perspect. 2001, 109, 409. [Google Scholar] [CrossRef]
  13. Muzet, A. Environmental Noise, Sleep and Health. Sleep Med. Rev. 2007, 11, 135–142. [Google Scholar] [CrossRef]
  14. D’Alessandro, F.; Asdrubali, F.; Schiavoni, S. The Noise Abatement Plan of an Italian Road Network: A Comparison Between Standard and Innovative Methodologies. Open Transp. J. 2014, 8, 26–38. [Google Scholar] [CrossRef]
  15. WHO. World Health Statistics; WHO: Geneva, Switzerland, 2009; pp. 5–6.
  16. Basner, M.; Babisch, W.; Davis, A.; Brink, M.; Clark, C.; Janssen, S.; Stansfeld, S. Auditory and Non-Auditory Effects of Noise on Health. Lancet 2014, 383, 1325. [Google Scholar] [CrossRef]
  17. Alam, M.S.; Corcoran, L.; King, E.A.; McNabola, A.; Pilla, F. Modelling of Intra-Urban Variability of Prevailing Ambient Noise at Different Temporal Resolution. Noise Mapp. 2017, 4, 20–44. [Google Scholar] [CrossRef]
  18. Xie, D.; Liu, Y.; Chen, J. Mapping Urban Environmental Noise: A Land Use Regression Method. Environ. Sci. Technol. 2011, 45, 7358–7364. [Google Scholar] [CrossRef]
  19. Villarrubia, G.; De Paz, J.F.; Chamoso, P.; De La Prieta, F. Artificial Neural Networks Used in Optimization Problems. Neurocomputing 2017, 272, 10–16. [Google Scholar] [CrossRef]
  20. Alani, R.A.; Ogunmoyela, O.M.; Okolie, C.J.; Daramola, O.E. Geospatial Analysis of Environmental Noise Levels in a Residential Area in Lagos, Nigeria. Noise Mapp. 2020, 7, 223–238. [Google Scholar] [CrossRef]
  21. Verma, D.; Jana, A.; Ramamritham, K. Classification and Mapping of Sound Sources in Local Urban Streets through AudioSet Data and Bayesian Optimized Neural Networks. Noise Mapp. 2019, 6, 52–71. [Google Scholar] [CrossRef]
  22. Oyedepo, S.O.; Adeyemi, G.A.; Olawole, O.C.; Ohijeagbon, O.I.; Fagbemi, O.K.; Solomon, R.; Ongbali, S.O.; Babalola, O.P.; Dirisu, J.O.; Efemwenkiekie, U.K.; et al. A GIS—Based Method for Assessment and Mapping of Noise Pollution in Ota Metropolis, Nigeria. MethodsX 2019, 6, 447–457. [Google Scholar] [CrossRef]
  23. Onuu, M. Environmental Noise Pollution in Nigerian Universities: A Case Study of the University of Calabar, Calabar, Nigeria. J. Niger. Environ. Soc. 2004, 2, 100–109. [Google Scholar]
  24. Okokon, E.O.; Yli-Tuomi, T.; Turunen, A.W.; Tiittanen, P.; Juutilainen, J.; Lanki, T. Traffic Noise, Noise Annoyance and Psychotropic Medication Use. Environ. Int. 2018, 119, 287–294. [Google Scholar] [CrossRef]
  25. Paiva, K.M.; Cardoso, M.R.A.; Zannin, P.H.T. Exposure to Road Traffic Noise: Annoyance, Perception and Associated Factors among Brazil’s Adult Population. Sci. Total Environ. 2019, 650, 978–986. [Google Scholar] [CrossRef]
  26. Blanes, N.; Houthuijs, D.; Swart, W.; Sainz de la Maza, M.; Ramos, M.; Castell, N.; Van Kempen, E. Noise in Europe 2017: Updated Assessment ETC/ACM Technical Paper 2016/13. Eur. Top. Cent. Air Pollut. Clim. Change Mitig. 2017, 13, 200–203. [Google Scholar]
  27. Fritschi, L.; Brown, L.; Kim, R. Burden of Disease from Environmental Noise—Quantification of Healthy Life Years Lost in Europe; WHO European Centre for Environment and Health: Bonn, Germany, 2011; 106p. [Google Scholar]
  28. WHO. Burden of Disease from Burden of Disease From; WHO: Geneva, Switzerland, 2011; 126p.
  29. Biswas, S.; Lohani, B. Development of High Resolution 3D Sound Propagation Model Using LIDAR Data and Air Photo. Int. Arch. Photogramm. 2008, XXVII, 1735–1740. [Google Scholar]
  30. Zambon, G.; Roman, H.E.; Smiraglia, M.; Benocci, R. Monitoring and Prediction of Traffic Noise in Large Urban Areas. Appl. Sci. 2018, 8, 251. [Google Scholar] [CrossRef]
  31. Lokhande, S.K.; Dhawale, S.A.; Pathak, S.S.; Gautam, R.; Jain, M.C.; Bodhe, G.L. Appraisal of Noise Level Dissemination Surrounding Mining and Industrial Areas of Keonjhar, Odisha: A Comprehensive Approach Using Noise Mapping. Arch. Acoust. 2017, 42, 423–432. [Google Scholar] [CrossRef]
  32. Enmarker, I. The Effects of Meaningful Irrelevant Speech and Road Traffic Noise on Teachers’ Attention, Episodic and Semantic Memory. Scand. J. Psychol. 2004, 45, 393–405. [Google Scholar] [CrossRef]
  33. Matlab Code for Artificial Neural Networks. Available online: https://libraryfile.university/download/4667282 (accessed on 2 March 2023).
  34. Kůrková, V. Kolmogorov’s Theorem and Multilayer Neural Networks. Neural Netw. 1992, 5, 501–506. [Google Scholar] [CrossRef]
  35. Sun, X.; Liu, L.; Li, C.; Yin, J.; Zhao, J.; Si, W. Classification for Remote Sensing Data with Improved CNN-SVM Method. IEEE Access 2019, 7, 164507–164516. [Google Scholar] [CrossRef]
  36. Li, W.; Wang, Z.; Wang, Y.; Wu, J.; Wang, J.; Jia, Y.; Gui, G. Classification of High-Spatial-Resolution Remote Sensing Scenes Method Using Transfer Learning and Deep Convolutional Neural Network. IEEE J. Sel. Top. Appl. Earth Obs. Remote Sens. 2020, 13, 1986–1995. [Google Scholar] [CrossRef]
  37. Environmental Noise Guidelines for the European Region. Available online: https://apps.who.int/iris/handle/10665/279952 (accessed on 2 March 2023).
  38. Occupational Health and Safety Act, RSO 1990, c O.1. Available online: https://qweri.lexum.com/w/onlegis/rso-1990-c-o1-en#!fragment//BQCwhgziBcwMYgK4DsDWszIQewE4BUBTADwBdoByCgSgBpltTCIBFRQ3AT0otokLC4EbDtyp8BQkAGU8pAELcASgFEAMioBqAQQByAYRW1SYAEbRS2ONWpA (accessed on 2 March 2023).
  39. Ragettli, M.S.; Goudreau, S.; Plante, C.; Fournier, M.; Hatzopoulou, M.; Perron, S.; Smargiassi, A. Statistical Modeling of the Spatial Variability of Environmental Noise Levels in Montreal, Canada, Using Noise Measurements and Land Use Characteristics. J. Expo. Sci. Environ. Epidemiol. 2016, 26, 597–605. [Google Scholar] [CrossRef]
  40. Singh, M.; Dong, M.; Wu, W.; Nejat, R.; Tran, D.K.; Pradhan, N.; Raghavan, D.; Douglas, J.F.; Wooley, K.L.; Karim, A. Enhanced Dielectric Strength and Capacitive Energy Density of Cyclic Polystyrene Films. ACS Polym. Au. 2022, 2, 324–332. [Google Scholar] [CrossRef]
  41. Singh, M.; Agrawal, A.; Wu, W.; Masud, A.; Armijo, E.; Gonzalez, D.; Zhou, S.; Terlier, T.; Zhu, C.; Strzalka, J.; et al. Soft-Shear-Aligned Vertically Oriented Lamellar Block Copolymers for Template-Free Sub-10 Nm Patterning and Hybrid Nanostructures. ACS Appl. Mater. Interfaces 2022, 14, 12824–12835. [Google Scholar] [CrossRef]
  42. Shreyash, N.; Sonker, M.; Bajpai, S.; Tiwary, S.K. Review of the Mechanism of Nanocarriers and Technological Developments in the Field of Nanoparticles for Applications in Cancer Theragnostics. ACS Appl. Bio. Mater. 2021, 4, 2307–2334. [Google Scholar] [CrossRef]
Figure 1. Google map for study area. Important locations for noise data sampling prediction and mapping are demarcated as numbered landmarks with yellow marks as data collection points.
Acoustics 05 00061 g001
Figure 2. Flowchart shows the five methods used large data-based method, small data-based method, source point average value-based method, Google navigation data-based method, and accurate modeling-based method for noise prediction and mapping. LDBM—large data-based noise prediction method; SDBM—small data- based noise prediction method; SPANV—source point average (same source noise dB value)-based method noise prediction; GNBM—Google Navigation data method for noise prediction; ANN-BNM—accurate modelling for ANN-based prediction with fine data; TD—terrain data; NP—noise prediction; BH—building height; MNL—mapping noise level; SD—small data; LD—large data; AP—attenuation parameters; GD—Google data (Google Navigation data); SNV—single noise value (average value).
Acoustics 05 00061 g002
Figure 3. (a) Google Navigation color map (noise levels). (b) Study area traffic image.
Acoustics 05 00061 g003
Figure 4. ANN architecture for noise prediction.
Acoustics 05 00061 g004
Figure 5. Flow diagram for automated noise dB calculation methods.
Acoustics 05 00061 g005
Figure 6. Noise prediction at Ratapur using large data-based noise value-based equivalent noise data. (a) Predicted noise map at Ratapur. High dB(A) value (4–6 p.m.); (b) predicted noise map at Ratapur. Medium dB(A) value (9–11 a.m.); (c) predicted noise map at Ratapur. Low dB(A) value (1–3 p.m.).
Acoustics 05 00061 g006aAcoustics 05 00061 g006b
Figure 7. Noise prediction at Ratapur using small data-based noise value-based equivalent noise data. (a) Predicted noise map at Ratapur. High dB(A) value (4–6 p.m.); (b) predicted noise map at Ratapur. Medium dB(A) value (9–11 a.m.); (c) predicted noise map at Ratapur. Low dB(A) value (1–3 p.m.). The noise levels (in dB(A)) mapped for the locations A, B, C, D, E, F, G, and H are used later to compare the noise mapping accuracies for different granularities of noise data.
Acoustics 05 00061 g007aAcoustics 05 00061 g007b
Figure 8. Noise prediction at Ratapur using all source point same noise value-based equivalent noise data. (a) Predicted noise map at Ratapur. High dB(A) value (4–6 p.m.); (b) predicted noise map at Ratapur, Medium dB(A) value (9–11 a.m.) (c) Predicted noise map at Ratapur Low dB(A) value (1–3 p.m.).
Acoustics 05 00061 g008aAcoustics 05 00061 g008b
Figure 9. The noise prediction at Ratapur using Google Navigation-based equivalent noise data. (a) Predicted noise map at Ratapur. High dB(A) value (4–6 p.m.); (b) predicted noise map at Ratapur. Medium dB(A) value (9–11 a.m.); (c) predicted noise map at Ratapur. Low dB(A) value (1–3 p.m.). The noise levels (in dB(A)) mapped for the locations A, B, C, D, E, F, G, and H are used later to compare the noise mapping accuracies for different granularities of noise data.
Acoustics 05 00061 g009aAcoustics 05 00061 g009b
Figure 10. The ANN-based noise prediction modeling. The best validation performance was found at the 35th epoch (as determined in terms of mean square error). The gradient, Mu, and validation checks were found to be consistent at the 35th epoch.
Acoustics 05 00061 g010
Figure 11. Neural network training regressions showing R2 results for training, validation, and test (all = 1).
Acoustics 05 00061 g011
Figure 12. Automated noise prediction map in dB(A) determined using image processing technique (and no direct recording of noise levels of the sources).
Acoustics 05 00061 g012
Figure 13. Map of noise exposure with various large and small noise data-based methods. Prediction demarcates health hazard zones within the blue boundary having over 105 dB(A) of noise exposure levels and the zone within the yellow boundary having over 85 dB(A) of noise exposure levels.
Acoustics 05 00061 g013
Figure 14. Deviation between the observed and predicted noise levels in dB(A) for 10 sample points using the ANN prediction technique.
Acoustics 05 00061 g014
Table 1. Detailed description of the hardware and software used for data collection, prediction (modeling), and mapping.
Name of Instruments and SoftwareModel/VersionPurpose
High-grade sound pressure level meterCESVA SC-310Measuring and capturing noise data
Total station and GPSTrimble M3 and Trimble JunoCollection of coordinates for the selected location
Mapping softwareArcGIS 10.2 and Simulation ModelMapping and prediction
MATLAB—MathWorks2009–2022Modeling and prediction
Table 2. Noise levels were calibrated using a sound pressure level meter for H, M, and L traffic congestions, which were determined using Google Road traffic navigation color codes.
Color Range Value
dB(A)
Average (Medium Traffic Load dB(A))High Traffic Load (+7),
dB(A)
Low Traffic Load (−7),
dB(A)
Red96–11010311096
Orange81–95889581
Green/Blue65–79727965
Table 3. The table shows Google Navigation-based noise data monitoring.
S.No.XYHigh (4–6 p.m.) dB(A)Medium (9–11 a.m.)
dB(A)
Low (1–3 p.m.)
dB(A)
181.2410926.24493797265
281.2413326.24458958881
381.2418226.2440511010396
481.2418826.2438211010396
581.2415626.2433958881
681.2414826.24314958881
781.2413526.24279797265
881.2411626.24327797265
981.2410226.24433797265
1081.2413926.24376797265
1181.2412726.24349958881
1281.2421226.2442311010396
1381.2411526.24481797265
1481.2419226.2440111010396
1581.2417226.24349958881
1681.2413726.2429797265
1781.2419426.2438611010396
1881.2415626.24437958881
1981.2411826.2448797265
2081.2416326.24335797265
2181.2399126.24384555555
2281.2405526.24342575757
2381.2403826.24371575757
Table 4. The ANN model training with epoch, performance, gradient, mu, and validation check.
Algorithm
Data DivisionRandom
TrainingLevenberg-Marquardt
PerformanceMean Squared Error
CalculationMEX
Progress
Epoch35 iterations
Time0:00:0
Performance 3.25 × 10 19
Gradient 5.38 × 10 8
Mu 1 × 10 11
Validation Check0
Table 5. Vehicular cluster variants and their noise dB(A) value.
S. NoNo. of Vehicles (Large)No. of Vehicles (Medium)No. of Vehicles (Small)Total No. of VehiclesNoise db(A) Value
13126100
23328105
3222698
44228106
5222696
6222695
7221595
8122585
9121481
10123581
11123579
12113575
13112470
14022468
15022465
Table 6. Equivalent noise level for different frequencies.
TimedB Value Frequency (31.5 Hz)dB Value Frequency
(2 KHz)
dB Value Frequency
(16 KHz)
20 min74.567.153.5
25 min81.273.459.2
15 min62.355.145
Table 7. Noise exposure levels for 12 h.
Traffic Noise Value
dB(A)
Noise Exposure Value for 12 h
dB(A)
105106.8
9697.8
9192.8
8687.8
8283.8
7778.8
7273.8
6768.8
6263.8
Table 8. Observed noise data and their predicted noise levels using five prediction techniques, with deviations and average deviation for each technique at all different time’s high value (4–6 p.m.), medium value (9–11 a.m.), and low Value (1–3 p.m.).
S.No.ObservedPredicted Large DataDev.Avg. Dev.Predicted Small DataDev.Avg. Dev.Predicted Source Average DataDev.Avg. Dev.Google Navigation DataDev.Avg. Dev.ANN
Prediction
Dev.Avg. Dev.
1105–110105–1100097–1046–8796–10199101–1100–52.5105–1090–10.5
2105–11097–1008–10995–100101096–1019987–921818103–1082–22
3100–10497–1003–43.585–9113–151492–968887–9212–1312.597–1022–32.5
485–9191–976695–998–10996–10110–1110.581–874489–910–42
585–9192–965–7694–987–9890–954–54.581–874488–922–32.5
679–8587–916–8790–9510–1110.570–769–111076–813–43.582–832–32.5
779–8582–861–3285–883–64.566–7113–1413.571–768–98.582–850–31.5
873–7976–812–32.579–845–65.560–6413–1413.565–718876–812–32.5
973–7966–707–9864–689–111055–5918–201960–6513–1413.569–7544
1065–7261–674–54.555–6110–1110.555–6010–121155–6010–121162–702–32.5
Ten sample results are exhibited.
Table 9. The average deviations in prediction for five prediction techniques.
Sample Observation No.Avg Dev. Large Data
±dB(A)
Avg Dev. Small Data
±dB(A)
Avg Dev. Source Avg. ±dB(A)Avg Dev. Google Navigation Data
±dB(A)
Avg. ANN Prediction
±dB(A)
10792.50.5
29109182
33.514812.52.5
46910.542
5684.542.5
6710.5103.52.5
724.513.58.51.5
82.55.513.582.5
98101913.54
104.510.511112.5
Mean4.858.910.88.552.3
Standard Deviation2.862.763.895.150.78
Table 10. One-way ANOVA Test with all five prediction models.
ANOVA: Single Factor
SUMMARY
GroupsCountSumAverageVariance
Column 11048.54.858.17
Column 210898.97.65
Column 31010810.815.17
Column 41085.58.5526.58
Column 510232.30.62
ANOVA
Source of VariationSSdfMSFp-valueF crit
Between Groups471.334117.8310.12 6.25072 × 10 6 2.59
Within Groups523.854511.64
Total995.1849
SS—sum of square; df—degree of freedom; MS—mean square; F—F static; p-value—probability; F crit—F critical.
Table 11. One-way ANOVA Test with three prediction models.
ANOVA: Single Factor
SUMMARY
GroupsCountSumAverageVariance
Column 110898.97.65
Column 21010810.815.17
Column 31085.58.5526.58
ANOVA
Source of VariationSSdfMSFp-valueF crit
Between Groups29.32214.660.890.423.35
Within Groups444.732716.47
Total474.0429
Table 12. One-way ANOVA Test with two prediction models.
ANOVA: Single Factor
SUMMARY
GroupsCountSumAverageVariance
Column 11089.008.97.66
Column 21085.508.5526.58
ANOVA
Source of VariationSSdfMSFp-valueF crit
Between Groups0.6110.610.0360.854.41
Within Groups308.121817.11
Total308.7319
Disclaimer/Publisher’s Note: The statements, opinions and data contained in all publications are solely those of the individual author(s) and contributor(s) and not of MDPI and/or the editor(s). MDPI and/or the editor(s) disclaim responsibility for any injury to people or property resulting from any ideas, methods, instructions or products referred to in the content.

