
Electrochemical Evolution of Carbon Steel and Fe-9% Cr Steel Rebar in Simulated Concrete Pore Solution (SCPS) in the Presence of 3.5 wt% NaCl


Abstract
:1. Introduction
2. Materials and Methods
2.1. Materials
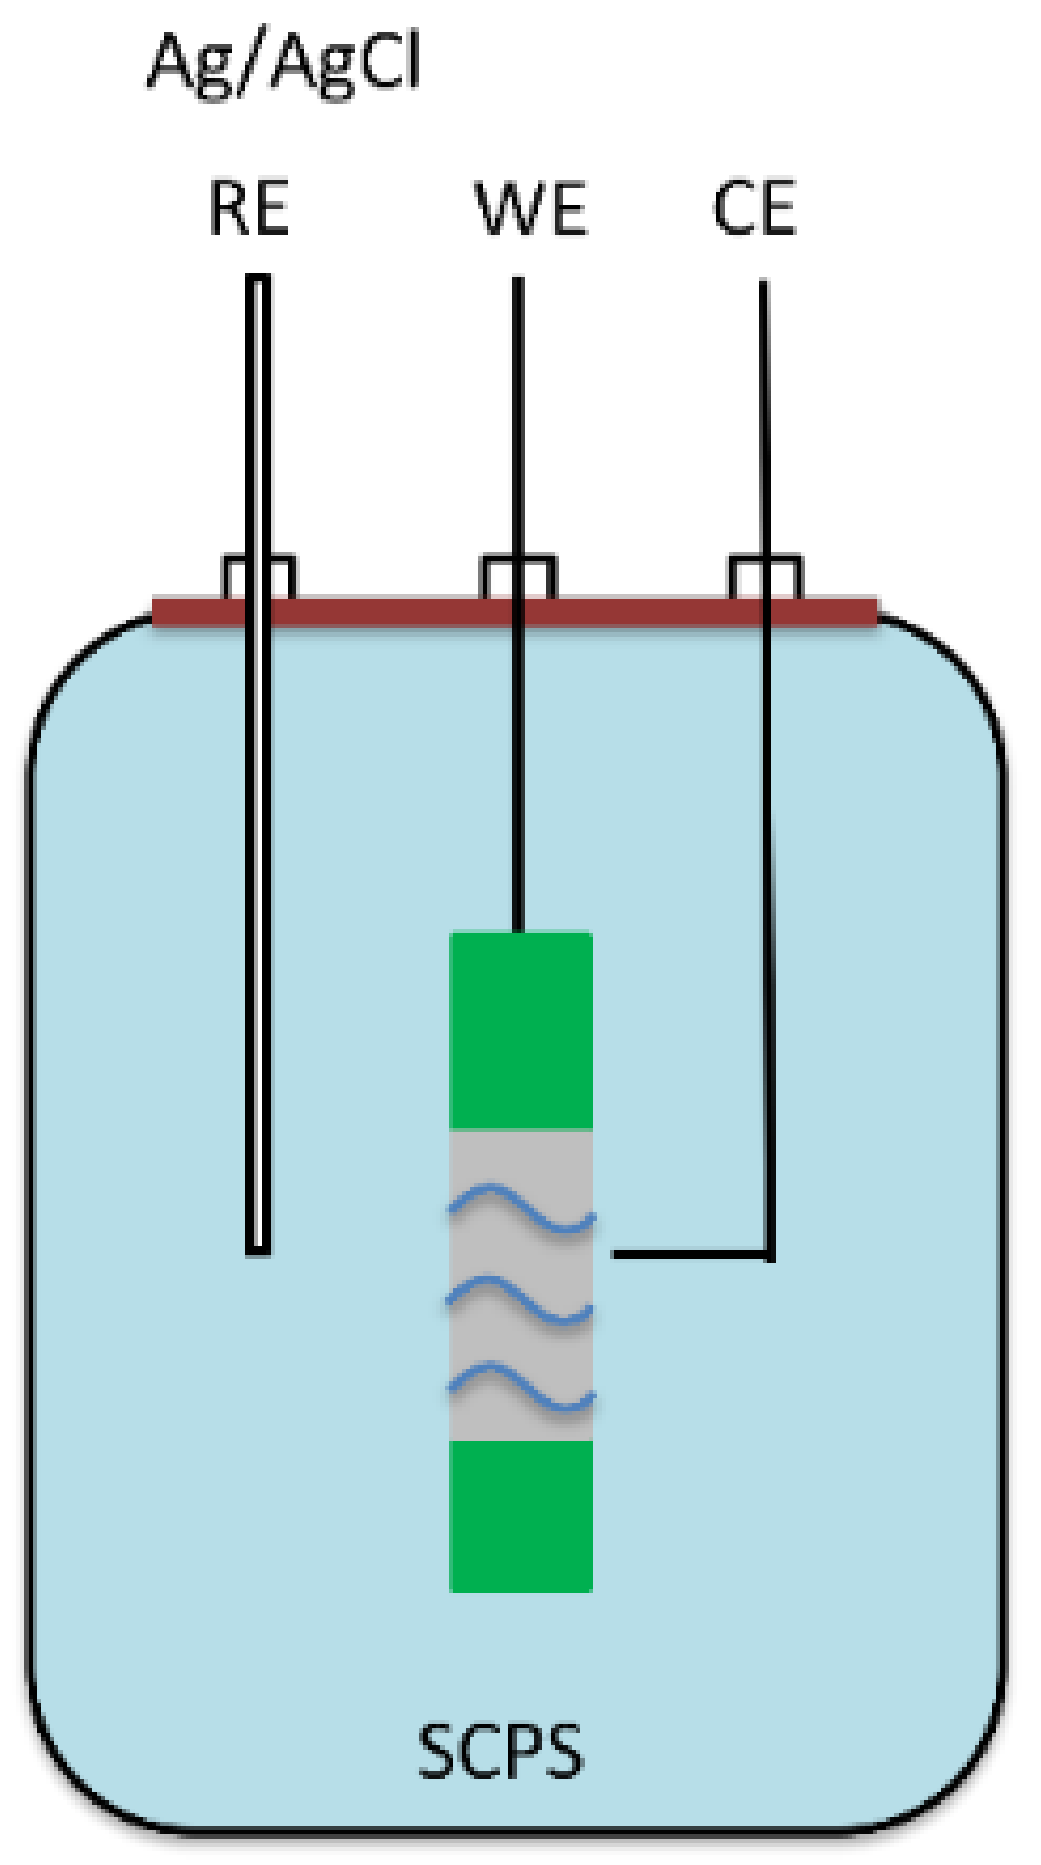
2.2. Experimental Setup
2.3. Electrochemical Measurements
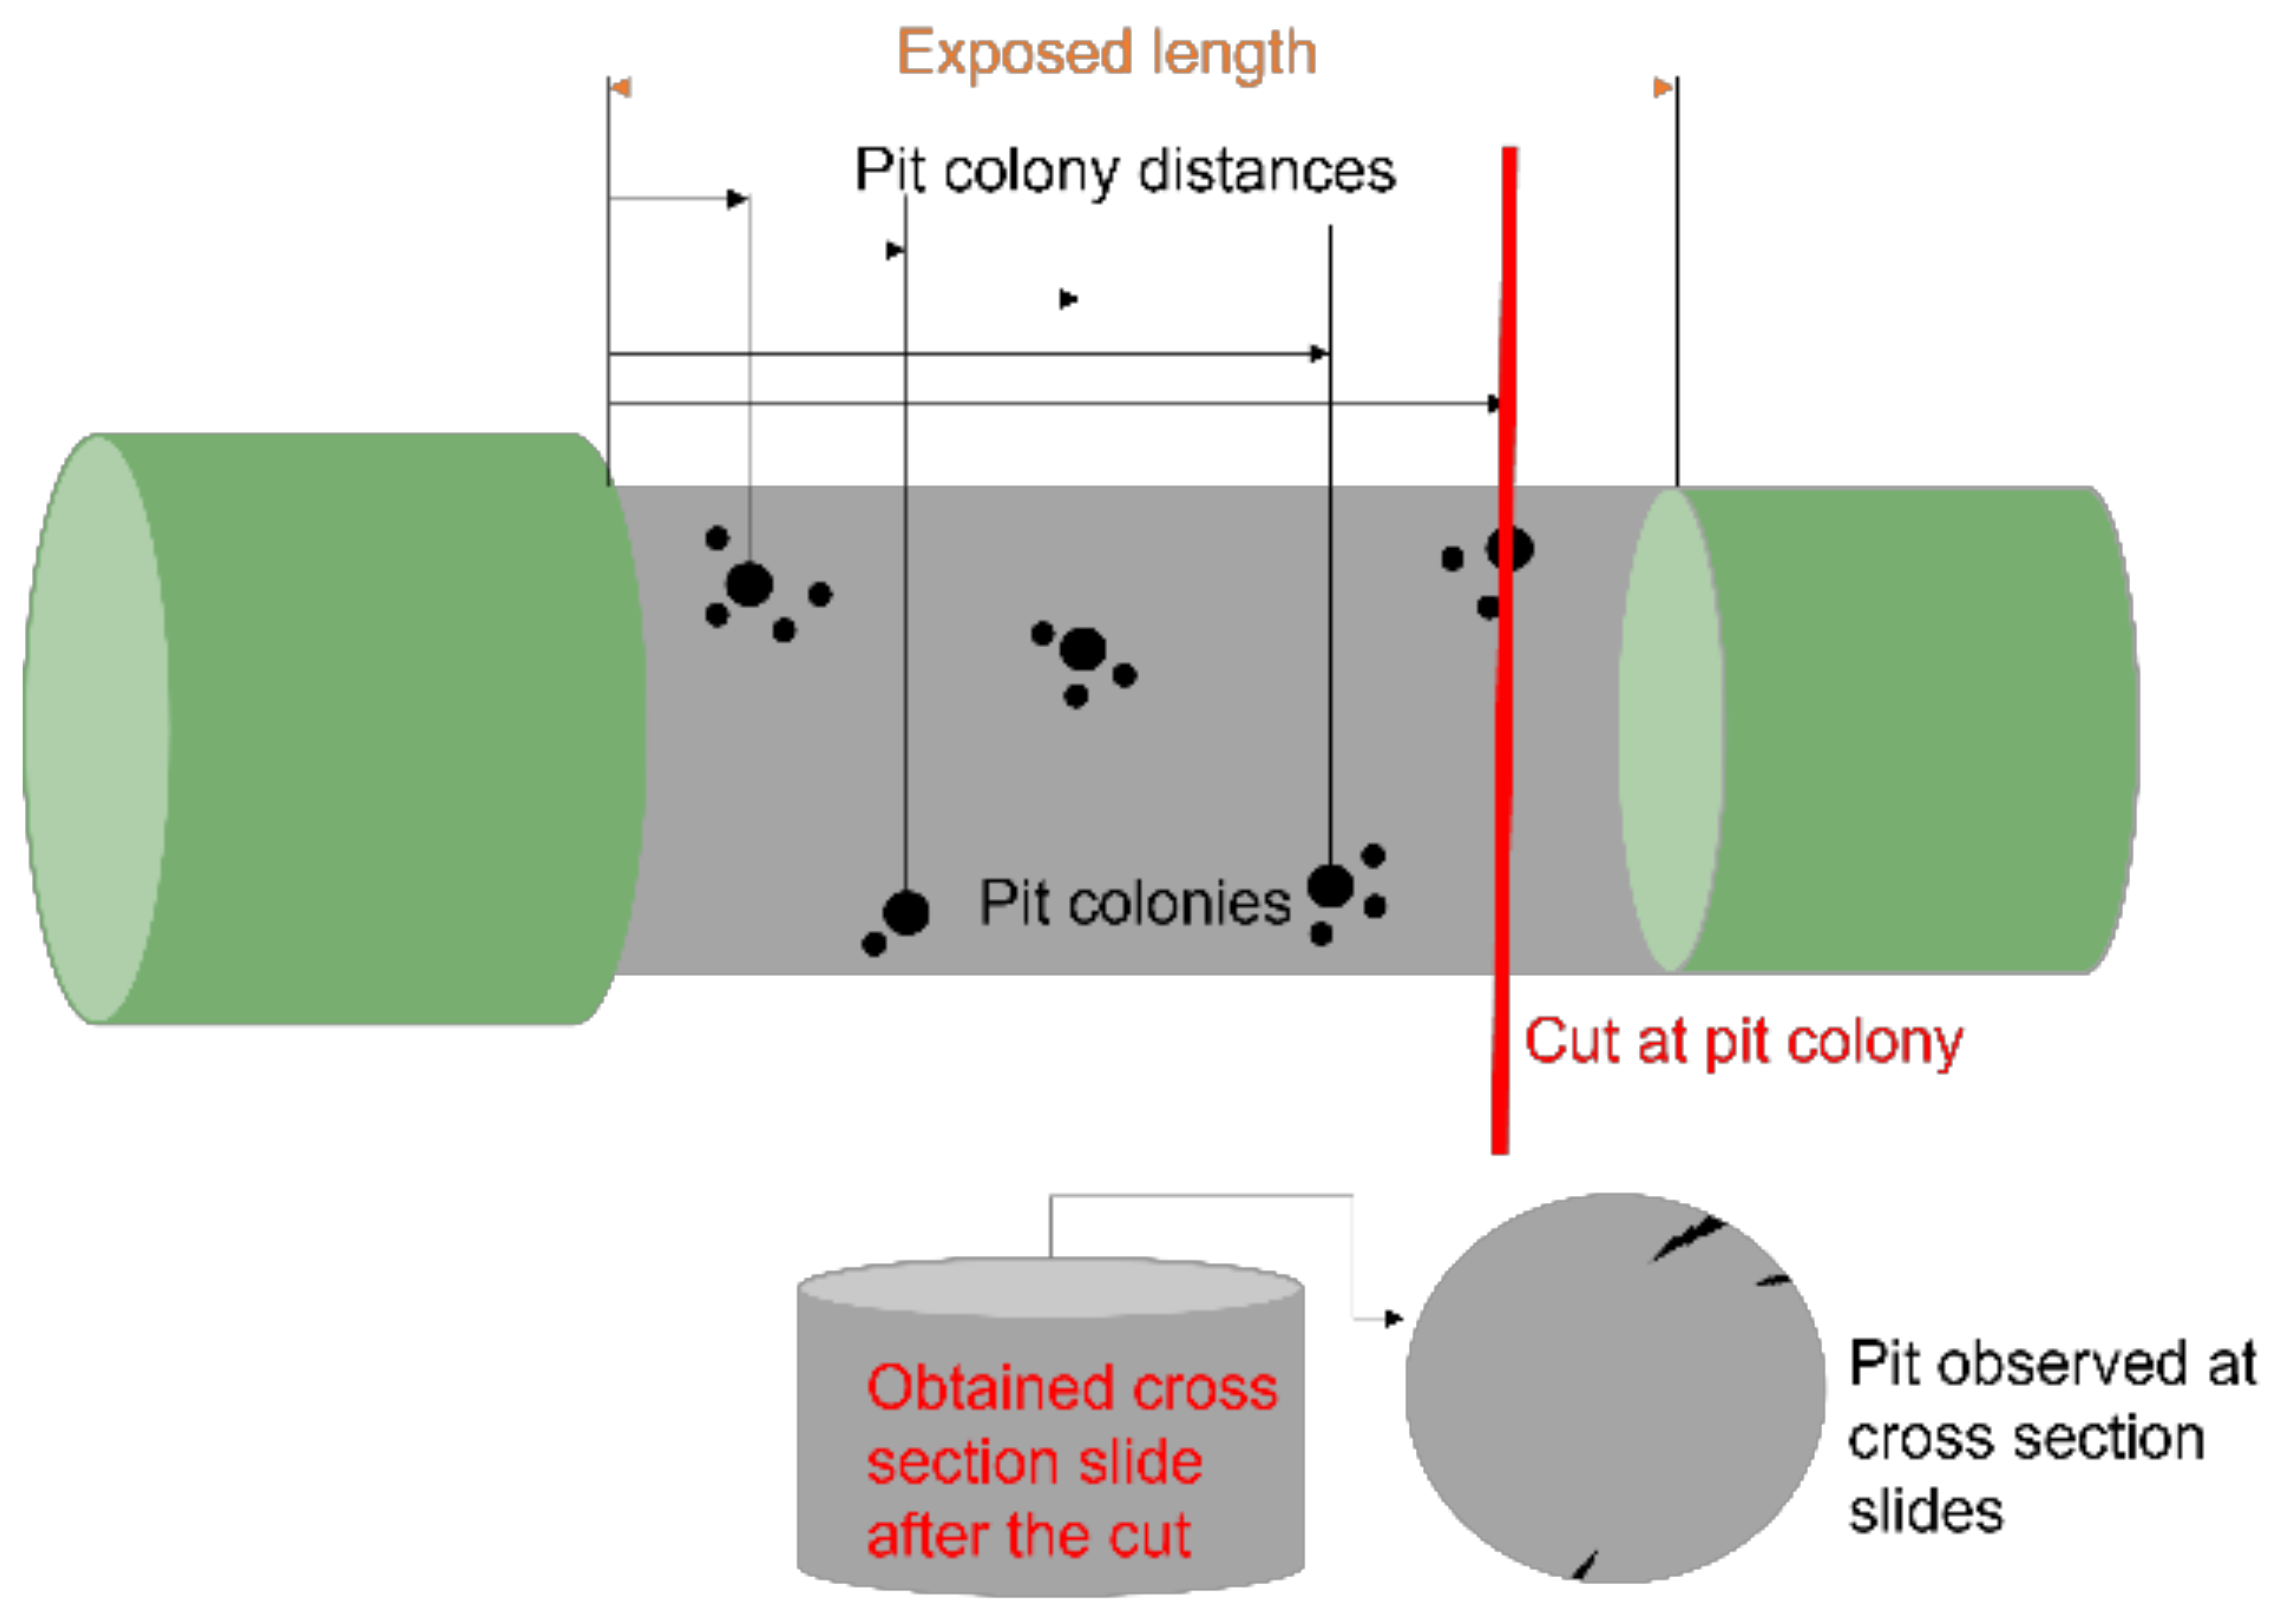
2.4. Surface Characterization
3. Results and Discussion
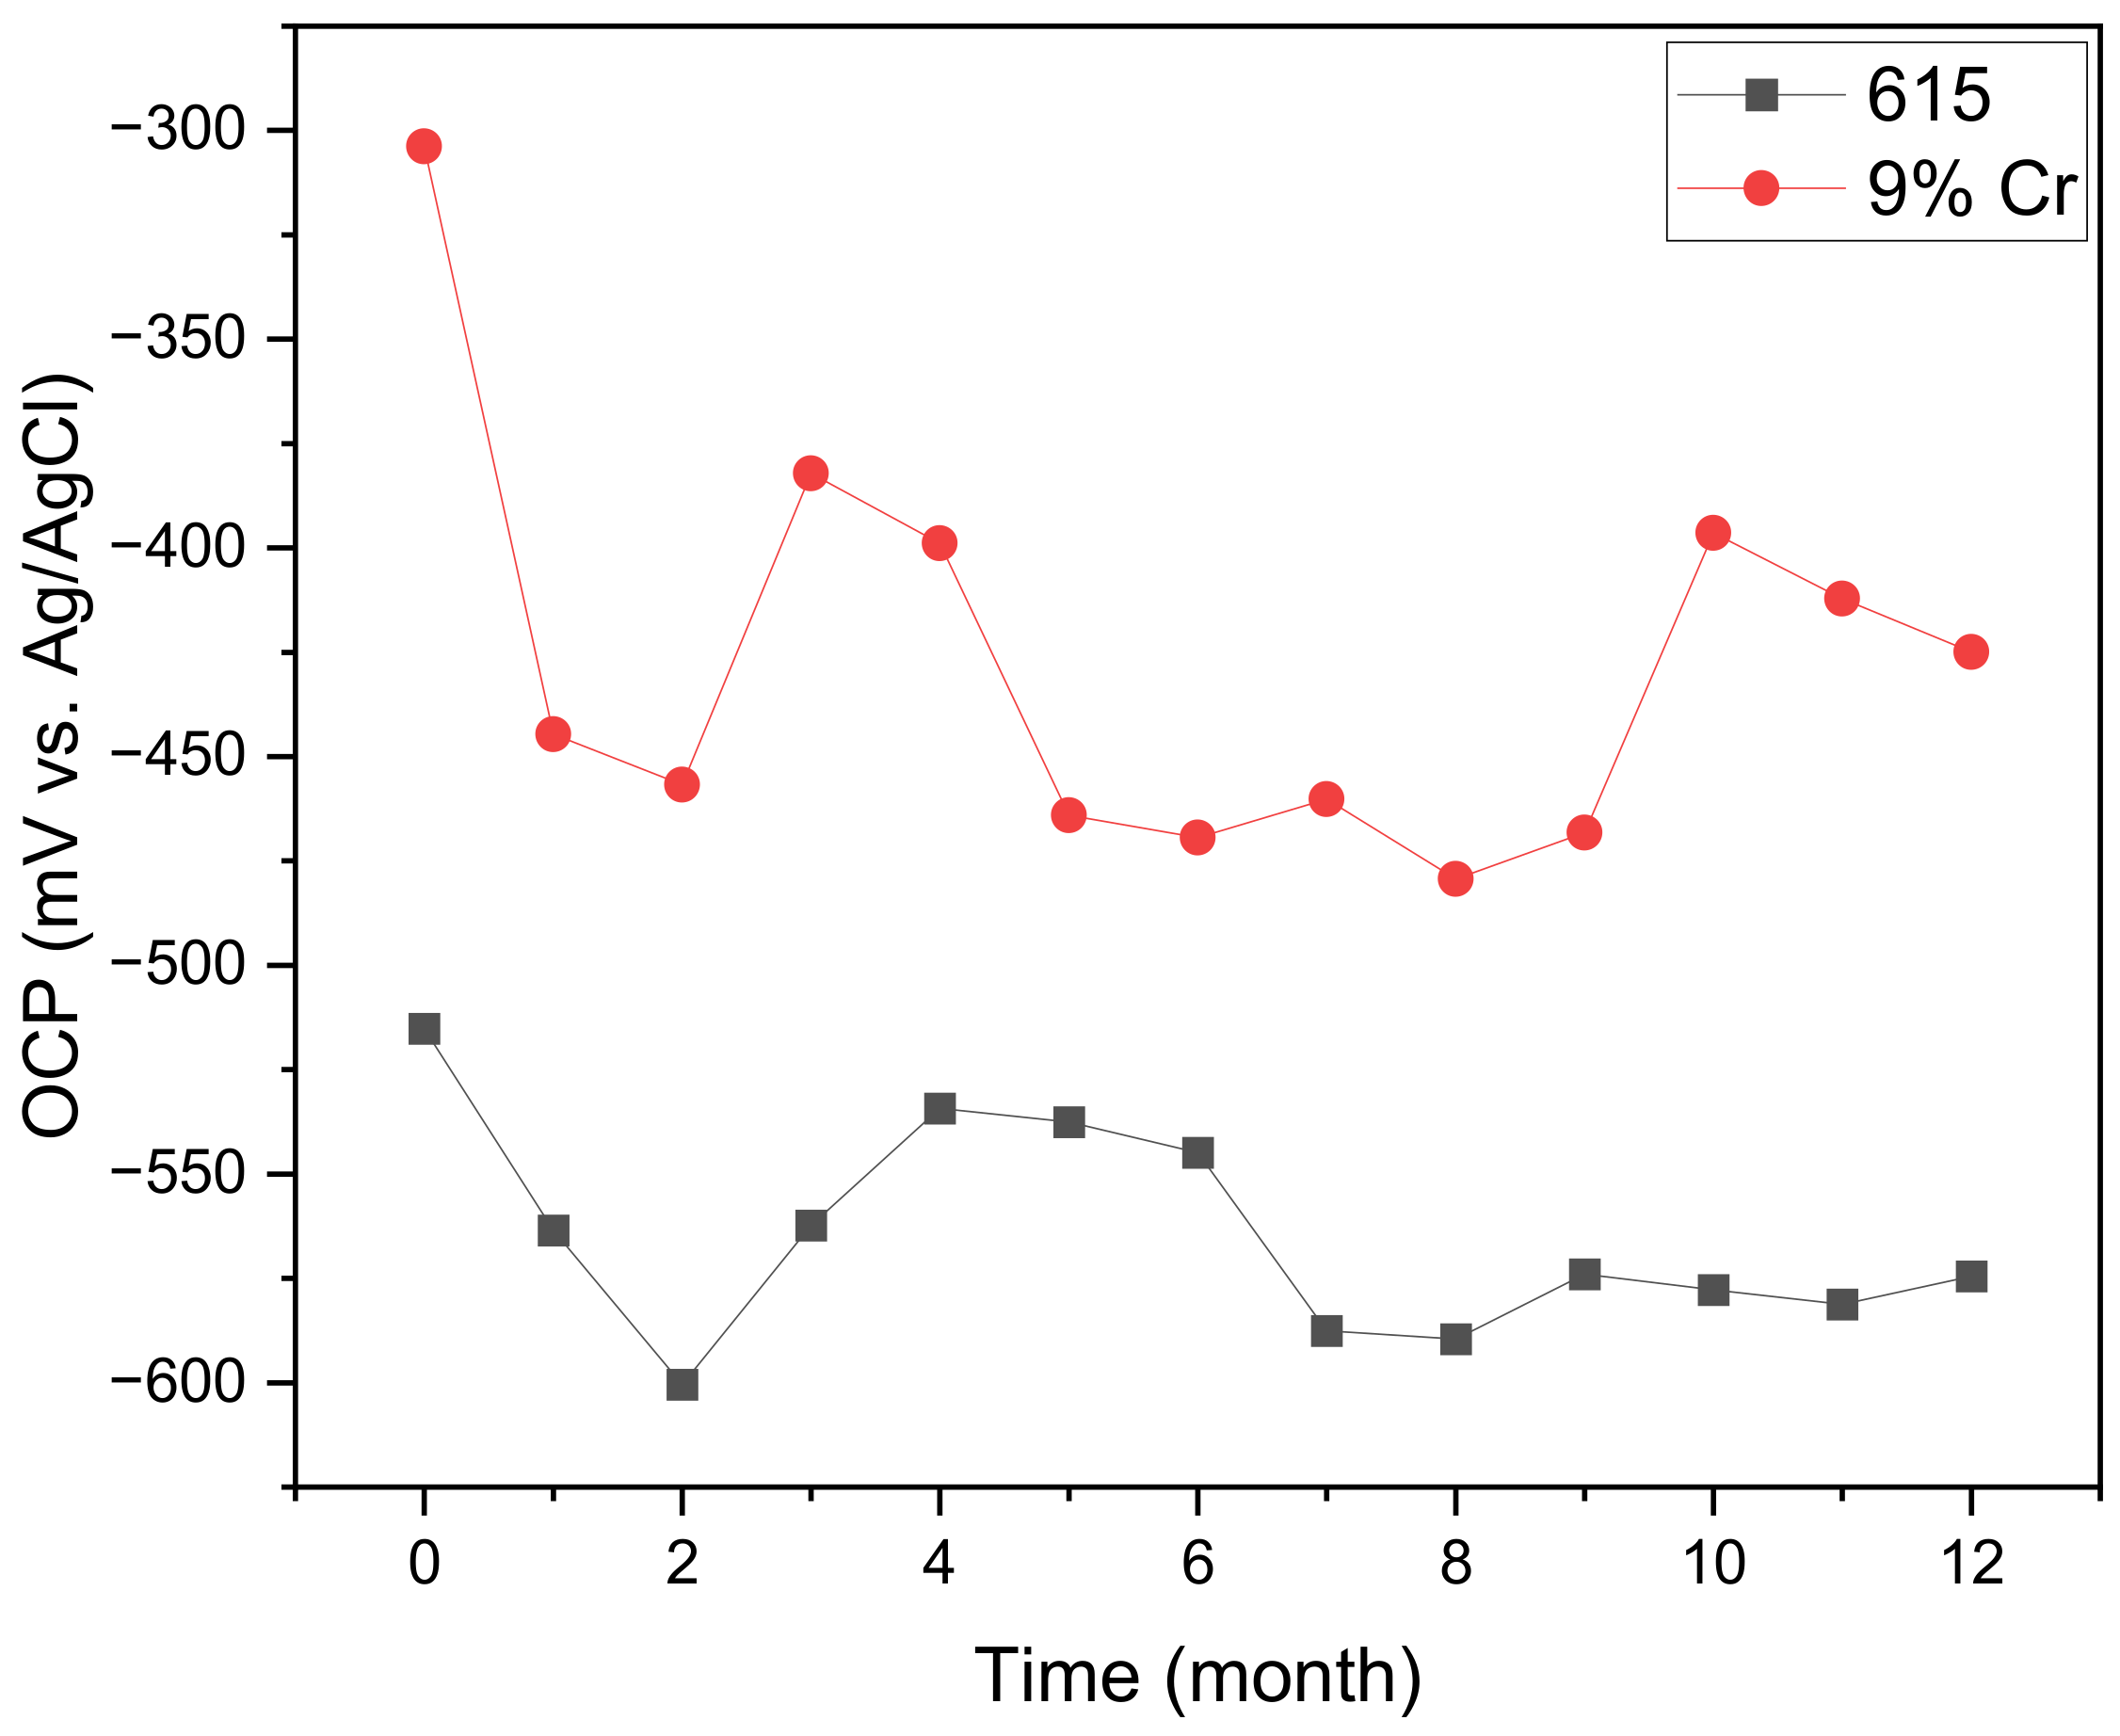
3.1. OCP Analysis
3.2. LPR Analysis
3.3. EIS Analysis
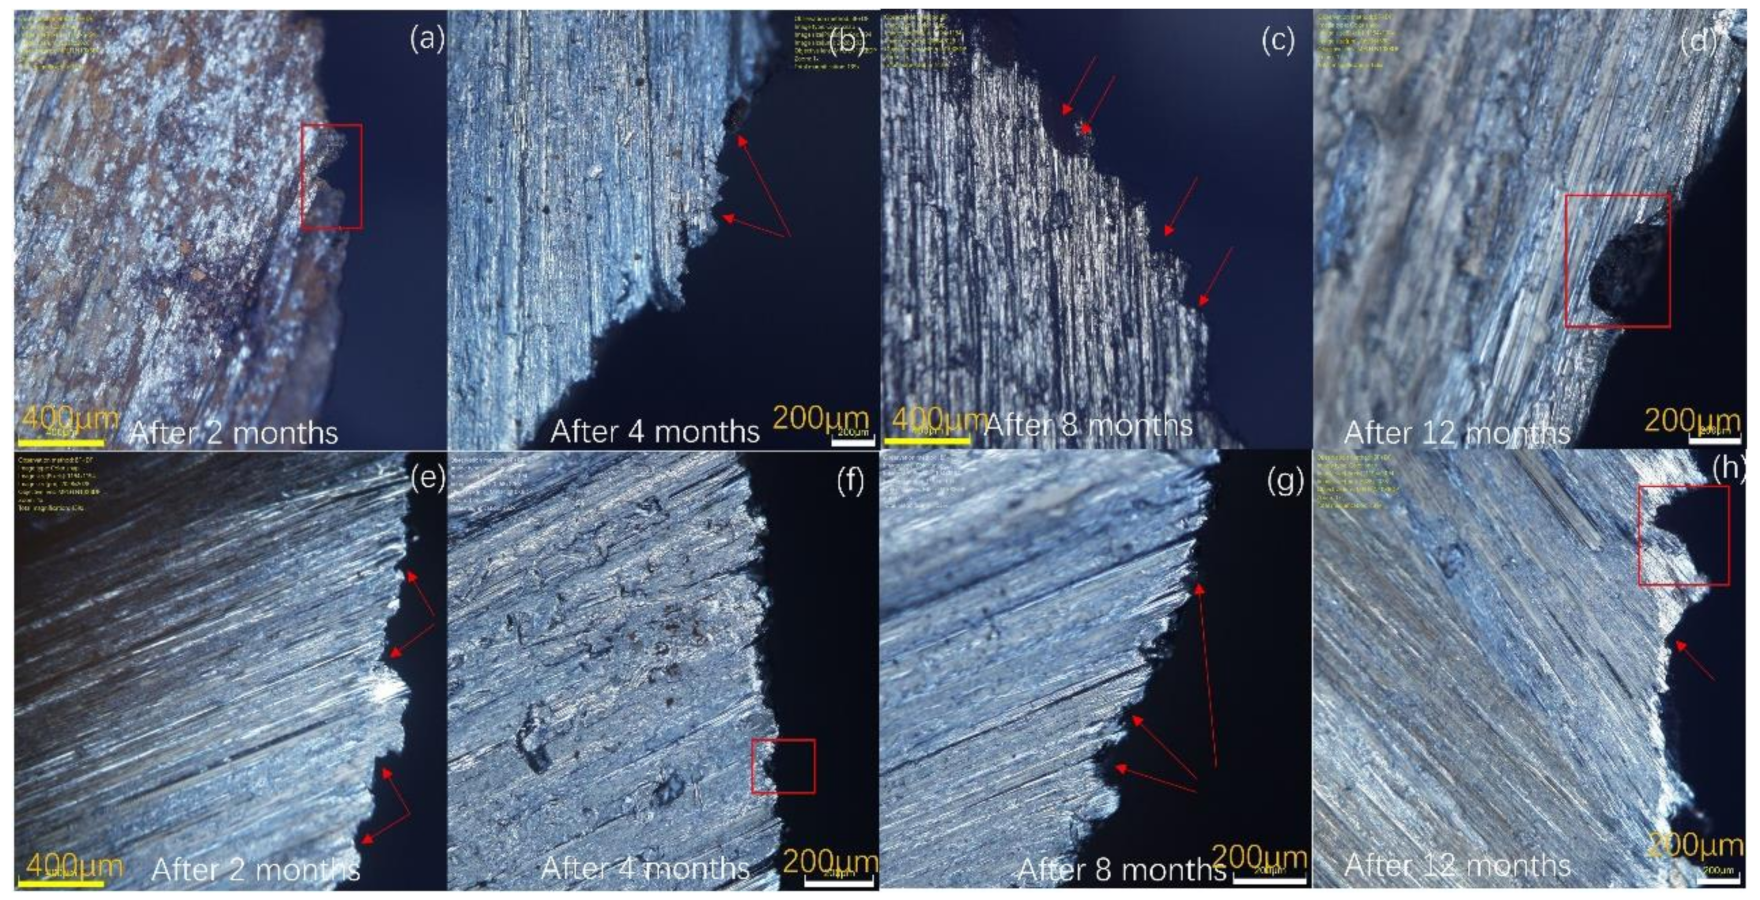
3.4. Surface Analysis
4. Conclusions
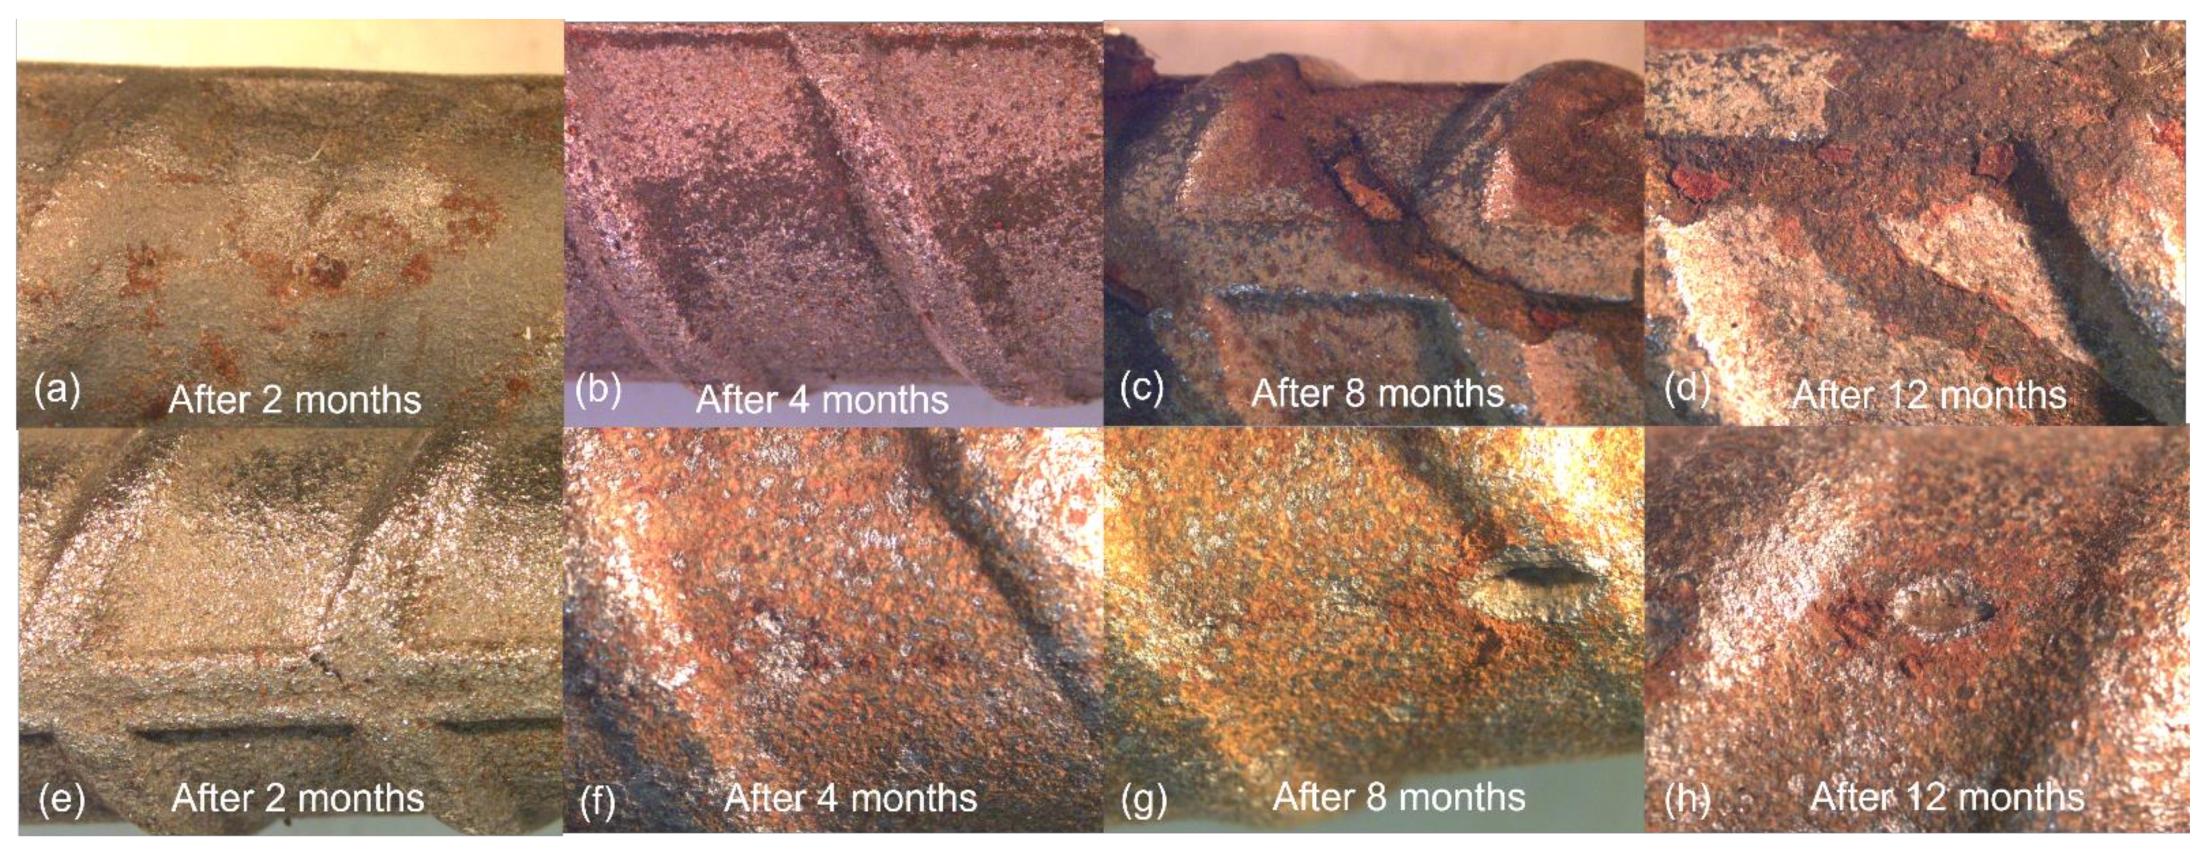
- The formation of corrosion products provided a temporary protective layer, but the layer eventually failed for 615. However, Cr promoted the formation of a protective layer exhibiting better corrosion resistance.
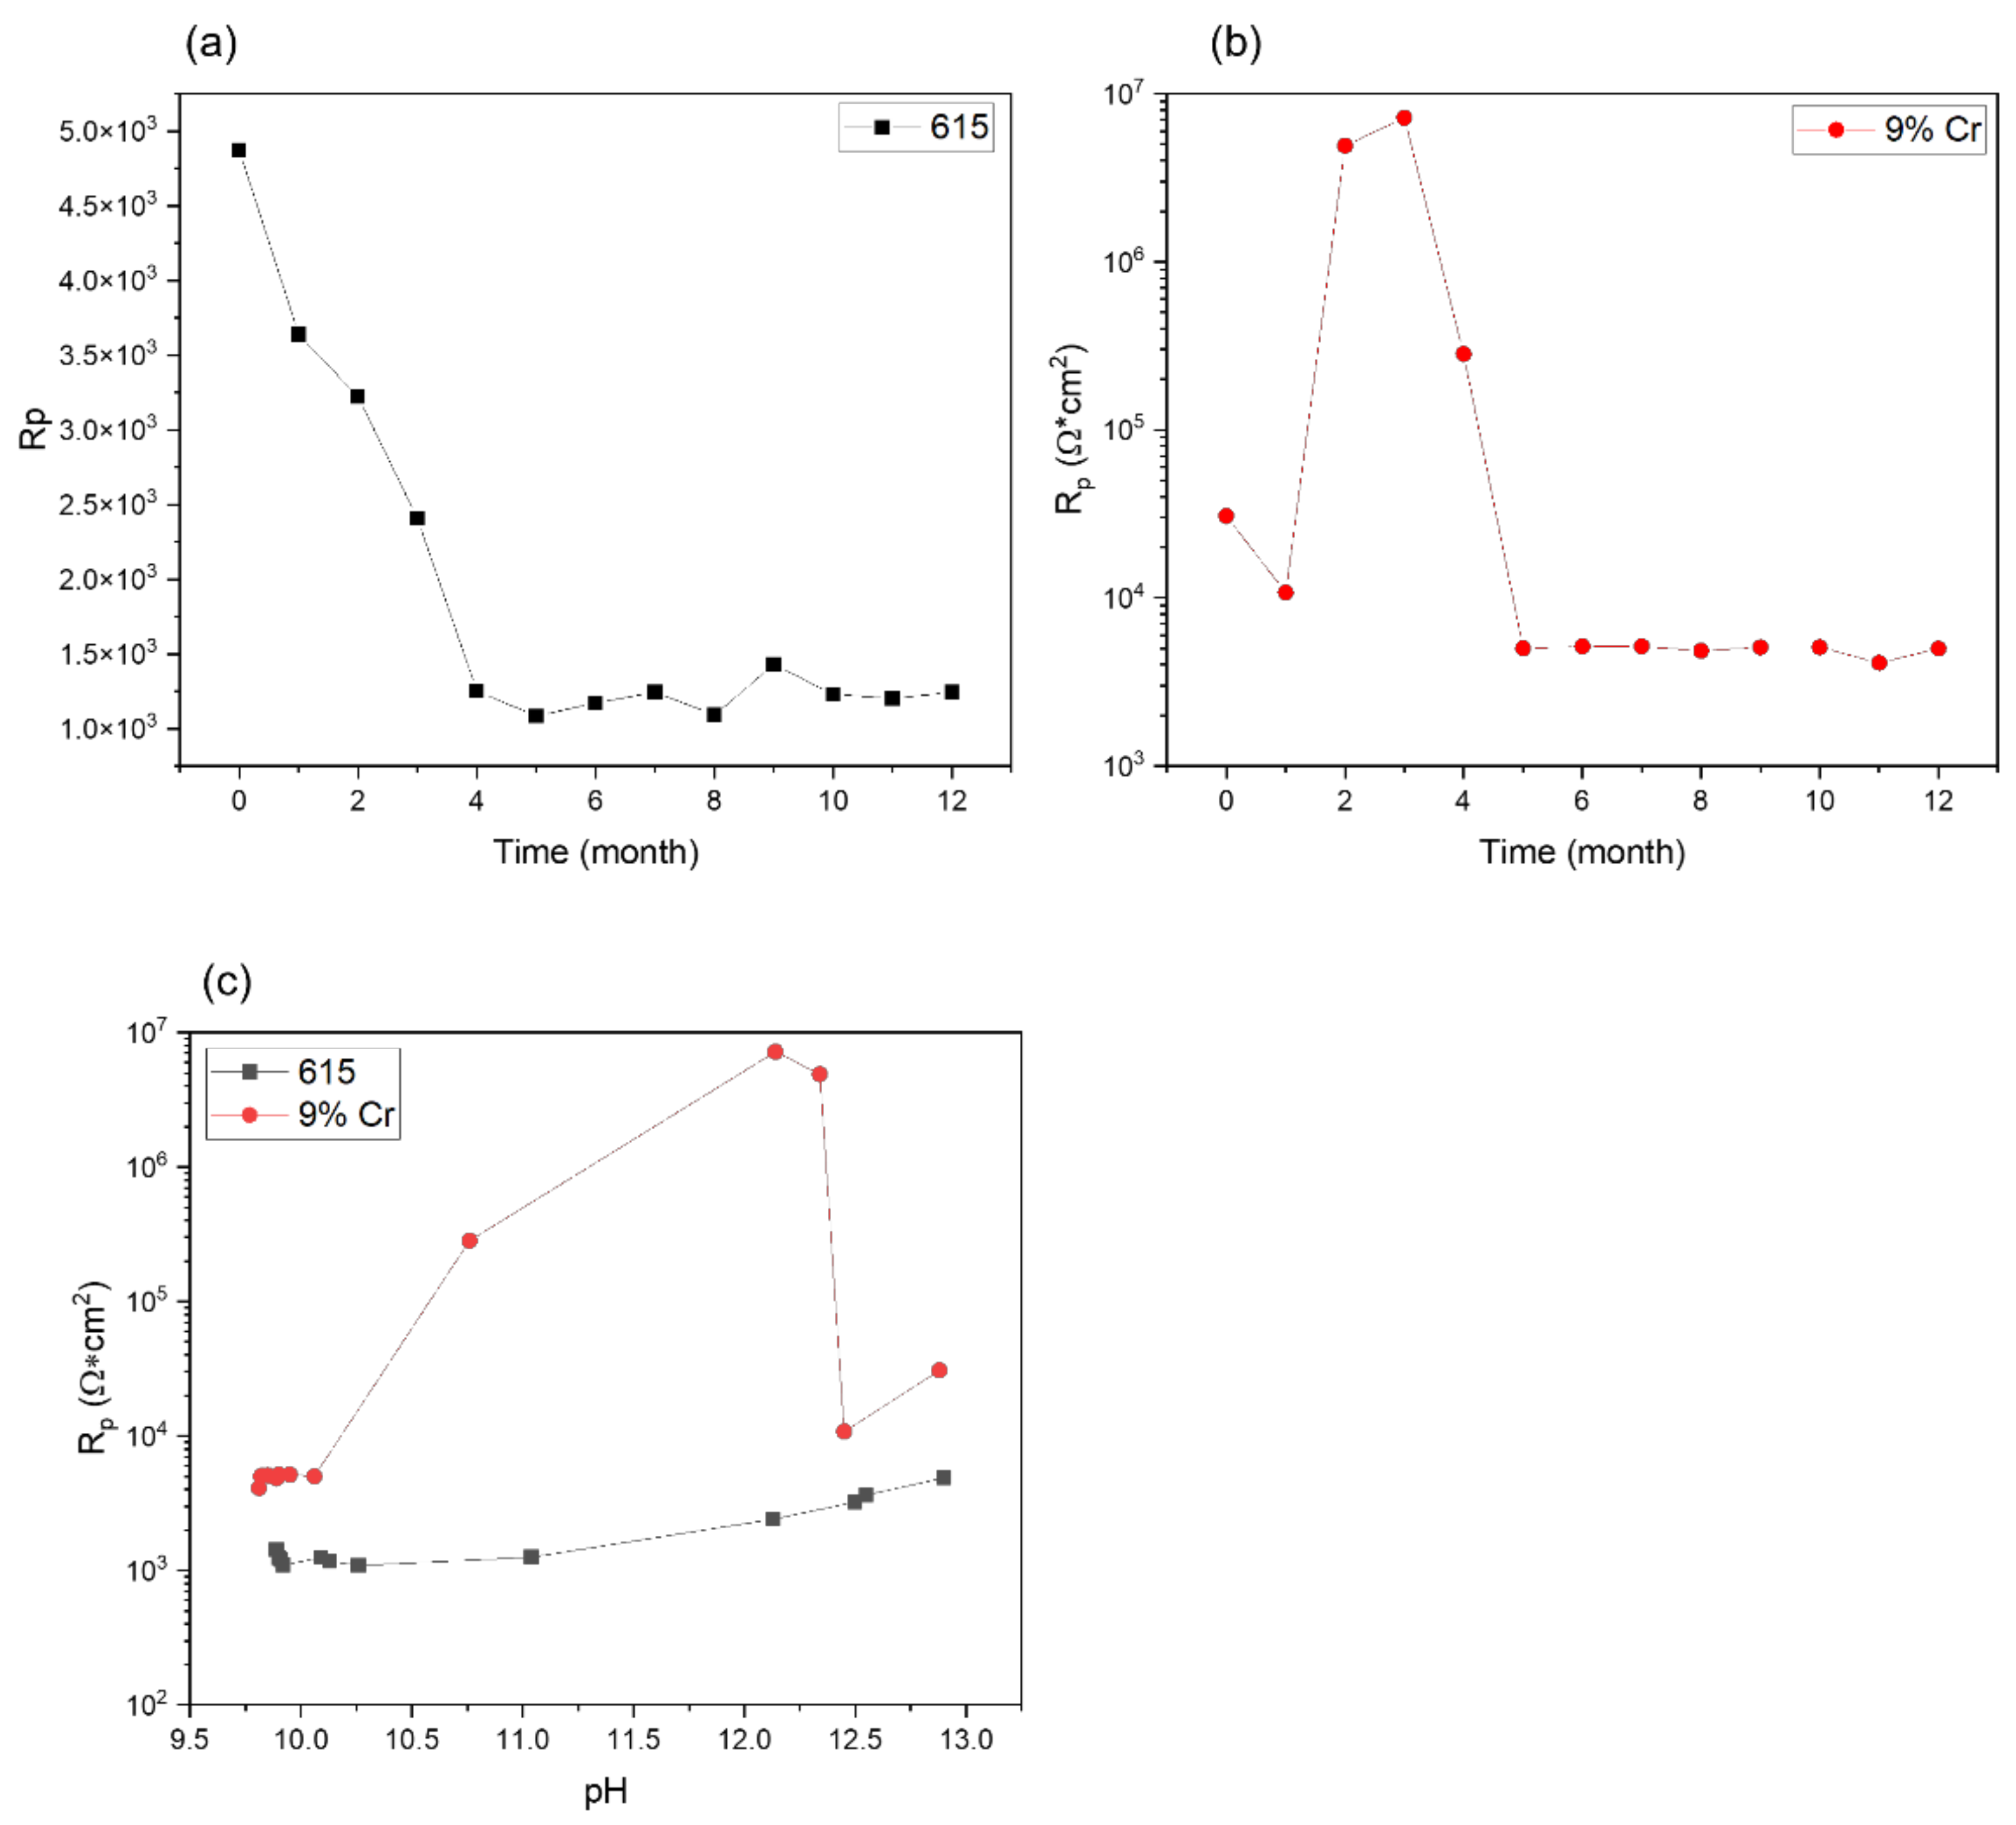
- The additional Cr content increased the material′s corrosion resistance, with an approximately five times lower corrosion rate after 12 months of immersion, on the basis of electrochemical testing.
- ASTM A1035-CS (9% Cr) rebar showed better performance in overall corrosion resistance than ASTM A615.
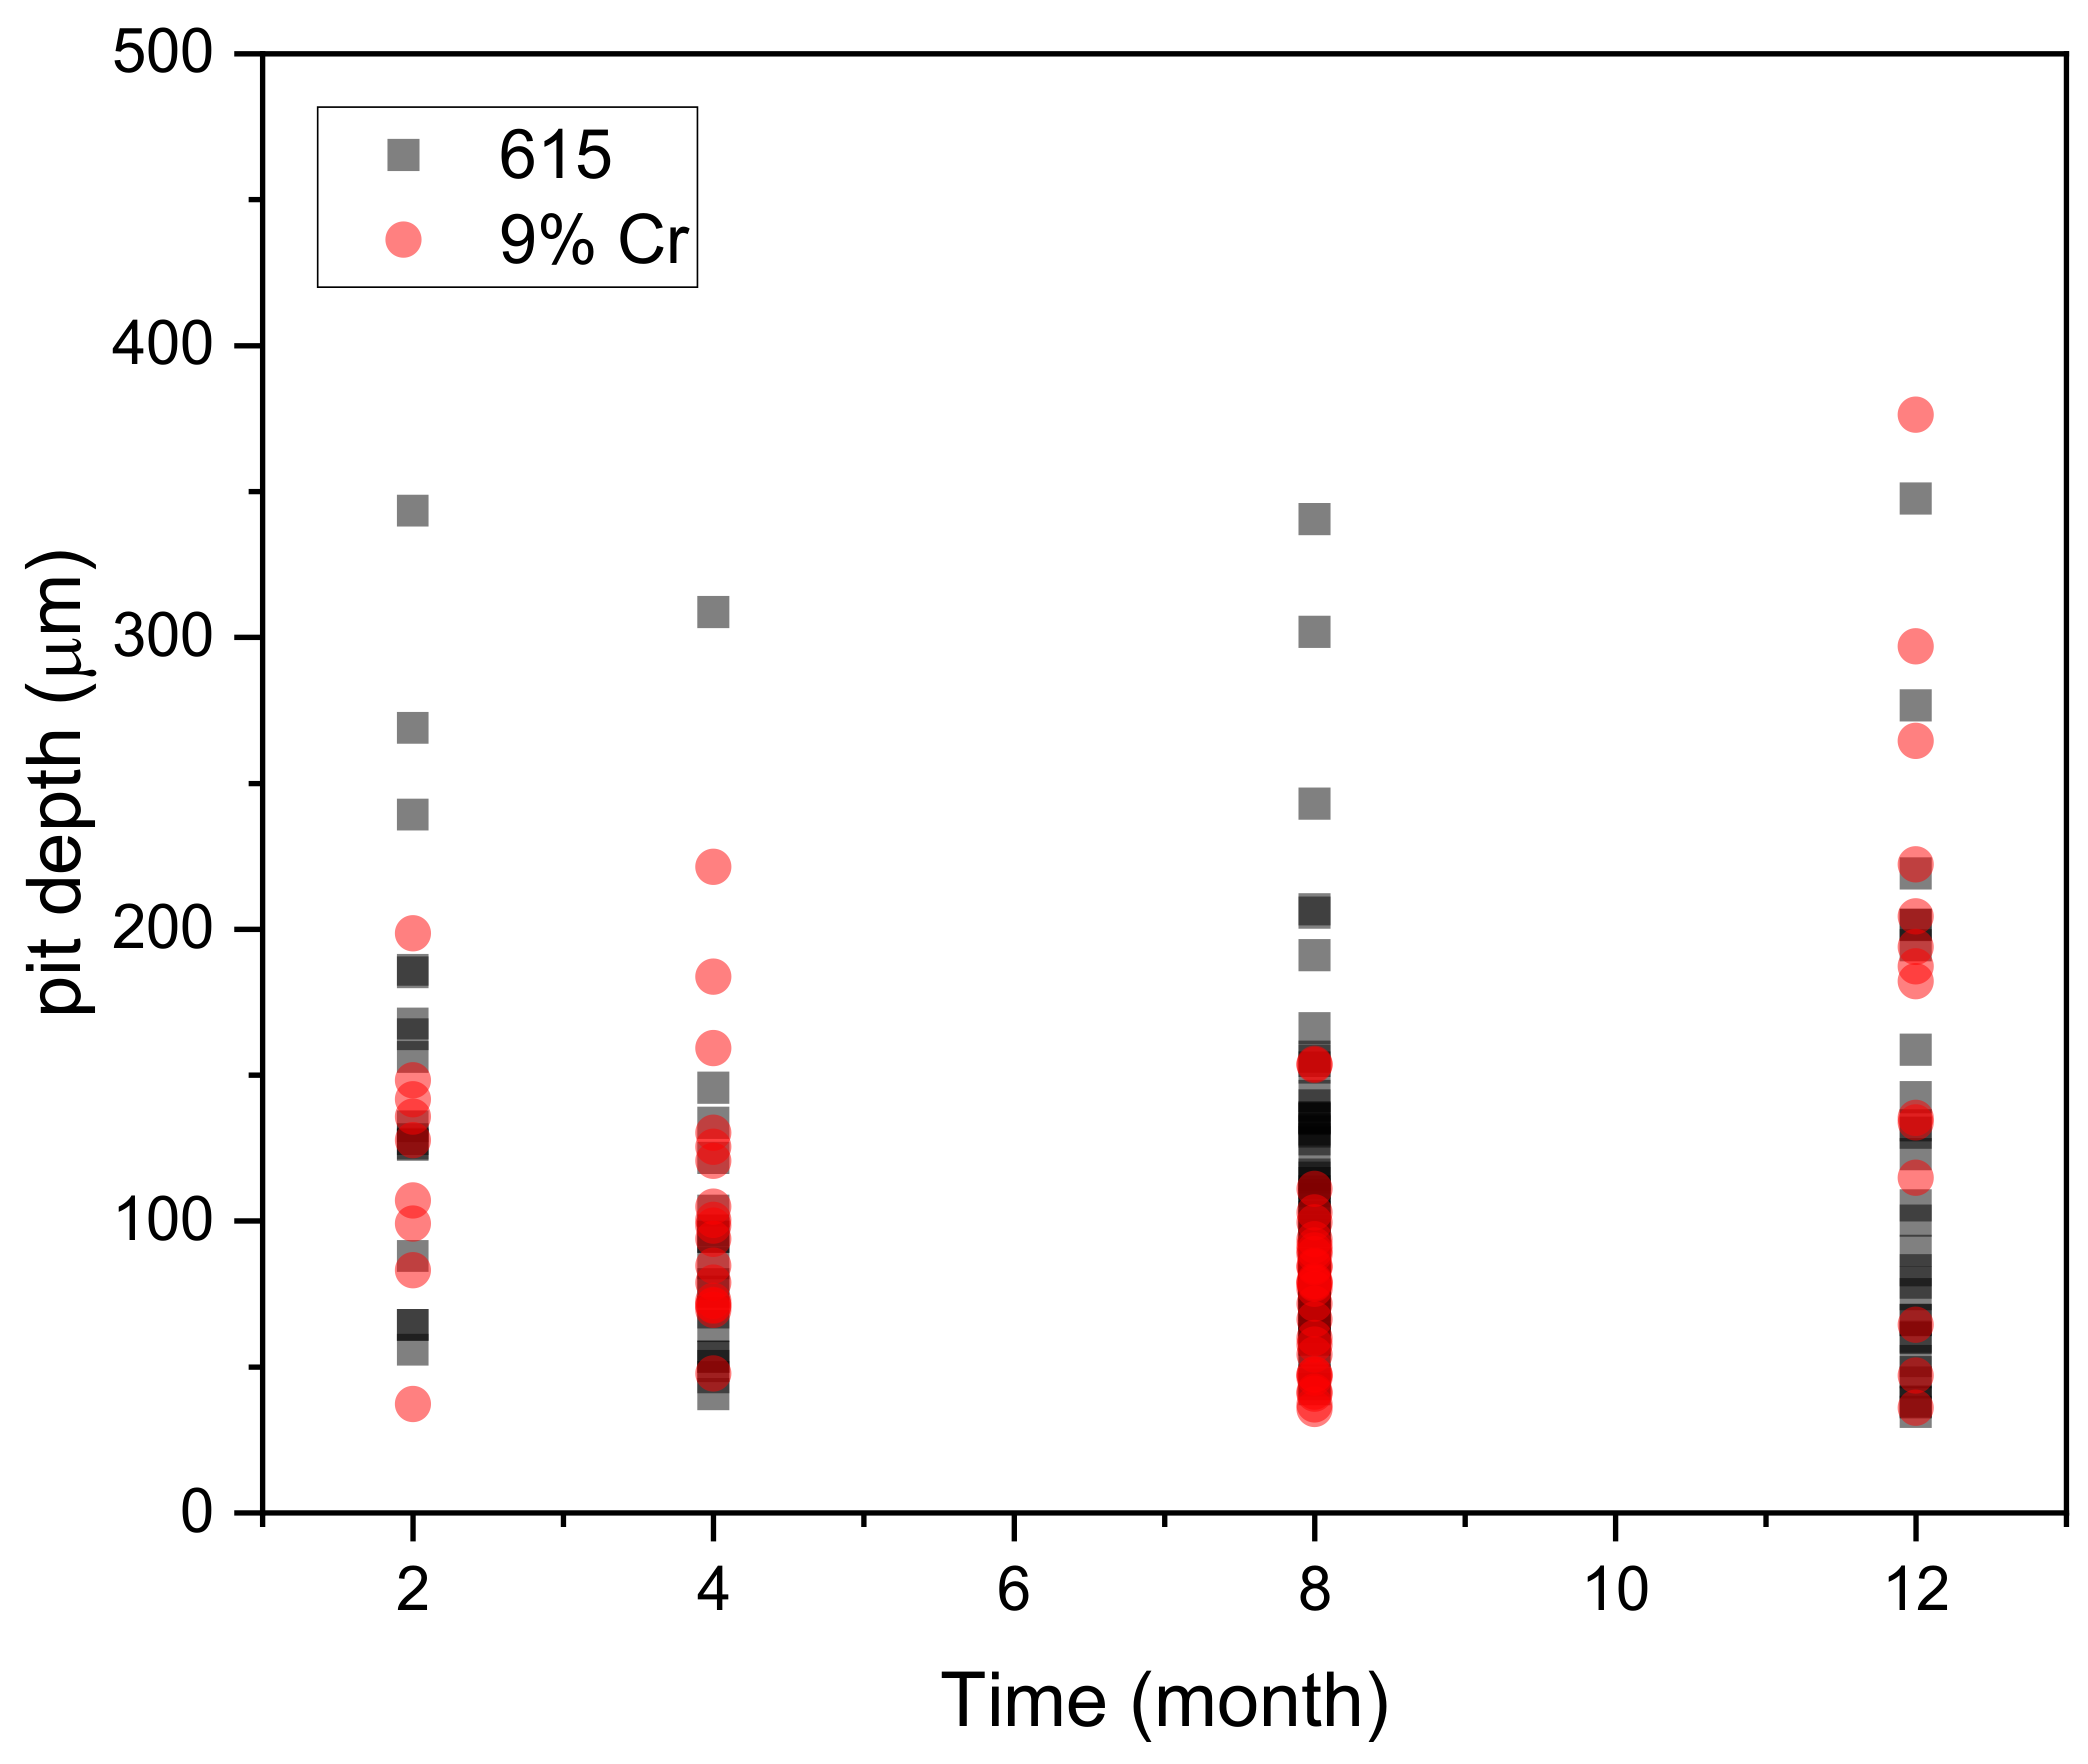
- Most pit depth values for both materials are concentrated in the range of 100–200 µm.
- ASTM A1035-CS (9% Cr) rebar in general was less affected by localized attack than ASTM A615, because it showed a smaller average pit depth distribution and magnitude.
Author Contributions
Funding
Institutional Review Board Statement
Informed Consent Statement
Data Availability Statement
Acknowledgments
Conflicts of Interest
References
- Liu, M.; Cheng, X.; Li, X.; Jin, Z.; Liu, H. Corrosion behavior of Cr modified HRB400 steel rebar in simulated concrete pore solution. Constr. Build. Mater. 2015, 93, 884–890. [Google Scholar] [CrossRef]
- Cook, W.; Barr, P.J.; Halling, M.W. Bridge failure rate. J. Perform. Constr. Facil. 2015, 29, 04014080. [Google Scholar] [CrossRef]
- Zhu, Y.; Macdonald, D.D.; Yang, J.; Qiu, J.; Engelhardt, G.R. Corrosion of rebar in concrete. Part II: Literature survey and statistical analysis of existing data on chloride threshold. Corros. Sci. 2021, 185, 109439. [Google Scholar] [CrossRef]
- Angst, U.; Elsener, B.; Larsen, C.K.; Vennesland, Ø. Critical chloride content in reinforced concrete—A review. Cem. Concr. Res. 2009, 39, 1122–1138. [Google Scholar] [CrossRef]
- Macdonald, D.D.; Zhu, Y.; Yang, J.; Qiu, J.; Engelhardt, G.R.; Sagüés, A.; Sun, L.; Xiong, Z. Corrosion of rebar in concrete. Part IV. On the theoretical basis of the chloride threshold. Corros. Sci. 2021, 185, 109460. [Google Scholar] [CrossRef]
- Köliö, A.; Honkanen, M.; Lahdensivu, J.; Vippola, M.; Pentti, M. Corrosion products of carbonation induced corrosion in existing reinforced concrete facades. Cem. Concr. Res. 2015, 78, 200–207. [Google Scholar] [CrossRef]
- Naik, T.R.; Singh, S.S.; Hossain, M.M. Permeability of concrete containing large amounts of fly ash. Cem. Concr. Res. 1994, 24, 913–922. [Google Scholar] [CrossRef]
- Khan, S.U.; Nuruddin, M.F.; Ayub, T.; Shafiq, N. Effects of different mineral admixtures on the properties of fresh concrete. Sci. World J. 2014, 2014, 986567. [Google Scholar] [CrossRef]
- Chan, Y.-W.; Chu, S.-H. Effect of silica fume on steel fiber bond characteristics in reactive powder concrete. Cem. Concr. Res. 2004, 34, 1167–1172. [Google Scholar] [CrossRef]
- Ramezanianpour, A.A.; Malhotra, V.M. Effect of curing on the compressive strength, resistance to chloride-ion penetration and porosity of concretes incorporating slag, fly ash or silica fume. Cem. Concr. Compos. 1995, 17, 125–133. [Google Scholar] [CrossRef]
- Yeau, K.Y.; Kim, E.K. An experimental study on corrosion resistance of concrete with ground granulate blast-furnace slag. Cem. Concr. Res. 2005, 35, 1391–1399. [Google Scholar] [CrossRef]
- Uthaman, S.; George, R.P.; Vishwakarma, V.; Harilal, M.; Philip, J. Enhanced seawater corrosion resistance of reinforcement in nanophase modified fly ash concrete. Constr. Build. Mater. 2019, 221, 232–243. [Google Scholar] [CrossRef]
- Afshar, A.; Jahandari, S.; Rasekh, H.; Shariati, M.; Afshar, A.; Shokrgozar, A. Corrosion resistance evaluation of rebars with various primers and coatings in concrete modified with different additives. Constr. Build. Mater. 2020, 262, 120034. [Google Scholar] [CrossRef]
- Erdoğdu, Ş.; Bremner, T.W.; Kondratova, I.L. Accelerated testing of plain and epoxy-coated reinforcement in simulated seawater and chloride solutions. Cem. Concr. Res. 2001, 31, 861–867. [Google Scholar] [CrossRef]
- Al-Negheimish, A.; Hussain, R.R.; Alhozaimy, A.; Singh, D.D.N. Corrosion performance of hot-dip galvanized zinc-aluminum coated steel rebars in comparison to the conventional pure zinc coated rebars in concrete environment. Constr. Build. Mater. 2021, 274, 121921. [Google Scholar] [CrossRef]
- Ress, J.; Martin, U.; Bosch, J.; Bastidas, D.M. Protection of carbon steel rebars by epoxy coating with smart environmentally friendly microcapsules. Coatings 2021, 11, 113. [Google Scholar] [CrossRef]
- Bautista, A.; Blanco, G.; Velasco, F. Corrosion behaviour of low-nickel austenitic stainless steels reinforcements: A comparative study in simulated pore solutions. Cem. Concr. Res. 2006, 36, 1922–1930. [Google Scholar] [CrossRef]
- Fahim, A.; Dean, A.E.; Thomas, M.D.; Moffatt, E.G. Corrosion resistance of chromium-steel and stainless steel reinforcement in concrete. Mater. Corros. 2019, 70, 328–344. [Google Scholar] [CrossRef]
- Choi, Y.-S.; Shim, J.-J.; Kim, J.-G. Effects of Cr, Cu, Ni and Ca on the corrosion behavior of low carbon steel in synthetic tap water. J. Alloy. Compd. 2005, 391, 162–169. [Google Scholar] [CrossRef]
- Ge, Y.; Zhu, X.; Li, Y. Corrosion of Reinforced Concrete Bridge Structures; Chemical Industry Press Beijing: Beijing, China, 2011. [Google Scholar]
- Song, D.; Sun, W.; Jiang, J.-Y.; Ma, H.; Zhang, J.-C.; Cheng, Z.-J. Corrosion Behavior of Cr Micro-alloyed Corrosion-resistant Rebar in Neutral Cl−-containing Environment. J. Iron Steel Res. Int. 2016, 23, 608–617. [Google Scholar] [CrossRef]
- Kamimura, T.; Stratmann, M. The influence of chromium on the atmospheric corrosion of steel. Corros. Sci. 2001, 43, 429–447. [Google Scholar] [CrossRef]
- Ai, Z.; Jiang, J.; Sun, W.; Song, D.; Ma, H.; Zhang, J.; Wang, D. Passive behaviour of alloy corrosion-resistant steel Cr10Mo1 in simulating concrete pore solutions with different pH. Appl. Surf. Sci. 2016, 389, 1126–1136. [Google Scholar] [CrossRef]
- Wang, R.; Luo, S.; Liu, M.; Xue, Y. Electrochemical corrosion performance of Cr and Al alloy steels using a J55 carbon steel as base alloy. Corros. Sci. 2014, 85, 270–279. [Google Scholar] [CrossRef]
- Kermani, B.; Gonzales, J.C.; Turconi, G.L.; Perez, T.E.; Morales, C. In-field corrosion performance of 3% Cr steels in sweet and sour downhole production and water injection. In Proceedings of the CORROSION 2004, New Orleans, LA, USA, 28 March–1 April 2004. [Google Scholar]
- Sun, J.; Liu, W.; Chang, W.; Zhang, Z.; Li, Z.; Yu, T.; Lu, M. Characteristics and Formation Mechanism of Corrosion Scales on Low—Chromium X65 Steels in CO2 Environment. Acta Metall. Sin. 2009, 45, 84–90. [Google Scholar]
- Guo, S.; Xu, L.; Zhang, L.; Chang, W.; Lu, M. Corrosion of alloy steels containing 2% chromium in CO2 environments. Corros. Sci. 2012, 63, 246–258. [Google Scholar] [CrossRef]
- Mancio, M.; Kusinski, G.; Monteiro, P.; Devine, T. Electrochemical and in-situ SERS study of passive film characteristics and corrosion performance of 9% Cr microcomposite steel in highly alkaline environments. J. ASTM Int. 2009, 6, 1–10. [Google Scholar] [CrossRef]
- SSPC-SP 5/NACE No. 1-2006; White Metal Blast Cleaning. AMPP: Houston, TX, USA, 2006.
- Harilal, M.; George, R.P.; Albert, S.K.; Philip, J. A new ternary composite steel rebar coating for enhanced corrosion resistance in chloride environment. Constr. Build. Mater. 2022, 320, 126307. [Google Scholar] [CrossRef]
- ASTM G1-03(2017)e1; Standard Practice for Preparing, Cleaning, and Evaluating Corrosion Test Specimens. ASTM International: West Conshohocken, PA, USA, 2017.
- Narayanan, D.; Lu, Y.; Okeil, A.; Castaneda, H. Uniform and Local Corrosion Characterization and Modeling Framework for Long-Term Exposure of Different Rebars Used for RC Elements in the Presence of Chloride Conditions. In Proceedings of the 1st Conference of the European Association on Quality Control of Bridges and Structures, Padova, Italy, 29 August–1 September 2021; Pellegrino, C., Faleschini, F., Zanini, M.A., Matos, J.C., Casas, J.R., Strauss, A., Eds.; Springer International Publishing: Cham, Switzerland, 2022; pp. 794–804. [Google Scholar]
- Chao, C.Y.; Lin, L.F.; Macdonald, D.D. A Point Defect Model for Anodic Passive Films: I. Film Growth Kinetics. J. Electrochem. Soc. 1981, 128, 1187–1194. [Google Scholar] [CrossRef]
- Heiyantuduwa, R.; Alexander, M.G.; Mackechnie, J.R. Performance of a Penetrating Corrosion Inhibitor in Concrete Affected by Carbonation-Induced Corrosion. J. Mater. Civ. Eng. 2006, 18, 842–850. [Google Scholar] [CrossRef]
- Zhang, L.; Niu, D.; Wen, B.; Peng, G.; Sun, Z. Corrosion behavior of low alloy steel bars containing Cr and Al in coral concrete for ocean construction. Constr. Build. Mater. 2020, 258, 119564. [Google Scholar] [CrossRef]
- Shi, J.; Ming, J.; Zhang, Y.; Jiang, J. Corrosion products and corrosion-induced cracks of low-alloy steel and low-carbon steel in concrete. Cem. Concr. Compos. 2018, 88, 121–129. [Google Scholar] [CrossRef]
- Freire, L.; Carmezim, M.J.; Ferreira, M.G.S.; Montemor, M.F. The passive behaviour of AISI 316 in alkaline media and the effect of pH: A combined electrochemical and analytical study. Electrochim. Acta 2010, 55, 6174–6181. [Google Scholar] [CrossRef]
- Jin, Z.; Xiong, C.; Zhao, T.; Du, Y.; Zhang, X.; Li, N.; Yu, Y.; Wang, P. Passivation and depassivation properties of Cr–Mo alloyed corrosion-resistant steel in simulated concrete pore solution. Cem. Concr. Compos. 2022, 126, 104375. [Google Scholar] [CrossRef]
- Hurley, M.F.; Scully, J.R. Threshold chloride concentrations of selected corrosion-resistant rebar materials compared to carbon steel. Corrosion 2006, 62, 892–904. [Google Scholar] [CrossRef]
- Babaee, M.; Castel, A. Chloride-induced corrosion of reinforcement in low-calcium fly ash-based geopolymer concrete. Cem. Concr. Res. 2016, 88, 96–107. [Google Scholar] [CrossRef]
- Andrade, C.; Alonso, C. Corrosion rate monitoring in the laboratory and on-site. Constr. Build. Mater. 1996, 10, 315–328. [Google Scholar] [CrossRef]
- Tuutti, K. Corrosion of Steel in Concrete; Swedish Cement and Concrete Research Institute: Stockholm, Sweden, 1982. [Google Scholar]
- Shi, J.; Ming, J.; Wang, D.; Wu, M. Improved corrosion resistance of a new 6% Cr steel in simulated concrete pore solution contaminated by chlorides. Corros. Sci. 2020, 174, 108851. [Google Scholar] [CrossRef]
- Jing, X.; Wu, Y. Electrochemical studies on the performance of conductive overlay material in cathodic protection of reinforced concrete. Constr. Build. Mater. 2011, 25, 2655–2662. [Google Scholar] [CrossRef]
- Fei, F.-L.; Hu, J.; Wei, J.-X.; Yu, Q.-J.; Chen, Z.-S. Corrosion performance of steel reinforcement in simulated concrete pore solutions in the presence of imidazoline quaternary ammonium salt corrosion inhibitor. Constr. Build. Mater. 2014, 70, 43–53. [Google Scholar] [CrossRef]
- Michel, L.; Angst, U. Towards understanding corrosion initiation in concrete—Influence of local electrochemical properties of reinforcing steel. In Proceedings of the International Conference on Concrete Repair, Rehabilitation and Retrofitting (ICCRRR 2018), Cape Town, South Africa, 19–21 November 2018. [Google Scholar]
- Dong, B.; Liu, W.; Chen, L.; Zhang, T.; Fan, Y.; Zhao, Y.; Li, S.; Yang, W.; Banthukul, W. Optimize Ni, Cu, Mo element of low Cr-steel rebars in tropical marine atmosphere environment through two years of corrosion monitoring. Cem. Concr. Compos. 2022, 125, 104317. [Google Scholar] [CrossRef]


| Rebar | C | Cr | Ni | Mo | Mn | P | S | Si | Cu | V | Sn | Al | N | Fe |
|---|---|---|---|---|---|---|---|---|---|---|---|---|---|---|
| ASTM A615 | 0.42 | 0.23 | 0.12 | 0.033 | 1.00 | 0.012 | 0.025 | 0.19 | 0.34 | - | 0.01 | 0.002 | 0.0045 | Ba |
| ASTM1035-CS (9% Cr) | 0.11 | 9.46 | 0.09 | 0.02 | 0.63 | 0.010 | 0.005 | 0.37 | 0.16 | 0.019 | 0.008 | - | - | Ba |
| ASTM 615 (V/dec) | ASTM 1035 (9% Cr) (V/dec) | |
|---|---|---|
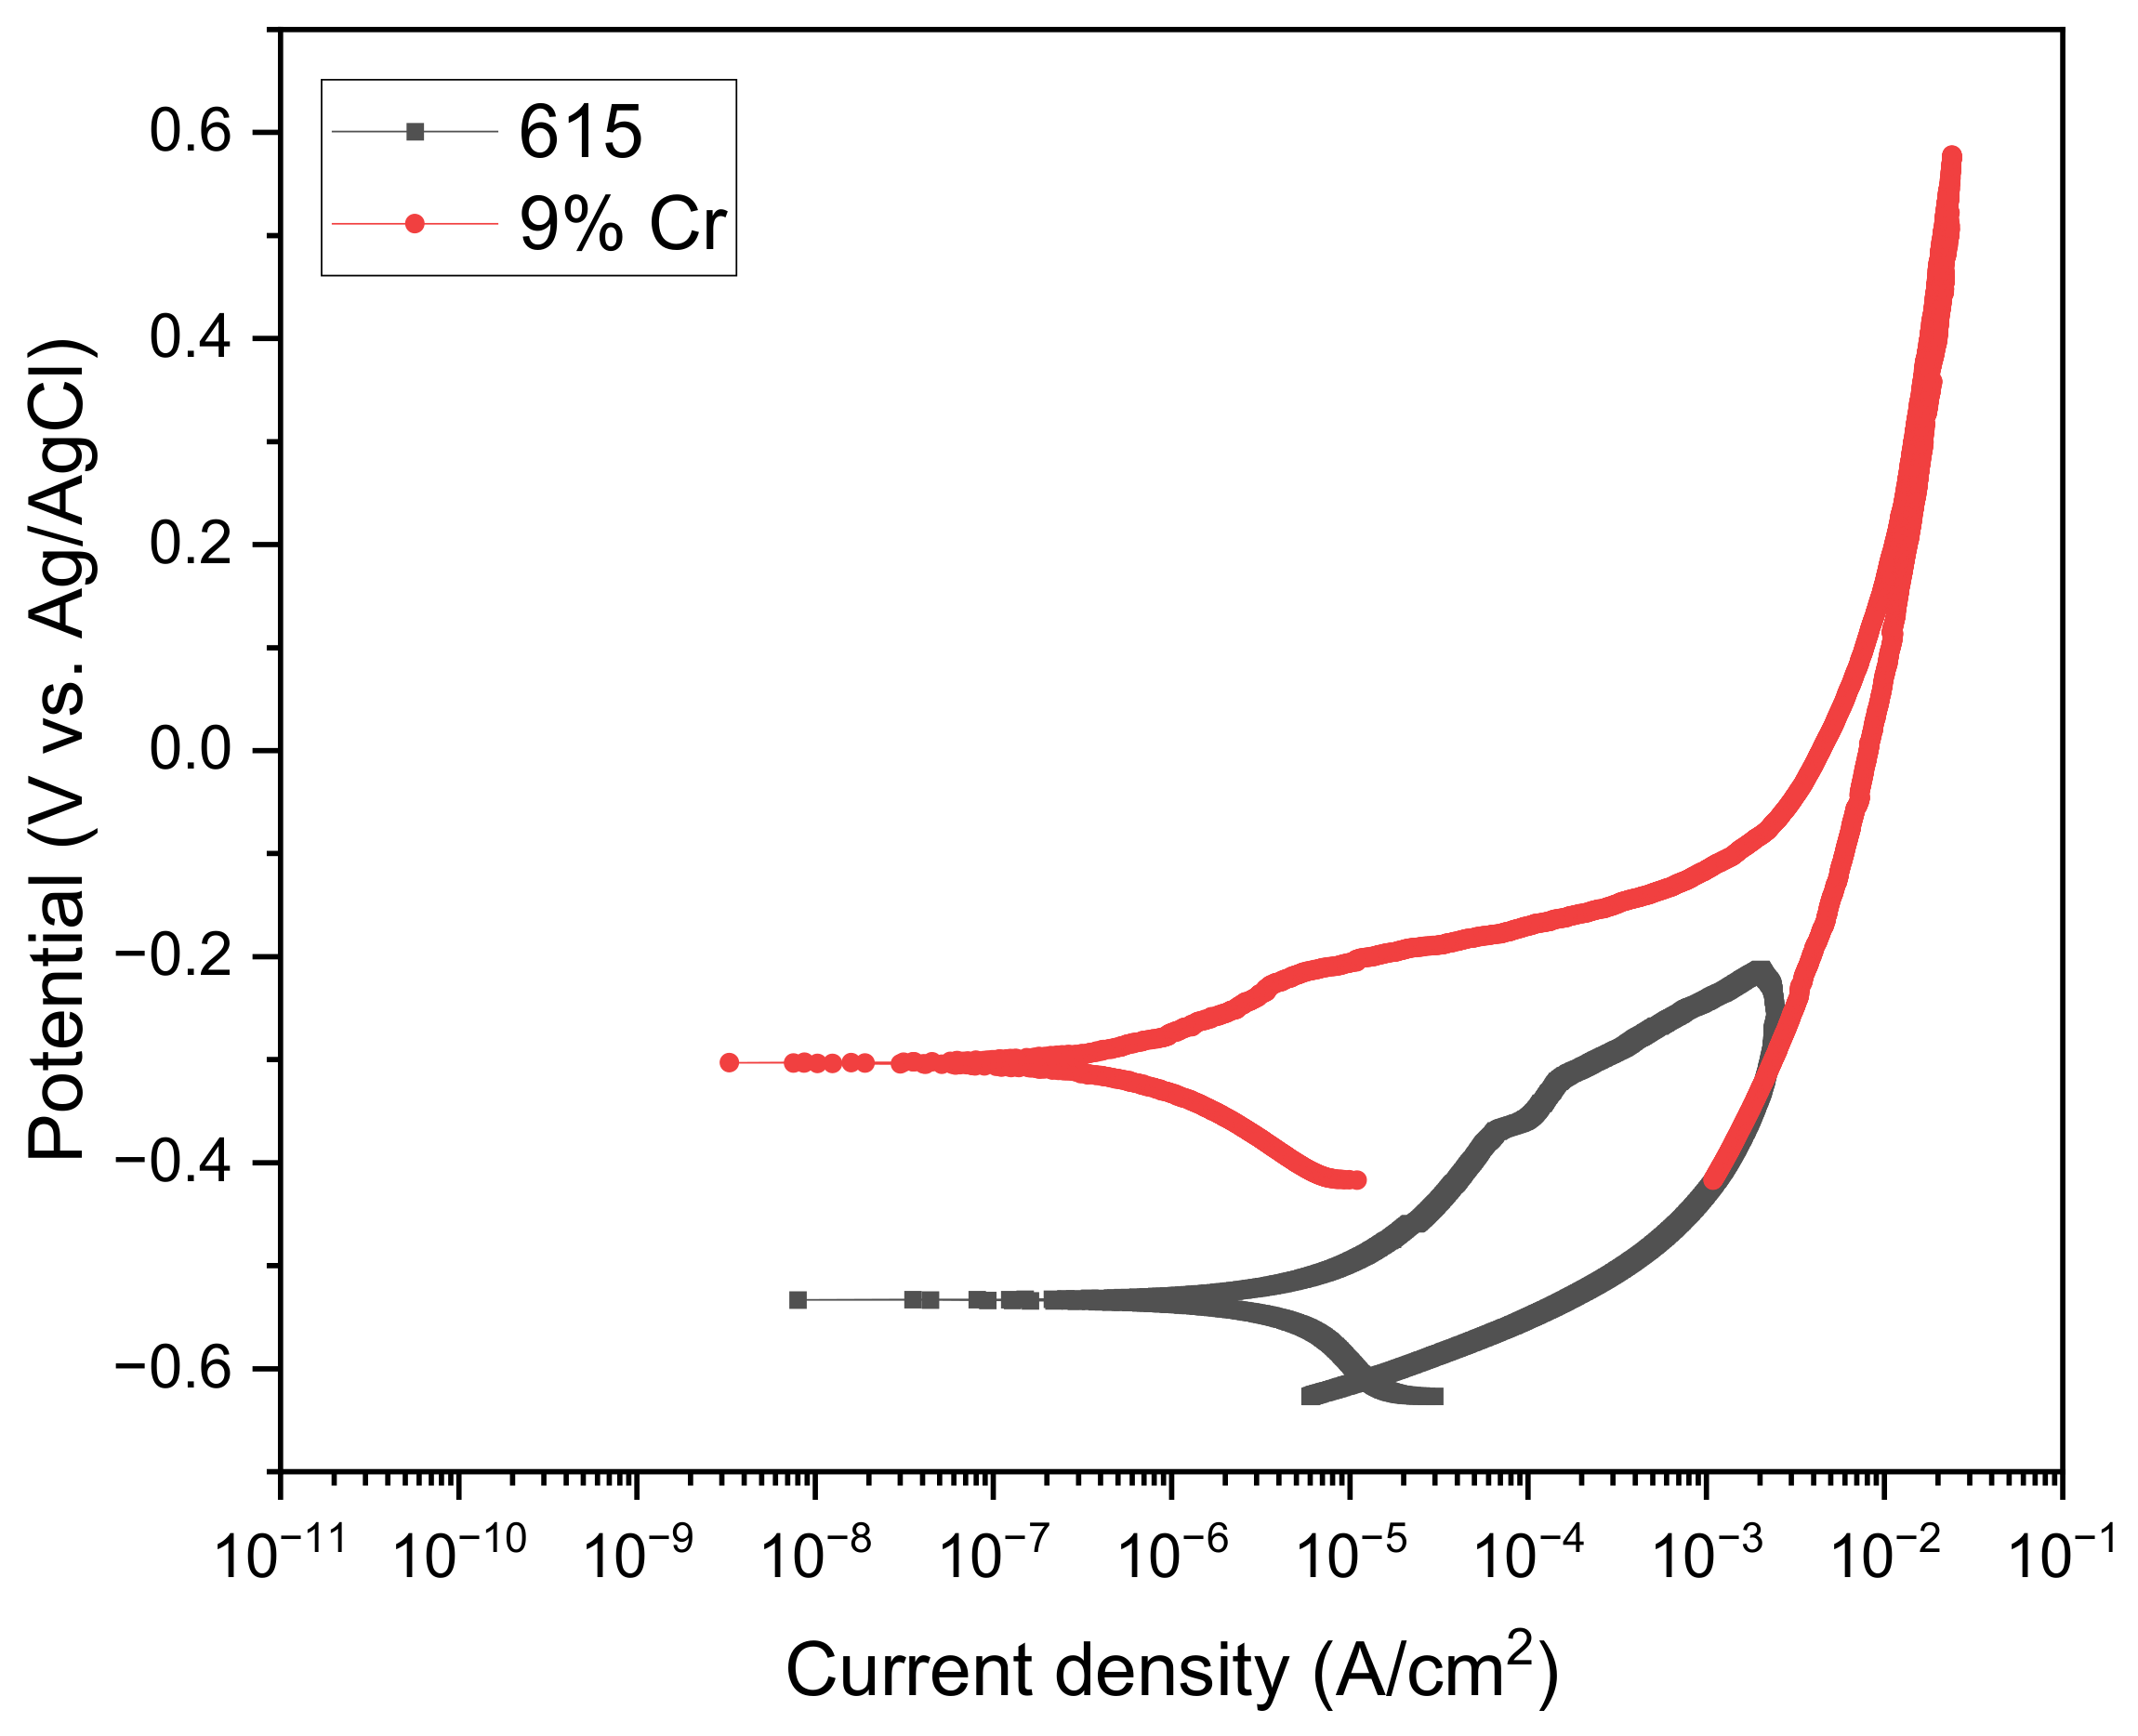
| ba | 0.12 | 0.12 |
| bc | −0.12 | −0.115 |
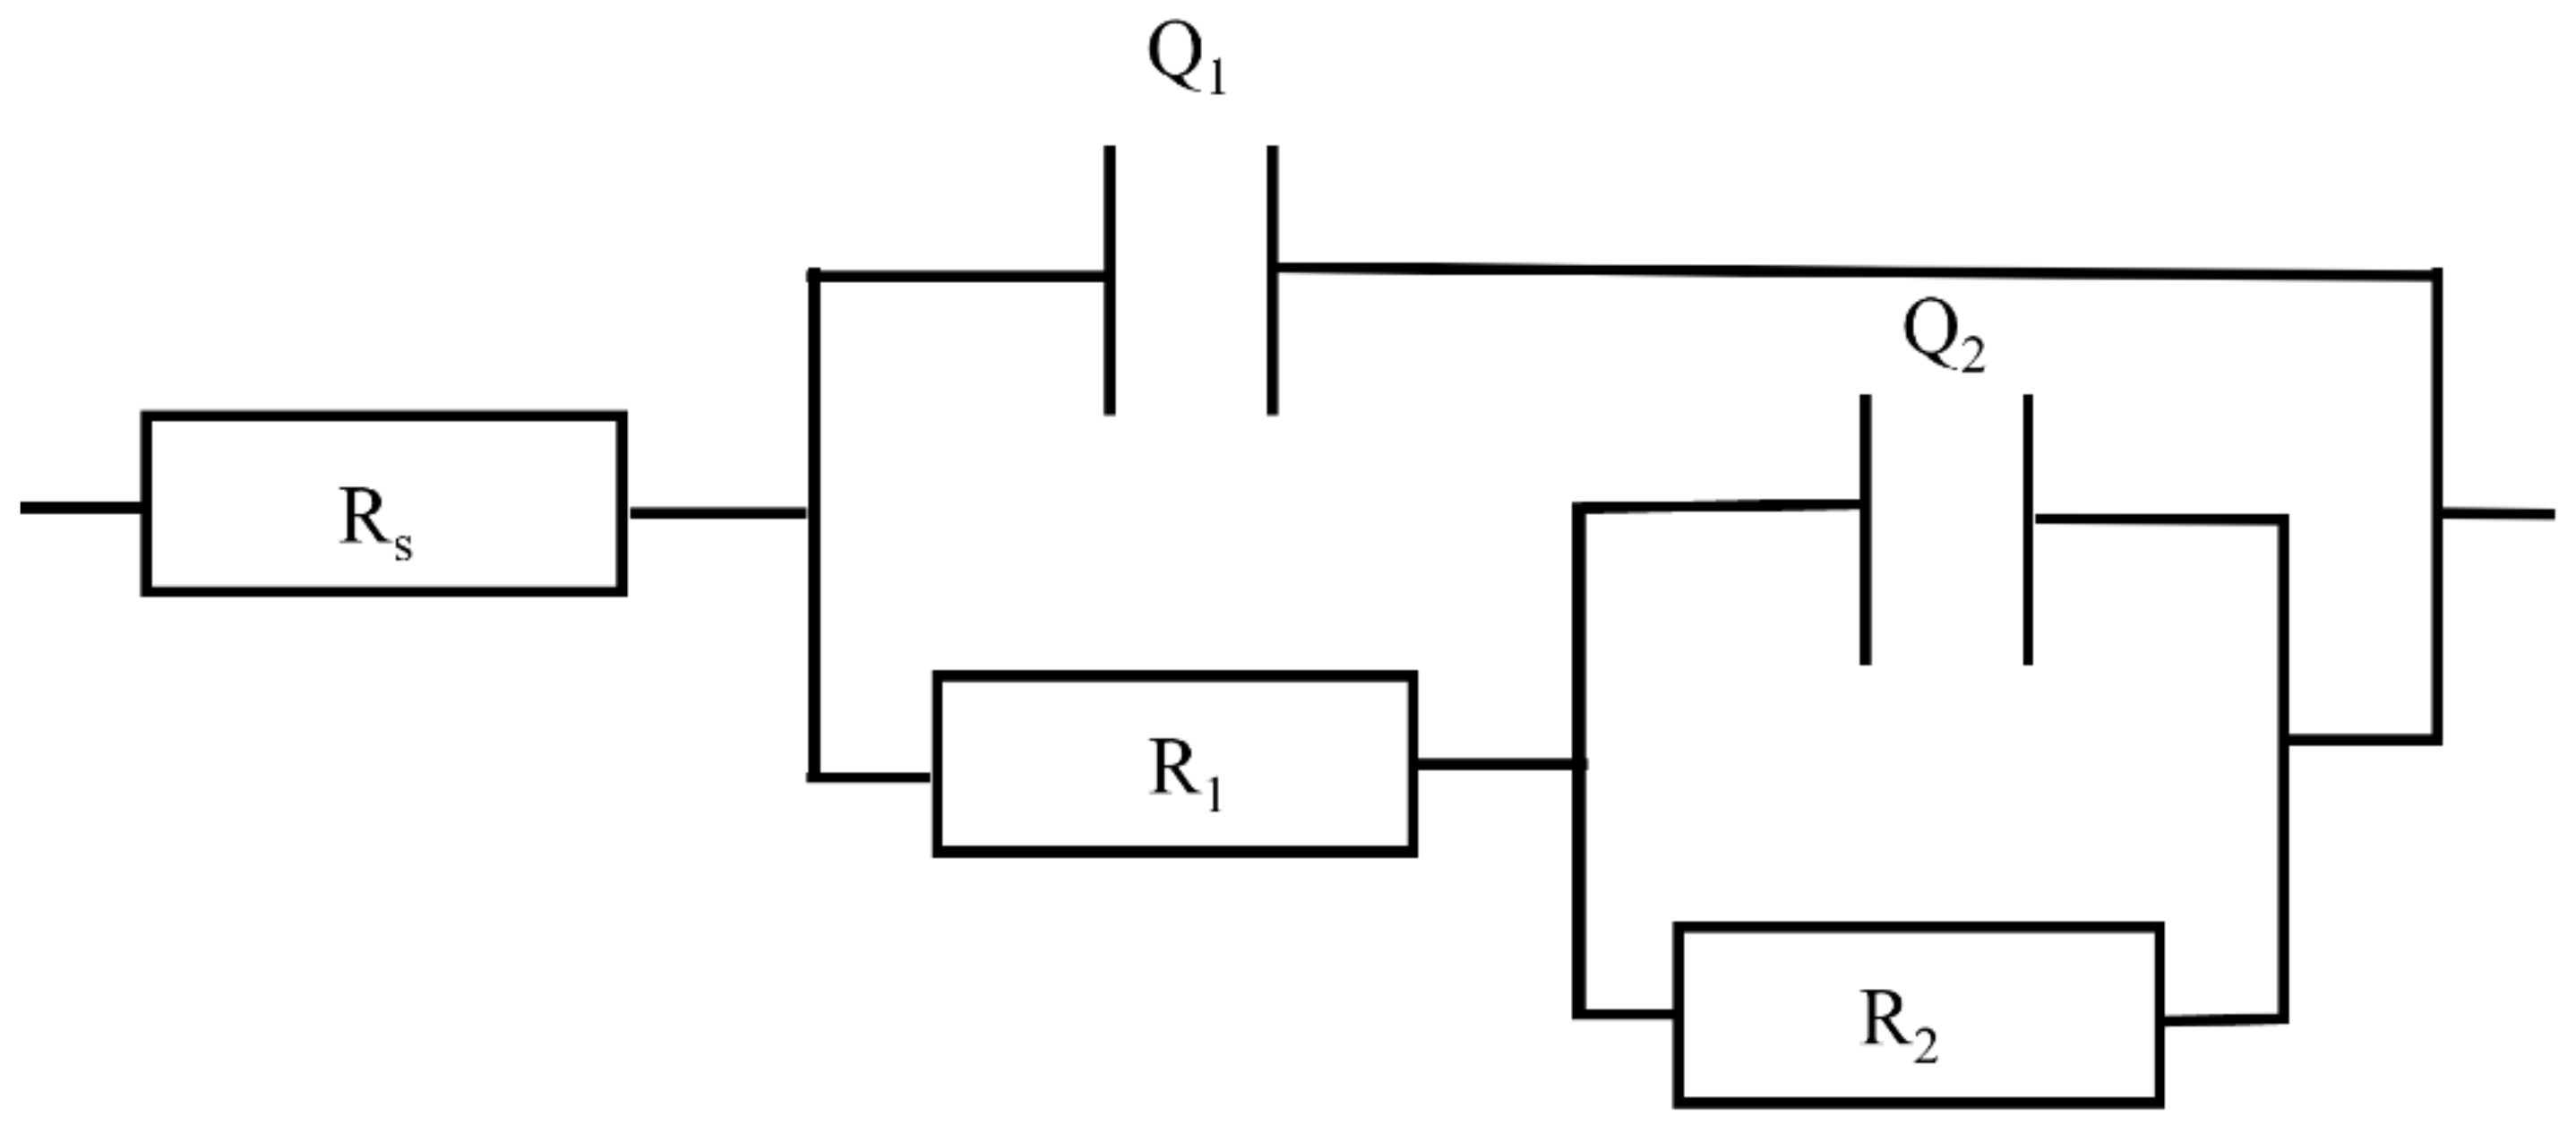
| Time (Month) | Rs (Ω·cm2) | Q1 (µΩ−1cm−2) | n1 | R1 (Ω·cm2) | Q2 (µΩ−1cm−2) | n2 | R2 (Ω·cm2) | χ2 | |
|---|---|---|---|---|---|---|---|---|---|
| 615 | 1 | 3.43 × 101 | 1.21 × 10⁻³ | 1.00 | 8.10 | 6.73 × 10⁻² | 0.459 | 1.49 × 10⁶ | 2.93 × 10⁻³ |
| 2 | 3.71 × 101 | 4.32 × 10⁻² | 0.388 | 15.5 | 3.45 × 10⁻² | 0.607 | 1.93 × 10⁵ | 9.11 × 10⁻⁴ | |
| 4 | 3.01 × 101 | 2.54 × 10⁻³ | 0.445 | 13.6 | 1.69 × 10⁻¹ | 0.488 | 1.15 × 10⁴ | 1.42 × 10⁻³ | |
| 8 | 4.81 × 101 | 8.35 × 10⁻³ | 0.879 | 3.46 | 2.26 × 10⁻¹ | 0.521 | 3.24 × 10³ | 7.05 × 10⁻⁵ | |
| 12 | 1.08 × 101 | 8.27 × 10⁻³ | 0.614 | 7.16 | 2.09 × 10⁻¹ | 0.515 | 6.99 × 10³ | 1.44 × 10⁻⁵ | |
| 9% Cr | 1 | 3.27 × 101 | 1.55 × 10⁻² | 0.668 | 3.86 × 10³ | 4.96 × 10⁻² | 0.578 | 6.23 × 10⁴ | 1.06 × 10⁻³ |
| 2 | 4.34 × 101 | 4.42 × 10⁻⁵ | 0.601 | 2.04 × 10⁻² | 2.13 × 10⁻³ | 0.0356 | 3.39 × 10⁵ | 1.53 × 10⁻³ | |
| 4 | 7.26 × 101 | 3.55 × 10⁻⁴ | 0.541 | 5.71 × 10² | 8.91 × 10⁻⁵ | 0.754 | 3.27 × 10⁵ | 3.03 × 10⁻³ | |
| 8 | 3.17 × 101 | 1.69 × 10⁻³ | 0.811 | 7.63 | 6.77 × 10⁻² | 0.590 | 1.07 × 10⁴ | 8.75 × 10⁻⁴ | |
| 12 | 2.71 × 101 | 4.63 × 10⁻³ | 0.608 | 13.1 | 6.29 × 10⁻² | 0.592 | 1.01 × 10⁴ | 4.16 × 10⁻⁴ |
| 2 Months (µm) | 4 Months (µm) | 8 Months (µm) | 12 Months (µm) | |||||
|---|---|---|---|---|---|---|---|---|
| 615 | 9% | 615 | 9% | 615 | 9% | 615 | 9% | |
| Max | 343.314 | 198.553 | 308.715 | 221.37 | 340.565 | 153.898 | 347.563 | 376.286 |
| Min | 55.767 | 37.222 | 40.622 | 47.658 | 42.38 | 35.591 | 34.547 | 35.957 |
| Avg | 155.9298 | 119.7927 | 95.26067 | 107.8288 | 112.1155 | 76.73104 | 117.2754 | 175.6276 |
Publisher’s Note: MDPI stays neutral with regard to jurisdictional claims in published maps and institutional affiliations. |
© 2022 by the authors. Licensee MDPI, Basel, Switzerland. This article is an open access article distributed under the terms and conditions of the Creative Commons Attribution (CC BY) license (https://creativecommons.org/licenses/by/4.0/).
Share and Cite
Lu, Y.; Narayanan, D.; Brooks, R.; Castaneda, H. Electrochemical Evolution of Carbon Steel and Fe-9% Cr Steel Rebar in Simulated Concrete Pore Solution (SCPS) in the Presence of 3.5 wt% NaCl. Corros. Mater. Degrad. 2022, 3, 454-469. https://doi.org/10.3390/cmd3030027
Lu Y, Narayanan D, Brooks R, Castaneda H. Electrochemical Evolution of Carbon Steel and Fe-9% Cr Steel Rebar in Simulated Concrete Pore Solution (SCPS) in the Presence of 3.5 wt% NaCl. Corrosion and Materials Degradation. 2022; 3(3):454-469. https://doi.org/10.3390/cmd3030027
Chicago/Turabian StyleLu, Yi, Deeparekha Narayanan, Ryan Brooks, and Homero Castaneda. 2022. "Electrochemical Evolution of Carbon Steel and Fe-9% Cr Steel Rebar in Simulated Concrete Pore Solution (SCPS) in the Presence of 3.5 wt% NaCl" Corrosion and Materials Degradation 3, no. 3: 454-469. https://doi.org/10.3390/cmd3030027