3.1. pH Measurements
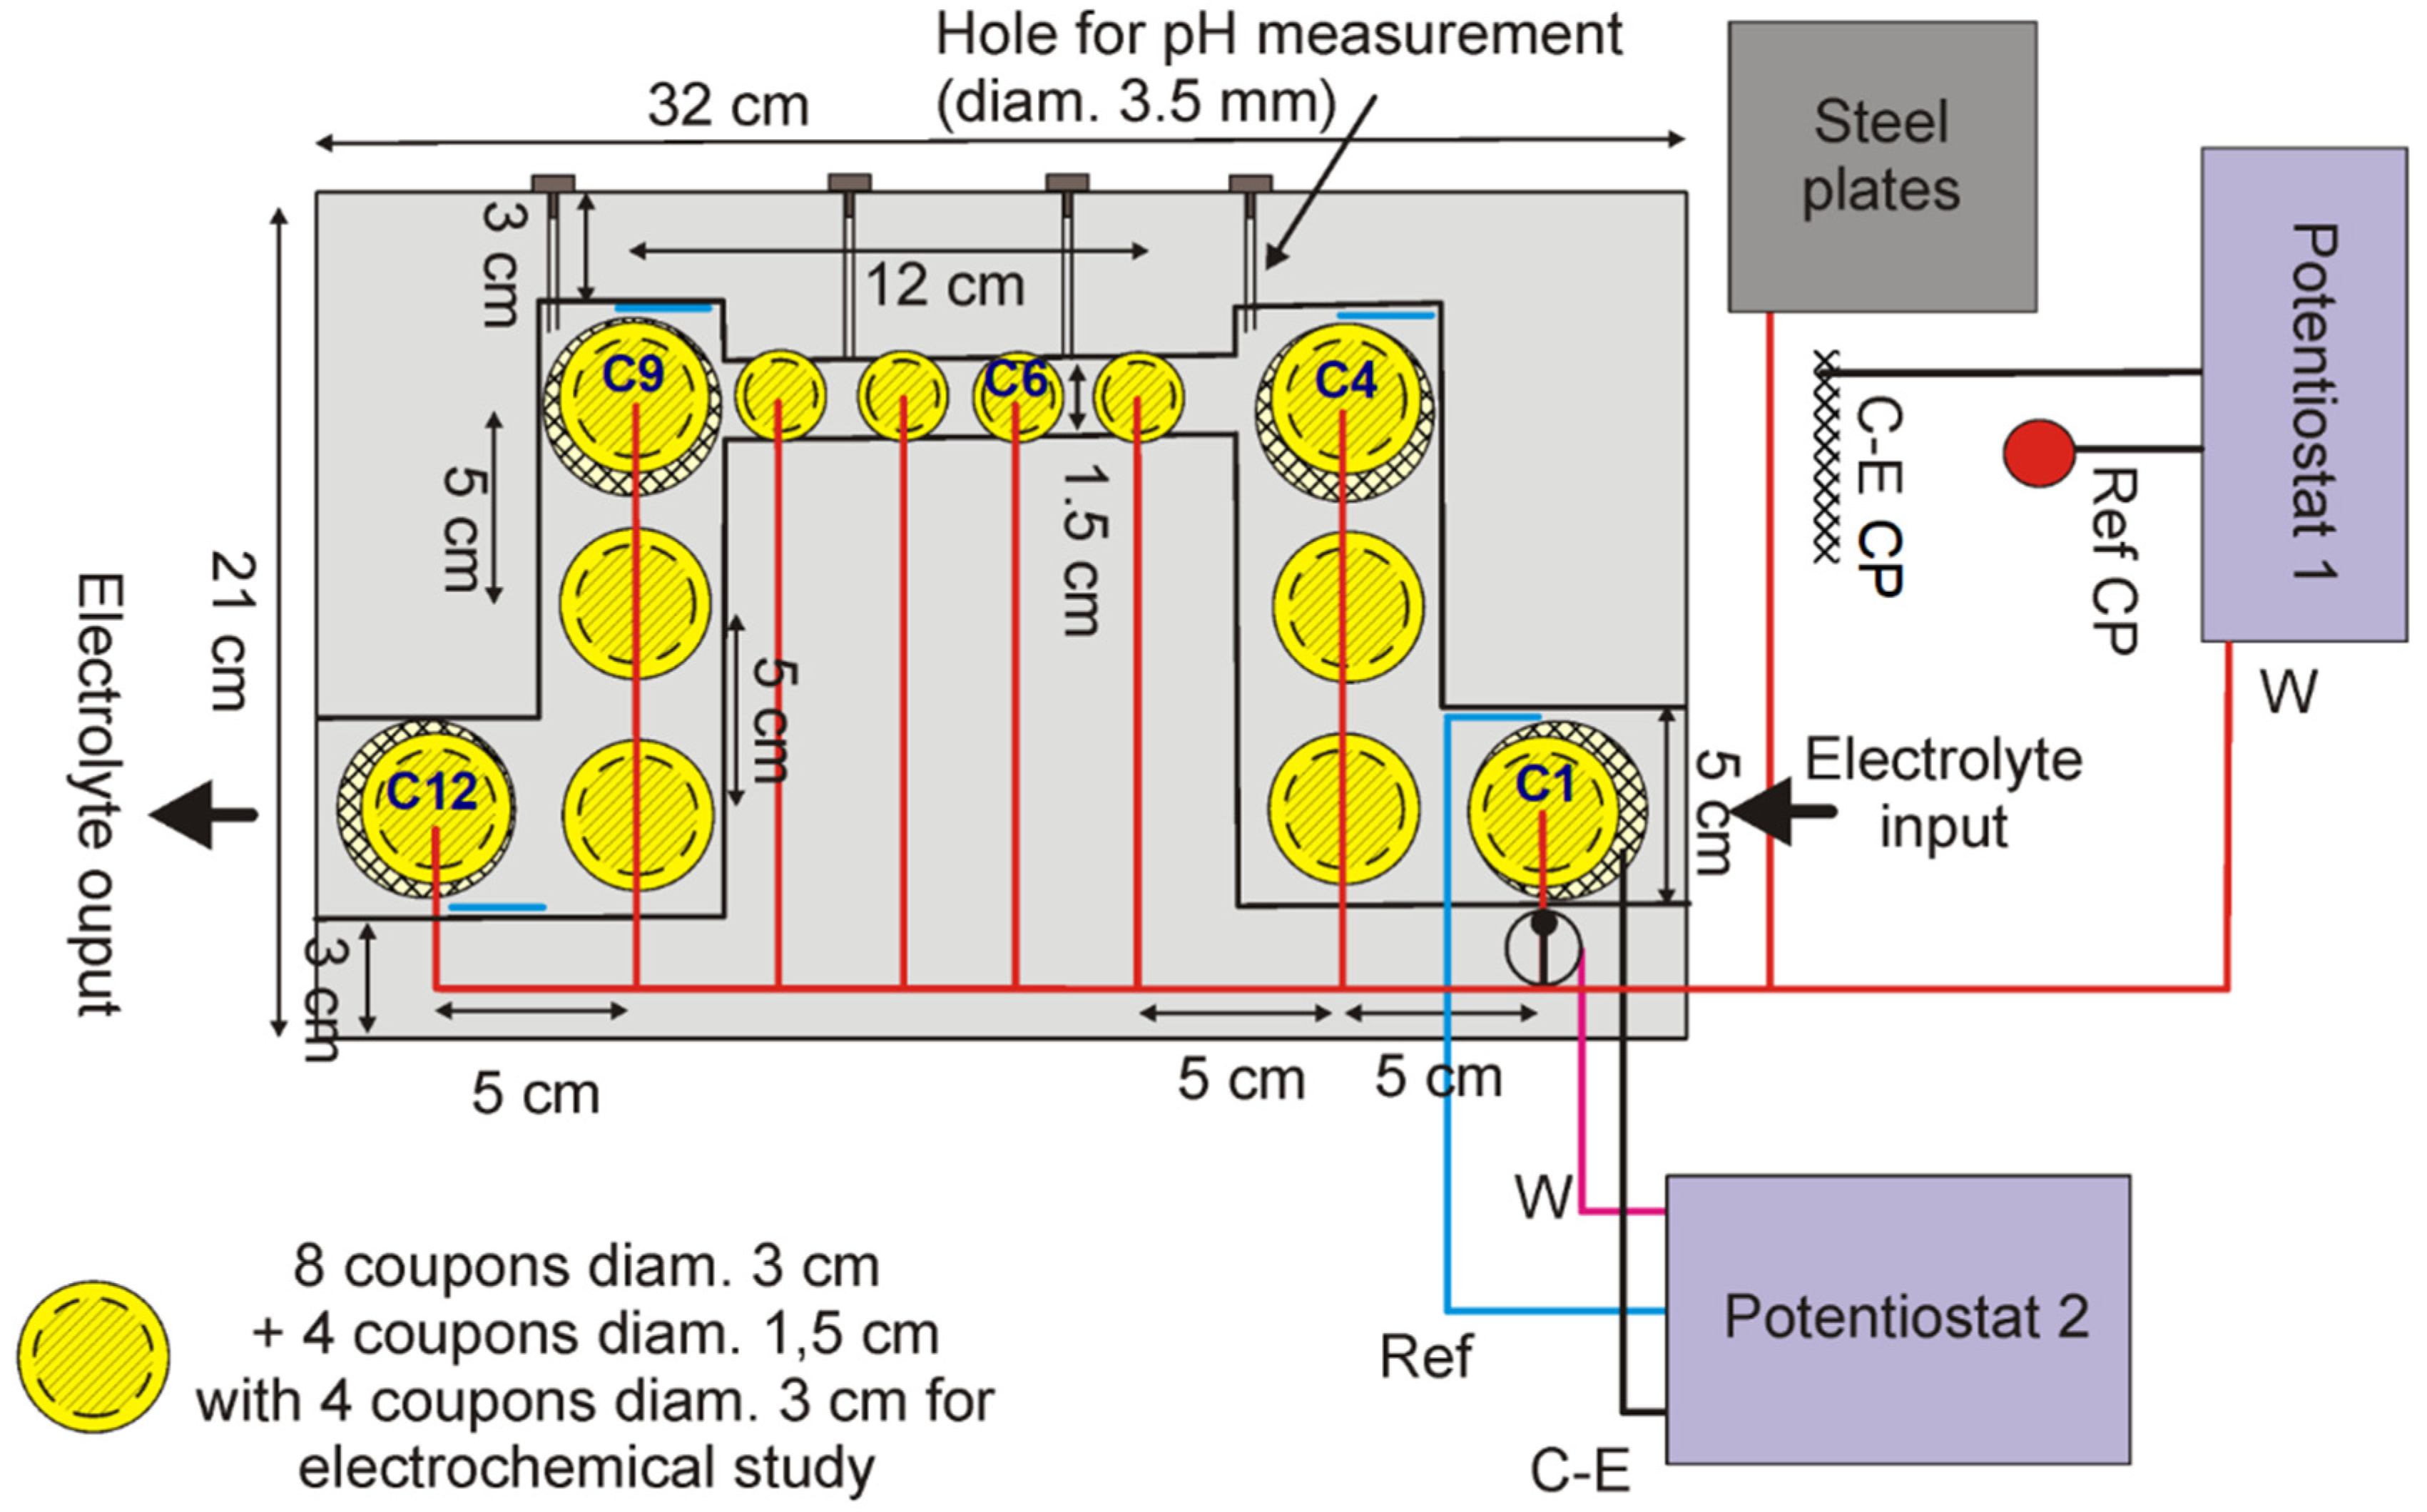
Table 1 lists the pH values measured inside the channel at the vicinity of coupons C4, C7 and C9 and outside the channel, in the “input section” of tank #1. The value measured outside the channel was in any case between 7.8 and 8.0. At days 33 and 53, the measurements were performed with seawater flowing normally inside the channel and the values obtained for coupons C4 and C7 were identical (or did not differ significantly) to those measured outside the channel. In contrast, the pH measured near coupon C9 was always slightly higher.
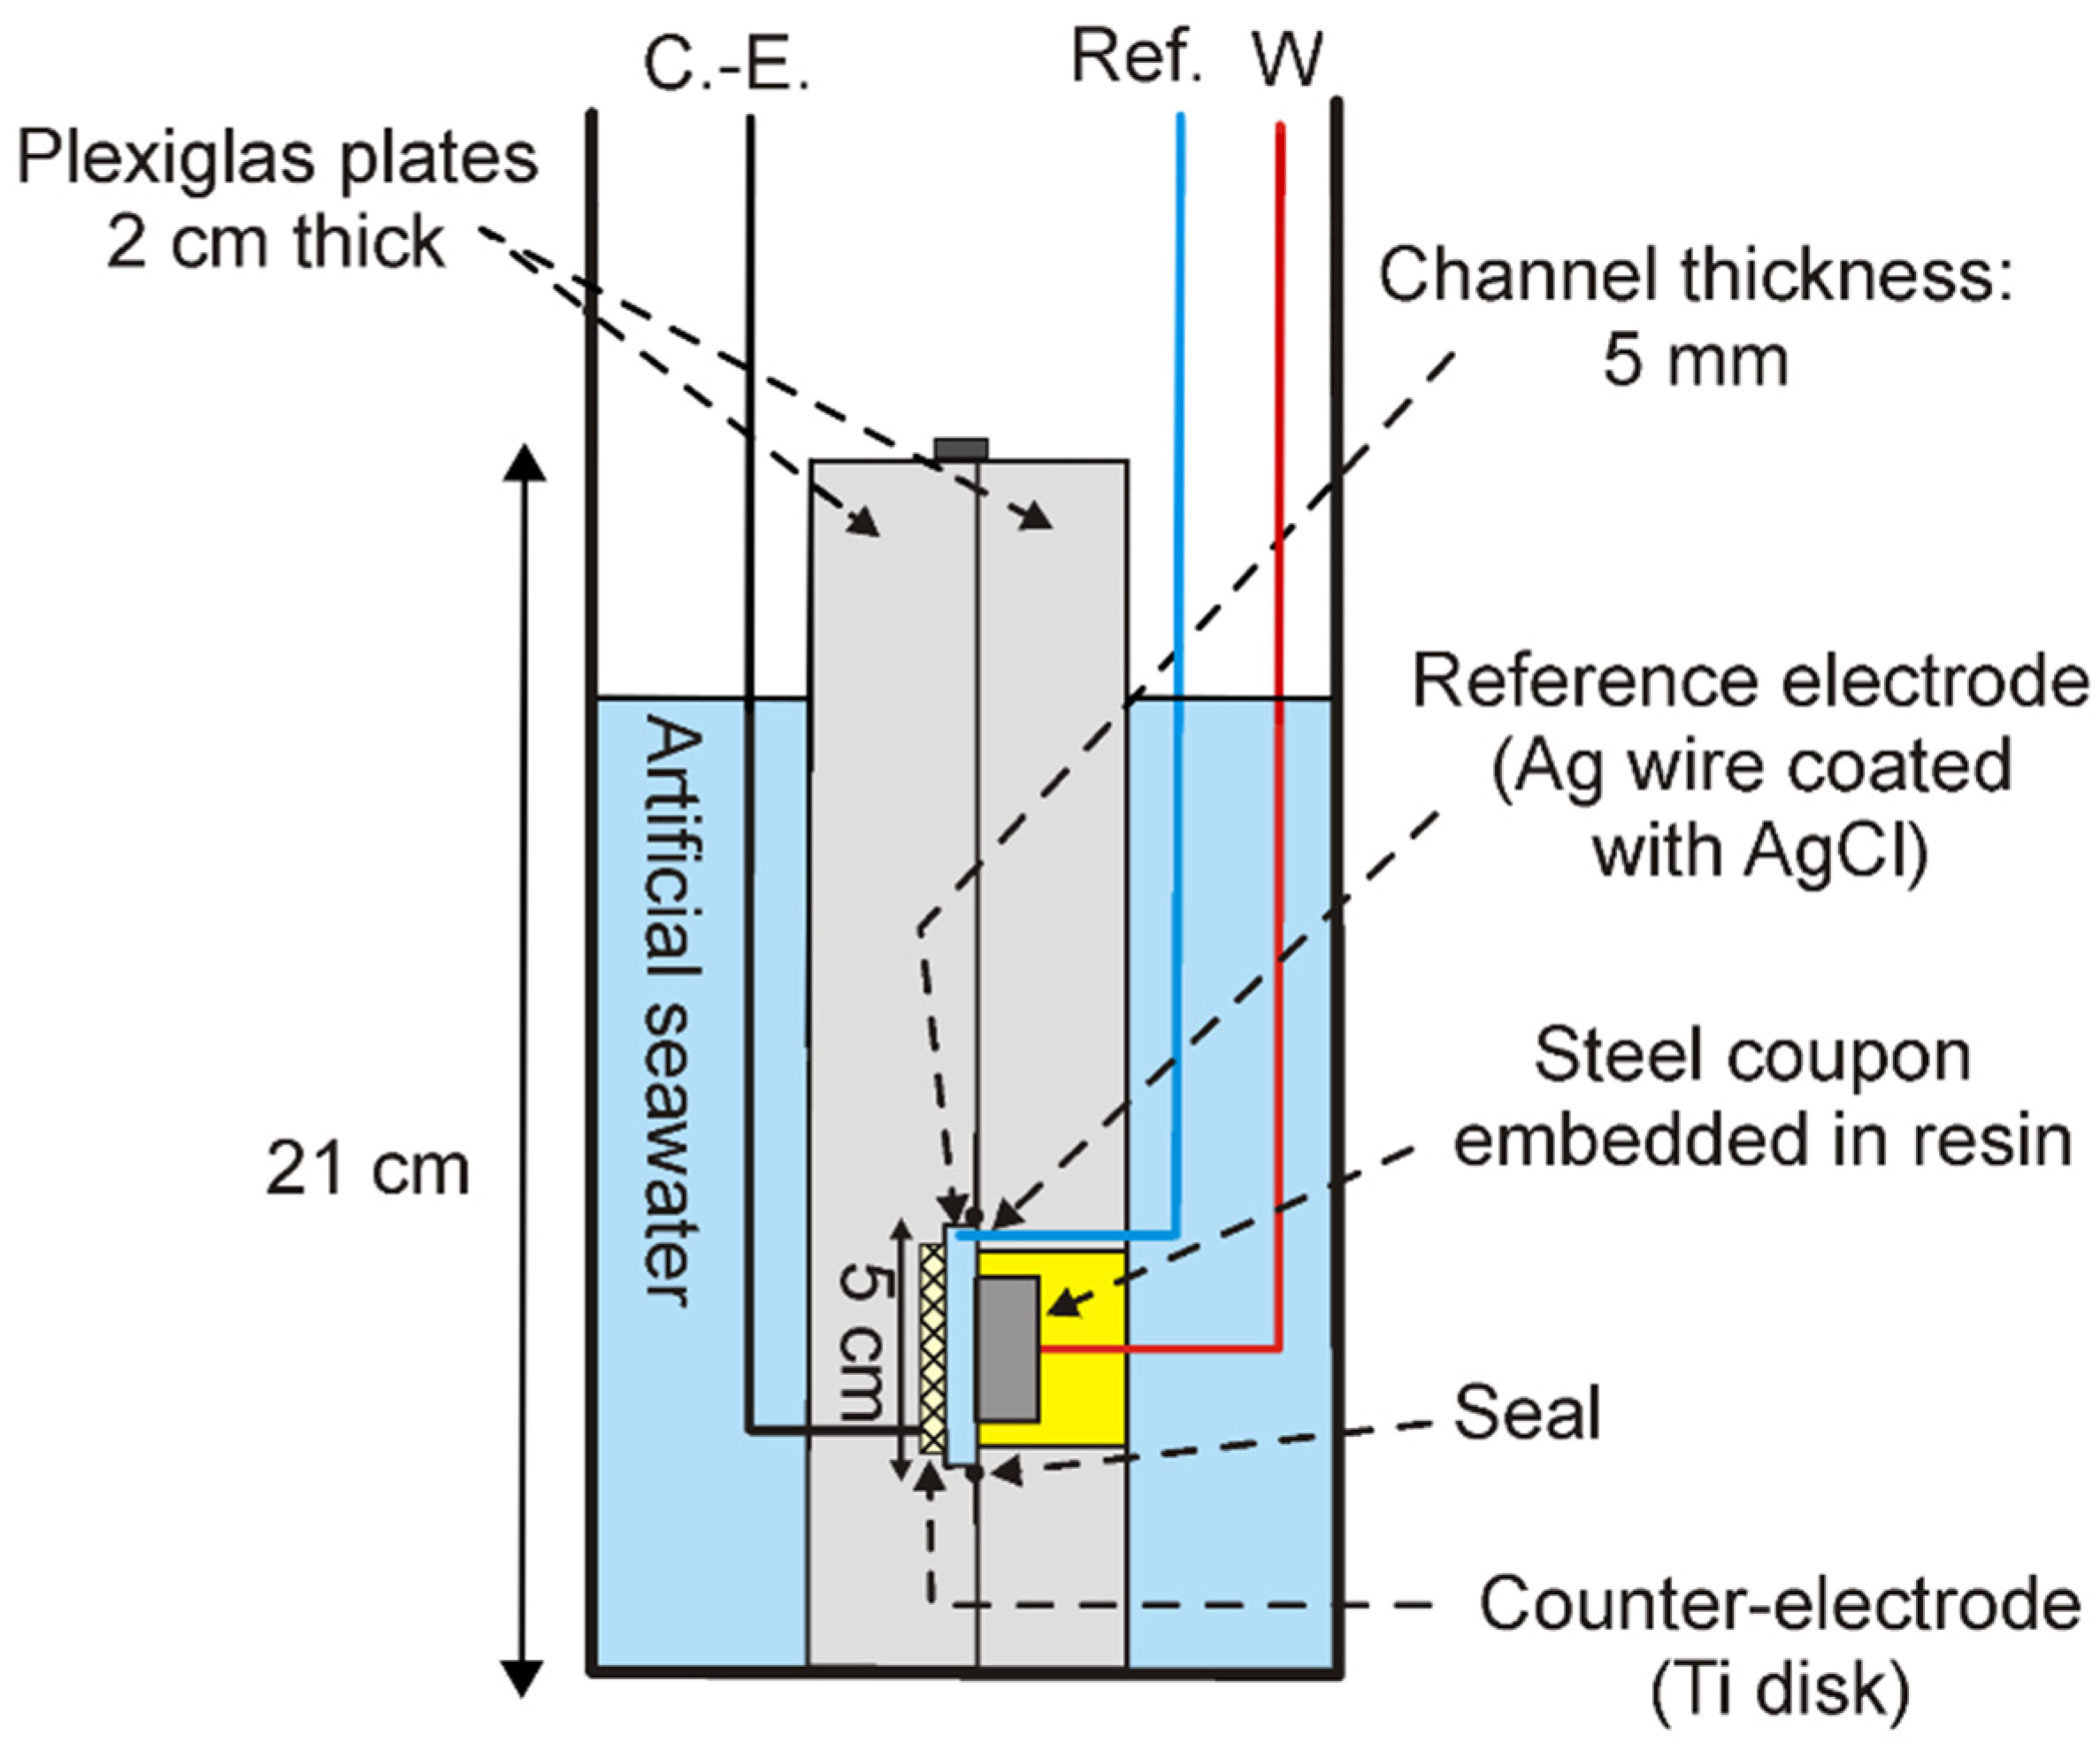
On day 28, the seawater flow was accidentally stopped. It was actually observed that the 3-mm diameter tube connecting the channel to the aquarium pump (
Figure 3) was clogged with rust particles coming from the insufficiently protected coupons. The measured pH values revealed that the pH was increasing all along the channel, from 8.7 close to C4 to 9.5 close to C9. This increase of pH is the consequence of CP, which increases the cathodic reaction rate and so the production of OH
− ions, as expressed by reaction (1). When the seawater flow was stopped, OH
− ions could be only transported by migration and diffusion. The observed increase of pH shows that the production of OH
− ions was sufficiently fast so that the local OH
− ions concentration could increase. Conversely, when seawater flowed inside the channel, the produced OH
− ions were also carried away by advection and could not accumulate at the vicinity of the coupons surface.
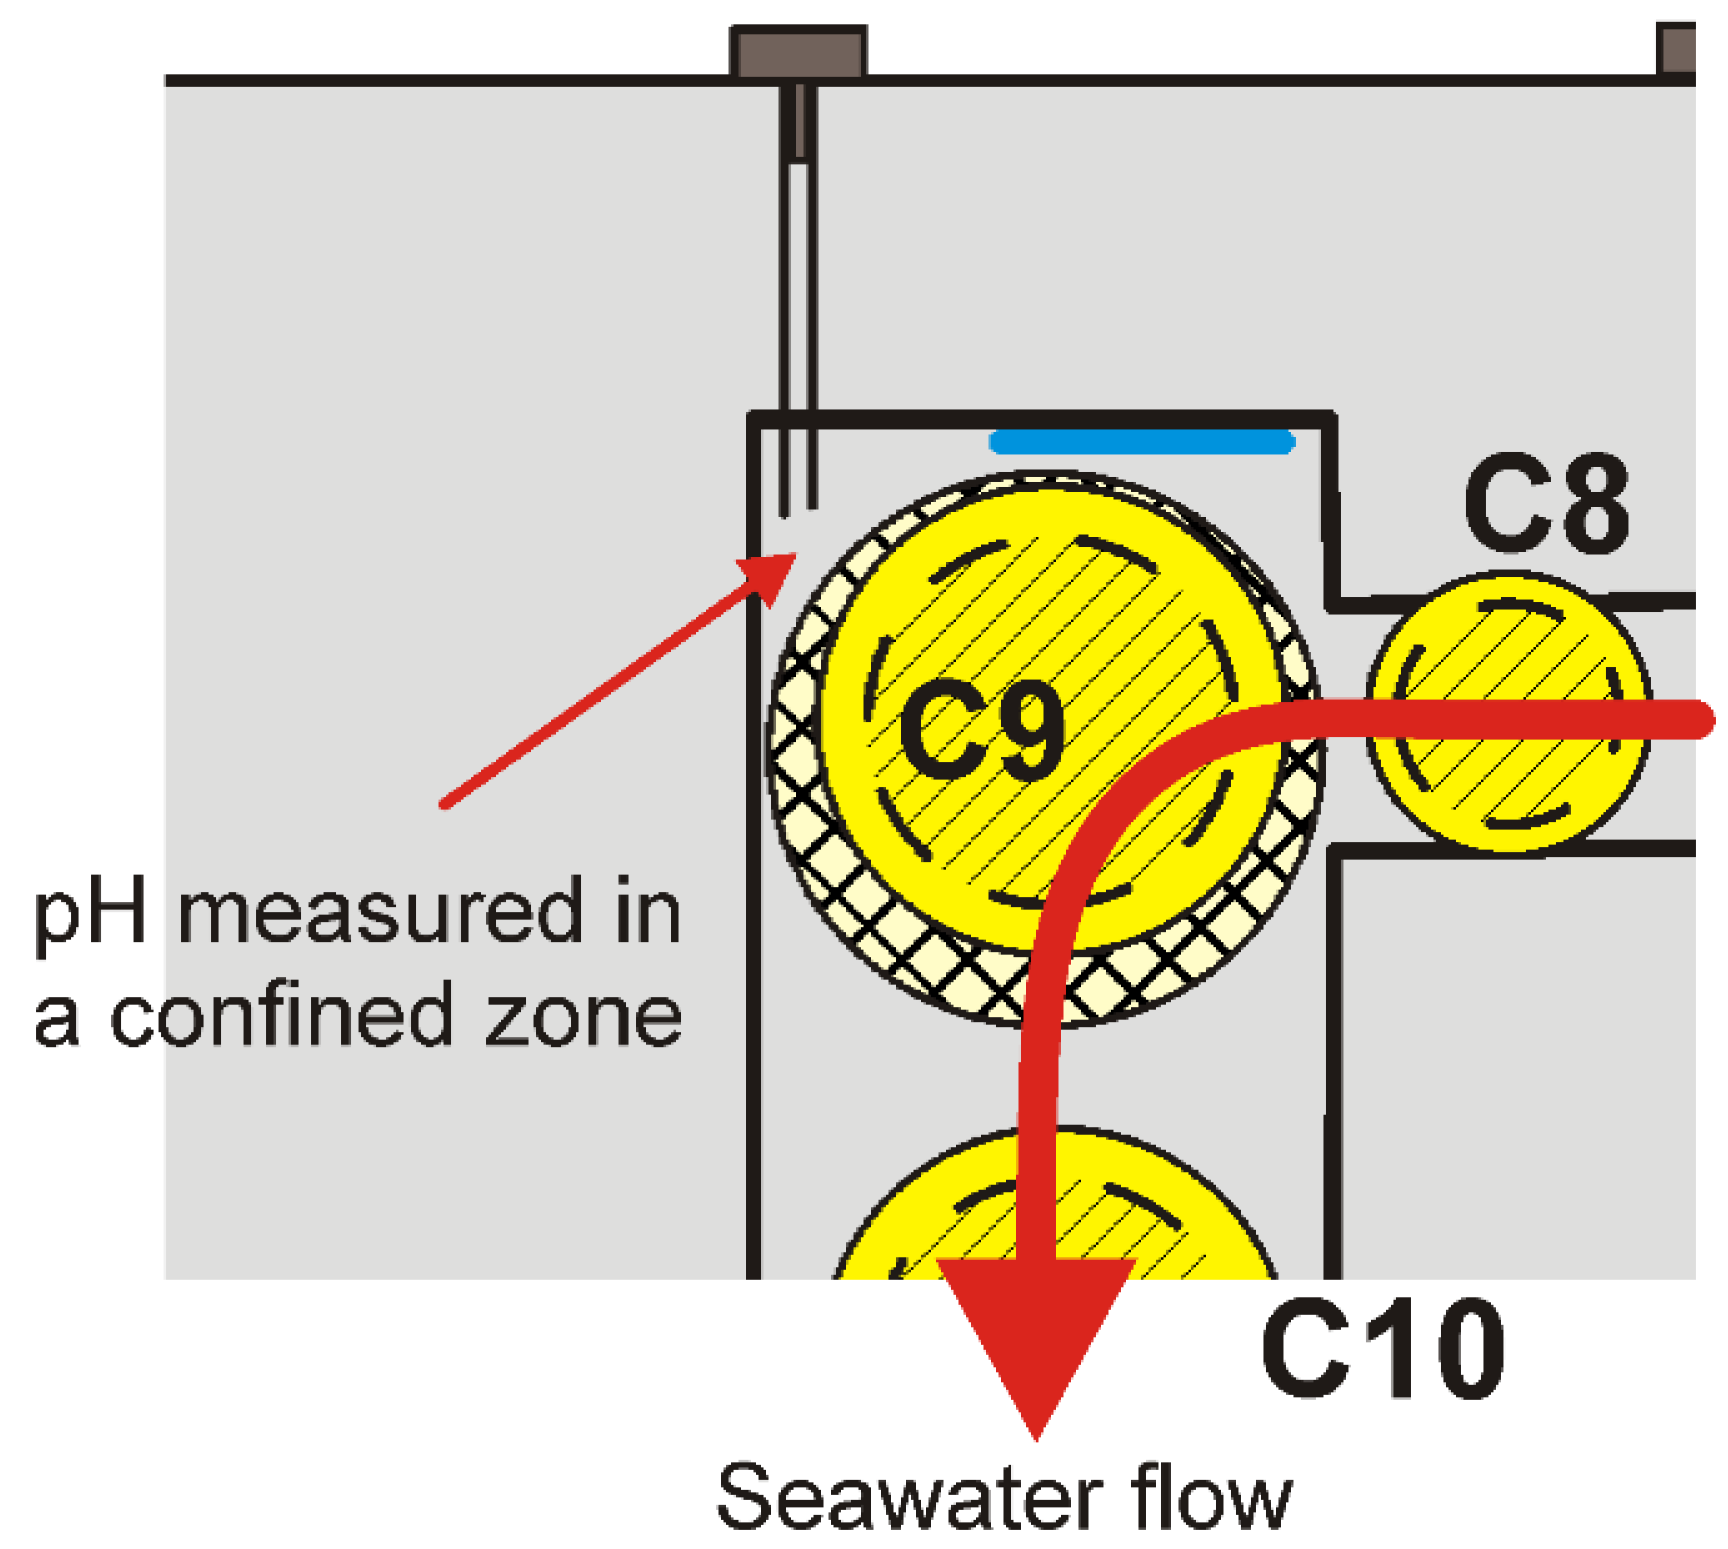
The results obtained near coupon C9 are, however, slightly different as the pH is also higher when seawater flows inside the channel. A detailed view of the experimental design is shown in
Figure 4. It reveals that pH was actually measured in a corner of the channel far from the electrolyte pathway. The effects of advection in this confined region of the channel are thus insufficient to avoid the accumulation of OH
− ions.
The pH was monitored all along the experiment (approximately every two weeks). For each coupon, it fluctuated around the values given in
Table 1 for days 33 and 53, i.e., did not change significantly over time.
3.2. Potential Measurements
The potential corrected from ohmic drop,
EIR free, was measured as described in
Section 2.2. for coupons C1, C4, C9 and C12. The evolution over time of these potentials is displayed in
Figure 5.
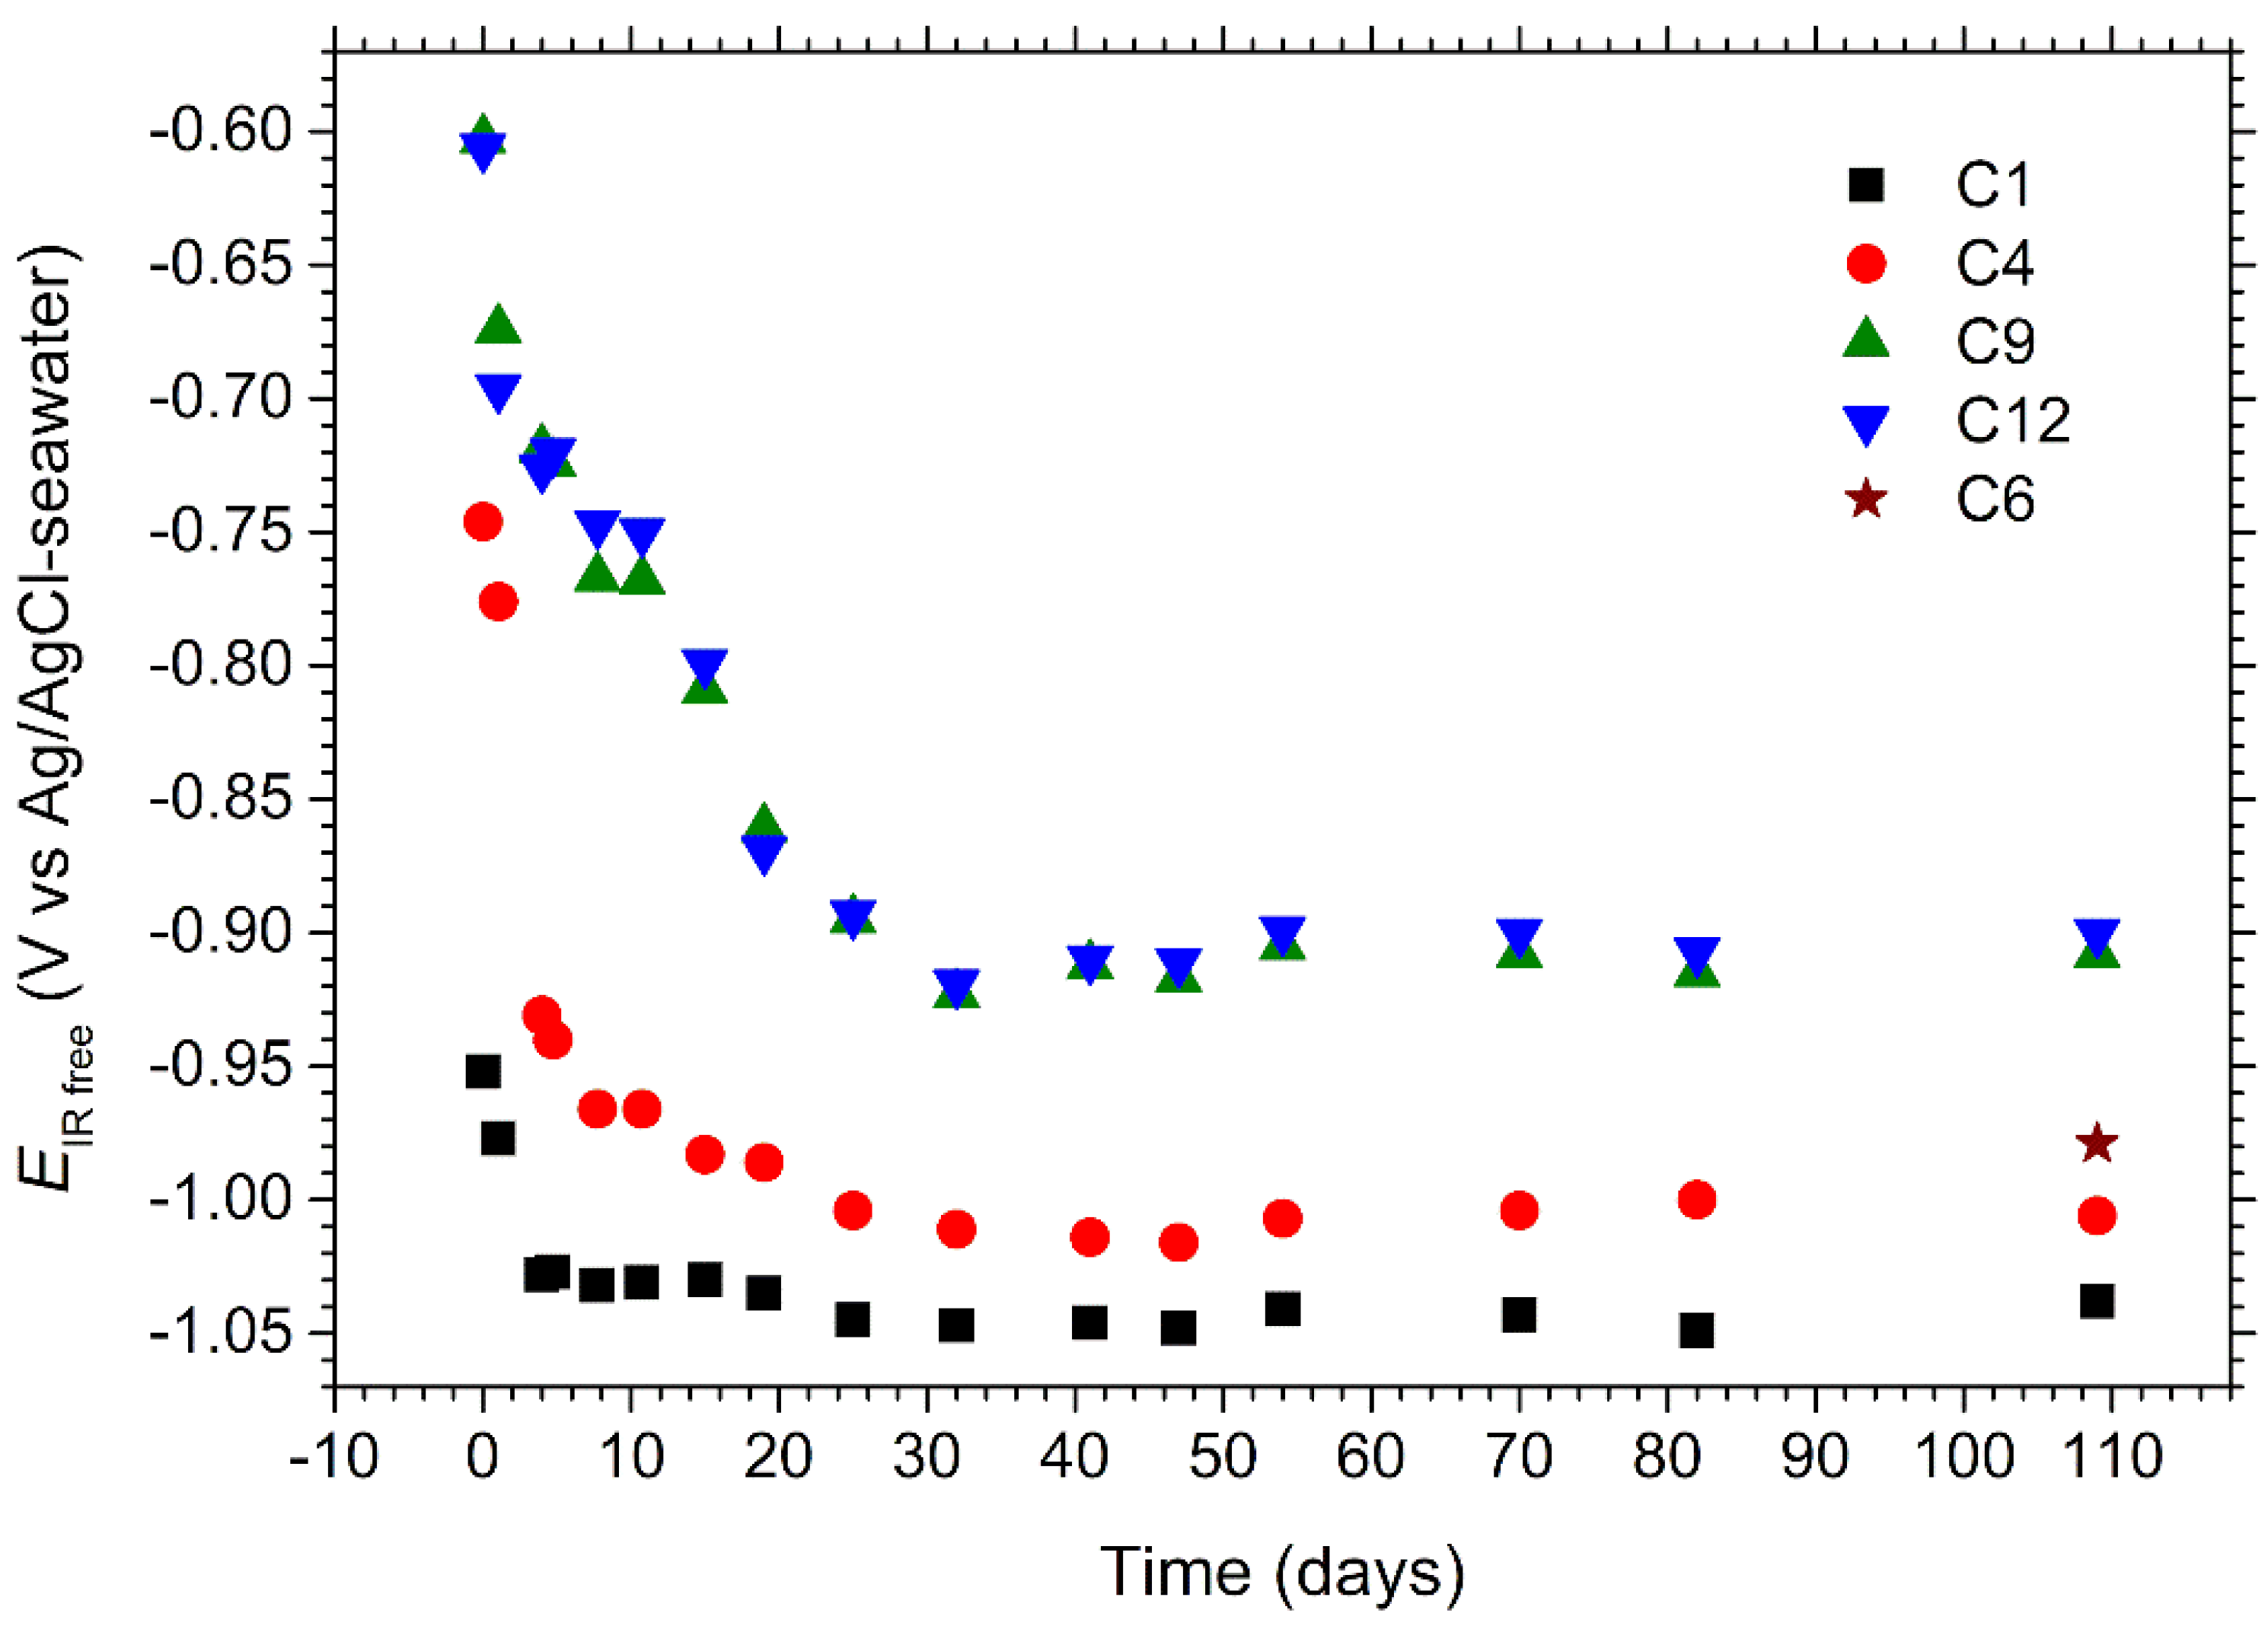
First, it can be seen that EIR free increases inside the channel from C1 to C12, whatever the considered time. The additional value measured for C6 at day 109 falls also between those obtained for C4 and C9, which validates the methodology used to obtain data for C6. This variation is due to the ohmic drop, which increases inside the channel as the distance from the reference electrode used to control the applied potential Eapp increases.
Secondly, it is observed that:
This shows that the ohmic drop is the highest between C9 and C4. These two coupons are separated by the central region of the channel where the cross-sectional area is the smallest. Consequently, the electrical resistance of the electrolyte in this part of the channel is the highest. It must be recalled that the resistance
R of a given volume of an electrolyte with resistivity
ρ is given by:
In this equation, L is the length of the electrolyte volume and A its cross-sectional area, perpendicular to the current flow (assumed uniform). For similar L and ρ, R is then inversely proportional to A. In the main part of the channel, A = 2.5 cm2, while in the central part, A = 0.75 cm2. The ratio between the two cross-sectional areas is then 3.3. At day 41, the potentials are −1.046, −1.014 and −0.912 V vs. Ag/AgCl-seawater for coupons C1, C4, and C9, respectively. This leads to {EIR free(C9) − EIR free(C4)} = 102 mV and {EIR free(C4) − EIR free(C1)} = 32 mV, thus a ratio of 3.2 between both potential differences. Note that the distance between C4 and C9 is larger than that separating C1 from C4, and that the cross section area is larger in the bends, so that the theoretical ratio between both potential differences would be actually slightly higher than 3.7.
Conversely, the cross-sectional area (and the distance L) is the same between C12–C9 and C4–C1. The associated resistance is then the same. The ohmic drop is RI and depends on the current. The counter-electrode for CP is immersed in the “input section” of tank #1 so that the current, which flows between each coupon towards the counter-electrode, flows inside the channel. Consequently, the current that flows in the C12–C9 section corresponds to the sum of the currents required for the CP of coupons C12, C11 and C10. In contrast, the current that flows in the C4–C1 section is the sum of all currents (except that of C1). This explains why the ohmic drop is higher between C4 and C1 than between C12 and C9.
Note that the current that flows in the C9-C4 section is then smaller than the current that flows in the C4-C1 section. This explains why the measured ratio between the corresponding potential differences (i.e., 3.2) is smaller than the theoretical ratio only based on the variation of the resistance R inside the channel (~3.7).
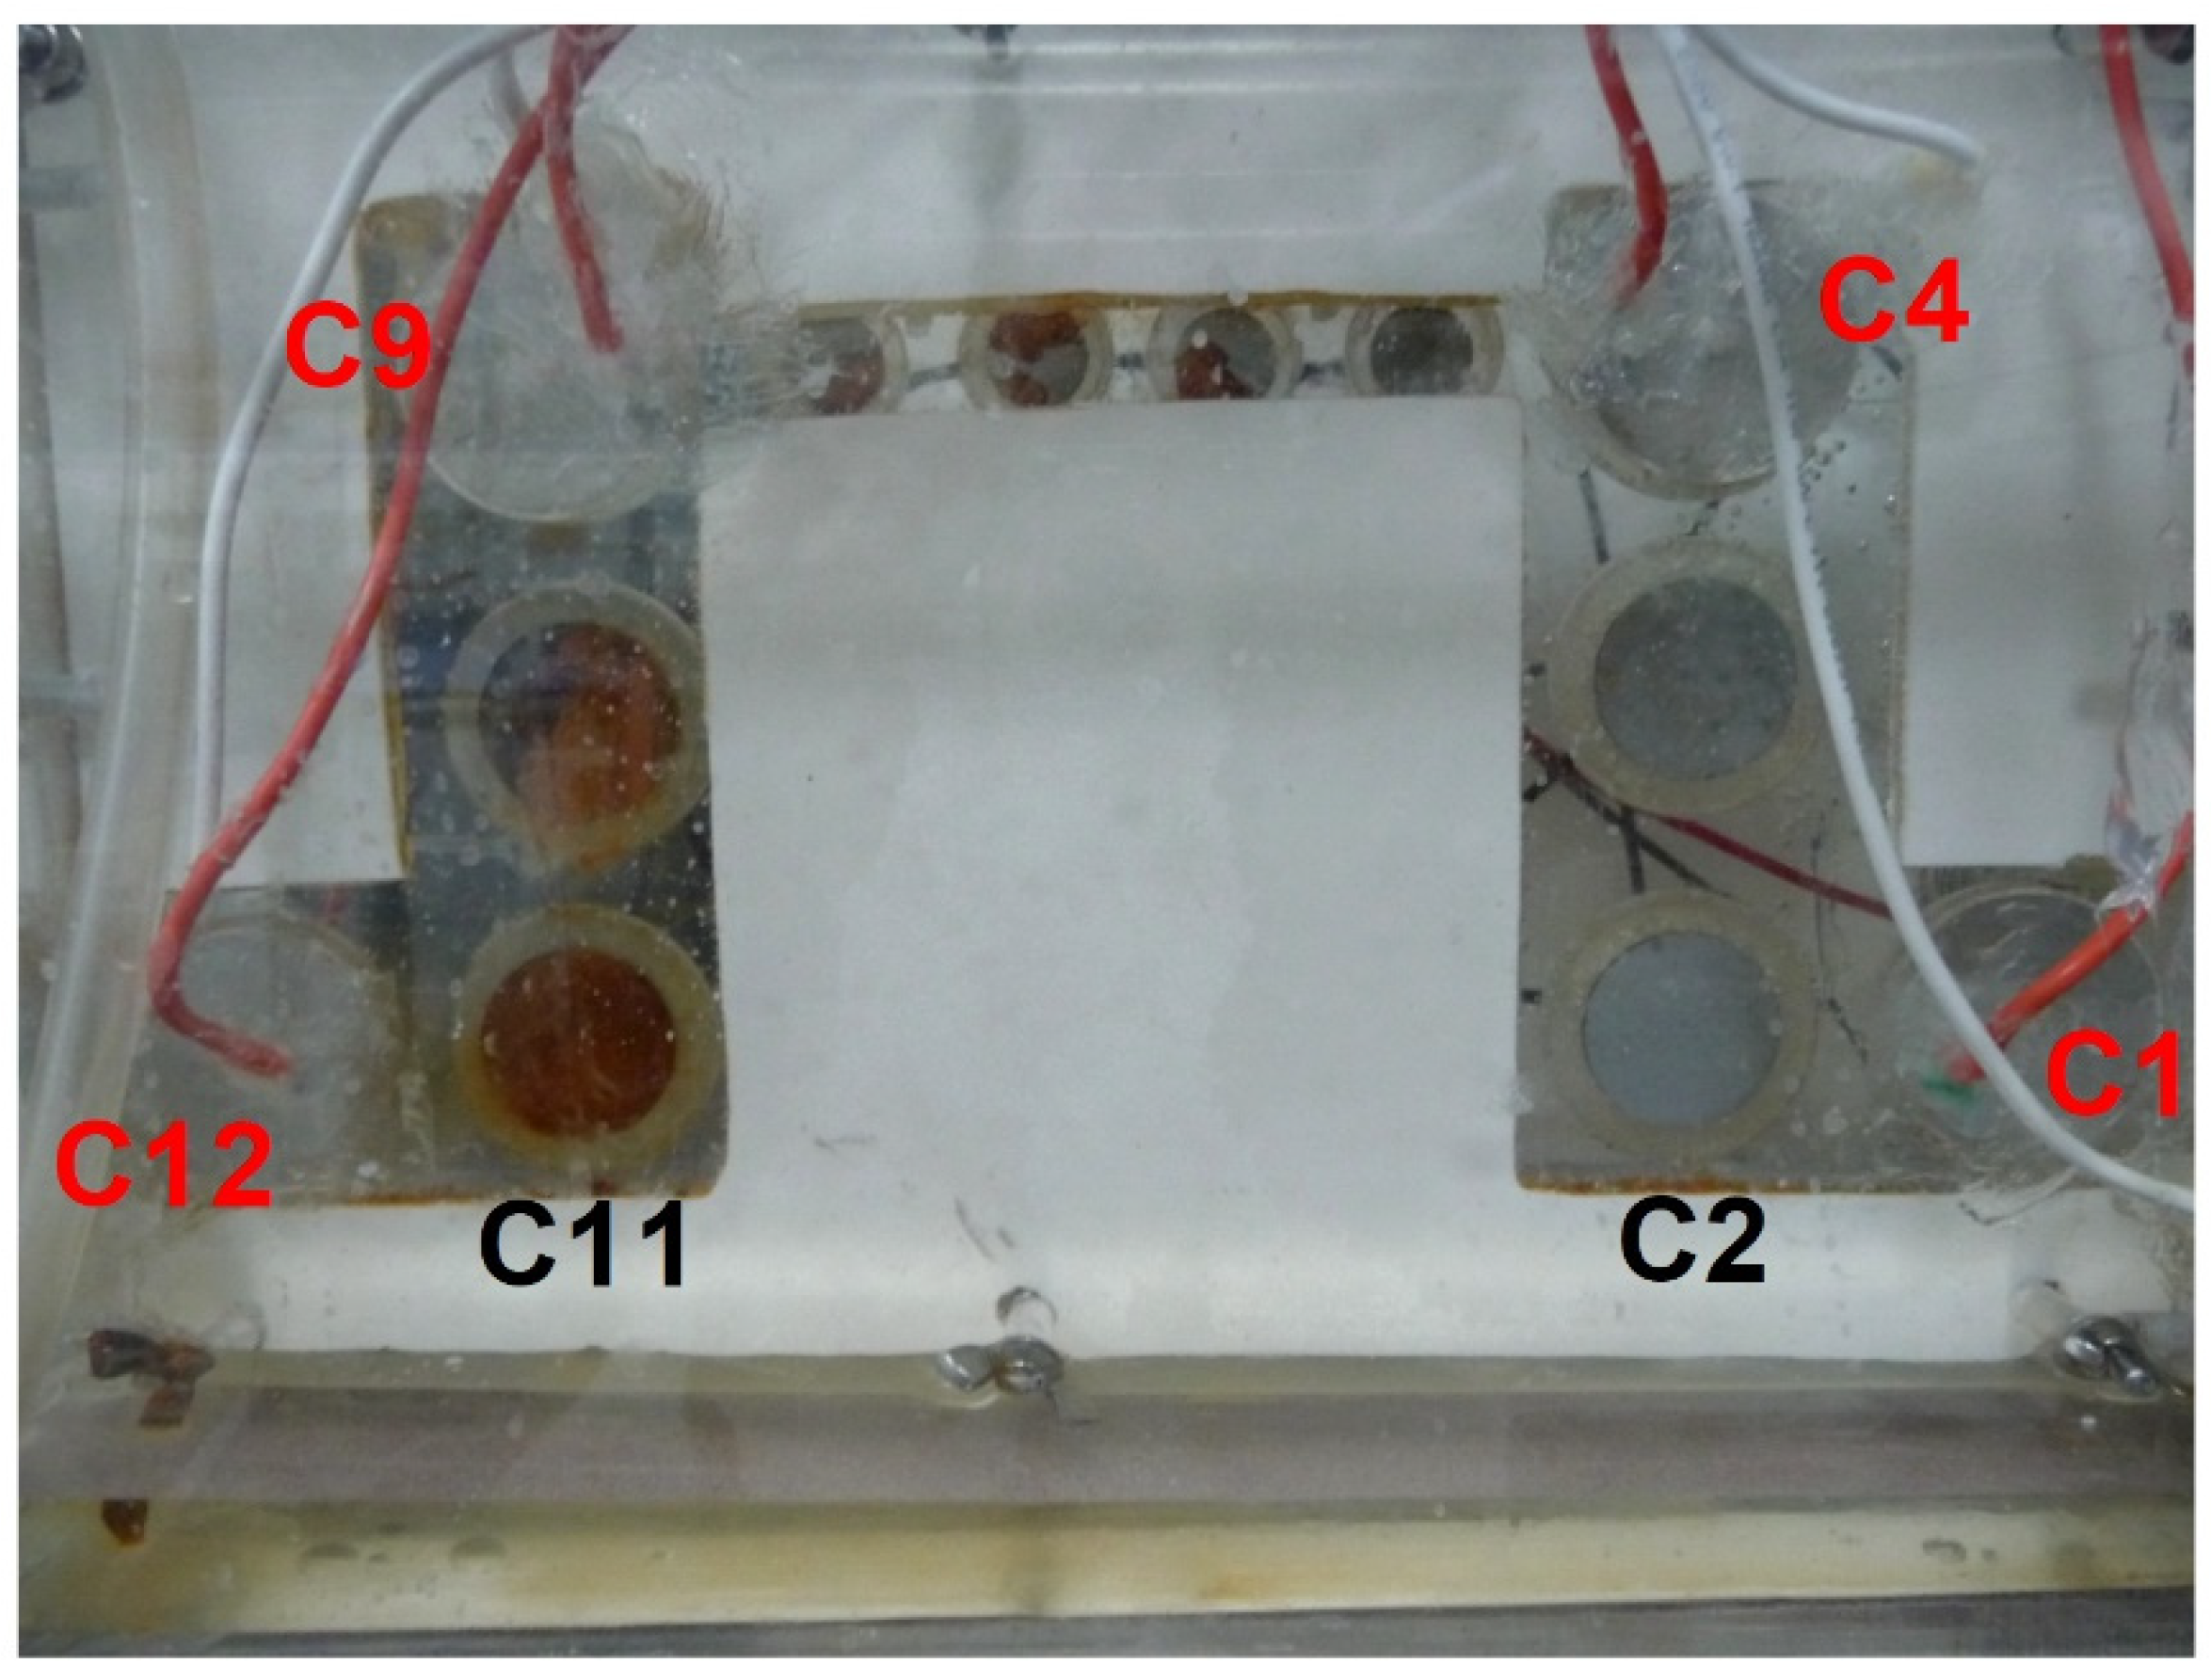
Thirdly, it is observed that the values of the potentials were initially high and decreased with time during the first 32 days. At the beginning, the values ranged from −0.95 V vs. Ag/AgCl-seawater for C1 to −0.6 V vs. Ag/AgCl-seawater for C9 and C12. This implies that C1 was correctly protected as soon as CP was applied while the protection was insufficient for C9 and C12. This could be visually appreciated as illustrated in
Figure 6. The picture was taken five days after the beginning of the experiment. Coupons C11 and C2 clearly illustrate the effects of the increase of
EIR free inside the channel. C11 is obviously entirely covered by a rust layer, i.e., is not correctly protected, while C2 is covered by a whitish layer, i.e., the calcareous deposit, which demonstrates that this coupon is indeed protected against corrosion.
The potential of each coupon decreased with time during the first 32 days and stabilized afterwards. At the end of the experiment, all the
EIR free values were below −0.85 V vs. Ag/AgCl-seawater, i.e., all the coupons could be considered as correctly protected according to CP standards, e.g., [
11]. This decrease in potential is due to the decrease in the ohmic drop, which is necessarily due to a decrease in the current required for CP because the other parameter, i.e., the resistance of the electrolyte circuit, does not vary significantly (if at all). This decrease with time in the current required for CP is a well-known effect of calcareous deposition [
1,
2,
3,
4]. The mineral layer hinders the diffusion of O
2, decreases the active area of the metal, and thus slows down the cathodic reaction rate.
As shown in
Figure 5, the potential of C1 decreased rapidly from −0.95 to −1.03 V vs. Ag/AgCl-seawater, and a calcareous deposit could form in a few days on its surface [
3,
4]. As shown in
Figure 6, the whole surface of C2 was covered with such a mineral layer after 5 days. The decrease in the current flowing from C3, C2 and C1 consequently led to a decrease in the ohmic drop for C4 and its potential dropped from −0.75 to −0.97 V vs. Ag/AgCl-seawater after ten days. C4 was then itself progressively covered with a calcareous deposit. The current required for CP decreased in turn for C4, then C5, C6 and so on, so that the potential of all coupons finally decreased down to an acceptable value.
To illustrate the reproducibility of the results, the potentials measured at day 18 during the three experiments (21-day experiment and two 3.5-month experiments) are given in
Table 2. It can be seen that at that time, the values measured for C12 vary significantly from one experiment to the other. Coupon C12 is the farthest from the entry of the channel and its behavior depends on that of each of the other coupons. However, the values finally measured for C12 at the end of the two 3.5-month experiments were similar (about −0.9 V vs. Ag/AgCl-seawater).
3.3. Voltammetry
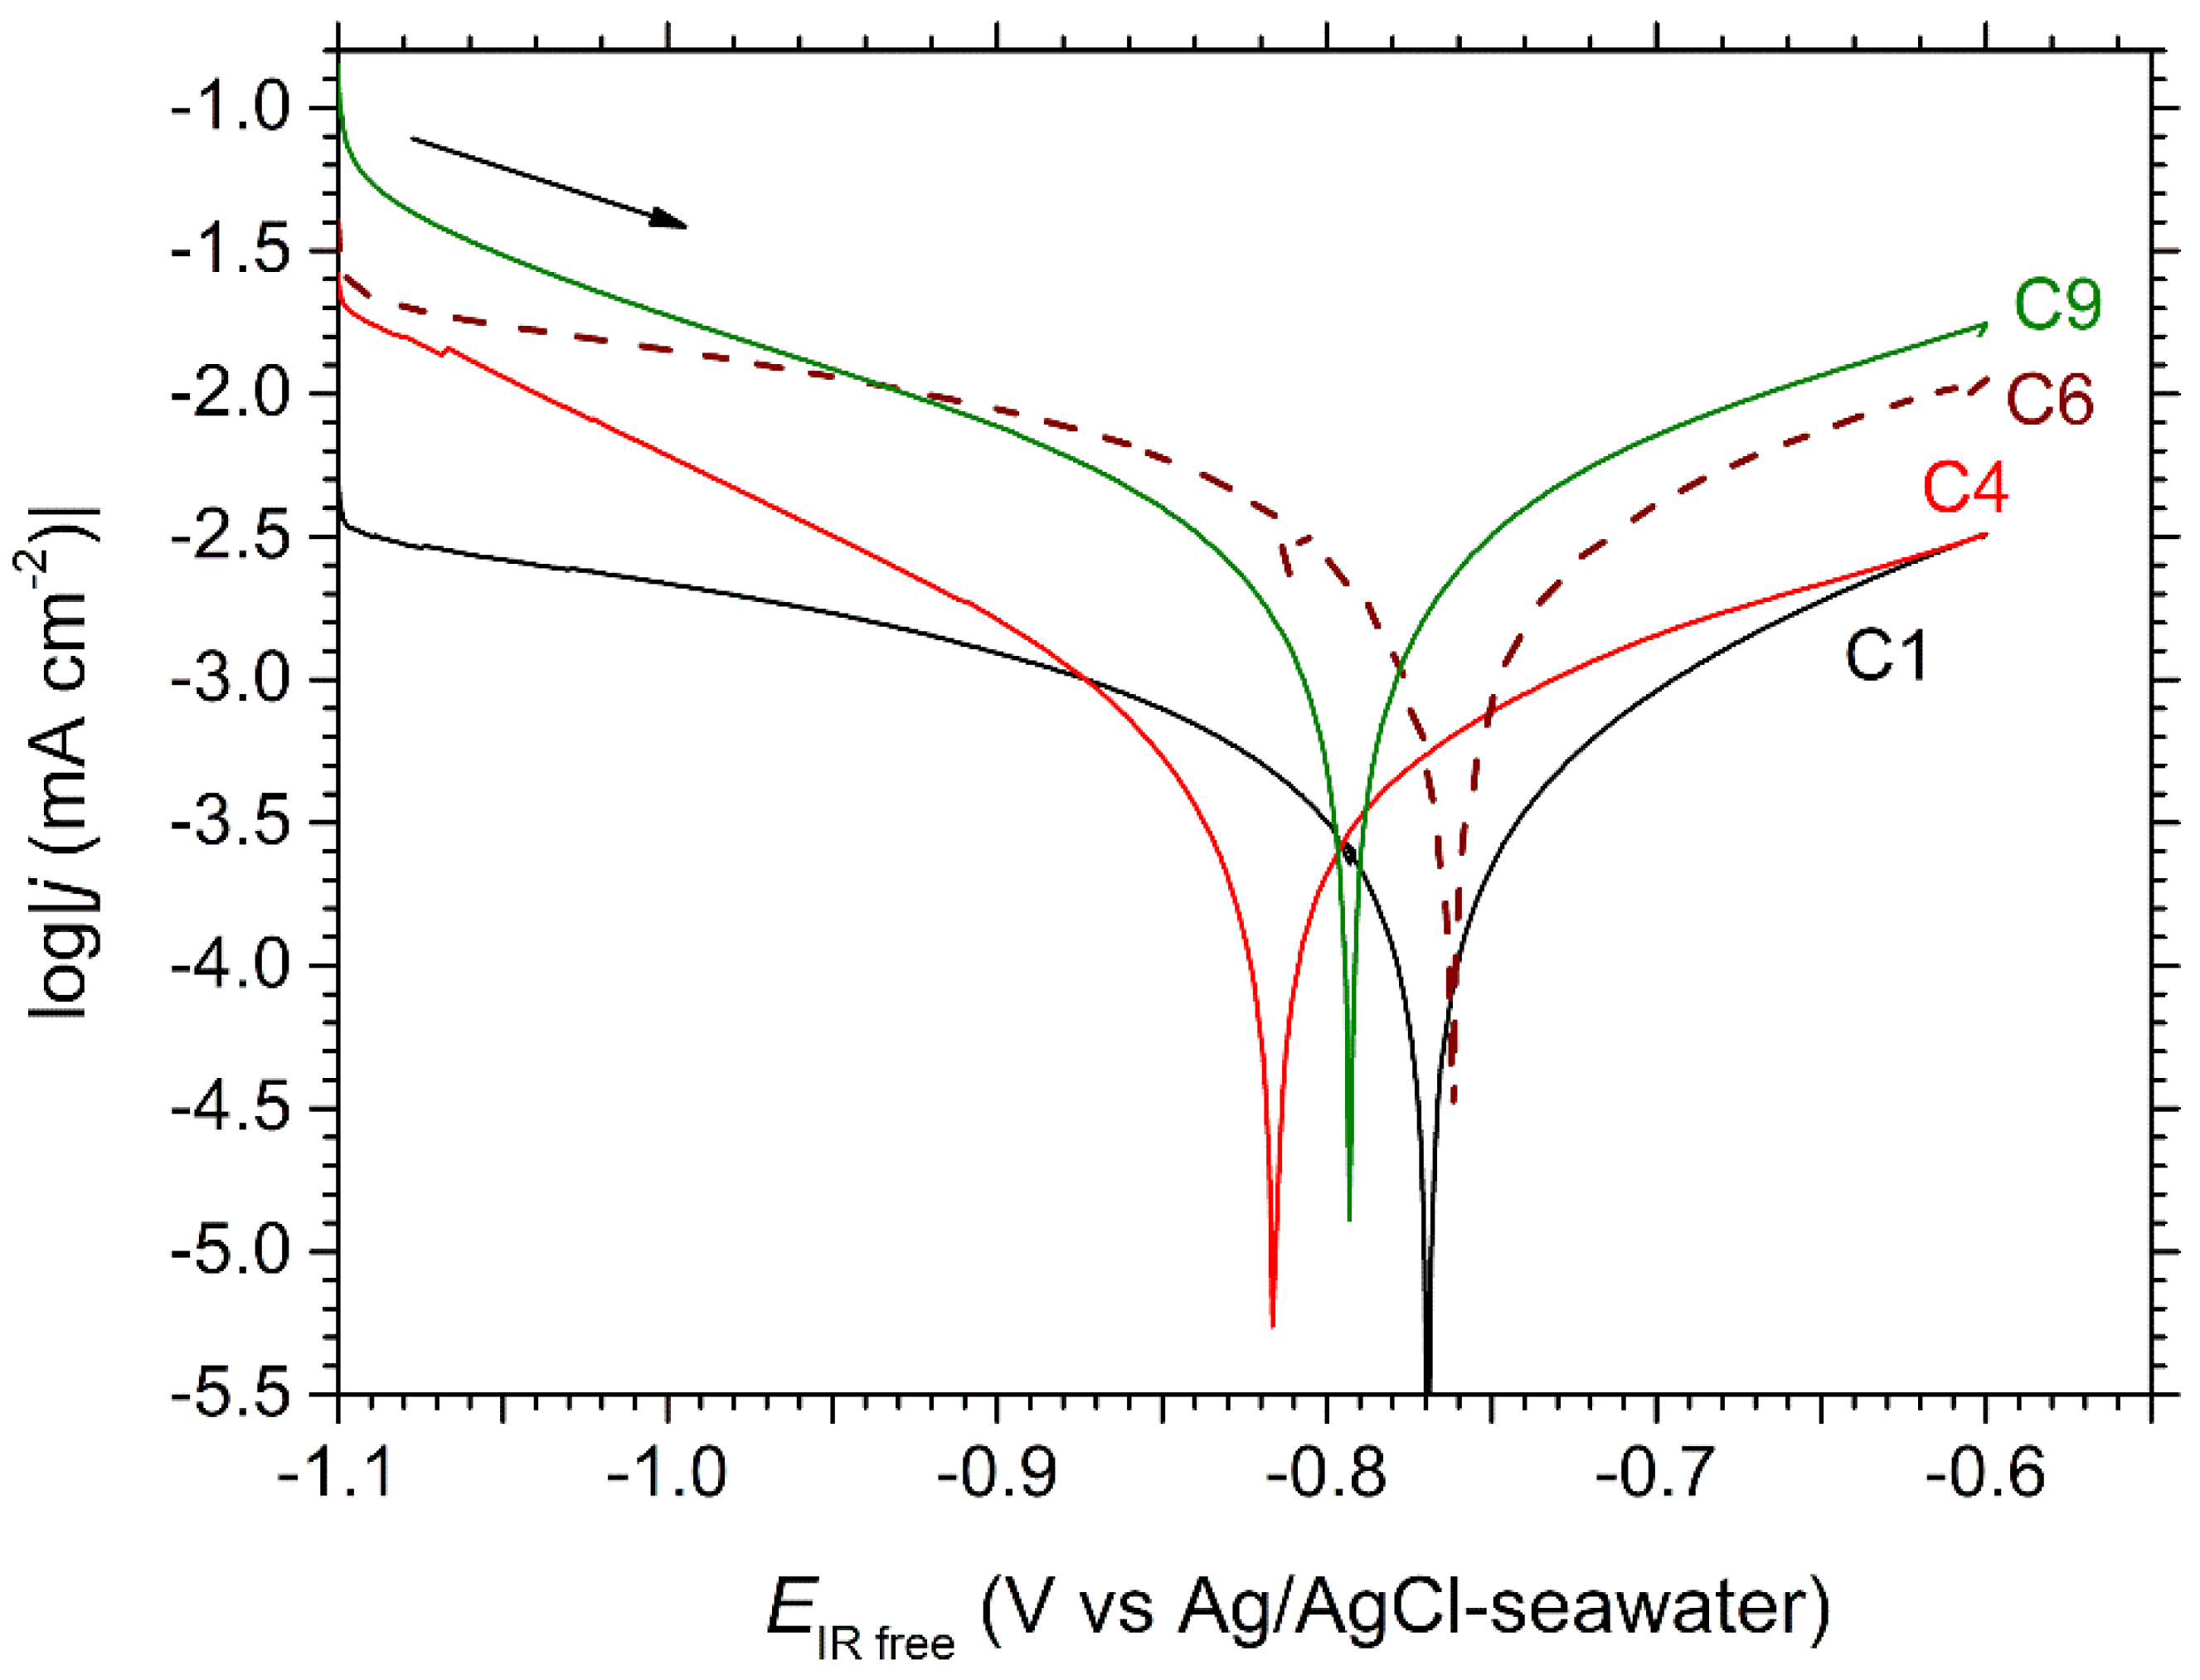
The polarization curves obtained for coupons C1, C4, C6 and C9 are displayed in
Figure 7. The curve obtained for C12, very similar to that of C9, was omitted for clarity.
First, it is observed that the corrosion potential varies between −0.82 V vs. Ag/AgCl-seawater and −0.76 V vs. Ag/AgCl-seawater, without any apparent link with the position of the coupons inside the channel. In contrast, both anodic and cathodic parts of the curves are shifted to higher current densities from C1 to C9. This evolution can be attributed to the calcareous deposit, which may be more protective for the coupons that were polarized at a lower potential during a longer time. Numerous studies devoted to calcareous deposition on steel in seawater demonstrated that a decrease in potential, in the range between −0.85 to −1.05 V vs. Ag/AgCl-seawater, led to denser and thicker layers [
3,
4,
12]. A longer polarization time, at a given potential, also increases the thickness and decreases the porosity of the calcareous layer [
3,
4,
13].
The anodic part of the log|
j| vs.
EIR free curve proved linear in any case, with similar anodic Tafel slopes, for C4, C6 and C9, (i.e., 281, 287 and 272 mV/decade) and a significantly different slope for C1 (220 mV/decade). As for the cathodic part, two behaviors can be observed. In the case of C1 and C6, the polarization curve bends progressively, from
Ecor to more cathodic potentials, so that the slope of the curve becomes very small below −0.9 V vs. Ag/AgCl-seawater. This shows that the kinetic of the cathodic reaction, i.e., mainly O
2 reduction, is strongly influenced by mass transport. Thus, the polarization curve tends towards a diffusion plateau at the lowest potentials. In the case of C4 and C9, the influence of mass transport is less important, and the slope of the polarization curve remains high at the lowest potentials. This difference is thoroughly discussed in
Section 4.
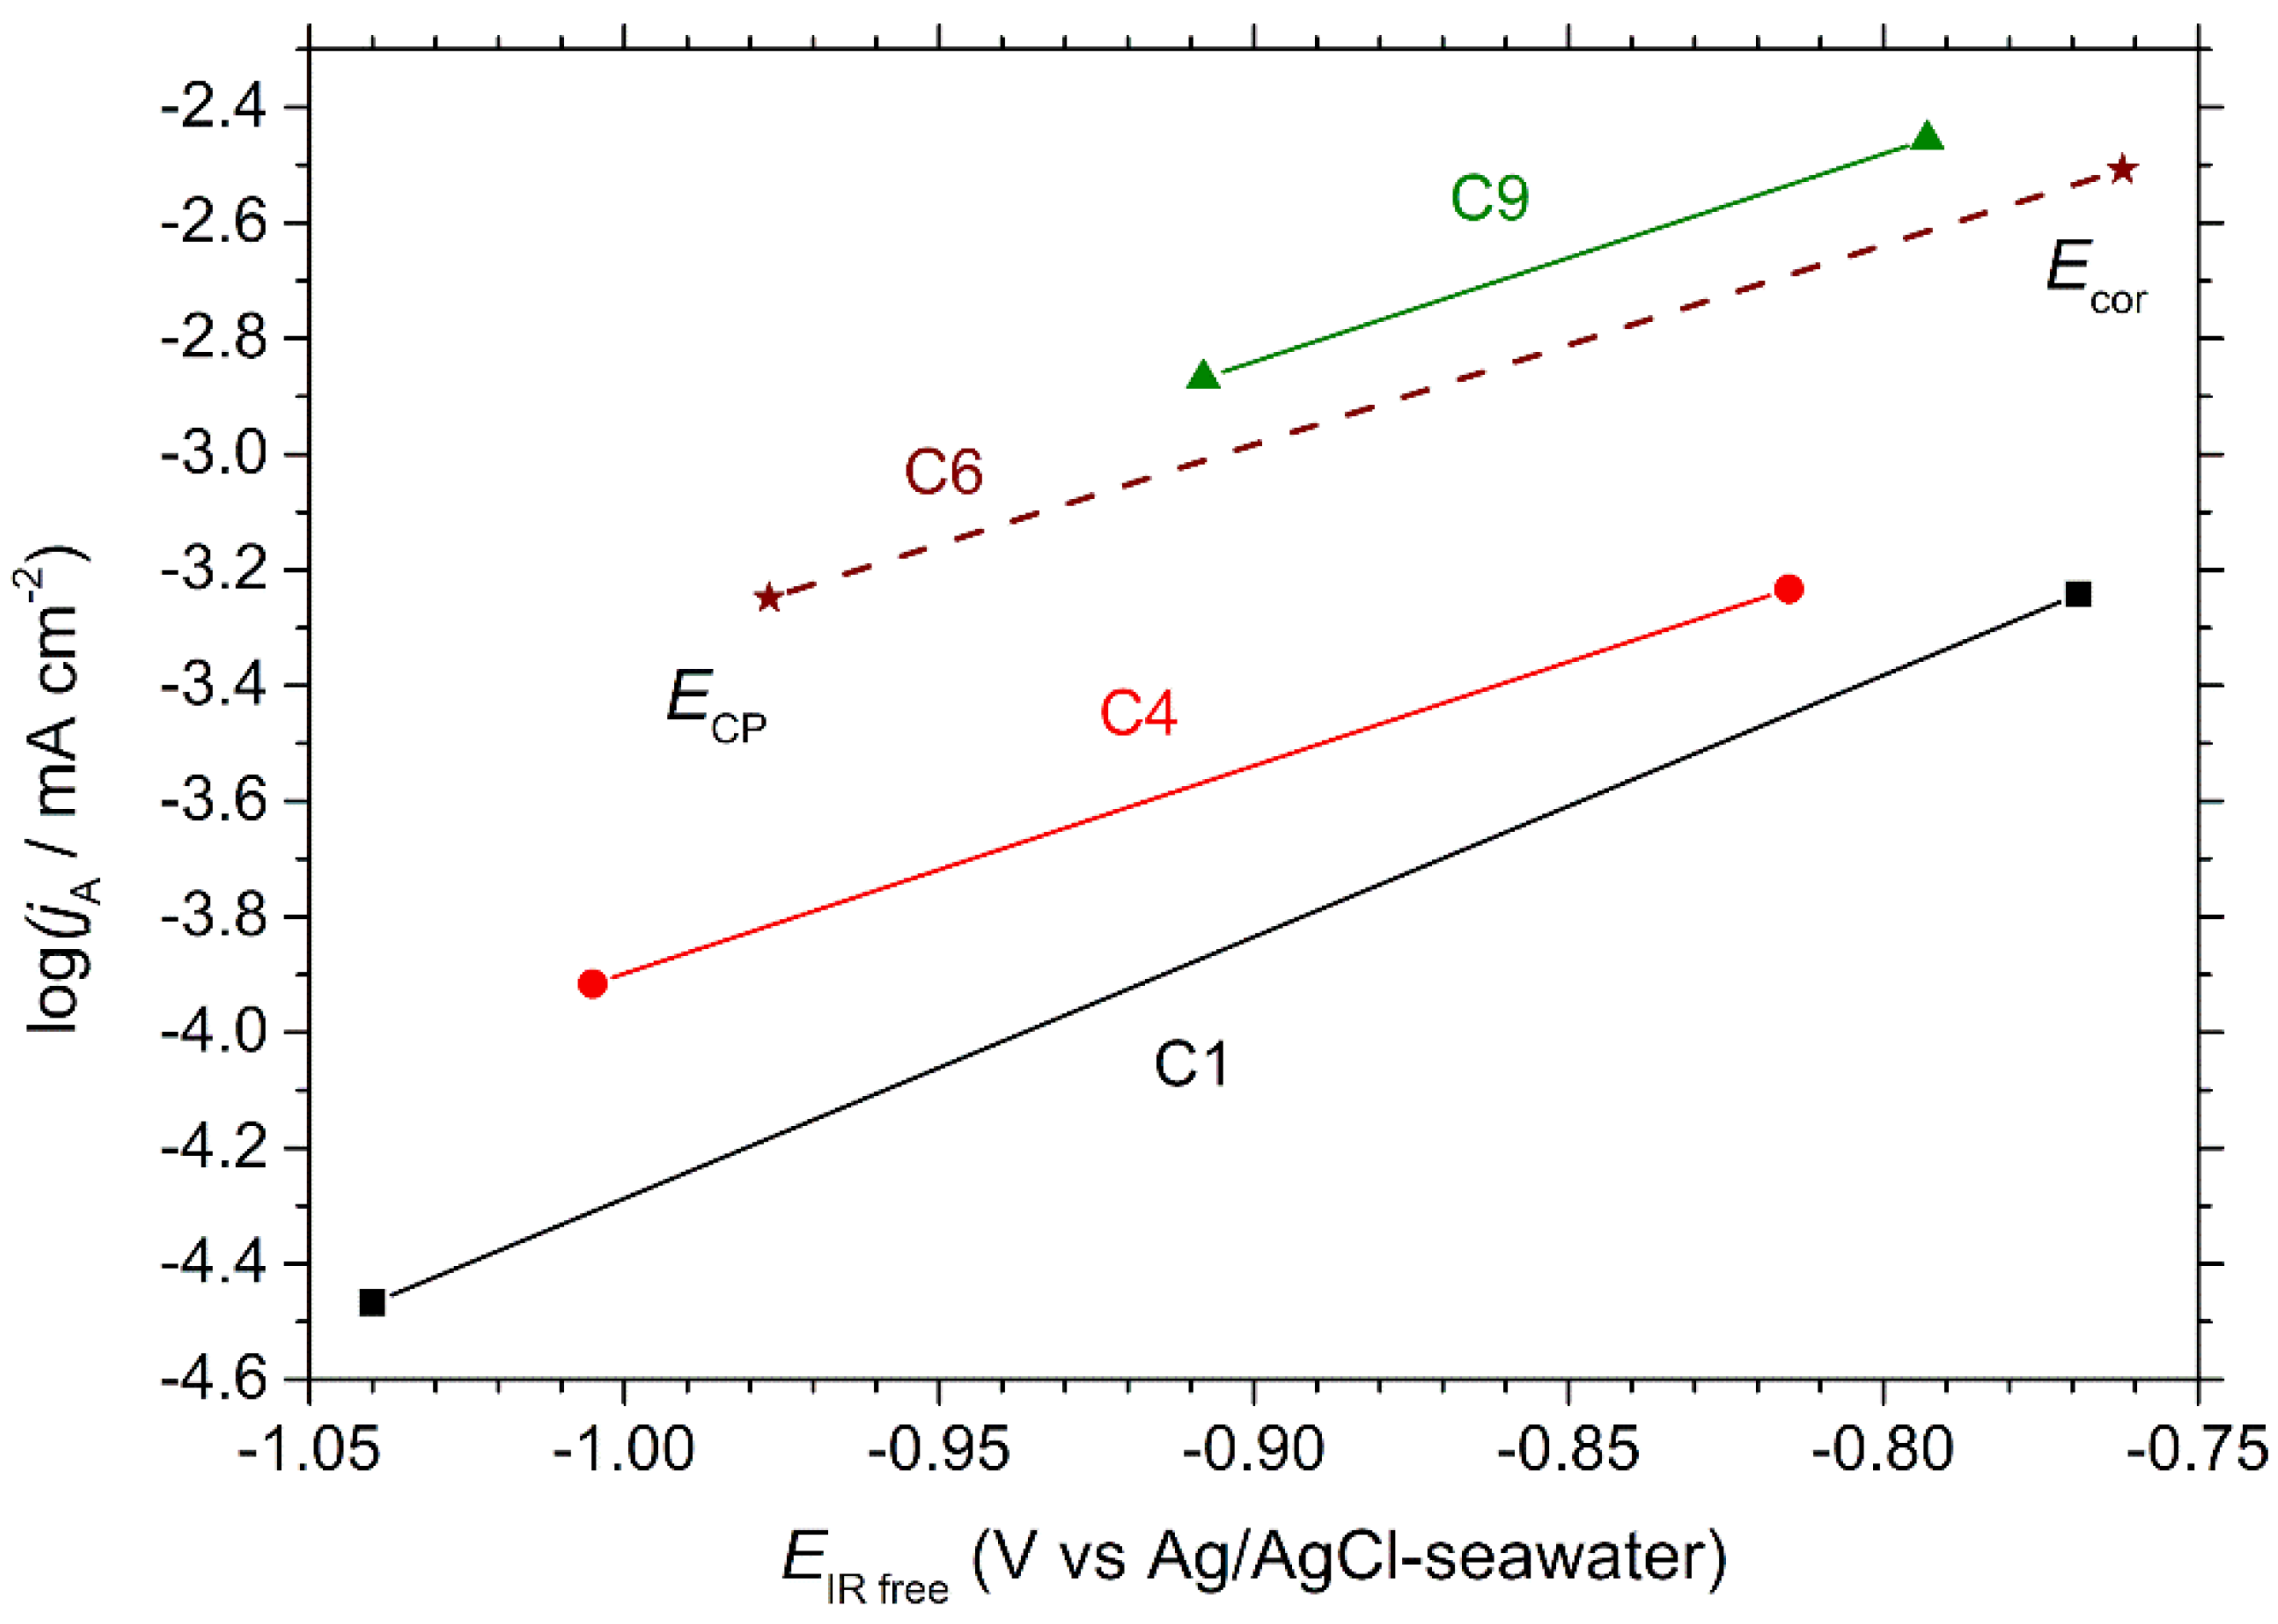
The cathodic reaction being partially controlled by diffusion, the polarization curves did not obey Tafel law in the cathodic domain. Consequently, only the anodic part of the curve was considered for an interpretation of the voltammetry results based on the Tafel method. The anodic Tafel lines were then drawn and extrapolated down to
ECP, i.e., the final potential reached by the coupon at the end of the CP experiment. This extrapolation led to an estimation of the corrosion current density
jcor, i.e., the value
jA(
Ecor) of the anodic current density at
EIR free =
Ecor. Similarly, the value
jA(
ECP) of the anodic current density at the potential applied during CP gave an estimation of the residual anodic current density, i.e., the residual corrosion rate, expected low, reached under CP (see references [
6,
7,
8,
9] for more details). The obtained anodic Tafel lines, drawn for each coupon between
Ecor and
ECP, are displayed in
Figure 8. Using Faraday’s law, the obtained
jcor and
jA(
ECP) values could finally be converted to corrosion rates. All the obtained values (potential, current density, and corrosion rate) are listed in
Table 3.
First, as can be seen in
Figure 8 and read in
Table 3, the corrosion rates of C1 and C4, almost identical, are significantly lower than those of C6 and C9, which are quite similar. This effect can be attributed to the calcareous deposit [
4], which constitutes a more protective barrier against corrosion for coupons C1 and C4 polarized at lower potentials than C6 and C9 all through the experiment (see for instance
Figure 5 to compare C1 and C4 with C9). The corrosion rate estimated for C1 and C4, i.e., 7 µm yr
−1, is actually very low, which indicates that the calcareous deposit provides an efficient protection against corrosion, at least a short time after the interruption of CP. Besides, it cannot be excluded that the increase of the interfacial pH promoted the formation of a nanometric passive or pseudo-passive layer on the steel surface.
The estimated residual corrosion rate increases from C1 to C9. As illustrated by
Figure 8, this rate is not only linked to the
ECP values, but also to the respective positions of the anodic Tafel lines. Let us consider C6 and C9. In this case, the anodic Tafel lines are close but the
ECP value of C6 is significantly lower than that of C9. Consequently, CP is more efficient for C6 because the potential of this coupon is more cathodic. If we now compare C6 with C4, we can see that the
ECP values are not so different, but the anodic Tafel line of C4 is located at much lower current density values. In this case, CP is more efficient for C4 mainly because of the positioning of its anodic Tafel line. As explained earlier, the decrease of both anodic and cathodic current densities is due to the calcareous deposit. In other words, at the end of the experiment, CP was more efficient for C4, if compared to C6, because C4 had been previously polarized at a lower average cathodic potential, which had led to the formation of a more protective calcareous deposit (and maybe a more protective nanometric pseudo-passive layer). In the case of coupon C1, the anodic Tafel slope, different from that characteristic of coupons C4, C6 and C9 (
Figure 8), is another factor that explains the very low residual corrosion rate (
Table 3).
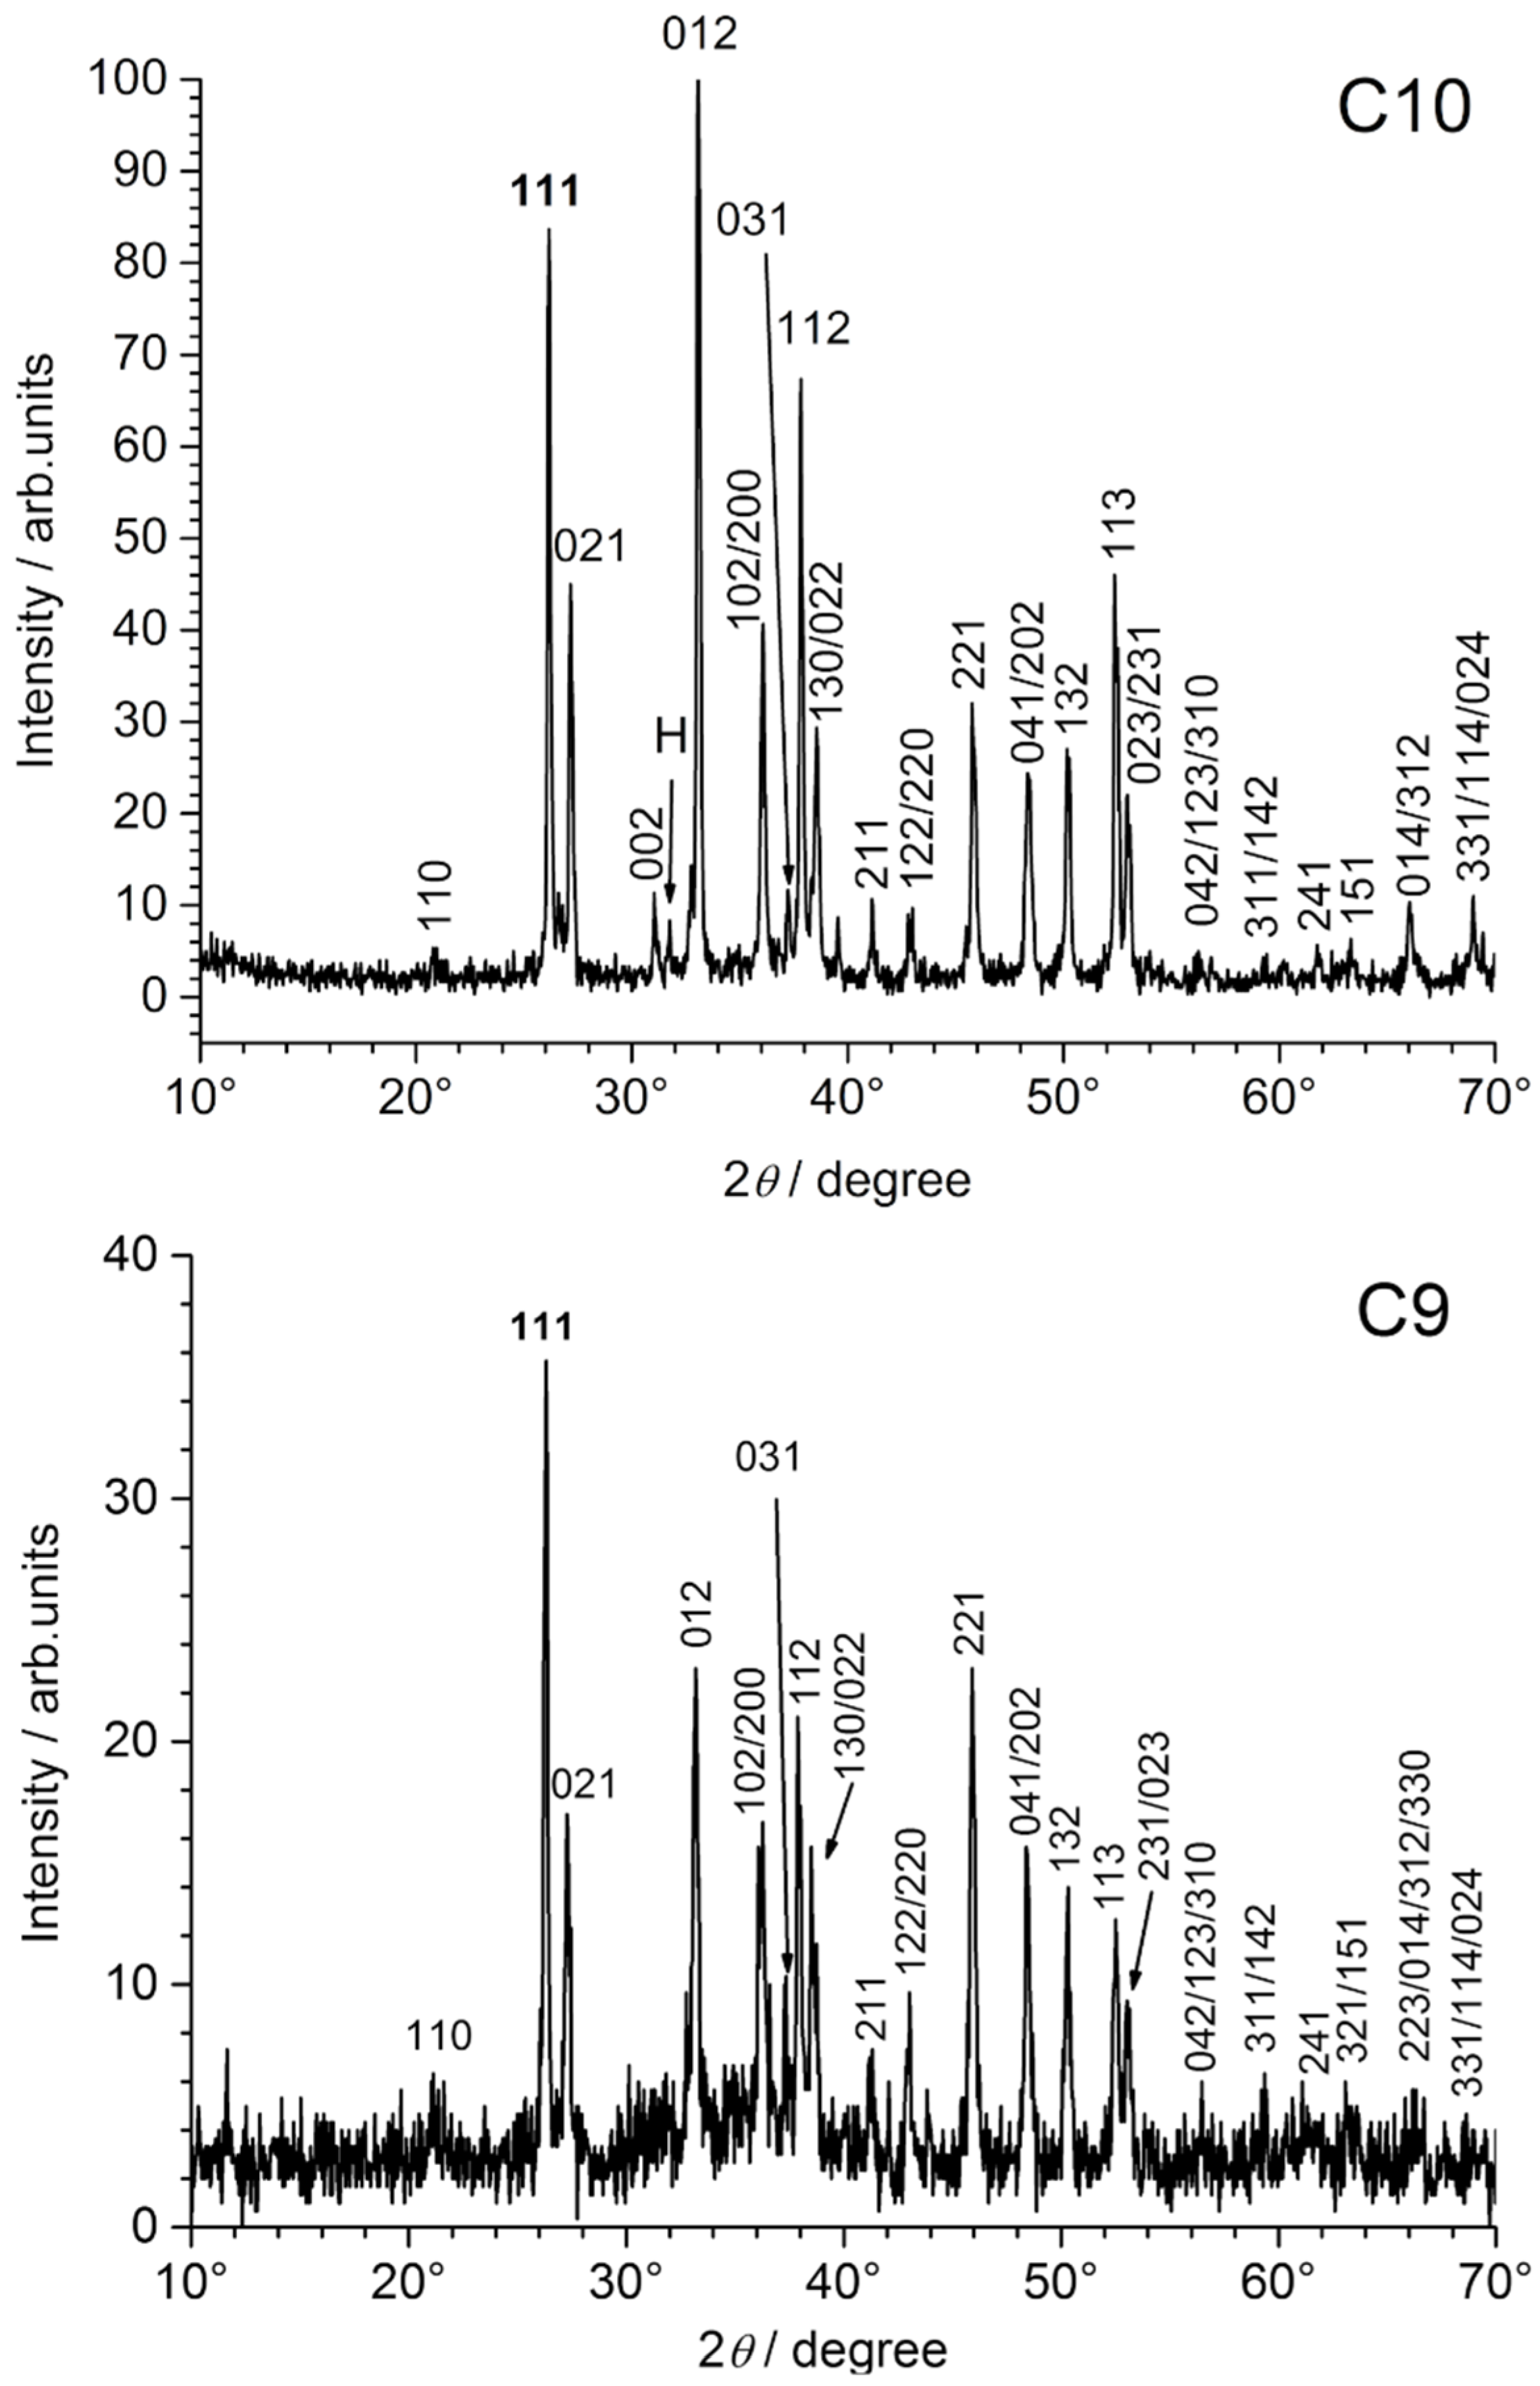
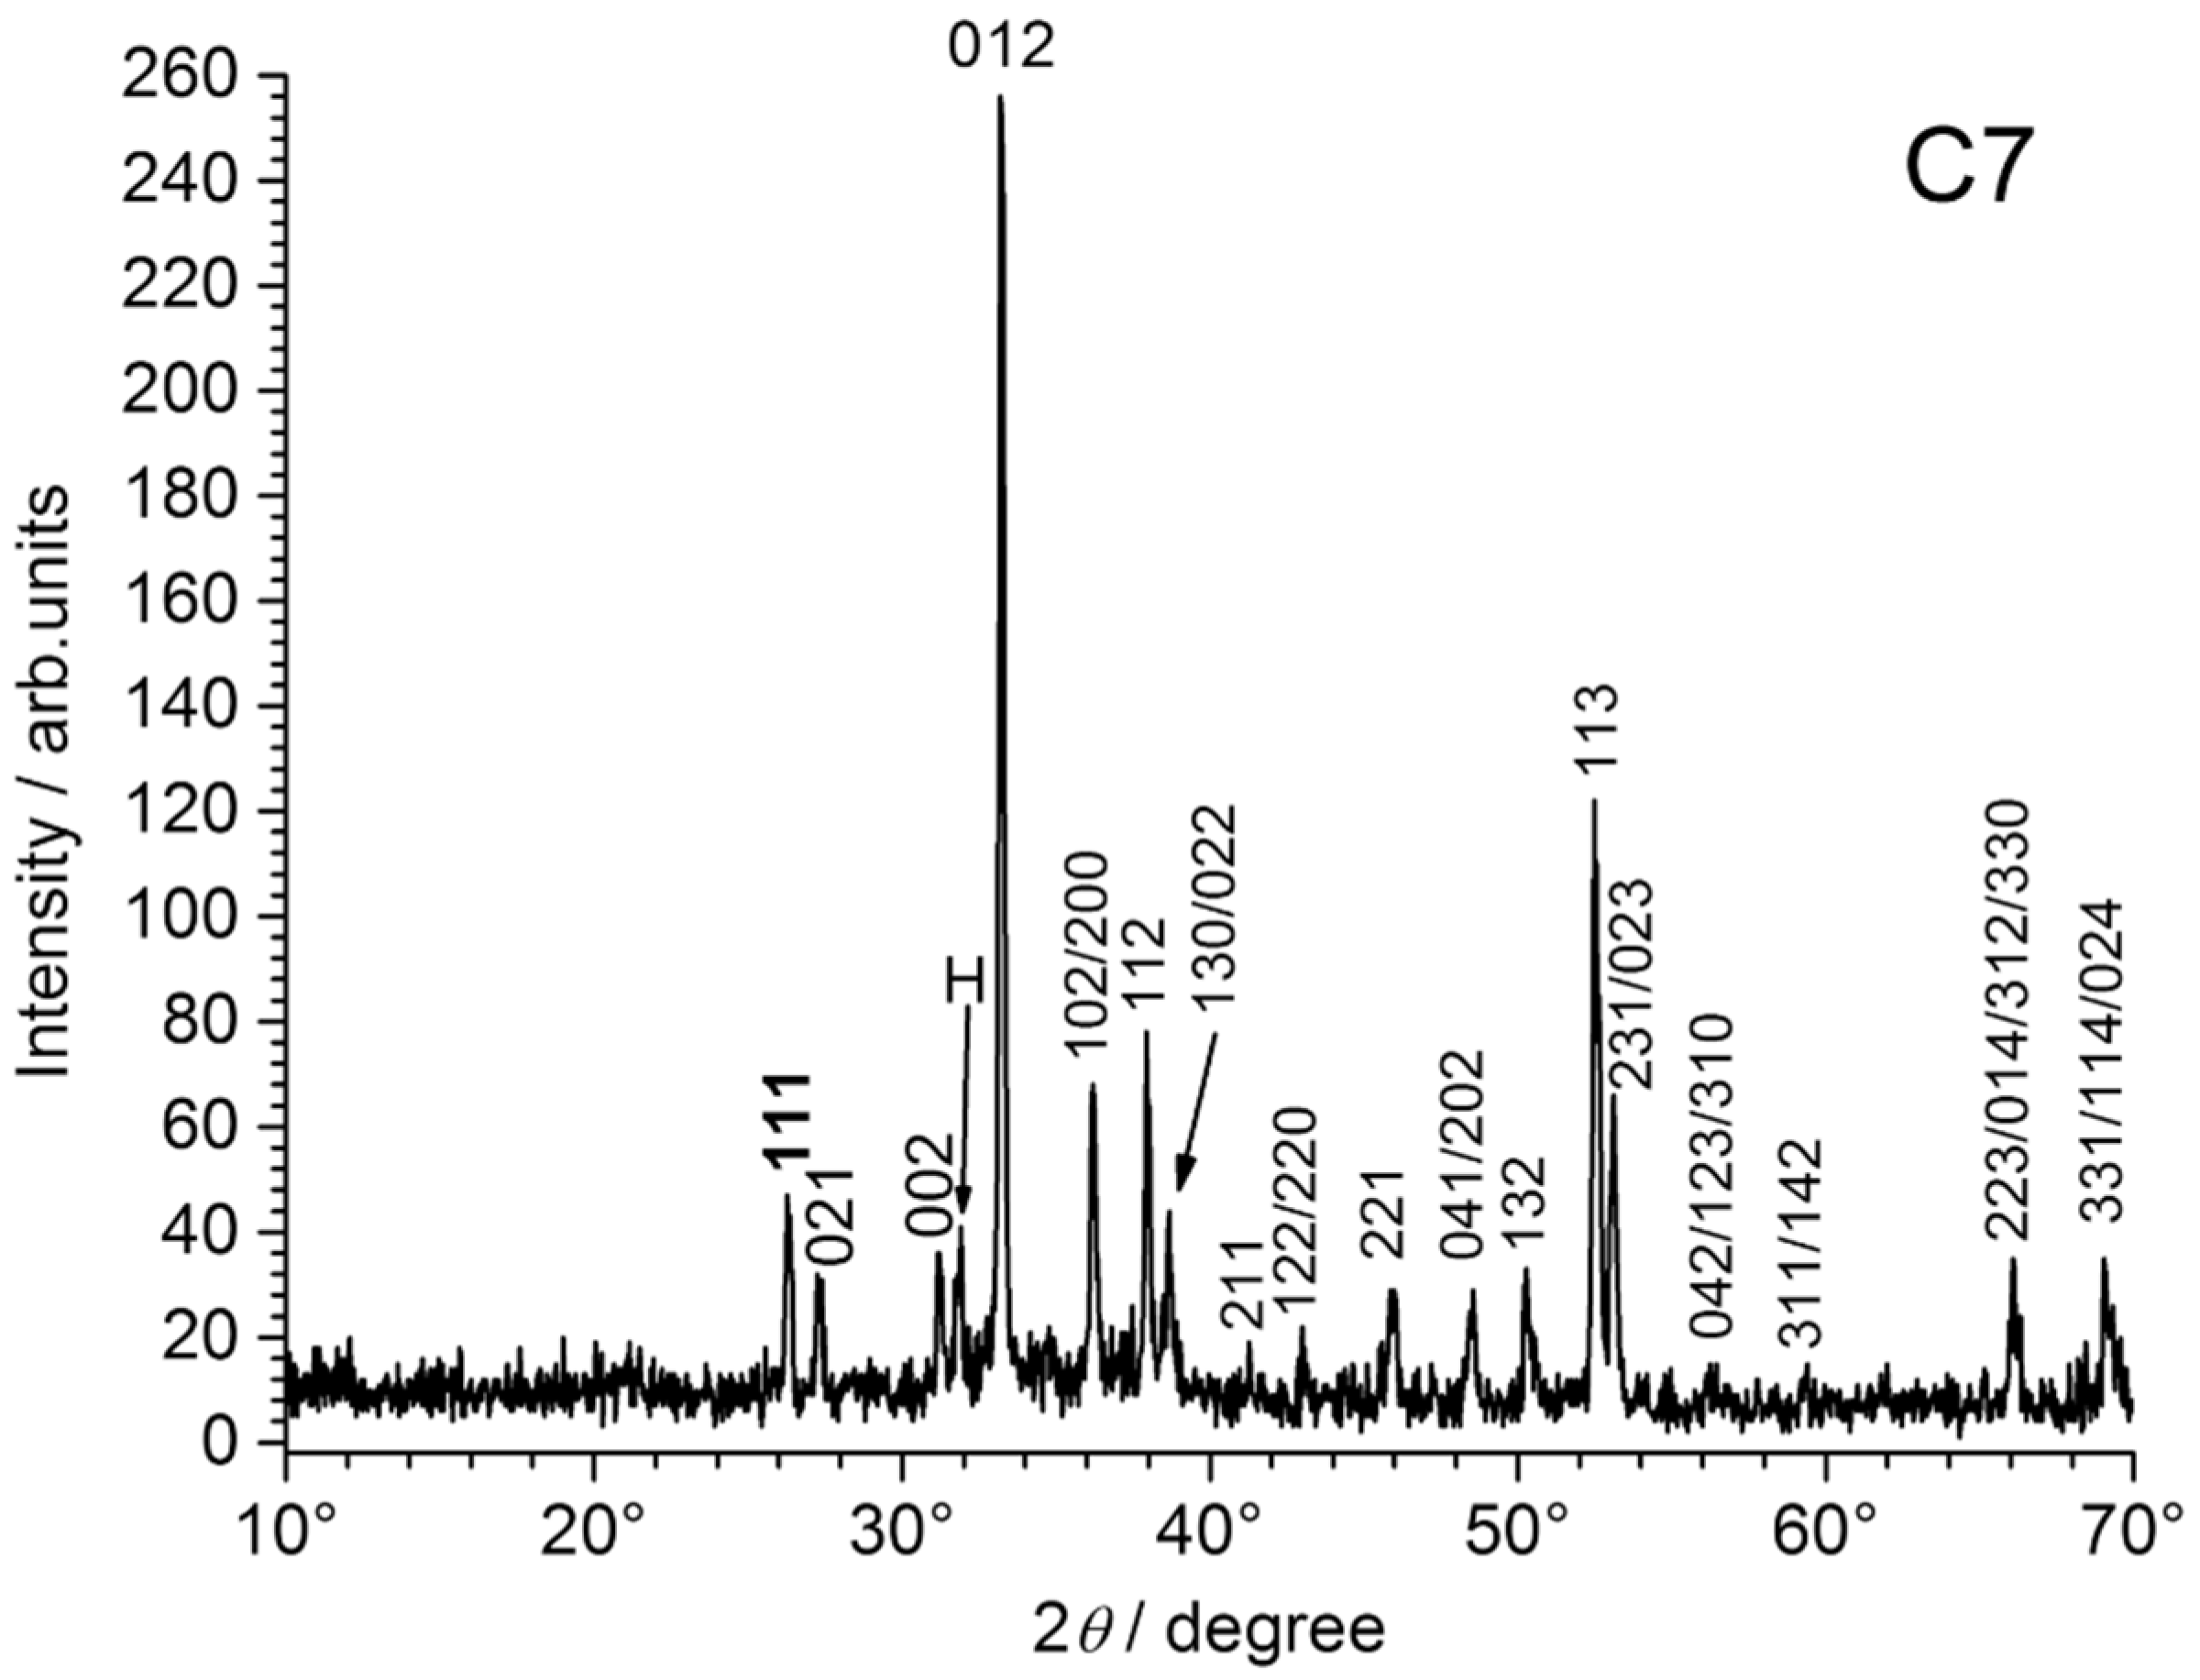
3.4. XRD Analysis
The XRD patterns obtained for coupons C7 and C9 are displayed in
Figure 9.
In any case, the surface of the coupons, once extracted from the experimental device, was gently rinsed with deionized water. For the coupons covered with a fluffy layer of orange corrosion products (C11 and C12 for instance, see
Figure 6), this rinsing removed most of the corrosion products. These products were analyzed separately and consisted mainly of lepidocrocite γ-FeOOH (data not shown).
Therefore, the XRD analysis reveals only the nature of the mineral layer formed on the steel surface below the orange corrosion products (if present). For all coupons, this mineral layer proved to be composed only of aragonite CaCO
3, as illustrated for C7, C9 and C10 in
Figure 9. This is consistent with previous works dealing with calcareous deposition on steel immersed in seawater under cathodic protection [
1,
2,
3,
4].
When compared to the corresponding ICDD-JCPDS file, it appeared that the aragonite crystals exhibited a preferential orientation, revealed by an increased intensity of the 012 diffraction line. This phenomenon proved much more pronounced for coupons C5–C8, i.e., for the coupons set in the smaller part of the channel. The XRD pattern of coupon C7, compared to those of C9 and C10 in
Figure 9, clearly illustrates this result.


