
Probabilistic Assessment of Biodeterioration Effects on Reinforced Concrete Sewers


1
Departamento de Construcciones Civiles, Universidad Francisco de Paula Santander, Avenida Gran Colombia No. 12E-96 Colsag, Cucuta 540003, Colombia
2
Department of Civil and Environmental Engineering, Universidad de Los Andes, Carrera 1 Este No. 19A-40, Edificio Mario Laserna, Piso 6, Bogota 111711, Colombia
3
Laboratory of Engineering Sciences for the Environment (LaSIE UMR CNRS 7356), La Rochelle Université, Avenue Michel Crépeau, CEDEX 1, 17042 La Rochelle, France
*
Author to whom correspondence should be addressed.
Corros. Mater. Degrad. 2022, 3(3), 333-348; https://doi.org/10.3390/cmd3030020
Submission received: 12 June 2022
/
Revised: 28 June 2022
/
Accepted: 4 July 2022
/
Published: 10 July 2022
(This article belongs to the Special Issue Corrosion of Steel Reinforcement in Concrete: Furthering Knowledge within and beyond Boundaries)
Abstract
:The worldwide current practice of the structural design of sewers is based on procedures which usually include the effects caused by chemical and biological deterioration. However, in the last few decades, many sewer pipes have been designed using reinforced concrete which have succinctly considered such deterioration promoters. Indeed, knowledge related to reinforced concrete deterioration processes has become an important issue when forecasting the expected or remaining lifespan of sewers. Within these processes, thickness and strength losses and porosity augments have been found to be the result of the vital activity of sulfur-oxidizing bacteria and some types of fungus. This paper presents a rational methodology that uses biodeterioration measurements to describe how biodeterioration effects can affect the probability of failure during the lifetime of sewers. The probability of failure was obtained using Monte Carlo simulations based on numerical sampling from lognormal and uniform distributions. The concrete and reinforcement strength, geometric properties, H2S concentration in the headspace, and load values were considered as the main sources of uncertainty. The results indicate that the expected service lifespan can vary between 55 and 37 years for low and high H2S concentrations, respectively.
1. Introduction
Reinforced concrete sewers are usually exposed to highly varying and aggressive work conditions during their lifetimes. They are built underground, supporting important infill and traffic loads which can lead to soil settlement and structural material cracking [1]. Inside a typical sewer, different hazards can arise for its structure: (a) diluted and deposited solid matter and the velocity variability of running water can modify the surfaces roughness and the concrete cover thickness [2], (b) the existence of gases such as carbon dioxide and hydrogen sulfide promote chemical deterioration [3], (c) byproducts coming from the growth of microorganisms existing in wastewater and moist walls increase the harmful chemical reactions [4], (d) concrete strength losses with subsequent cross-section reduction change the structural properties [5,6,7,8,9], (e) the variability of the real hydrogen sulfide concentration imposes high uncertainty in deterioration processes [10,11,12,13,14,15], (f) superimposed loads and biodeterioration processes typically lead to the prevalence of pipe crown failure [16,17,18,19,20,21], and (g) chloride diffusion can corrode the steel reinforcement [22,23]. The combination of mechanical, chemical, and biogenic hazards can reduce the sewer’s service life significantly [24,25].
The sewer’s failure affects infrastructure investment adversely and jeopardizes human health [26]. Hence, appropriate design and management procedures are indispensable for the optimization of the sewer’s level of service. However, although modern design aids and data from powerful sewer inspection systems are available [10,11,27,28,29], the current design practice is still based on procedures which are mainly focused on the mechanical relationships of the problem [28,30,31]. Likewise, the inclusion of chemical and biogenic aspects has been strongly recommended. Nonetheless, most designers still emphasize their work in solving exclusively physically related algorithms [32,33].
Concrete weight, strength losses, and porosity augments are related to the early failure of sewers. Although there is evidence of 70-year-old sewers maintaining an acceptable service level, others have failed after only ten years of service [29,30,34,35]. The differences in the performance of these systems can be associated with wastewater quality variations, material behavior, and wastewater flow characteristics. Some research works have suggested that the legislation for the reduction of metal contaminants in sewer systems, promulgated in the 1980s in the USA and Europe, brought an important diminution of biologically toxic elements within sewers, allowing a larger and faster proliferation of microorganisms capable of producing biodeterioration [10,11,36,37]. In addition, the increased wastewater transport demand of the last few years has produced important augments in the caudal, velocity and turbulence of running water, which remove the layers of corroded material formed over years. The corroded layer’s removal facilitates continuous biofilm renewal on exposed surfaces and the penetration of the front of biodeterioration into deeper layers of the concrete matrix [38,39,40,41].
This paper proposes a methodology to assess the reliability of sewer pipes subjected to biodeterioration effects. The mechanical strength and demand variation of the bending moment in the crown and walls of a typical sewer are forecasted. The document is organized in seven sections. Section 2 presents some topics related to the effects of biodeterioration on the material properties. Section 3 summarizes the fundamentals and procedures currently used in the structural design of sewers. Section 4 describes a proposal to incorporate the effect of biogenic activity in the structural design of sewers. In Section 5, a practical example of the proposed methodology is solved. Finally, Section 6 and Section 7 state the conclusions and recommendations.
2. Influence of Biodeterioration on Concrete Properties
Biodeterioration kinematics can accelerate harmful effects on concrete such as carbonation and cracking in sewers [5,42,43]. On the other hand, the ecology of the microbial communities is highly dependent on the concrete pH [12,16]. The high alkalinity of new concrete (a pH of about 12) inhibits microbial development upon the inner surfaces. However, carbonation and exposure to hydrogen sulfide reduce the concrete pH to a point at which neutrophilic bacteria and fungi can thrive, producing acidic metabolites which in turn lower the pH to a point at which acidophilic bacteria appear [44]. The porosity increase and strength and weight losses have been associated mainly to sulfur oxidizing bacteria (SOB) and the activity of some fungi [45,46]. SOB oxidize hydrogen sulfide or reduced sulfur compounds and produce sulfate or sulfuric acid [47,48,49]. Sulfuric acid reacts with the calcium hydroxide of the cement matrix, forming calcium sulfate. In turn, the calcium sulfate reacts with calcium aluminate hydrate to form ettringite, which is an expansive material capable of breaking the superficial concrete layers [50,51,52]. Acidithiobacillus thiooxidans, Halothiobacillus neapolitanus, Starkeya novella, and Thiomonas intermedia are SOB which are widely known as promoters of concrete biodeterioration. Furthermore, the fungus Fusarium has been found to be capable of concrete deterioration, but the most aggressive strains are all SOB members of the phylum proteobacteria [3,12,53,54,55,56,57].
Concrete sewer maintenance and reparation activities related to the durability detriment due to biodeterioration effects are costly [26,58,59]. In biodeterioration processes, the durability detriment is mainly related to the development of a layer of high porosity produced by acid attack. This layer makes the concrete more permeable, less resistant, and susceptible to the greater diffusion of nocuous agents [60,61,62,63,64]. Three stages which are dependent on the pH of wet sewer surfaces have been proposed to describe the chronology of biodeterioration [11,54]. In the first stage, high alkalinity (pH > 9) significantly inhibits the microbial activity, and no deterioration is observed. Nonetheless, carbonation and the presence of hydrogen sulfide cause the pH to decay continuously. In the second stage (pH ranging from 9 to 4), neutrophilic organisms are responsible for medium-to-high thickness losses. Recently, the fungus Fusarium was found to be capable of producing thickness losses of up to 2.3 mm/year during the first year [16,46]. In the third stage, acidophilic bacteria produce severe thickness losses and rapid acidification (pH < 4). Each stage has a high uncertainty and can take months or years to develop. For this reason, biodeterioration must be modeled as a time-variant process throughout the structural lifetime [65].
A wide range of concrete weight and thickness losses produced by SOB and other microorganisms has been reported in the literature. Table 1 presents a summary of such findings. The large variation in measurements related to biodeterioration and its effect upon the durability of reinforced concrete sewers can be explained by considering the following facts:
- Biodeterioration can reduce the expected service life span from 50–100 years to less than 10 years [17].
- Temperature and relative humidity variations in the headspace can modify the sulfide uptake and lead to important variations in biodeterioration dynamics [27].
- Real H2S concentrations can vary from a few to hundreds of ppm. It has been observed that concrete deterioration increases when the H2S concentration becomes higher [66]. The biological and chemical nature of deterioration processes impose high variability in the sewer behavior, such that the use of analysis with probabilistic models is highly recommended [6,18,27,71].
- Biodeterioration effects are typically concentrated in zones located in crown and waterline walls. The washing effect produced by running water and temperature and relative humidity variations lead to larger thickness losses in the waterline walls than in the crown. Thickness losses in the waterline walls can vary from two to four times those in the crown [16,17,18,19].
3. Current Practice in the Structural Design of Sewers
Most reinforced concrete sewer facilities are built underground. Hydraulic demands, the structural stiffness of the conduits, the surrounding infill, soil heterogeneity, seismic events and overlaid traffic are important aspects to consider when designing a sewer pipe [32]. A typical structural design approach considers the following: (a) hydraulic design is an input; (b) short-duration overpressure or vacuum loading are not generated; (c) soil–structure interaction analysis is used to infer how the pipes and surrounding soil move together [1,75,76]; (d) lateral earth loads, soil reactions, friction loads and settlements and other displacements can be obtained from static analysis; (e) gravity loads from traffic, soil fill weight, the weight of the pipe, and wastewater weight are static actions applied in varying locations and forms [77]; (f) reinforced concrete lines show low vulnerability to seismic demands because they are built connecting short rigid spans of pipe by means of unrestrained joints; (g) for partially or totally buried pipes, the low probability of the coincidence of seismic loads and larger values of gravity or lateral earth loads allow us to obviate the seismic considerations in the structural design [78,79,80].
Some particularities used in the load analysis within the current practice for the structural design of reinforced concrete sewers can be summarized as follows:
- Pipes are placed underground following two configurations: trench and positive embankment. In the trench case, due to the backfill settlement, friction forces at the backfill–in situ material interface will reduce the gravity effects upon the pipe. In the embankment case, the soil placed on the sides of the pipe will settle more than the soil above the pipe, imposing larger gravity loads above the pipe. In both cases, gravity and lateral thrust effects are included in the structural analysis. This paper deals only with the trench condition [77,81].
- The traffic load magnitude is a function of the type of superficial cover (flexible or rigid pavements, or unsurfaced cover), the depth at which the pipe is set, the class of vehicle (trucks, aircrafts, or others) and the direction of travel (parallel or perpendicular to the pipe axis). In general, the deeper the pipe location the lower the traffic effects [77,82].
- Figure 1 shows the typical loads upon a buried sewer pipe. WS is the backfill pressure (kN/m2), WL is the effective traffic load (kN/m2), WP is the weight of the pipe (kN/m2), WF is the fluid (water weight) pressure (kN/m2), and ET and EB are the lateral thrust pressure at the top and bottom of the pipe, respectively (kN/m2). There is a load-spreading configuration along a pipe that is laid parallel to the traffic direction and the so called “effective supporting length of pipe (Le)”. The bedding angle defines the arc length where the pipe is effectively supported. The value and reaction pressure form depend on the bedding material properties [81].
The reinforced concrete pipes used as sewers typically have a low reinforcement steel ratio and thick concrete thickness which guarantee a greater shear capacity. For this reason, in this work only the bending moment capacity is considered. The bending moment capacity for singly reinforced normal-weight concrete elements can be computed using Equation (1) [87]:
where is the nominal bending capacity (KN-m), is the reinforcement steel ratio, is the steel yield strength (KN/m2), is the compressive strength of the concrete (KN/m2), b the cross-section width (m), and d is the internal lever arm (m).
4. Structural Design of Sewers Considering Biodeterioration
Unexpected changes in the deterioration patterns make the inclusion of deterioration effects in the sewer’s structural design a complex task. Factors such as age, pipe characteristics, the existence of underground water, chemical and physical soil properties, the proximity of other installations, the sewer slope, and the sewer water quality can bring a high degree of uncertainty to the processes of the analysis and design of sewers [34,84]. In order to counteract such uncertainty in the sewers’ structural design practice, methods such as the addition of sacrificial thickness and the definition of allowable crack widths in the inner walls were implemented [81,88]. Furthermore, although several models using different biodeterioration rates were used, their predictions failed when compared to real measurements. For example, some models have fitted rather well up to 20 years uptime but forecasted thickness losses of about one quarter to one third of the measured thickness changes 15 years later [34]. Indeed, thickness losses produced by biodeterioration increase the probability of failure of sewer pipes. To confront this hazard, a typical factor of safety of 1.3 is used for reinforced concrete pipes when no sacrificial layer is used [81]. Although this methodology is amicable to the designers, the uncertainty associated with the load–capacity relations demand a comprehensive methodology which considers the randomness of the process. To attend to this need, a probabilistic approach to the determination of the bending strength of a sewer is proposed and presented in this section. A summary of the approach for structural analysis is shown in Figure 2.
4.1. Structural Analysis
Typical models of sewer failure consider two critical zones in a cross section of the pipe: the crown and the waterline walls. When studying the biodeterioration effects on the structural integrity, a thickness reduction is considered in such places. In this work the direct stiffness method was used to analyze a typical sewer pipe in which the thickness at the crown and waterline walls is reduced during successive stages. Quadrangular thick plate elements are jointed to form a quasi-cylindrical duct, as shown in Figure 3. In order to compute the inner forces and nodal displacements, a MATLAB® code (R2014A, MathWorks, Natick, MA) was written and then validated using the software SAP2000® (V.17.1.1, Computers and Structures Inc, Berkeley, CA) [76,89,90,91,92,93]. During the validation process, the lower elements of the pipe section were supported on springs to simulate the soil reactions. The spring constants were computed by multiplying the modulus of the subgrade reaction by the afferent area around the joint [75,94,95,96]. The structural analysis developed using the MATLAB® code was appropriate to simulate the inner forces’ distribution.
4.2. Probabilistic Approach
To investigate how the biodeterioration influences the structural capacity of a sewer, in this study several sources of uncertainty were considered. Lognormal or uniform probability distributions were adopted for each variable. The load mean values were calculated as indicated in Section 2, and the geometrical mean values were taken from the nominal commercial values required by the ASTM standards [97]. The resistance mean values were computed using Equations (2) and (3):
where is the mean value of the bending moment capacity (kN-m), is the mean value of the steel ratio (cm2/cm2), t is the elapsed time from the biodeterioration initiation (years), is the mean value of the reduced internal lever arm at time t (m), is the mean value of the thickness loss rate at time t (mm/year), is the mean value of the steel strength (kN/m2), and is the mean value of the concrete strength (kN/m2).
To study how the probability of failure of the sewer pipe system behaves, a system limit state function was defined [98]:
where g(R,S) is the limit state function, R is the system resistance, and S is the load demand on the system. When the g(R,S) value is negative, system failure is expected. On the contrary, if the g(R,S) value is positive or zero, the system will show safe behavior. In this work, the R and S values are obtained from the vector of capacities linked to the mean values given by Equations (2) and (3) and from the vector of effects (internal bending moments) produced by the loads defined in Section 2, respectively. The probability of failure can be estimated as [98]
where is the probability of failure, is the standard normal probability distribution with an expected value equal to 0 and a standard deviation equal to 1, is the mean value of Z, and is the standard deviation of Z. Crude Monte Carlo simulations were used to propagate uncertainties in the deterministic model in order to estimate the probability of failure [98,99,100]. Random values were first generated. They were then propagated in the mechanical model to evaluate the limit state functions. The number of fails was finally counted to estimate the probability of failure.
5. Example: Reliability Assessment of Sewers Considering Biodeterioration
5.1. Description
A reinforced concrete pipe will be placed under a road with a high traffic of trucks into a 3.60 m × 6.57 m (width × depth) trench. The pipe’s inner diameter and thickness wall are 2.13 m and 0.22 m, respectively. Ordinary granular material will be used in the backfill, and a granular cradle 50 mm thick will be compacted under the pipe’s invert. The reinforcement configuration is shown in Figure 4 and was determined from the results of a classic analysis (considering a factor of safety of 1.30). The geometrical requirements stated in the ASTM standards were fulfilled [97,101,102,103]. A triple cage was specified, but an elliptical cage must not be considered when computing the bending strength. The bending moment strength can be computed following the classical reinforced concrete design theory using the characteristics of the variables described in Table 2. To study how biodeterioration influences the structural behavior, the probability of failure of the system will be determined, taking in consideration the influence of thickness losses and steel reinforcement corrosion upon the bending capacity throughout the time.
In this example, H2S concentrations of 25, 50, 100, 200 and 400 ppm were used to include a wide range of real environments in the MATLAB® code computations. The probability of failure was calculated using Monte Carlo simulation for the crown and the waterline walls separately. The probability distribution, the mean value and coefficient of variation of the variables used in this work were obtained from the literature and are shown in Table 2. The selection of lognormal and uniform distributions was produced based on a literature review [100,104,105,106,107,108,109,110,111]. The lognormal distributions were appropriate for parameters that cannot be physically negative, while uniform distributions were selected when the range of variation of the parameter was known.
To consider the effect of aging upon the concrete thickness loss associated to biodeterioration, a loss increment of 6.6%/year was computed from data reported in the literature [10,19]. Concrete strength losses were considered as an equivalent thickness loss, subtracting the low concrete strength thickness from the initial concrete thickness. On the other hand, the thickness loss of the steel reinforcing bars was taken as half of that calculated at any time for the concrete thickness loss at the crown. This steel/concrete loss ratio describes appropriately the remaining protection given by partially deteriorated surrounding concrete and fits well with the data reported in previous studies [24,42,71,72,73,74].

| Variable | Mean Value | COV | Distribution |
|---|---|---|---|
| (MPa) | 28 | 19% | Lognormal |
| (MPa) | 420 | 10% | Lognormal |
| Modulus of elasticity of steel, Es (MPa) | 200,000 | 6% | Lognormal |
| Concrete cover to reinforcement (mm) | 25 | 10% | Lognormal |
| Reinforcement steel ratio, r (cm2/cm2) | 0.0088 | 5% | Lognormal |
| Thickness loss at the crown, Dtc (mm/year) a: | |||
| H2S concentrations up to 50 ppm | 0.52 | 202% | Lognormal |
| H2S concentration of 100 ppm | 0.74 | 63% | Lognormal |
| H2S concentration of 200 ppm | 1.07 | 35% | Lognormal |
| H2S concentration of 400 ppm | 1.54 | 20% | Lognormal |
| Thickness loss ratio, Dtw/Dtc (mm/mm) | 3 | 19% | Uniform |
| 1.38 | 57% | Lognormal | |
| (kN/m3) | 20 | 10% | Lognormal |
| Backfill height, H (m) | 4 | 15% | Uniform |
| Traffic (live) load, P (kN) b | 223 | 30% | Lognormal |
| Coefficient, Ku (gravel) c | 0.165 | - | Deterministic |
| Trench load coefficient, C c | 0.85 | - | Deterministic |
| Wheel load area, a × b (m × m) | 0.51 × 0.25 | - | Deterministic |
| Spread area a × b (m × m) | 7.48 × 7.22 | - | Deterministic |
5.2. Description of the Failure Modes
Current commercial reinforced concrete pipes have nominal diameters varying from 225 to 3600 mm, and typical lengths of 2440 mm. In most cases, sections of pipe are usually connected using a flexible ring capable of allowing movements in the joint. This configuration facilitates stress relief due to accommodation during a seismic event. Nevertheless, settlements could occur under the same stretch, producing stress changes within the structure. Wastewater leaks, weak bedding compaction or affectations during construction could be cited as possible causes of settlement near the ends of the pipe. However, in this work an idealized external environment where no settlements occur was considered, and two main failure modes related with concrete biodeterioration were studied: failure at the crown and failure at the waterline walls.
Figure 5 describes the sequence of thickness and bending strength loss produced by biodeterioration in sewers throughout the time. In buried sewer pipes, thickness loss from biodeterioration makes the concrete thickness decrease throughout the time (Figure 5a). The resultant smaller thickness leads to a lower inner lever arm that reduces the available bending capacity (Mn). Furthermore, it produces a lower moment of inertia that makes the bending moment (Mb) from loads change. The bending moment imposes tension stresses on the inner face of the crown and the external face of the waterline walls. Biodeterioration attacks the inner face of the whole pipe, corroding the reinforcement steel in the crown and reducing the available compressed concrete in the waterline walls. In the crown, the tension capacity is rapidly lost due to the presence of corrosive gases which attack the reinforcement bars [62,113]. The sequence of this first failure mode (at the crown) is shown in Figure 5b. In the waterline walls, the bending capacity loss can occur more slowly because of the inner lever arm reduction. The sequence of this second failure mode (at the waterline walls) is shown in Figure 5c. In any event, there is a time when the capacity can be lower than the demand and the pipe will fail. Then, a rational structural design must be used to reduce the risk and extend the lifespan of the sewer.
5.3. Probability of Failure
Figure 6 shows the curves of the probability of failure obtained for the crown and the waterline walls when exposed to different H2S concentrations. It is evident that the crown will tend to fail before than waterline walls, leading to a ceiling failure that will change the initial structural configuration drastically. In the case of crown failure (Figure 6a), the high slope of each one of the curves shows that, once the concrete cover is lost, rapid steel corrosion leads to a rapid bending strength loss. Indeed, concrete cover can significantly delay the initiation of steel corrosion. If a low probability of failure value is chosen to compute the service life of the sewer, for example = 0.10, the pipe will last in service up to 55, 50, 46, 41 and 37 years when the H2S concentration is 25, 50, 100, 200 and 400 ppm, respectively. Furthermore, the expected value ( = 0.50) is typically 1 to 2 years longer than the values associated to the chosen probability of failure. According to these findings, the lifespan of a sewer could reach up to 55 years if the H2S concentration is low, and up to 37 years if the H2S concentration is high. In the case of the waterline wall’s failure (Figure 6b), for a low probability of failure ( = 0.10) the service life will be about 67, 61, 58, 54 and 48 years for H2S concentrations of 25, 50, 100, 200 and 400 ppm, respectively. This means that the waterline wall’s lifespan will be more than 10 years longer than that of crown.
6. Conclusions
In this work, biodeterioration measurements, mechanical models, and stochastic simulations were used to describe how biodeterioration effects can affect the probability of failure during the lifetime of sewers. The main conclusions are summarized as follows:
- A rapid bending strength loss produced by the steel corrosion at the crown or walls generates sloped curves which forecast a rapid failure once the crown concrete cover or most of the compressed concrete in the walls is lost. This conclusion coincides with real failures reported in the literature after 9 to 70 years of service [62,113].
- If the crown failure is accepted as the limit condition related to the sewer pipe failure, the expected service lifespan could be between 55 and 37 years for low and high H2S concentrations, respectively.
7. Recommendations for Future Work
In small-diameter sewers, it is possible that the broken crown can be rearranged to develop an arch system to bear the overlaying loads upon the ceiling. More research is required to explain how this new configuration could be related to the extended life observed in deteriorated pipes.
Typical experiments using humid samples subjected to gaseous environments describe the crown environment well. However, more research is needed to understand better the existing ratio between the thickness losses in the crown and those in the waterline walls of sewers.
In sewers containing low H2S concentrations, it is recommendable to include the effect of the inner temperature variation when modelling the biodeterioration dynamics.
Green pipes, antibacterial concrete pipes, and polyester resin concrete pipes (PRCP) are some modern options to build and partially replace sewers pipes which offer durability, wear resistance, appropriate strength, chemical resistance, and a soft inner texture. This is a wide and interesting research field to be considered in future works [114,115,116,117,118,119].
Author Contributions
Conceptualization, J.F.M.-P., M.S.-S. and E.B.-A.; methodology, J.F.M.-P., M.S.-S. and E.B.-A.; software, J.F.M.-P.; validation, J.F.M.-P., M.S.-S. and E.B.-A.; formal analysis, J.F.M.-P.; investigation, J.F.M.-P., M.S.-S. and E.B.-A.; resources, J.F.M.-P. and M.S.-S.; data curation, J.F.M.-P.; writing—original draft preparation, J.F.M.-P.; writing—review and editing, M.S.-S. and E.B.-A.; visualization, J.F.M.-P.; supervision, M.S.-S. and E.B.-A.; funding acquisition, J.F.M.-P. and M.S.-S. All authors have read and agreed to the published version of the manuscript.
Funding
This research was funded by Universidad Francisco de Paula Santander, Universidad de los Andes and COLCIENCIAS.
Institutional Review Board Statement
Not applicable.
Informed Consent Statement
Not applicable.
Data Availability Statement
The data that support the findings of this study are available upon reasonable request.
Conflicts of Interest
The authors declare no conflict of interest.
References
- ACPA. Loads and Supporting Strengths. In Concrete Pipe Design Manual; American Concrete Pipe Association: Irving, TX, USA, 2011; pp. 27–82. [Google Scholar]
- He, X.; de los Reyes, F.L.; Leming, M.L.; Dean, L.O.; Lappi, S.E.; Ducoste, J.J. Mechanisms of Fat, Oil and Grease (FOG) Deposit Formation in Sewer Lines. Water Res. 2013, 47, 4451–4459. [Google Scholar] [CrossRef] [PubMed]
- Wei, S.; Sanchez, M.; Trejo, D.; Gillis, C. Microbial Mediated Deterioration of Reinforced Concrete Structures. Int. Biodeterior. Biodegrad. 2010, 64, 748–754. [Google Scholar] [CrossRef]
- Jensen, H.S.; Nielsen, H.; Lens, P.N.L.; Hvitved-Jacobsen, T.; Vollertsen, J. Hydrogen Sulphide Removal from Corroding Concrete: Comparison between Surface Removal Rates and Biomass Activity. Environ. Technol. 2009, 30, 1291–1296. [Google Scholar] [CrossRef] [PubMed]
- Bastidas-Arteaga, E.; Sánchez-Silva, M.; Chateauneuf, A.; Silva, M.R.; Ribas Silva, M. Coupled Reliability Model of Biodeterioration, Chloride Ingress and Cracking for Reinforced Concrete Structures. Struct. Saf. 2008, 30, 110–129. [Google Scholar] [CrossRef] [Green Version]
- Marquez-Peñaranda, J.; Sanchez-Silva, M.; Husserl, J.; Bastidas-Arteaga, E. Effects of Biodeterioration on the Mechanical Properties of Concrete. Mater. Struct. 2015, 49, 4085–4099. [Google Scholar] [CrossRef]
- Minch, M.Y.; Wróblewski, R.; Kmita, A. Assessment of reinforced concrete sewer after long service: A case study. Urban Water J. 2018, 15, 501–505. [Google Scholar] [CrossRef]
- Zhang, R.; Ma, L.; Liu, P.; Chen, H.; Zhu, H.X.; Xiao, H.; Xiong, Z. Influence mechanisms under different immersion methods and different strengths of concrete in corrosive environments, and verification via long-term field test. Struct. Concr. 2020, 21, 1853–1864. [Google Scholar] [CrossRef]
- Tscheikner-Gratl, F.; Caradot, N.; Cherqui, F.; Leitão, J.P.; Ahmadi, M.; Langeveld, J.G.; Gat, L.; Scholten, L.; Rodríguez, J.P. Sewer asset management—State of the art and research needs. Urban Water J. 2020, 16, 662–675. [Google Scholar] [CrossRef] [Green Version]
- Wells, T.; Melchers, R.E. Microbial Corrosion of Sewer Pipe in Australia—Initial Field Results. In Proceedings of the 18th Intrenational Corrosion Congress, Perth, Australia, 20–24 November 2011; pp. 1–12. [Google Scholar]
- Wells, T.; Melchers, R.E. An Observation-Based Model for Corrosion of Concrete Sewers under Aggressive Conditions. Cem. Concr. Res. 2014, 61–62, 1–10. [Google Scholar] [CrossRef]
- Okabe, S.; Odagiri, M.; Ito, T.; Satoh, H. Succession of Sulfur-Oxidizing Bacteria in the Microbial Community on Corroding Concrete in Sewer Systems. Appl. Environ. Microbiol. 2007, 73, 971–980. [Google Scholar] [CrossRef] [Green Version]
- Grengg, C.; Mittermayr, F.; Baldermann, A.; Böttcher, M.E.; Leis, A.; Koraimann, G.; Grunert, P.; Dietzel, M. Microbiologically Induced Concrete Corrosion: A Case Study from a Combined Sewer Network. Cem. Concr. Res. 2015, 77, 16–25. [Google Scholar] [CrossRef] [Green Version]
- Herisson, J.; van Hullebusch, E.D.; Moletta-Denat, M.; Taquet, P.; Chaussadent, T. Toward an Accelerated Biodeterioration Test to Understand the Behavior of Portland and Calcium Aluminate Cementitious Materials in Sewer Networks. Int. Biodeterior. Biodegrad. 2013, 84, 236–243. [Google Scholar] [CrossRef] [Green Version]
- Oviedo, E.R.; Johnson, D.; Shipley, H. Evaluation of hydrogen sulphide concentration and control in a sewer system. Environ. Technol. 2012, 33, 1207–1215. [Google Scholar] [CrossRef] [PubMed]
- Hudon, E.; Mirza, S.; Frigon, D. Biodeterioration of Concrete Sewer Pipes: State of the Art and Research Needs. J. Pipeline Syst. 2011, 2, 42–52. [Google Scholar] [CrossRef]
- Song, Y.; Tian, Y.; Li, X.; Wei, J.; Zhang, H.; Bond, P.L.; Yuan, Z.; Jiang, G. Distinct Microbially Induced Concrete Corrosion at the Tidal Region of Reinforced Concrete Sewers. Water Res. 2019, 150, 392–402. [Google Scholar] [CrossRef]
- Jiang, G.; Keller, J.; Bond, P.L. Determining the Long-Term Effects of H2S Concentration, Relative Humidity and Air Temperature on Concrete Sewer Corrosion. Water Res. 2014, 65, 157–169. [Google Scholar] [CrossRef] [Green Version]
- Sun, X.; Jiang, G.; Chiu, T.H.; Zhou, M.; Keller, J.; Bond, P.L. Effects of Surface Washing on the Mitigation of Concrete Corrosion under Sewer Conditions. Cem. Concr. Compos. 2016, 68, 88–95. [Google Scholar] [CrossRef] [Green Version]
- Salmi, E.F.; Asadi, Z.S.; Bayati, M.; Sharifzadeh, M. Assessing the Hydrogeological Conditions Leading to the Corrosion and Deterioration of Pre-cast Segmental Concrete Linings (Case of Zagros Tunnel). Geotech. Geol. Eng. 2019, 37, 3961–3983. [Google Scholar] [CrossRef]
- Kuliczkowska, E.; Parka, A. The structural integrity of corroded concrete sewers. Eng. Fail. Anal. 2019, 104, 409–421. [Google Scholar] [CrossRef]
- Moradian, M.; Shekarchi, M.; Pargar, F.; Bonakdar, A.; Valipour, M. Deterioration of Concrete Caused by Complex Attack in Sewage Treatment Plant Environment. J. Perform. Constr. Facil. 2012, 26, 124–134. [Google Scholar] [CrossRef]
- Zacchei, E.; Bastidas-Arteaga, E. Multifactorial Chloride Ingress Model for Reinforced Concrete Structures Subjected to Unsaturated Conditions. Build. 2022, 12, 107. [Google Scholar] [CrossRef]
- Imounga, H.M.; Bastidas-Arteaga, E.; Moutou Pitti, R.; Ekomy Ango, S.; Wang, X.-H. Bayesian Assessment of the Effects of Cyclic Loads on the Chloride Ingress Process into Reinforced Concrete. App. Sci. 2020, 10, 2040. [Google Scholar] [CrossRef] [Green Version]
- Li, B.; Cai, L.; Zhu, W. Predicting Service Life of Concrete Structure Exposed to Sulfuric Acid Environment by Grey System Theory. Int. J. Civ. Eng. 2018, 16, 1017–1027. [Google Scholar] [CrossRef]
- Sanchez-Silva, M.; Klutke, G.-A.; Rosowsky, D.V. Life-Cycle Performance of Structures Subject to Multiple Deterioration Mechanisms. Struct. Saf. 2011, 33, 206–217. [Google Scholar] [CrossRef]
- Sun, X.; Jiang, G.; Bond, P.L.; Wells, T.; Keller, J. A Rapid, Non-Destructive Methodology to Monitor Activity of Sulfide-Induced Corrosion of Concrete Based on H 2 S Uptake Rate. Water Res. 2014, 59, 229–238. [Google Scholar] [CrossRef] [PubMed]
- Erdogmus, E.; Skourup, B.N.; Tadros, M. Recommendations for Design of Reinforced Concrete Pipe. J. Pipeline Syst. Eng. Pract. 2010, 1, 25–32. [Google Scholar] [CrossRef]
- Garcia, C.; Abraham, D.M.; Gokhale, S.; Iseley, T. Rehabilitation Alternatives for Concrete and Brick Sewers. Pract. Period. Struct. Des. Constr. 2002, 7, 164–173. [Google Scholar] [CrossRef]
- Ejaz, N.; Hussain, J.; Ghani, U.; Shabir, F.; Naeem, U.A.; Shahmim, M.A.; Tahir, M.F. Performance of Concrete under Aggressive Wastewater Environment Using Differente Binders. Life Sci. J. 2013, 10, 141–150. [Google Scholar]
- Erdogmus, E.; Maher, K.T. Behavior and Design of Buried Concrete Pipes; University of Nebraska: Lincoln, NE, USA, 2006. [Google Scholar]
- CMA. Design Manual for Concrete Pipe Outfall Sewers; CMA: Bartlett Boksburg, UK, 2009; Volume 47. [Google Scholar]
- Chughtai, F.; Zayed, T. Structural Condition Models for Sewer Pipeline. In Proceedings of the Pipelines 2007: Advances and Experiences with Trenchless Pipeline Projects, ASCE, Boston, MA, USA, 8–11 July 2007; pp. 1–11. [Google Scholar]
- Hong, S. Selective Inhibition of Acidophilic Thiobacilli for Application of Controlling Microbially-Induced Corrosion in Concrete Sewers; The University of Arizona: Tucson, AZ, USA, 1992. [Google Scholar]
- Matthews, J.C. Large-Diameter Sewer Rehabilitation Using a Fiber-Reinforced Cured-in-Place Pipe. Pract. Period. Struct. Des. Constr. 2014, 04014031, 1–5. [Google Scholar] [CrossRef]
- Gu, J.; Mitchell, R. Biodeterioration. In The Prokaryotes—Applied Bacteriology and Biotecnhnology; Rosenberg, E., DeLong, E.F., Lory, S., Stackebrandt, E., Thompson, F., Eds.; Springer: Berlin/Heidelberg, Germany, 2013; pp. 309–341. ISBN 9783642313301. [Google Scholar]
- Shifrin, N.S. Pollution Management in the Twentieth Century. J. Environ. Eng.-ASCE 2005, 131, 676–691. [Google Scholar] [CrossRef]
- Hewayde, E.; Nehdi, M.; Allouche, E.; Nakhla, G. Effect of Mixture Design Parameters and Wetting-Drying Cycles on Resistance of Concrete to Sulfuric Acid Attack. J. Mater. Civ. Eng. 2007, 19, 155–163. [Google Scholar] [CrossRef]
- Parande, A.K. Deterioration of Reinforced Concrete in Sewer Environments. Proc. Inst. Civ. Eng. Munic. Eng. 2006, 159, 11–20. [Google Scholar] [CrossRef]
- Wei, S.; Jiang, Z.; Liu, H.; Zhou, D.; Sanchez-Silva, M. Microbiologically Induced Deterioration of Concrete—A Review. Braz. J. Microbiol. 2013, 1007, 1001–1007. [Google Scholar] [CrossRef] [PubMed]
- Augustyniak, A.; Sikora, P.; Grygorcewicz, B.; Despot, D.; Braun, B.; Rakoczy, R.; Szewzyk, U.; Barjenbruch, M.; Stephan, D. Biofilms in the gravity sewer interfaces: Making a friend from a foe. Environ. Sci. Biotechnol. 2021, 20, 795–813. [Google Scholar] [CrossRef]
- Bastidas-Arteaga, E.; Sánchez-Silva, M.; Chateauneuf, A. Structural Reliability of RC Structures Subject to Biodeterioration, Corrosion and Concrete Cracking. In Proceedings of the 10th International Conference on Applications of Statistics and Probability in Civil Engineering, Tokyo, Japan, 31 July–3 August 2007; Kanda, J., Takada, T., Furuta, H., Eds.; Taylor & Francis: London, UK, 2007; pp. 183–190. [Google Scholar]
- Lau, I.; Li, C.-Q.; Chen, F. Analytical and Experimental Investigation on Corrosion-Induced Concrete Cracking. Int. J. Civ. Eng. 2020, 18, 99–112. [Google Scholar] [CrossRef]
- Bielefeldt, A.; Gutierrez-Padilla, M.G.D.; Ovtchinnikov, S.; Silverstein, J.; Hernandez, M. Bacterial Kinetics of Sulfur Oxidizing Bacteria and Their Biodeterioration Rates of Concrete Sewer Pipe Samples. J. Environ. Eng. 2010, 136, 731–738. [Google Scholar] [CrossRef]
- Gu, J.; Ford, T.E.; Berke, N.S.; Mitchell, R. Biodeterioration of Concrete by the Fungus Fusariuml. Int. Biodeterior. Biodegrad. 1998, 41, 101–109. [Google Scholar] [CrossRef]
- George, R.P.P.; Ramya, S.; Ramachandran, D.; Kamachi Mudali, U. Studies on Biodegradation of Normal Concrete Surfaces by Fungus Fusarium Sp. Cem. Concr. Res. 2013, 47, 8–13. [Google Scholar] [CrossRef]
- Sawyer, C.N.; McCarty, P.L.; Parkin, G.F. Chemistry for Environmental Enginnering and Science; McGraw Hill: New York, NY, USA, 2003. [Google Scholar]
- Dopson, M.; Johnson, D.B. Biodiversity, Metabolism and Applications of Acidophilic Sulfur-Metabolizing Microorganisms. Environ. Microbiol. 2012, 14, 2620–2631. [Google Scholar] [CrossRef]
- Madigan, M.; Martinko, J.M.; Parker, J. Brock Biology of Microorganisms; Prentice-Hall: Upper Saddle River, NJ, USA, 2000. [Google Scholar]
- Mehta, P.; Monteiro, P.J.M. Concrete: Microstructure, Properties, and Materials; McGraw-Hill: New York, NY, USA, 2006. [Google Scholar]
- O’Connell, M.; McNally, C.; Richardson, M.G. Biochemical Attack on Concrete in Wastewater Applications: A State of the Art Review. Cem. Concr. Compos. 2010, 32, 479–485. [Google Scholar] [CrossRef]
- Nnadi, E.O.; Lizarazo-Marriaga, J. Acid Corrosion of Plain and Reinforced Concrete Sewage Systems. J. Mater. Civ. Eng. 2013, 25, 1353–1356. [Google Scholar] [CrossRef]
- Sand, W. Importance of Hydrogen Sulfide, Thiosulfate, and Methylmercaptan for Growth of Thiobacilli during Simulation of Concrete Corrosion. Appl. Environ. Microbiol. 1987, 53, 1645–1648. [Google Scholar] [CrossRef] [PubMed] [Green Version]
- Islander, R.L.; Devinny, J.S.; Mansfeld, F.; Adam, P.; Hong, S. Microbial Ecology of Crown Corrosion in Sewers. J. Environ. Eng. 1991, 117, 751–770. [Google Scholar] [CrossRef]
- Hernandez, M.; Marchand, E.A.; Roberts, D.; Peccia, J. In Situ Assessment of Active Thiobacillus Species in Corroding Concrete Sewers Using Fluorescent RNA Probes. Int. Biodeterior. Biodegrad. 2002, 49, 271–276. [Google Scholar] [CrossRef]
- Giannantonio, D.J.; Kurth, J.C.; Kurtis, K.E.; Sobecky, P.A. Molecular Characterizations of Microbial Communities Fouling Painted and Unpainted Concrete Structures. Int. Biodeterior. Biodegrad. 2009, 63, 30–40. [Google Scholar] [CrossRef]
- Coleman, R.N.; Gaudet, I.D. Thiobacillus Neopolitanus Implicated in the Degradation of Concrete Tanks Used for Potable Water Storage. Water Res. 1993, 27, 413–418. [Google Scholar] [CrossRef]
- Kumar, R.; Gardoni, P.; Sanchez-Silva, M. Effect of Cumulative Seismic Damage and Corrosion on the Life-Cycle Cost of Reinforced Concrete Bridges. Earthq. Eng. Struct. Dyn. 2009, 38, 887–905. [Google Scholar] [CrossRef] [Green Version]
- Yang, W.; Baji, H.; Li, C.-Q. A Theoretical Framework for Risk–Cost-Optimized Maintenance Strategy for Structures. Int. J. Civ. Eng. 2020, 18, 261–278. [Google Scholar] [CrossRef]
- Beddoe, R.E.; Dorner, H.W. Modelling Acid Attack on Concrete: Part I. The Essential Mechanisms. Cem. Concr. Res. 2005, 35, 2333–2339. [Google Scholar] [CrossRef]
- Ba, M.; Qian, C.; Guo, X.; Han, X. Effects of Steam Curing on Strength and Porous Structure of Concrete with Low Water/Binder Ratio. Constr. Build. Mater. 2011, 25, 123–128. [Google Scholar] [CrossRef]
- Chen, X.; Wu, S.; Zhou, J. Influence of Porosity on Compressive and Tensile Strength of Cement Mortar. Constr. Build. Mater. 2013, 40, 869–874. [Google Scholar] [CrossRef]
- Chindaprasirt, P.; Rukzon, S. Strength, Porosity and Corrosion Resistance of Ternary Blend Portland Cement, Rice Husk Ash and Fly Ash Mortar. Constr. Build. Mater. 2008, 22, 1601–1606. [Google Scholar] [CrossRef]
- Kumar, R.; Bhattacharjee, B. Porosity, Pore Size Distribution and in Situ Strength of Concrete. Cem. Concr. Res. 2003, 33, 155–164. [Google Scholar] [CrossRef]
- Mahmoodian, M.; Alani, A.M. Multi-Failure Mode Assessment of Buried Concrete Pipes Subjected to Time-Dependent Deterioration, Using System Reliability Analysis. J Fail. Anal. Prevent. 2013, 13, 634–642. [Google Scholar] [CrossRef]
- Li, X.; Moore, L.O.; Song, Y.; Bond, P.L.; Yuan, Z.; Wilkie, S.; Hanzic, L.; Jiang, G. The Rapid Chemically Induced Corrosion of Concrete Sewers at High H 2 S Concentration. Water Res. 2019, 162, 95–104. [Google Scholar] [CrossRef]
- De Belie, N. Microorganisms versus Stony Materials: A Love–Hate Relationship. Mater. Struct. 2010, 43, 1191–1202. [Google Scholar] [CrossRef]
- Bohm, M.; Devinny, J.S. A Moving Boundary Diffusion Model for the Corrosion of Concrete Wastewater Systems: Simulation and Experimental Validation. In Proceedings of the 1999 American Control Conference, Cat. No. 99CH36251, San Diego, CA, USA, 2–4 June 1999; pp. 1739–1743. [Google Scholar]
- Gutiérrez-Padilla, M.G.D.; Bielefeldt, A.; Ovtchinnikov, S.; Hernandez, M.; Silverstein, J. Biogenic Sulfuric Acid Attack on Different Types of Commercially Produced Concrete Sewer Pipes. Cem. Concr. Res. 2010, 40, 293–301. [Google Scholar] [CrossRef]
- Ehrich, B.S.; Helard, L.; Letourneux, R.; Willocq, J.; Bock, E. Biogenic and Chemical Sulfuric Acid Corrosion of Mortars. J. Mater. Civ. Eng. 1999, 11, 340–344. [Google Scholar] [CrossRef]
- Li, X.; Khademi, F.; Liu, Y.; Akbari, M.; Wang, C.; Bond, P.L.; Keller, J.; Jiang, G. Evaluation of Data-Driven Models for Predicting the Service Life of Concrete Sewer Pipes Subjected to Corrosion. J. Environ. Manag. 2019, 234, 431–439. [Google Scholar] [CrossRef]
- Choi, Y.; Nesic, S.; Ling, S. Effect of H2S on the CO2 Corrosion of Carbon Steel in Acidic Solutions. Electrochim. Acta 2011, 56, 1752–1760. [Google Scholar] [CrossRef]
- Adebayo, A.; Oluwadare, B. Corrosion of Steels in Water and Hydrogen Sulfide. Rev. Ind. Eng. Lett. 2014, 1, 80–88. [Google Scholar] [CrossRef] [Green Version]
- Gharib, F.E.; Abdulhaq, A.; Abd, A. Experimental Study Of Reinforcing Steel Bars Behaviour Under Corrosive Conditions. Aust. J. Basic Appl. Sci. 2012, 6, 371–377. [Google Scholar]
- New York State Department of Transportation. Geotechnical Aspects of Pipe Design and Installation. In Geotechnical Design Manual; New York State Department of Transportation: Albany, NY, USA, 2013; pp. 1–54. [Google Scholar]
- Goodson, M.W.; Anderson, J.E. Soil-Structure Interaction–A Case Study. In Proceedings of the Structures Congress 2005, ASCE, New York, NY, USA, 20–24 April 2005; pp. 1–11. [Google Scholar]
- ACPA. Concrete Pipe Design Manual; ACPA: St. Louis, MI, USA, 2011; pp. 1–540. [Google Scholar]
- Callaghan, F.W. Pipe Performance and Experiences during Seismic Events in New Zealand over the Last 25 Years. In Proceedings of the Pipelines 2012: Innovations in Design, Construction, Operations, and Maintenance, ASCE, Miami Beach, FL, USA, 19–22 August 2012; pp. 1136–1146. [Google Scholar]
- Rubeiz, C.G. Performance of Pipes during Earthquakes. In Proceedings of the Pipelines 2009: Infrastructure’s Hidden Assets, ASCE, Miami, FL, USA, 19–22 August 2009; pp. 1205–1215. [Google Scholar]
- Doyle, J.M.; Fang, S.J. Design of Buried Pipes. In Handbook of Structural Engineering; Chen, W.F., Ed.; CRC Press: Boca Raton, FL, USA, 1997; Chapter 25; ISBN 0849315697. [Google Scholar]
- CMA. Concrete Pipe and Portal Culvert Handbook; CMA: Bartlett Boksburg, UK, 2012; p. 50. [Google Scholar]
- AASHTO. AASHTO LRFD Bridge Desig Specifications; AASHTO: Washington, DC, USA, 2012. [Google Scholar]
- Chughtai, F.; Zayed, T. Infrastructure Condition Prediction Models for Sustainable Sewer Pipelines. J. Perform. Constr. Facil. 2008, 22, 333–341. [Google Scholar] [CrossRef]
- Chisala, B.N.; Lerner, D.N. Distribution of Sewer Exfiltration to Urban Groundwater. Proc. ICE—Water Manag. 2008, 161, 333–341. [Google Scholar] [CrossRef]
- Park, S.; Lim, H.; Tamang, B.; Jin, J.; Lee, S.; Park, S.; Kim, Y.; Kim, Y. A Preliminary Study on Leakage Detection of Deteriorated Underground Sewer Pipes Using Aerial Thermal Imaging. Int. J. Civ. Eng. 2020, 18, 1167–1178. [Google Scholar] [CrossRef]
- Scheperboer, I.C.; Luimes, R.A.; Suiker, A.S.J.; Bosco, E.; Clemens, F.H.L.R. Experimental-numerical study on the structural failure of concrete sewer pipes. Tunn. Undergr. Sp. Technol. 2021, 116, 104075. [Google Scholar] [CrossRef]
- McCormac, J.C.; Nelson, J.K. Design of Reinforced Concrete; John Wiley & Sons: Hoboken, NJ, USA, 2009. [Google Scholar]
- Products, I.; Division, E.S. Concrete Pipe and Portal Culvert Handbook; CMA: Bartlett Boksburg, UK, 2009. [Google Scholar]
- CSI. CSi Analysis Reference Manual; Computers & Structures Inc: Walnut Creek, CA, USA, 2013. [Google Scholar]
- González, H.D.; Reyes, G.Á. Análisis Comparativo de La Teoría de Martson para Tuberías Enterradas y La Modelación Numérica Con Elementos Finitos; Universidad Nacional de Colombia: Bogota, Columbia, 1999; pp. 1–13. [Google Scholar]
- Agrawal, A.K.; Ramalingam, K.; Rozelman, S.; Kulcsar, F.; Farooqui, N. Asset Management and Nondestructive Evaluation of Force Mains in New York City. In Proceedings of the Pipelines Congress 2008, ASCE, Atlanta, GA, USA, 22–27 July 2008; pp. 1–11. [Google Scholar]
- Ates, S. Numerical Modelling of Continuous Concrete Box Girder Bridges Considering Construction Stages. Appl. Math. Model. 2011, 35, 3809–3820. [Google Scholar] [CrossRef]
- Bento, R.; Falcão-Silva, M.J. Analytical Model for the Seismic Behavior of Buried Pipeline when Subjected to Ground Liquefaction. In Proceedings of the 13th World Conference on Earthquake Engineering, Vancouver, BC, Canada, 1–6 August 2004. [Google Scholar]
- Becker, G.; Boduroglu, H.; Camarinopoulos, S.; Frondistou-Yannas, S.; Gedikli, A.; Kallidromitis, V.G.; Kampranis, D.; Sanna, C. Structural Assessment and Upgrading of Sewers Based on Inspection Results. J. Infrastruct. Syst. 2009, 15, 321–329. [Google Scholar] [CrossRef]
- Petry, T.M.; Little, D.N. Review of Stabilization of Clays and Expansive Soils in Pavements and Lightly Loaded Structures—History, Practice, and Future. Mater. Civ. Eng. 2002, 16, 447–460. [Google Scholar] [CrossRef]
- Sert, S.; Kılıc, A.N. Numerical Investigation of Different Superstructure Loading Type Effects in Mat Foundations. Int. J. Civ. Eng. 2016, 14, 171–180. [Google Scholar] [CrossRef]
- ASTM C76M-14; Standard Specification for Reinforced Concrete Culvert, Storm Drain, and Sewer Pipe (Metric). ASTM: West Conshohocken, PE, USA, 2014; pp. 1–11.
- Sanchez-Silva, M. Introducción a La Confiabilidad y Evaluación de Riesgos. Teoría y Aplicaciones en Ingeniería; Universidad de los Andes, Ed.; Ediciones Uniandes: Bogota, Columbia, 2010; ISBN 9789586955119. [Google Scholar]
- Gilman, M.J. A brief survey of stopping rules in Monte Carlo simulations. J. Optim. Theory Appl. 1989, 4–9. [Google Scholar] [CrossRef]
- Che, J.; Wang, J.; Li, K. A Monte Carlo Based Robustness Optimization Method in New Product Design Process: A Case Study. Am. J. Ind. Bus. Manag. 2014, 4, 360–369. [Google Scholar] [CrossRef] [Green Version]
- ASTM C1417 M; Standard Specification for Manufacture of Reinforced Concrete Sewer, Storm Drain, and Culvert Pipe for Direct Design [Metric]. ASTM: West Conshohocken, PE, USA, 2014; pp. 1–7.
- ASTM C1433 M; Standard Specification for Precast Reinforced Concrete Monolithic Box Sections for Culverts, Storm Drains and Sewers. ASTM: West Conshohocken, PE, USA, 2014; pp. 1–22.
- ASTM C655M-14; Standard Specification for Reinforced Concrete D-Load Culvert, Storm Drain, and Sewer Pipe (Metric). ASTM: West Conshohocken, PE, USA, 2014; pp. 1–6.
- del Giudice, G.; Padulano, R.; Siciliano, D. Multivariate probability distribution for sewer system vulnerability assessment under data-limited conditions. Water Sci. Technol. 2016, 73, 751–760. [Google Scholar] [CrossRef] [PubMed]
- Dirksen, J.; Clemens, L.R. Probabilistic modeling of sewer deterioration using inspection data inspection data. Water Sci. Technol. 2008, 57, 1635–1641. [Google Scholar] [CrossRef] [PubMed]
- Laakso, T.; Kokkonen, T.; Mellin, I.; Vahala, R. Sewer Life Span Prediction: Comparison of Methods and Assessment of the Sample Impact on the Results. Water 2019, 11, 2657. [Google Scholar] [CrossRef] [Green Version]
- Caradot, N. The Use of Deterioration Modelling to Simulate Sewer Asset Management Strategies; INSA Université de Lyon: Lyon, France, 2019. [Google Scholar]
- Hernández, N.R. Methodology for Identifying the Key and Enough Factors for Achieving Objectives in Sewer Asset Management; Pontificia Universidad Javeriana: Bogota, Columbia, 2020. [Google Scholar]
- Fugledalen, T.; Rokstad, M.M.; Tscheikner-Gratl, F. On the influence of input data uncertainty on sewer deterioration models—A case study. Struct. Infrastruct. Eng. 2021, 1–12. [Google Scholar] [CrossRef]
- Jin, Y.; Mukherjee, A.; Asce, A.M. Modeling Blockage Failures in Sewer Systems to Support Maintenance Decision Making. J. Perform. Constr. Facil. 2010, 24, 622–633. [Google Scholar] [CrossRef]
- Korving, H.; van Noortwijk, J.M.; van Gelder, P.H.A.J.M.; Clemens, H.L.R.; Korving, H.; van Noortwijk, J.M.; van Gelder, P.H.A.J.M. Risk-based design of sewer system rehabilitation. Struct. Infrastruct. Eng. 2009, 5, 215–227. [Google Scholar] [CrossRef]
- ACPA. Highway Live Loads on Concrete Pipe; ACPA: St. Louis, MI, USA, 2009; Volume 1, pp. 1–10. [Google Scholar]
- Zamanian, S.; Hur, J.; Shafieezadeh, A. Significant variables for leakage and collapse of buried concrete sewer pipes: A global sensitivity analysis via Bayesian additive regression trees and Sobol’ indices. Struct. Infrastruct. Eng. 2021, 17, 676–688. [Google Scholar] [CrossRef]
- Qiu, L.; Dong, S.; Ashour, A.; Han, B. Antimicrobial concrete for smart and durable infrastructures: A review. Constr. Build. Mater. 2020, 260, 1–15. [Google Scholar] [CrossRef]
- Jamshidi, M.; Alizadeh, M.; Salar, M.; Hashemi, A. Durability of Polyester Resin Concrete in Different Chemical Solutions. Adv. Mater. Res. 2013, 687, 150–154. [Google Scholar] [CrossRef]
- Meyer-Policrete. POLYCRETE Catalog; Meyer: Stendal: Germany, 2020; pp. 1–16. [Google Scholar]
- Resin, N.P.G.P.; Relining, P. CRYSTIC PD10098T. Ortho—NPG Polyester Resin for Pipe Relining; Scott Bader SAS: Amiens, France, 2018; pp. 1–2. [Google Scholar]
- TPP Manufacturing. Polyester resin concrete jacking pipe. In Product Type Specification; TPP Manufacturing: Singapore, 2016; pp. 1–2. [Google Scholar]
- DIN 16946-2; Cured Casting Resins: Types. German Institute for Standardisation (DIN): Berlin, Germany, 1989; 8p.
Figure 1.
Typical loads demanding a buried sewer pipe (based on information available in [81]).
Figure 1.
Typical loads demanding a buried sewer pipe (based on information available in [81]).

Figure 2.
Flowchart of the proposed model for the structural analysis of a reinforced concrete sewer.
Figure 2.
Flowchart of the proposed model for the structural analysis of a reinforced concrete sewer.
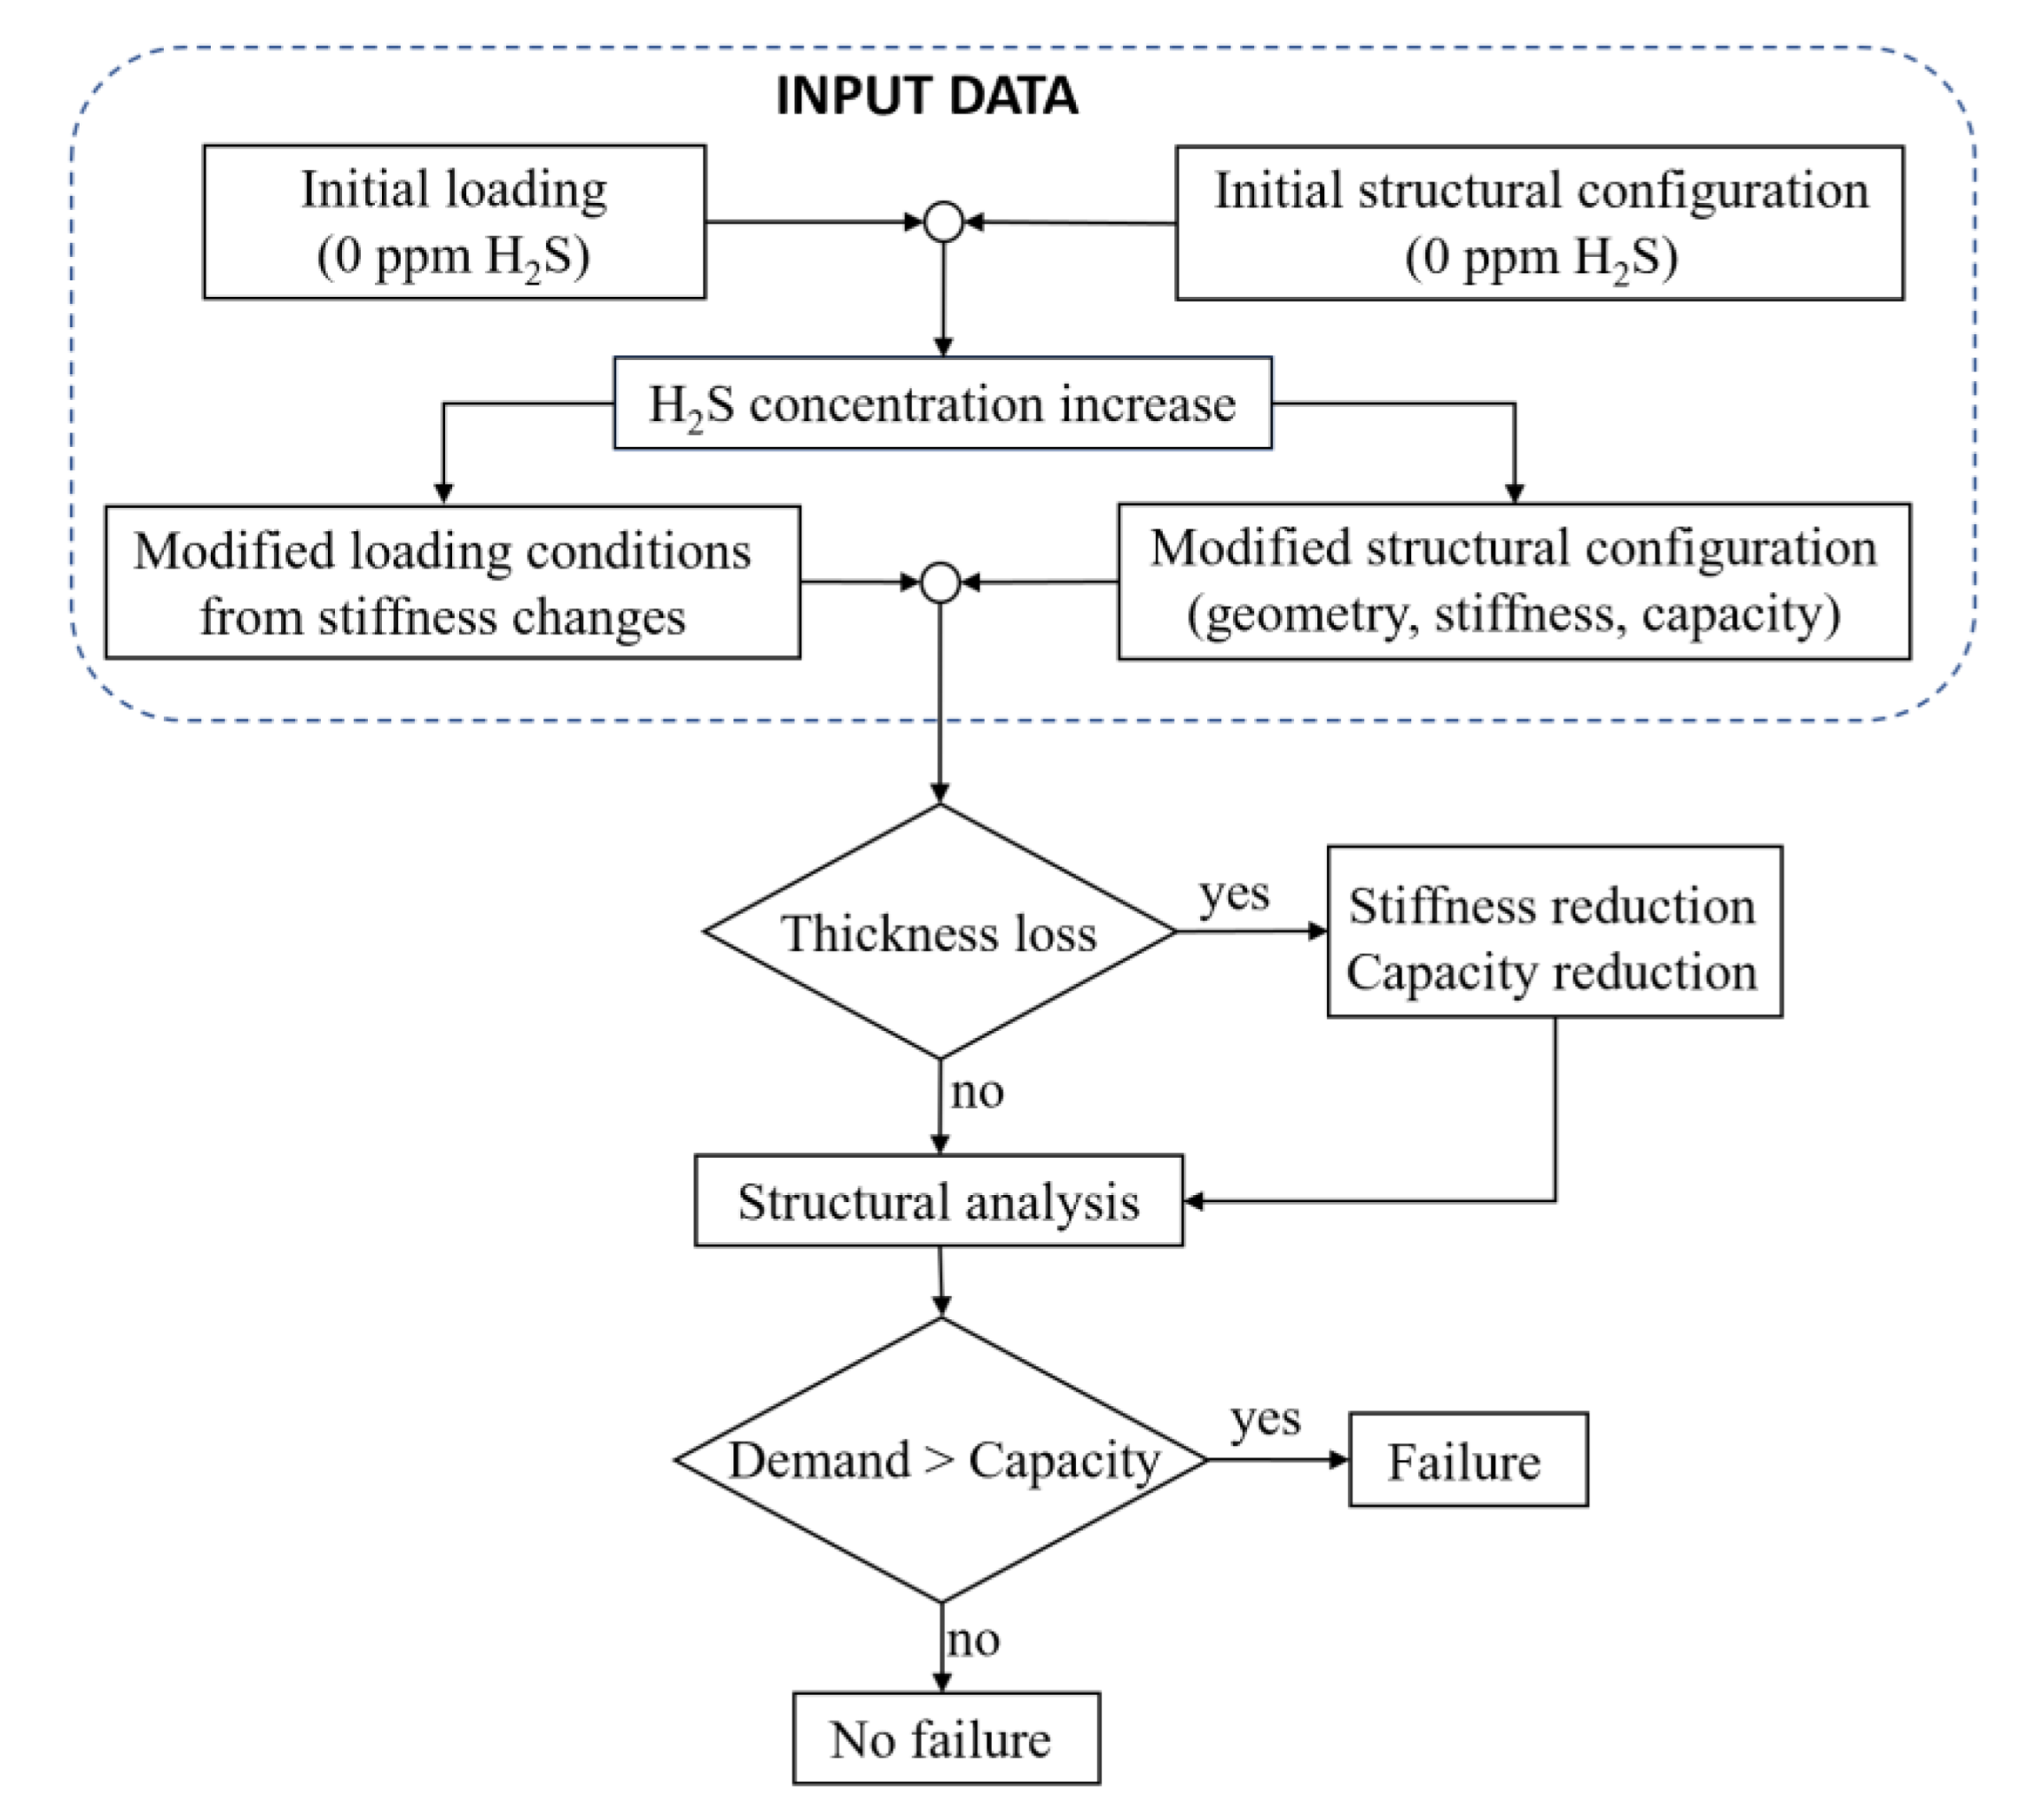
Figure 3.
Model used for structural analysis in the MATLAB® code.
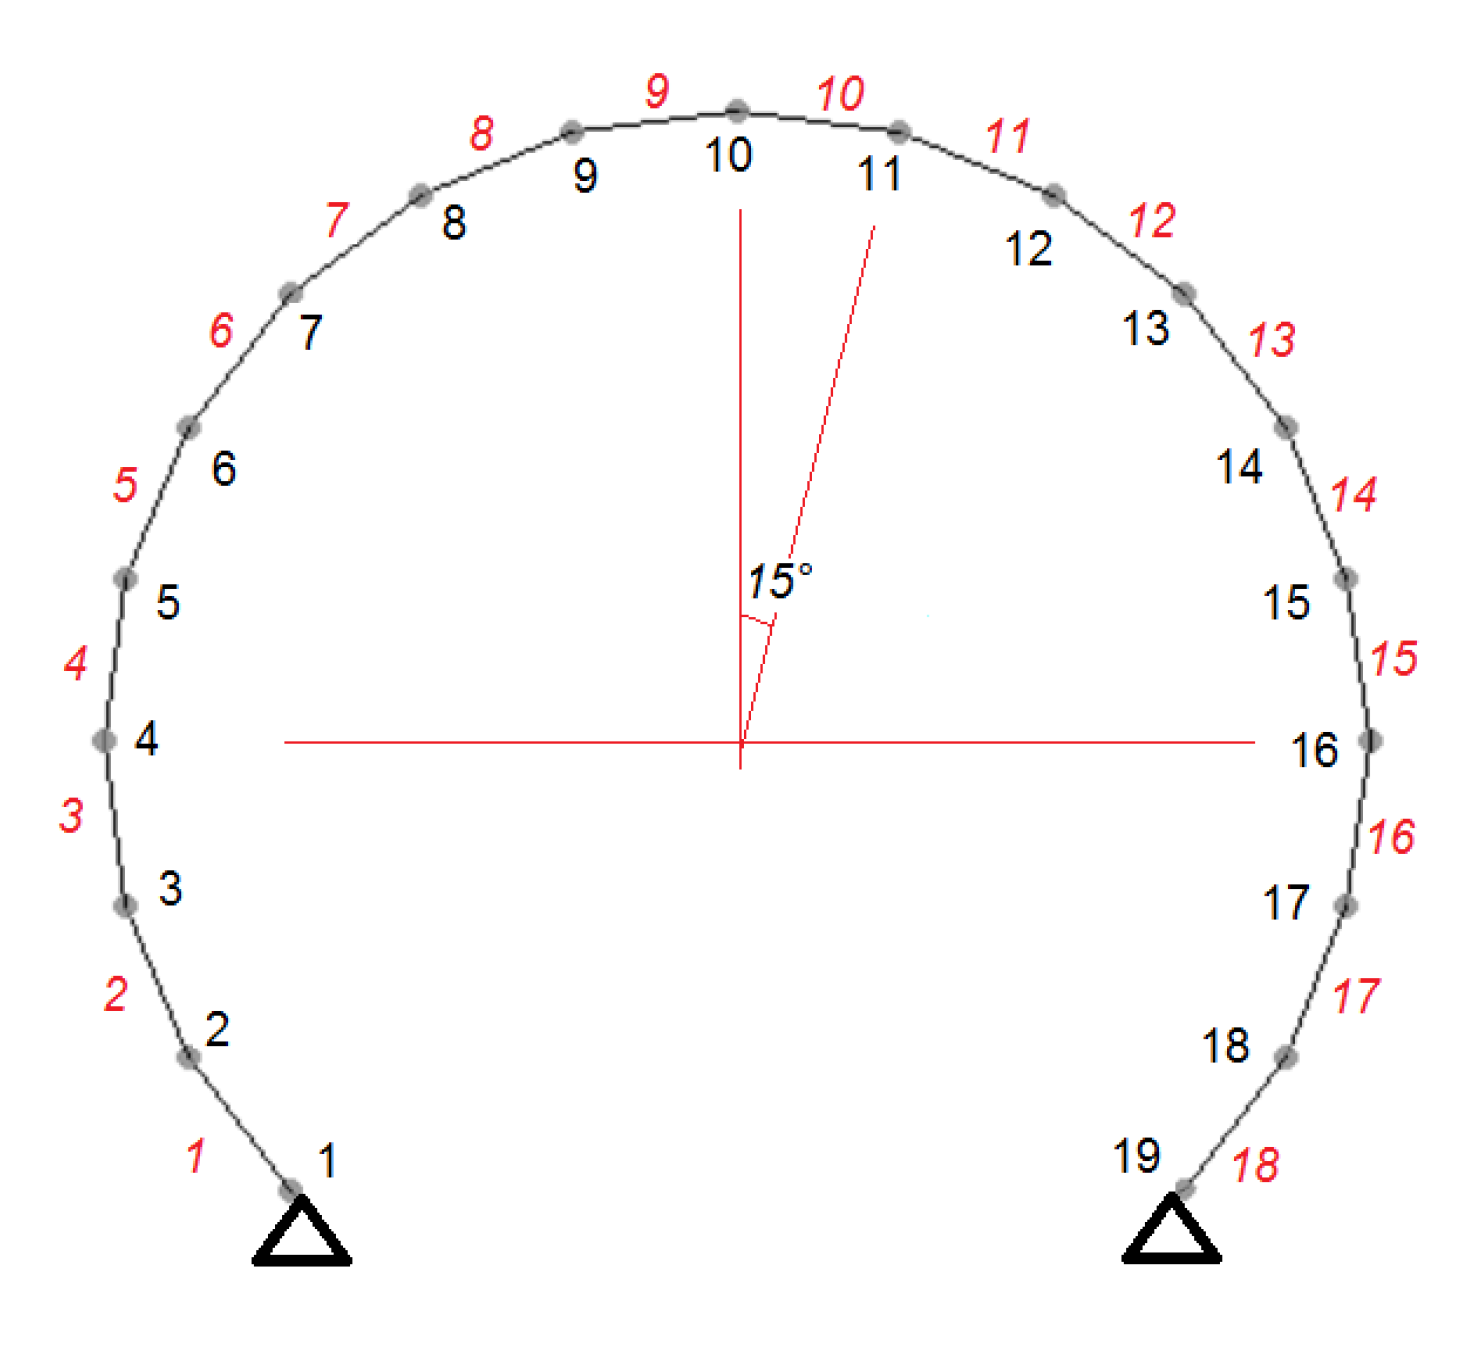
Figure 4.
Steel reinforcement in a typical section. No detailing steel reinforcement is shown.
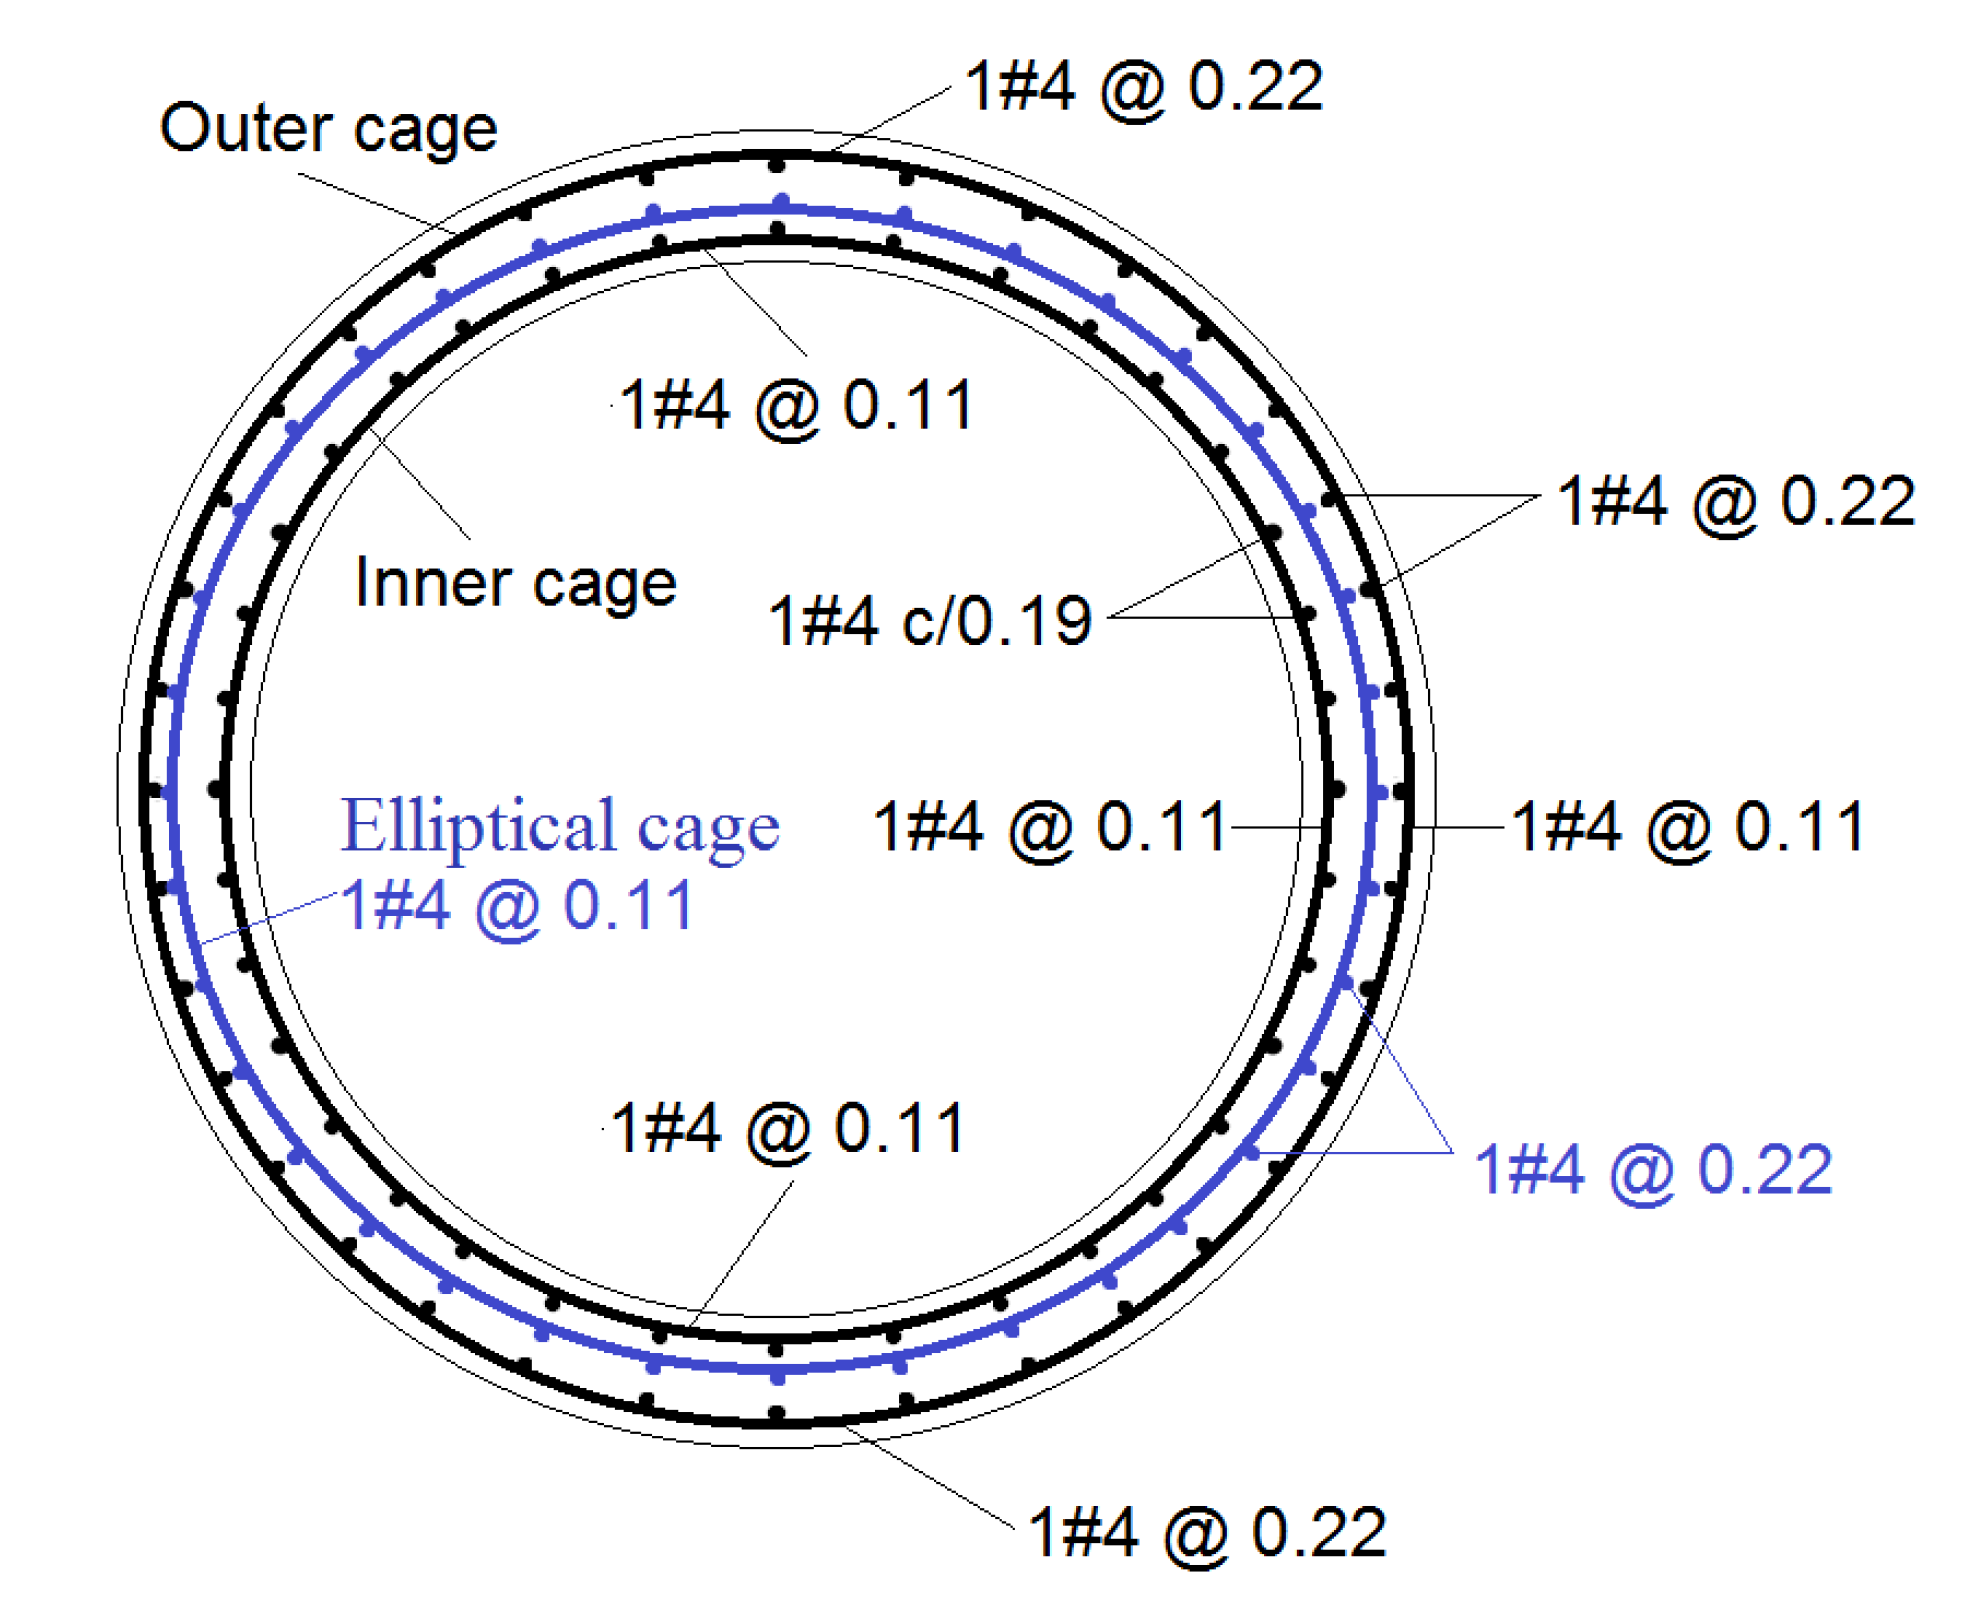
Figure 5.
Sequence of changes in the thickness and strength produced by biodeterioration in sewers: (a) thickness change, (b) first failure mode produced by variations of strength and demand at the crown, (c) second failure mode produced by variations of strength and demand at the waterline walls.
Figure 5.
Sequence of changes in the thickness and strength produced by biodeterioration in sewers: (a) thickness change, (b) first failure mode produced by variations of strength and demand at the crown, (c) second failure mode produced by variations of strength and demand at the waterline walls.

Figure 6.
Probability of failure: (a) at the crown, and (b) at the waterline walls.

Table 1.
Concrete losses produced by biodeterioration according to the literature.
| Exposure Time (Days) | Weight Loss | Thickness Loss (mm/Year) | Environment | Experimental Conditions | Ref. |
|---|---|---|---|---|---|
| 20 | N.A. | 3.50 | 1100 ppm H2S, 21.5 °C | Pilot-scale sewer pipe | [66] |
| 40 | N.A. | 10 | 89 ppm H2S, 17 °C | In situ (real env.) | [13] |
| 68 | N.A. | 5.37 | 250 ppm H2S | Experimental apparatus | [67] |
| 81 | N.A. | 2.59 | N.A. | Experimental apparatus | [68] |
| 120 | 1.6% | 0.16a | 100–200 ppm H2S, 25–30 °C | In situ (real env.) | [14] |
| 180 | N.A. | 20 | 700–1000 ppm H2S, 20–35 °C | Pilot scale system | [17] |
| 227 | N.A. | 0.21 | 300–600 ppm H2S, 23 °C | Reactor in laboratory | [69] |
| 270 | 5.8% | 0.20 a | 12–18 ppm H2S | Simulation chamber | [53] |
| 300 | 6.8% | 0.30 a | 8–15 ppm H2S, 30 °C | Experimental apparatus | [6] |
| 350 | 100% | 20 | 5–15 ppm H2S, 30 °C | Simulation chamber | [70] |
| 360 | 37.0% | 10 | 10–50 ppm H2S | In situ (real env.) | [12] |
| 930 | N.A. | 12 | 79 ppm H2S | In situ (real env.) | [11] |
| 960 | N.A. | 8.9 | 50 ppm H2S, 30 °C | Corrosion Chamber | [27] |
| 1350 | N.A. | 1.0 | 5–50 ppm H2S, | Corrosion Chamber | [18] |
| 1460 | N.A. | 1.0 | 5 ppm H2S, 21 °C | In situ (real env.) | [10] |
| 1460 | N.A. | 0.5 | 68 ppm H2S, 27 °C | In situ (real env.) | [10] |
| 1460 | N.A. | 0.1 | 650 ppm H2S, 27 °C | In situ (real env.) | [10] |
| 1620 | N.A. | 0.19 | 5–50 ppm H2S, 25 °C | Corrosion Chamber | [19] |
a Thickness loss computed from data considering a uniform thickness loss around the sample.
Publisher’s Note: MDPI stays neutral with regard to jurisdictional claims in published maps and institutional affiliations. |
© 2022 by the authors. Licensee MDPI, Basel, Switzerland. This article is an open access article distributed under the terms and conditions of the Creative Commons Attribution (CC BY) license (https://creativecommons.org/licenses/by/4.0/).
Share and Cite
MDPI and ACS Style
Marquez-Peñaranda, J.F.; Sanchez-Silva, M.; Bastidas-Arteaga, E. Probabilistic Assessment of Biodeterioration Effects on Reinforced Concrete Sewers. Corros. Mater. Degrad. 2022, 3, 333-348. https://doi.org/10.3390/cmd3030020
AMA Style
Marquez-Peñaranda JF, Sanchez-Silva M, Bastidas-Arteaga E. Probabilistic Assessment of Biodeterioration Effects on Reinforced Concrete Sewers. Corrosion and Materials Degradation. 2022; 3(3):333-348. https://doi.org/10.3390/cmd3030020
Chicago/Turabian StyleMarquez-Peñaranda, Jorge Fernando, Mauricio Sanchez-Silva, and Emilio Bastidas-Arteaga. 2022. "Probabilistic Assessment of Biodeterioration Effects on Reinforced Concrete Sewers" Corrosion and Materials Degradation 3, no. 3: 333-348. https://doi.org/10.3390/cmd3030020