Article

Mineralogical Characterization and Firing Temperature Delineation on Minoan Pottery, Focusing on the Application of Micro-Raman Spectroscopy

by
Ioannis E. Grammatikakis
1,2,*,†,
Evangelos Kyriakidis
2,3,†,
Konstantinos D. Demadis
1,†,
Aurelio Cabeza Diaz
4 and
Laura Leon-Reina
5
1
Crystal Engineering Growth and Design Laboratory, Department of Chemistry, University of Crete, Voutes Campus, GR-71003 Heraklion, Crete, Greece
2
The Heritage Management Organization, 810 W Washington Blvd. Suite 210, Chicago, IL 60607, USA
3
Classical and Archaeological Studies, School of European Culture and Languages, University of Kent, Canterbury, Kent CT2 7N, UK
4
Departamento de Química Inorgánica, Cristalografía y Mineralogía, Universidad de Málaga, 29071 Málaga, Spain
5
Servicios Centrales de Apoyo a la Investigación, Universidad de Málaga, 29071 Málaga, Spain
*
Author to whom correspondence should be addressed.
These authors contributed equally to this work.
Heritage 2019, 2(3), 2652-2664; https://doi.org/10.3390/heritage2030163
Submission received: 6 August 2019 / Revised: 9 September 2019 / Accepted: 10 September 2019 / Published: 17 September 2019
(This article belongs to the Special Issue Cultural Heritage—Science, Materials and Technologies)

Abstract

:
Ceramic objects in whole or in fragments usually account for the majority of findings in an archaeological excavation. Thus, through examination of the values these items bear, it is possible to extract important information regarding raw materials provenance and ceramic technology. For this purpose, either traditional examination protocols could be followed, focusing on the macroscopic/morphological characteristics of the ancient object, or more sophisticated physicochemical techniques are employed. Nevertheless, there are cases where, due to the uniqueness and the significance of an object of archaeological value, sampling is impossible. Then, the available analytical tools are extremely limited, especially when molecular information and mineral phase identification is required. In this context, the results acquired from a multiphase clay ceramic dated on Early Neopalatioal period ΜΜΙΙΙA-LMIA (1750 B.C.E.–1490 B.C.E.), from the Minoan Bronze Age site at Philioremos (Crete, Greece) through the application of Raman confocal spectroscopy, a non-destructive/ non-invasive method are reported. The spectroscopic results are confirmed through the application of X-ray microdiffraction and scanning electron microscopy coupled with energy dispersive X-ray spectrometry. Moreover, it is demonstrated how it is made possible through the application of micro-Raman (μRaman) spectroscopy to examine and collect crucial information from very small inclusions in the ceramic fabric. The aim of this approach is to develop an analytical protocol based on μRaman spectroscopy, for extracting firing temperature information from other ceramic finds (figurines) where due to their uniqueness sampling and analyses through other techniques is not possible. This information can lead to dating but also to firing kiln technology extrapolations that are very significant in archaeology.

1. Introduction

Spectroscopic methods have become a vital investigative tool in determinative mineralogy [1,2,3]. It has been clearly demonstrated that several valuable conclusions can be extracted especially with regards to raw materials provenance and technology [4,5], through the identification of the mineralogical phases in ancient ceramics. Micro-Raman spectroscopy has been applied for mineral identification both in ceramic mass/clay as well as in the pigments used for decoration [6,7,8,9,10,11]. In this framework, indicative information about the firing conditions (e.g., atmosphere and temperature) can be acquired through the identification of raw material composition, but most importantly, through the chemical transformations that the constituent minerals undergo during the firing process. Several recent studies aiming to the mineralogical characterization and firing temperature determination of ancient ceramics focus on the application of micro-Raman spectroscopy [10,12,13].
Within the concept of the present study, a definition of the firing temperature range is attempted, through the investigation of the mineralogical phases present in the sherd under study (see specific details below). Although the main analytical tool utilized is micro-Raman spectroscopy (μRaman), the results are confirmed and enhanced by the application of X-ray microdiffraction (mXRD) and electron scanning microscopy coupled with energy dispersive X-ray spectrometry (SEM–EDS). Micro-Raman spectroscopy has been selected as the technique of choice due to several advantages, such as rapid and reliable characterization of the mineralogical phases of a ceramic material [14]. An equally important asset is the fact that Raman spectroscopy is a non-destructive/non-invasive technique. The aforementioned aspects of Raman spectroscopy are of major significance in cases where the dominant values of the material under examination are of morphological and archaeological importance. Lastly, the high spatial resolution achieved through micro-Raman spectroscopy allows the study of the micro-structure of a sample, i.e., specific inclusions in the clay matrix, as these can be spatially discriminated from the surrounding material. Nevertheless, for an accurate estimation of the mineralogical transformations, it is advantageous to also consider the effect of burial and post-burial steps [15].
The fundamental question posed was whether it is possible to determine the range of the maximum firing temperature through the sole use of micro-Raman spectroscopy. Upon firing, mineral inclusions in the clay matrix undergo chemical modifications, structural transformations (dehydration, dehydroxylation, decomposition and formation of new phases, vitrification) or conversion into more stable polymorphs, thus deeply transforming the original clay material [16]. These mineral transformations are compelled by high temperatures and low-pressures and are mainly influenced by the chemical and mineralogical composition of the original clay. Other factors affecting these mineralogical transformations include the grain-size distribution, the maximum heating temperature, heating rate, duration of firing and kiln redox atmosphere [16,17,18]. The appearance of a particular high-temperature mineral in an archaeological artefact is related, among other factors, to the maximum temperature reached in the kiln [18]. Archaeometric investigations commonly utilize the criterion of firing temperature in order to determine several technological characteristics of an ancient ceramic [16].

2. Materials and Methods

For the initial part of this study, a sherd from a handle of a jar or jug was used, Figure 1. Judging from the size of the sherd, it was most likely part of a medium-sized vessel. This is part of the objects excavated from the Philioremos Peak Sanctuary and it was found in Room 1 (central room of the site). This item has not been dated, but probably belongs to the early Neopalatial period, around MM III (Early Neopalatioal period ΜΜΙΙΙA-LMIA, 750 B.C.E.–1490 B.C.E.).
Based on the petrographic analysis performed by Nodarou, the fabric of sample PHL60 which comprises one of the most characteristic ceramic types of the excavation, is characterized as a semi coarse fabric with very fine matrix and coarse inclusions added in the clay mix as temper. The matrix is homogeneous; it has a brown to greenish-brown color and it is optically inactive. The greenish tinge of the matrix is indicative of a calcareous clay that has been highly fired. The non-plastic inclusions consist mainly of fine grey siltstones, some phyllite, quartzite and quartz. The initial part of sample preparation included the cut of a thin part from the handle (item: 102708) and the encapsulation in epoxy resin. After the curing time, a thin section was cut for petrographic examination, using a lapidary slab saw and the leftover was used for the purposes of this paper (Figure 2).
The initial mineralogical analysis and characterization of the mineral constituents of the clay material, was performed under a confocal Raman microscope. The Raman spectra were recorded on a Thermo Scientific Nicolet Almega XR Dispersive Raman Spectrometer confocal with an Olympus BX43 microscope with a long distance 50× objective lens and an excitation laser with λ = 780 nm, at 40 mW, operating at high resolution. The spectral range was between 100–3100 cm−1 and the acquisition time was 100 s.
Micro X-ray diffraction (mXRD) were performed by XRD (Bruker AXS D8 Discover) equipped with a Eulerian cradle including x–y–z -stage, fine collimator with 125 μm diameter exposed spot and a LYNXEYE 1D detector. The X-ray beam (Cu Kα line, λ = 1.5418 Å) was generated by 1.6 kW X-ray tube and Göbel mirror optics. The 2θ scanning angle range was from 4° to 70° and the step-size was 0.02°. Phase identification was performed with X’Pert HighScore Plus v.4.1e software using the PDF database.
The micromorphological observations as well as the elemental qualitative and quantitative analyses were performed through a Jeol JSM 6390LV Scanning Electron Microscope (SEM) with analytical working distance of 10 mm operating at a high resolution of 3.0 nm, equipped with an embedded energy dispersive X-ray analyzer (EDS).

3. Results

Several investigators have studied the mineralogical transformations in fired calcium-rich clays in comparison to calcium-poor clays [17,18,19,20,21,22,23]. The newly-formed phases reported in the literature typically include gehlenite, wollastonite and anorthite, which form from initial material blends of SiO2 (silica, 50%), Al2O3 (15%), and CaO (10%). However, studies on extremely carbonate rich clays are rare. A precursor composition poor in silica and richer in CaO (and/or MgO) is expected to yield much more complex mineralogy.

3.1. Mineral Phase Identification
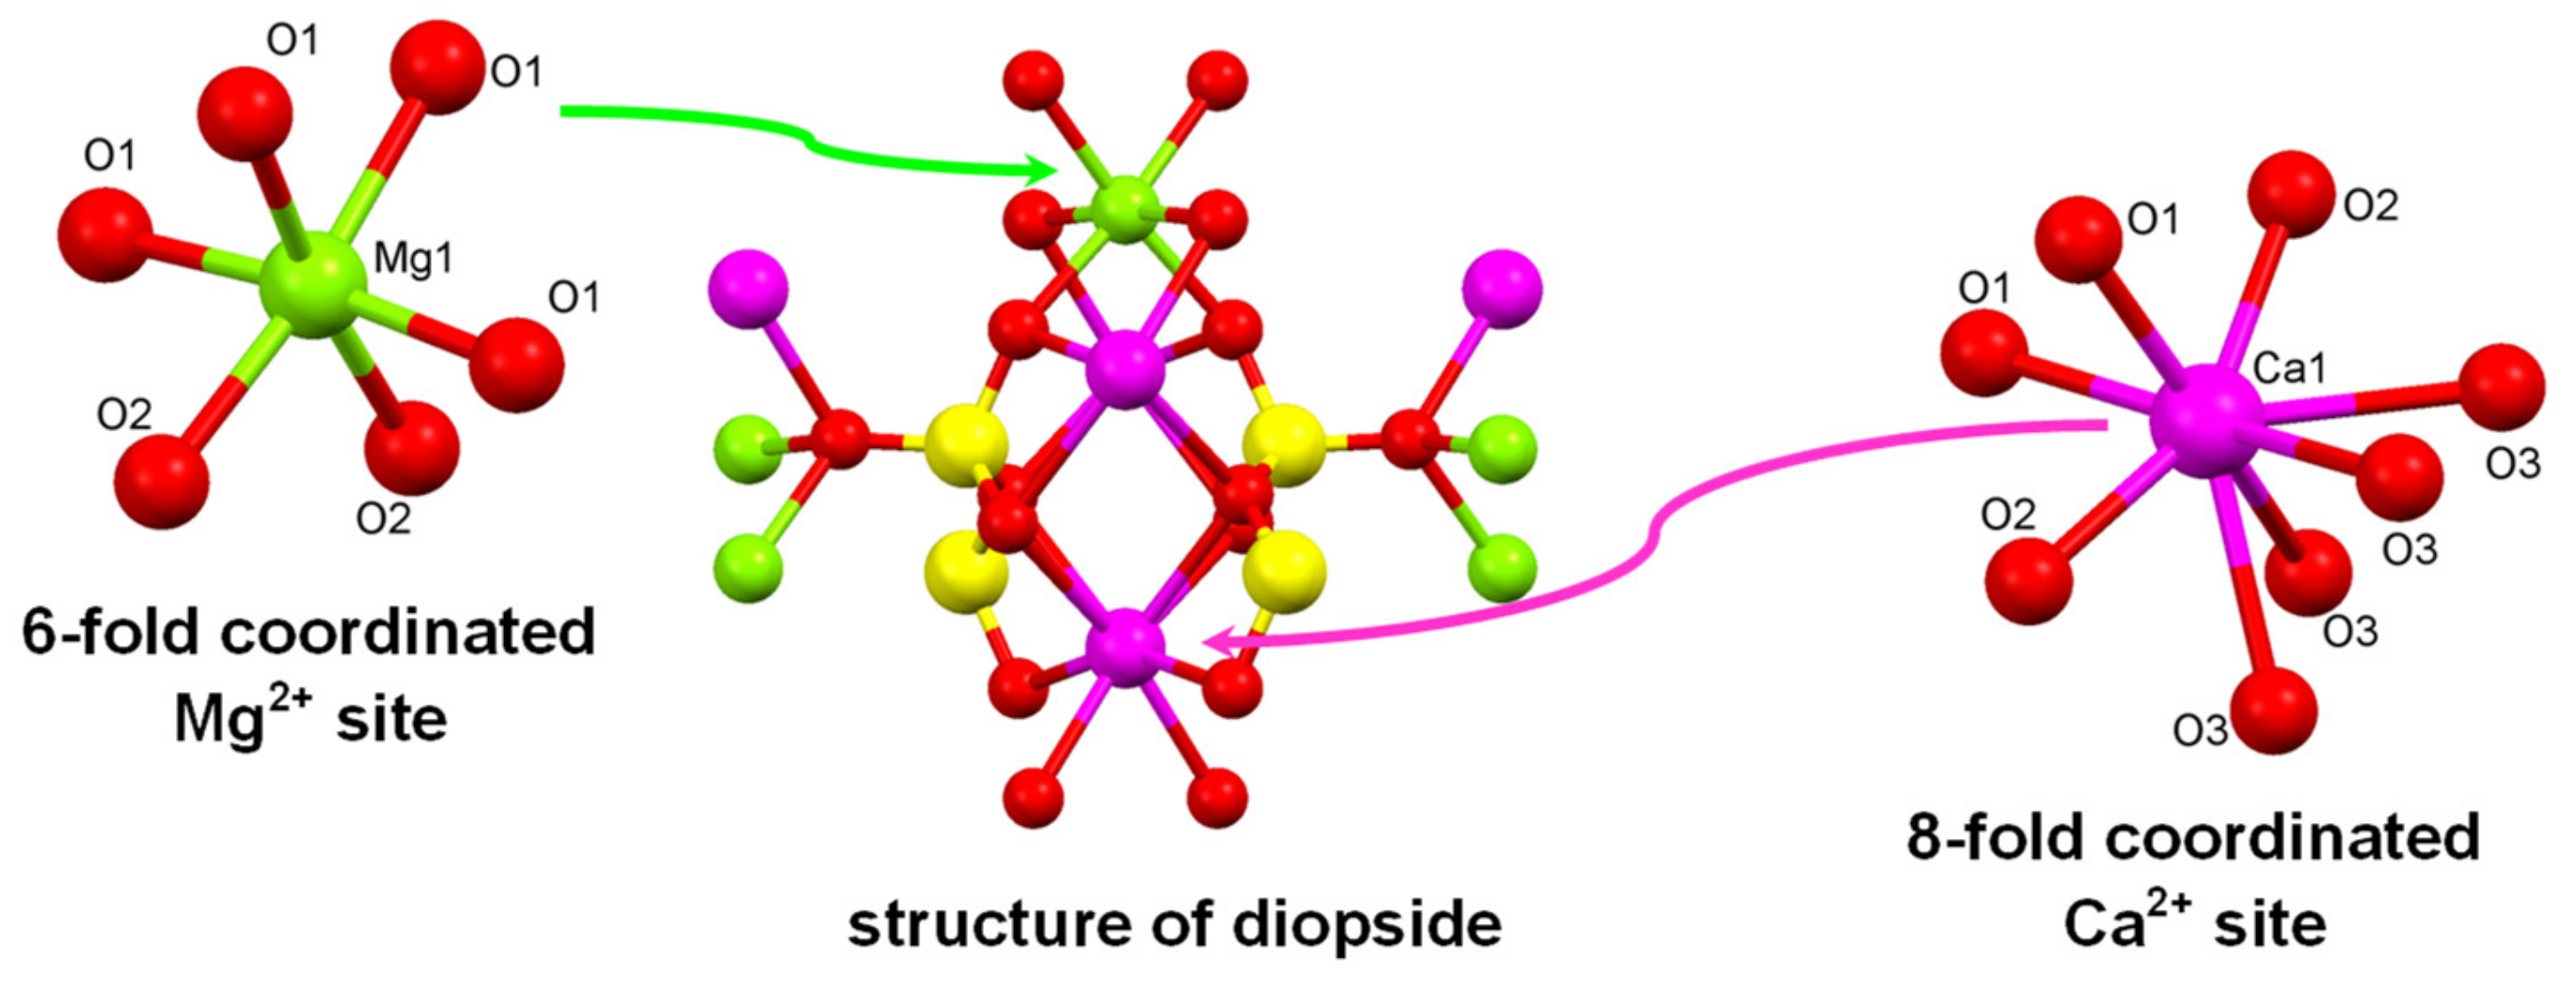
3.1.1. Diopside

Minerals identified in an archaeological artefact can be classified as follows: the primary minerals (or relict minerals) are those that were present in the raw material, like quartz, which do not undergo reactions in a wide range of temperature. The firing minerals, like pyroxenes, are the products of thermally induced reactions, i.e., they are formed during firing. Finally, the secondary minerals are those formed after the production of the wares, during their use and mainly their burial, as a result of either transformation of metastable firing minerals or infiltration of any solution [24,25].
Augite/clinopyroxene ((Ca,Na)(Mg,Fe,Al,Ti)(Si,Al)2O6) is a solid solution in the pyroxene group with diopside and hedenbergite being the endmembers. The presence of augite has been documented by means of μRaman spectroscopy (Figure 3).
The carbonate content (Ca-rich, Ca-poor or marly clays of intermediate Ca content) is rather significant regarding the paragenesis in the ceramic body, while the type of CaO transformations in the ceramic matrix could inhibit or enhance vitrification according to the formation of the “firing” minerals, i.e., pyroxene group of minerals such as augite [27].
Diopside (CaMgSi2O6), the magnesium rich endmember of the augite group, identified in the ceramic matrix of sample PHL-60, is used for defining the firing temperature scale. Diopside belongs to the family of single chain silicate minerals (clinopyroxenes). It appears colorless to pale green, while the color tends to darken as the quantity of iron (substituting magnesium) rises.
The thermal decomposition of calcite begins at around 650 °C, and it is completed at about 900 °C [23]. At temperatures above 800 °C, CaO, SiO2 and Al2O3 start to react to form calcium aluminum silicates and calcium silicates, such as gehlenite and diopside [24,28]. These minerals comprise the typical high temperature mineralogical phases whose presence is also strongly related to the mineralogical composition of the raw clay material. Common high firing phases are diopside for calcareous and mullite for non-calcareous clays. In sample PHL-60, diopside has been sporadically identified, as seen in Figure 3, whose presence is related to calcite transformation.
Reactions of carbonate minerals (calcite, dolomite) or periclase with quartz and in some cases with aluminum silicates (clay minerals) leads to the formation of several calcium and/or magnesium metastable mineral phases such as diopside. The formation of the aforementioned “firing” minerals, starts near 900 °C, according to the following reaction.
2SiO2 + CaMg(CO3)2 (carbonate minerals) → CaMgSi2O6 (diopside) + 2CO2,
As calcite is consumed more quickly than periclase, the excess MgO leads to the transformation of calcium–magnesium silicates into magnesium silicates, such as forsterite, which begins to form at 1000 °C and becomes more abundant at 1100 °C. Nevertheless, no forsterite has been identified in sample PHL-60.
The structure of pyroxenes is built up by the linkage of SiO4 tetrahedra sharing two out of four corners forming continuous chains along the c axis. Two tetrahedra are repeated in these chains. Cations are located between them, in sites labelled M1 and M2. Pyroxenes include two groups: orthopyroxenes (ortorhombic symmetry) and clinopyroxenes (monoclinic symmetry). When the cation in the M2 site is six-fold coordinated, the minerals are orthorhombic (enstatite-ferrosilite), and when it is in eight-fold coordination they are monoclinic. In clinopyroxenes, the M2 site is occupied by Ca2+, Na+, Li+ cations (diopside, hedenbergite, augite, aegirine, spodumene). This is clearly shown in Figure 4. The M1 site is six-fold coordinated and occupied by Fe3+, Al3+, Fe2+, Mg2+, Mn2+ [29].
μRaman spectra were acquired from two representative white spots of the inclusion in Figure 3, and are shown in Figure 5. The modes at 142 and 235 cm−1 can be mainly assigned to tilting of the Si-centered tetrahedra; the modes at 182 and 314 cm−1 are respectively due to the Ca and Mg vibrations (associated to a tilting of the tetrahedra), whereas the mode at 255 cm−1 involves the motion of both Ca and Mg. The modes at frequencies in the 327, 390 cm−1 range can be associated to tetrahedral tilting, whereas the modes at 515 and 535 cm−1 are largely due to O-Si-O bending motion. The Ag mode at 671 cm−1 corresponds to the Si-Obr-Si bending, Obr being the bridging oxygen between tetrahedra in the pyroxene tetrahedral chain. The symmetric and asymmetric Si-O1, Si-O2 stretching vibrations appear at 1013 and 1047 cm−1, respectively [30].
The fact that the iron content is rather high (compared to calcium and magnesium content) in all EDS spectra collected from inclusions where the presence of diopside has been identified, is indicative of the mineral hedenbergite. Hedenbergite, CaFeSi2O6, is the iron rich end member of the pyroxene group. This suggests that the inclusion is a solid solution which is typical for pyroxene minerals and specifically for diopside.
The presence of diopside has also been confirmed by means of X-Ray micro diffraction (mXRD). Laboratory-based mXRD allows extending X-ray examination of mineral samples to the microscopic level (50–500 µm). Individual grains in heterogeneous samples can be examined in situ, without any prior sample preparation. Importantly, mXRD of minerals preserves spatial relationships, thus enabling the study of orientational phenomena [31].
Figure 6 displays the mXRD study of several spots in sample PH-60. As can be observed, the presence of diopside (ICSD 98-010-0738) as majority component is confirmed in the spot F3 together with some diffraction peaks corresponding to quartz (ICSD 96-901-0146). These phases are also presented in spot A7, accompanied by albite (ICSD 98-008-7657). The region around C6 shows a more complex composition where clinopyroxene (ICSD 98-015-8014, selected over diopside due to a better agreement in the position of the diffraction peaks) and albite appear, in addition to anorthoclase (ICSD 96-900-0861) and dolomite (ICSD 98-017-1529). Clinopyroxene and quartz constitute the main mineral phases found in the C8 together with some peaks corresponding to albite, while spot F6 shows a mixture of clinopyroxene, magnesioferrite (ICSD 98-015-8427) and rutile (ICSD 98-003-6415).

3.1.2. Quartz

Quartz is commonly found in ancient ceramics [32,33]. Quartz is a three-dimensional polymer in which the SiO4 tetrahedral units are linked throughout the crystal. Traces were identified in several inclusions, as seen in Figure 7. In the green spectrum collected from another spot of B7 inclusion shows the characteristic Raman bands of quartz. The spectrum is characterized by a prominent band due to the symmetric bending vibration (Si–O–Si) at 463 cm−1, medium to weak bands due to lattice modes at 126, 199 and 262 cm−1 and weak bands at 356 and 401 cm−1 due to asymmetric bending modes of the silica tetrahedra. It has also weak bands due to an Si–O–Si bending mode at 804 cm−1 and to an asymmetric stretching mode of the silica tetrahedra at 1085 cm−1. The observed bands are in good agreement with the characteristic Raman modes of quartz, (D33) space group, reported in the literature [34].

3.1.3. Feldspar Minerals
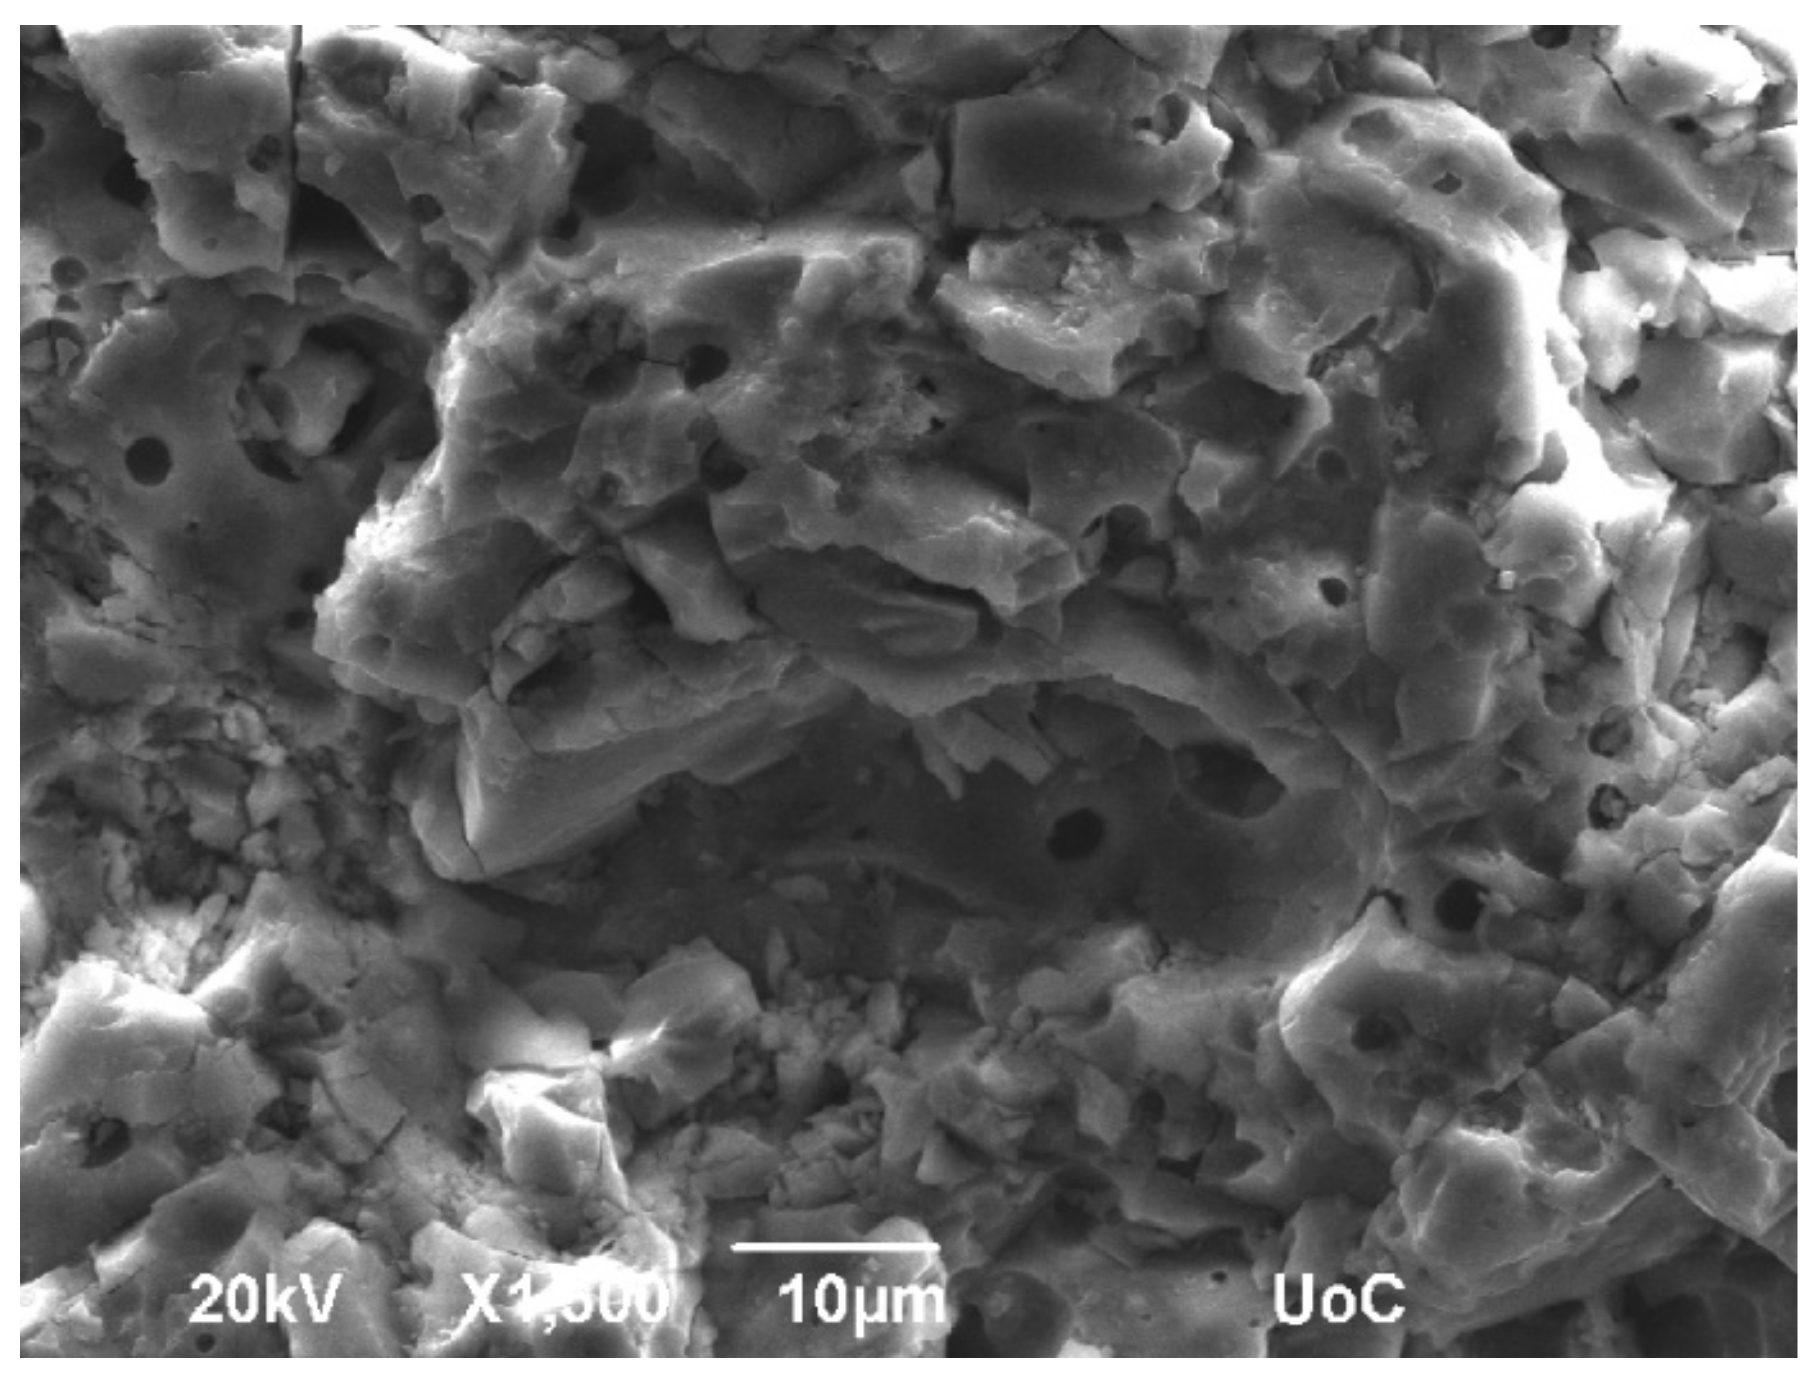
Two alkali feldspar minerals have been identified in the inclusions examined: Albite and orthoclase. Both minerals have a tectosilicate structure with fully linked tetrahedra that produce a Raman spectral pattern distinctly different from those of ortho-, chain, ring and layer silicates, in which the TO4 (where T is an aluminum or silicon atom) tetrahedra are not linked at all, or only partially linked, with other TO4 units [35]. The strongest Raman band in the tectosilicate spectrum is located below 600 cm−1, and in many cases this feature can be used to identify the specific tectosilicate while the Raman spectral features of the feldspars are distinctly different from those of other tectosilicates such as quartz and zeolites [36,37].
In particular, the Raman spectra of the feldspars are readily recognized by the presence of two or three Raman peaks lying between 450 and 515 cm−1, the strongest of which falls within the narrow region of 505 to 515 cm−1, see Figure 8. The peak position of the strongest Raman band of many tectosilicates shows an inverse correlation with the size of the ring made by the TO4 tetrahedra [38]. For example, feldspars, with a four-membered ring, show the strongest Raman peak to be near ~510 cm−1 [36,38]. The Raman modes, which occur at Raman shifts below 350 cm−1 are related to tetrahedral cage shear, modes between 350 and 550 cm−1 are related to 4-membered ring breathing deformation and modes between 550 and 850 cm−1 are related to tetrahedral deformation [39].
Albite (NaAlSi3O8) belongs to the family of alkali feldspar tectosilicate minerals that consists of a tetrahedral cage structure that has cavities containing Na+ ions [39,40,41]. The cage is comprised linked four-membered tetrahedral rings, where Al3+ centers in the ordered structure occupy the T1(o) tetrahedral site that is bonded to four surrounding silicate tetrahedra through shared oxygen atoms. Albite undergoes a triclinic-to-monoclinic phase transition near 980 °C leading to the formation of “high albite” which has disordered Al-Si arrangement (in contrast to the “low albite”). In “high albite” the Al and Si randomize at the tetrahedral sites, so that each site is 25% occupied by Al and 75% occupied by Si [39,42,43].
In most of the spectra collected in which albite has been identified, the relative intensity of the Raman band envelope between 140 and 210 cm−1 is increased compared to spectra of the same mineral in room temperature. This is due to the fact that although high albite is stable below 800 °C, the intensity of those low frequency bands steadily increases following the increase of temperature. This trend is probably due to increased thermal population effects [42] on the spectrum as the temperature rises [39].
Orthoclace (KAlSi3O8) is an important tectosilicate mineral which constitutes the potassic end-member of the alkali feldspars that crystallizes at high temperatures. All alkali feldspars that contain orthoclase have a Raman band position of 513 ± 1 cm−1 regardless of crystallinity, Figure 9. The high content of Fe documented in the EDS spectra acquired from the inclusions where orthoclase has been identified, is indicative of the mineral iron orthoclase, a framework silicate in which ferric iron (Fe3+) has been shown to substitute to a limited extent for Al3+ in the (AI/SiO4) tetrahedra [43].

3.2. SEM-EDS

It has been demonstrated that scanning electron microscopy can be used as an analytical tool in order to obtain information regarding the vitrification and the chemical composition, the types of clay and firing procedures (temperature and atmosphere) employed in the manufacture of the pottery [44].
Regarding the micromorphology of the inclusions as documented by scanning electron microscopy (SEM), the main pattern observed was dominated by a large number of pores on the vitreous phase, as seen in Figure 10. Dehydration and decarbonation reactions play a significant role in controlling reaction kinetics and occurrence of new phases, because they release H2O and CO2 at different temperatures [16,23]. Decomposition of carbonates near 800 °C, leads to the release of 18–20 wt.% of CO2 in the fluid phase resulting in the formation of secondary porosity during firing. It has already been described in the literature [45] that secondary pores, totally or partially filled with aggregates of new metastable phases are more abundant in dolomitic clays. This can be related to transient fluid pressure within the pores, produced by the newly formatted fluid phase within the clay matrix [16].
Furthermore, energy dispersive X-ray spectrometry (Table 1) was applied on the inclusions that were previously identified and characterized both through μRaman and mXRD. It is hereby certified that according to the elemental and stoichiometric analyses, all the component elements of the minerals identified are present.

4. Discussion

It has been reported that in cases of carbonate clays, quartz, decomposes gradually from 800 to 1100 °C, diminishing drastically at 1100 °C [16]. The fact that quartz has been identified in abundance in the present study as the dominant constituent of several inclusions, is indicative of a firing temperature below 1000 °C.
Diopside is the main metastable phase identified and utilized for the definition of the firing temperature. Other abundant minerals identified were quartz and two tectosilicate feldspar minerals, albite and orthoclase. Minerals identified as minor ingredients include hedenbergite and bukovskyite. The crystallization of diopside starts when temperature is above 900 °C while -quartz is stable up to 1000 °C, thus leading to the estimation that a firing temperature between 900 and 1000 °C could have been applied. The absence of forsterite in sample PHL-60, confirms that the maximum firing temperature did not exceeded 1000 °C. It has been noted that since calcite is consumed more quickly than periclase, the excess MgO leads to the transformation of calcium–magnesium silicates into magnesium silicates, like forsterite, which began to form at 1000 °C and became more abundant at 1100 °C. Forsterite forms at the expense of diopside, which diminishes at 1000 °C and almost disappears at 1100 °C [16].
In order to defray arguments supporting the origin of diopside as possible ingredient of the original clay material, the temperature range of 900–1000 °C is further consolidated due to the presence of “high” albite (monoclinic). The relative intensities of Raman bands recorded, not only confirm the firing temperature range of 900–1000 °C but help to further specify the actual firing temperature. The triclinic to monoclinic phase transition to produce “high” albite takes place near 980 °C [39]. Furthermore, the presence of hedenbergite identified in the diopside inclusions, suggests that hedenbergite has been produced due to high temperature firing and was not a constituent of the original clay material. Hedenbergite is extremely rarely found as a pure substance, and usually has to be synthesized in the laboratory. Regarding the characterization/provenance of the raw material, based on the presence of diopside (and absence of calcite or dolomite) in the ceramic matrix, roughly the original clay material can be characterized as dolomitic.

5. Conclusions

It has been demonstrated that in the cases of coarse-grain pottery, such as this representative sample from the Philioremos peak sanctuary, with low vitrification degree a straightforward identification of a large number of mineral phases is possible through the application of μ-Raman spectroscopy. Under this perspective, the determination of the maximum firing temperature in the case of coarse and low fired pottery, μ-Raman spectroscopy can define a meaningful temperature range [13].
Through the analysis of a ceramic sherd with specific properties, it has been demonstrated and confirmed that when sampling is not possible or molecular information has to be extracted from very small inclusions in order to determine the firing temperature of ceramic finds, μRaman spectroscopy and laboratory X-ray microdiffraction can be very useful analytical tools. This information can not only lead to dating but also to firing kiln technology extrapolations that are very relevant in archaeology.
The great potential of mobile Raman equipment, although very useful in many fields of conservation sciences, is limited when dealing with objects that do not have a surface exhibiting a good optical quality (e.g., porous, very corrugated or microcracked surface), the identification of minerals is feasible [46,47]. Nevertheless, given the peculiarities of the materials under study (i.e., the size of inclusions) a confocal apparatus is required in order to specify the spots to be analyzed. Moreover, since in the cases of objects of unique archaeological value, sampling and/or analysis through the application of destructive techniques is not possible, mobile Raman spectroscopy is a one-way solution.
Based on the aforementioned information, micro-Raman spectroscopy will be the main analytical tool for the determination of firing temperature of another group of items with great significance (figurines) from the Philioremos site. Those items present a great diversity in their macroscopic characteristics (color, fabric) comparing to the dominant group of ceramics, in which the object analyzed and presented in this paper belongs, hence they give rise to a thinkable conception initially about their firing temperatures as well as to a wider spectrum of questions regarding the worshipping practices, or the trading networks in Minoan Crete.

Author Contributions

Conceptualization, E.K.; Methodology, I.G.; Formal analysis, E.K.; Investigation, I.G., A.D. and L.L.; Resources, E.K.; Data curation, I.G., A.D. and L.L.; Writing—original draft preparation, I.G., K.D., E.K., A.D. and L.L.; Writing—review and editing, I.G. and K.D.; Supervision, K.D.; Project administration, I.G.; Funding acquisition, E.K. and K.D.

Funding

This research was partially funded by the European Union’s Framework Programme for Research and Innovation HORIZON 2020 (Project HERACLES under grant agreement No 700395).

Acknowledgments

We also thank the Heraklion Ephorate of Antiquities, Hellenic Ministry of Culture and Sports.

Conflicts of Interest

The authors declare no conflict of interest. No personal circumstances or interest that may be perceived as inappropriately influencing the representation or interpretation of reported research results. The funders had no role in the design of the study; in the collection, analyses, or interpretation of data; in the writing of the manuscript, or in the decision to publish the results.

References

  1. Calas, G.; Hawthorne, F.C. Introduction to spectroscopic methods. Rev. Mineral. 1988, 18, 1–9. [Google Scholar]
  2. McMillan, P.F. Raman spectroscopy in mineralogy and geochemistry. Annu. Rev. Earth Planet. Sci. 1989, 17, 255–283. [Google Scholar] [CrossRef]
  3. Hutchinson, I.B.; Ingley, R.; Edwards, H.G.M.; Harris, L.; McHugh, M.; Malherbe, C.; Parnell, L. Raman spectroscopy on Mars: Identification of geological and bio-geological signatures in Martian analogues using miniaturized Raman spectrometers. Philos. Trans. R. Soc. 2014, 372, 20140204. [Google Scholar] [CrossRef] [PubMed]
  4. Perardi, A.; Zoppi, A.; Ruatta, L.; Davit, P. Modern trends in scientific studies on ancient ceramics. In Papers Presented at the 5th European Meeting on Ancient Ceramics, Athens, 1999; Kilikoglou, V., Hein, A., Maniatis, Y., Eds.; BAR International Series 1011; Archeopress: Oxford, UK, 2002; p. 371. [Google Scholar]
  5. Zoppi, A.; Lofrumento, C.; Castellucci, E.M.; Migliorini, M.G. Micro-Raman technique for phase analysis on archaeological ceramics. Spectrosc. Eur. 2002, 14, 16–21. [Google Scholar]
  6. Legodi, M.A.; De Waal, D. Raman analysis of red-brown and gray shards from 16th and 17th century Portuguese shipwrecks. Cryst. Eng. 2003, 6, 287–299. [Google Scholar] [CrossRef]
  7. Akyuz, S.; Akyuz, T.; Basaran, S.; Bolcal, C.; Gulec, A. FT-IR and Micro-Raman spectroscopic study of decorated potteries from VI and VII century BC, excavated in ancient Ainos-Turkey. J. Mol. Struct. 2007, 834, 150–153. [Google Scholar] [CrossRef]
  8. Cavalheri, A.S.; Balan, A.M.; Künzli, R.; Constantino, C.J. Vibrational spectroscopy applied to the study of archeological ceramic artifacts from Guarani culture in Brazil. Vib. Spectrosc. 2010, 54, 164–168. [Google Scholar] [CrossRef]
  9. Bersani, D.; Lottici, P.P.; Virgenti, S.; Sodo, A.; Malvestuto, G.; Botti, A.; Catarsi, M. Multi-technique investigation of archaeological pottery from Parma (Italy). J. Raman Spectrosc. 2010, 41, 1556–1561. [Google Scholar] [CrossRef]
  10. Ballirano, P.; De Vito, C.; Medeghini, L.; Mignardi, S.; Ferrini, V.; Matthiae, P.; Lottici, P.P. A combined use of optical microscopy, X-ray powder diffraction and Micro-Raman spectroscopy for the characterization of ancient ceramic from Ebla (Syria). Ceram. Int. 2014, 40, 16409–16419. [Google Scholar] [CrossRef]
  11. Bersani, D.; Lottici, P.P. Raman spectroscopy of minerals and mineral pigments in archaeometry. J. Raman Spectrosc. 2016, 47, 499–530. [Google Scholar] [CrossRef]
  12. Medeghini, L.; Mignardi, S.; De Vito, C.; Bersani, D.; Lottici, P.P.; Turetta, M.; Costantini, J.; Bacchini, E.; Sala, M.; Nigro, L. The key role of Micro-Raman spectroscopy in the study of ancient pottery: The case of pre-classical Jordanian ceramics from the archaeological site of Khirbet al-Batrawy. Eur. J. Mineral. 2013, 25, 881–893. [Google Scholar] [CrossRef]
  13. Medeghini, L.; Lottici, P.P.; De Vito, C.; Mignardi, S.; Bersani, D. Micro-Raman spectroscopy and ancient ceramics: Applications and problems. J. Raman Spectrosc. 2014, 45, 1244–1250. [Google Scholar] [CrossRef]
  14. Frost, R.; Kristof, J.; Schmidt, J.; Kloprogge, T. Raman spectroscopy of potassium acetate-intercalated kaolinites at liquid nitrogen temperature. Spectrochim. Acta 2001, 57, 603–609. [Google Scholar] [CrossRef]
  15. Lofrumento, C.; Zoppi, A.; Castellucci, E.M. Micro-Raman spectroscopy of ancient ceramics: A study of French sigillata wares. J. Raman Spectrosc. 2004, 35, 650–655. [Google Scholar] [CrossRef]
  16. Trindade, M.J.; Dias, M.I.; Coroado, J.; Rocha, F. Mineralogical transformations of calcareous rich clays with firing: A comparative study between calcite and dolomite rich clays from Algarve, Portugal. Appl. Clay Sci. 2009, 42, 345–355. [Google Scholar] [CrossRef]
  17. Maggetti, M. Phase analysis and its significance for technology and origin. In Archaeological Ceramics; Olin, J.S., Ed.; Smithsonian Institution Press: Boston, MA, USA, 1982; pp. 121–133. [Google Scholar]
  18. Peters, T.; Iberg, R. Mineralogical changes during firing of calcium-rich brick clays. Ceram. Bull. 1978, 57, 503–509. [Google Scholar]
  19. Duminuco, P.; Messiga, B.; Riccardi, M.P. Firing process of natural clays. Some microtextures and related phase compositions. Thermochim. Acta 1998, 321, 185–190. [Google Scholar] [CrossRef]
  20. Riccardi, M.P.; Messiga, B.; Duminuco, P. An approach to the dynamics of clay firing. Appl. Clay Sci. 1999, 15, 393–409. [Google Scholar] [CrossRef]
  21. Cultrone, G.; Rodriguez-Navarro, C.; Sebastian, E.; Cazalla, O.; De La Torre, M.J. Carbonate and silicate phase reactions during ceramic firing. Eur. J. Mineral. 2001, 13, 621–634. [Google Scholar] [CrossRef] [Green Version]
  22. Jordán, M.M.; Sanfeliu, T.; de la Fuente, C. Firing transformations of Tertiary clays used in the manufacturing of ceramic tile bodies. Appl. Clay Sci. 2001, 20, 87–95. [Google Scholar] [CrossRef]
  23. Traoré, K.; Kabré, T.S.; Blanchart, P. Gehlenite and anorthite crystallization from kaolinite and calcite mix. Ceram. Int. 2003, 9, 377–383. [Google Scholar] [CrossRef]
  24. Maggetti, M. Composition of Roman pottery from Lausanne (Switzerland). Br. Mus. Occas. Pap. 1981, 19, 33–49. [Google Scholar]
  25. De Benedetto, G.; Laviano, R.; Sabbatini, L.; Zambonin, P. Infrared spectroscopy in the mineralogical characterization of ancient pottery. J. Cult. Herit. 2002, 3, 177–186. [Google Scholar] [CrossRef]
  26. Lafuente, B.; Downs, R.T.; Yang, H.; Stone, N. The power of databases: The RRUFF project. In Highlights in Mineralogical Crystallography; Armbruster, T., Danisi, R.M., Eds.; W. De Gruyter: Berlin, Germany, 2015; pp. 1–303. [Google Scholar]
  27. Moropoulou, A.; Bakolas, A.; Bisbikou, K. Thermal analysis as a method of characterizing ancient ceramic technologies. Thermochim. Acta 1995, 2570, 743–753. [Google Scholar] [CrossRef]
  28. Maritan, L.; Nodari, L.; Mazzoli, C.; Milano, A.; Russo, U. Influence of firing conditions on ceramic products: Experimental study on clay rich in organic matter. Appl. Clay Sci. 2006, 31, 1–15. [Google Scholar] [CrossRef]
  29. Buzatu, A.; Buzgar, N. The Raman study of single-chain silicates. Analele Ştiinţifice ale Universităţii, A.I.; Cuza Iaşi 2010, LVI, 108–125. [Google Scholar]
  30. Prencipe, M.; Mantovani, L.; Tribaudino, M.; Bersani, D.; Lottici, P.P. The Raman spectrum of diopside: A comparison between ab initio calculated and experimentally measured frequencies. Eur. J. Mineral. 2012, 24, 457–464. [Google Scholar] [CrossRef]
  31. Flemming, R.L. Micro X-ray diffraction (μXRD): A versatile technique for characterization of Earth and planetary materials. Can. J. Earth Sci. 2007, 44, 1333–1346. [Google Scholar] [CrossRef]
  32. Sendova, M.; Zhelyaskov, V.; Scalera, M.; Ramsey, M. Micro-Raman spectroscopic study of pottery fragments from the Lapatsa tomb, Cyprus, ca 2500 BC. J. Raman Spectrosc. 2005, 36, 829–833. [Google Scholar] [CrossRef]
  33. Legodi, M.A.; De Waal, D. The preparation of magnetite, goethite, hematite and maghemite of pigment quality from mill scale iron waste. Dyes Pigments 2007, 74, 161–168. [Google Scholar] [CrossRef]
  34. Williams, Q. A Handbook of Physical Constants: Mineral Physics and Crystallography; Ahrens, T.J., Ed.; American Geophysical Union: Washington, DC, USA, 1995; Volume 2, p. 291. [Google Scholar]
  35. Deer, W.A.; Howie, R.A.; Zussman, J. An Introduction to Rock-Forming Minerals, 2nd ed.; Pearson, Prentice Hall: New York, NY, USA, 1991. [Google Scholar]
  36. Sharma, S.; Simons, B.; Yoder, H.S., Jr. Raman study of anorthite, calcium Tschermak’s pyroxene, and gehlenite in crystalline and glassy states. Am. Mineral. 1983, 68, 1113–1125. [Google Scholar]
  37. Matson, D.W.; Sharma, S.K.; Philpotts, J.A. Raman spectra of some tectosilicates and of glasses along the orthoclase–anorthite and nepheline–anorthite joins. Am. Mineral. 1986, 71, 694–704. [Google Scholar]
  38. Freeman, J.; Wang, A.; Kuebler, K.; Jolliff, B.; Haskin, L. Characterization of natural feldspars by Raman spectroscopy for future planetary exploration. Can. Mineral. 2008, 46, 1477–1500. [Google Scholar] [CrossRef]
  39. McKeown, D. Raman spectroscopy and vibrational analyses of albite: From 25 °C through the melting temperature. Am. Mineral. 2005, 90, 1506–1517. [Google Scholar] [CrossRef]
  40. Ribbe, P.H.; Hofmeister, A.M. Feldspar Mineralogy, 2nd ed.; The Mineralogical Society of American: Chantilly, VA, USA, 1983. [Google Scholar]
  41. Smith, J.V. Feldspar Minerals. Crystal structure and physical properties I. In Feldspar Minerals; Springer: Berlin/Heidelberg, Germany, 1974. [Google Scholar]
  42. Winter, J.K.; Okamura, F.P.; Ghose, S. A high-temperature structural study of high albite, monalbite, and the analbite to monalbite phase transition. Am. Mineral. 1979, 64, 409–423. [Google Scholar]
  43. Faust, G.T. The fusion relations of iron-orthoclase. Am. Miner. 1936, 21, 735–763. [Google Scholar]
  44. Maniatis, Y.; Tite, M.S. Technological examination of Neolithic-Bronze Age pottery from central and southeast Europe and from the Near East. J. Archaeol. Sci. 1981, 8, 59–76. [Google Scholar] [CrossRef]
  45. Born, M.; Huang, K. Dynamical Theory of Crystal Lattices; Clarendon Press: Oxford, UK, 1954; p. 199. [Google Scholar]
  46. Colomban, P. On-site Raman study of artwork: Procedure and illustrative examples. J. Raman Spectrosc. 2017, 49, 921–934. [Google Scholar] [CrossRef]
  47. Caggiani, M.; Colomban, P. Raman microspectroscopy for Cultural Heritage. Phys. Sci. Rev. 2018. [Google Scholar] [CrossRef]
Figure 1. The handle of the vessel (catalogue number: 102708) where the sherd under study originated.
Heritage 02 00163 g001
Figure 2. Several inclusions can be seen on the surface of a cross section of sample PHL-60.
Heritage 02 00163 g002
Figure 3. Spectrum of augite (black) collected from the spot F3 (780 nm, x50, 40 scans, 360 s, 20 mW). The blue spectrum of augite (RRUFF: R060861) is quoted for reference [26].
Heritage 02 00163 g003
Figure 4. The crystal structure of diopside (center) with the 6-fold coordinated Mg2+ (left) and 8-fold coordinated Ca2+ (right) sites highlighted. Color codes: Si yellow, O red, Mg green, Ca magenta.
Heritage 02 00163 g004
Figure 5. Spectrum collected from the inclusion in the spot F3 (black spectrum, 780 nm, ×50, 40 scans, 360 s, 20 mW). The blue spectrum of diopside (RRUFF: R040009-3) is quoted for reference.
Heritage 02 00163 g005
Figure 6. X-ray microdiffraction (mXRD) patterns for different spots with identification marks of the main peaks.
Heritage 02 00163 g006
Figure 7. μRaman spectrum of a quartz grain (black). The blue spectrum of quartz (RRUFF: R040031-3) is quoted for reference.
Heritage 02 00163 g007
Figure 8. The mineral albite has been identified as a major ingredient of several inclusions (black spectrum/baseline subtracted). The blue spectrum of albite (RRUFF: R040068-3) is quoted for reference.
Heritage 02 00163 g008
Figure 9. The mineral orthoclase has been identified as a major ingredient of inclusion A7 (black spectrum). The blue spectrum of orthoclase (RRUFF: R040055-3) is quoted for reference.
Heritage 02 00163 g009
Figure 10. Scanning electron microscopy (SEM) secondary electron photomicrograph showing new metastable mineral phase (orthoclase) surrounded by a vitreous porous material. This microtexture is typical for clays of domolitic origin [16].
Heritage 02 00163 g010
Table 1. Elemental analyses and stoichiometry.
ElementDiopsideQuartzAlbiteOrthoclase
Weight
%
Atomic
%
Weight
%
Atomic
%
Weight
%
Atomic
%
Weight
%
Atomic
%
O K50.5165.8460.3372.953.3966.5447.3663.71
Na K0.690.63--5.024.360.370.35
Mg K8.917.640.290.23--1.171.03
Al K2.982.31.220.8710.147.514.8611.86
Si K23.9217.7637.2625.6427.9119.8222.3317.12
K K0.660.350.310.153.121.592.511.38
Ca K5.943.09--0.410.20.70.38
Fe K6.392.390.090.21 9.783.77
Totals100.00 100.00 100.00 100.00

