Forecasting Internal Migration in Russia Using Google Trends: Evidence from Moscow and Saint Petersburg
Abstract
:1. Introduction
2. Literature Review
2.1. Migration
2.2. Google Trends and Its Applications in Migration Research
3. Materials and Methods
3.1. Forecasting Methods
3.1.1. Models for Short-Term Forecasts
3.1.2. Models for Long-Term Forecasts
3.2. Data
3.2.1. Migration Data and Macroeconomic Variables
3.2.2. Search Volume Data
4. Results
4.1. In-Sample Analysis
4.1.1. Univariate Models
4.1.2. Multivariate Models
4.2. Out-of-Sample Forecasting Analysis
4.2.1. Short-Term Forecasts: One-Step-Ahead Forecasts
- (1)
- ARIMA models with the dependent variable represented by the monthly inflows in levels or log-levels (2 models);
- (2)
- Google-augmented ARIMA-X models with the variables in levels or log-levels (8 models): we considered lagged Google search data for the queries about moving in a certain region and queries about jobs and housing, as well as the average of these three queries;
- (3)
- Seasonal ARIMA (SARIMA) models with and without Google search data, with the variables in levels or log-levels (10 models).
- (4)
- Additional models could surely be added, but this selection already gives important indications whether Google search data are useful for forecasting the monthly migration inflows in Moscow and Saint Petersburg. A summary of the models’ performances according to the mean squared error (MSE), the mean absolute error (MAE), and the mean absolute percentage error (MAPE) is reported in Table 5 (The optimal seasonal and non-seasonal ARIMA models, with and without Google search data, were estimated using the Hyndman and Khandakar [70] algorithm at each iteration of the forecasting procedure).
4.2.2. Long-Term Forecasts: 24-Step-Ahead Forecasts
- (1)
- VAR models with centered seasonal dummies, with and without Google data, with the variables in levels, log-levels, first differences, or log-returns (12 models);
- (2)
- VEC models with centered seasonal dummies, with and without Google data, with the variables in levels or log-levels (6 models);
- (3)
- Seasonal ARIMA models, as simple univariate benchmark models, with the variables in levels or log-levels (2 models).
5. Discussion and Conclusions
Author Contributions
Funding
Institutional Review Board Statement
Informed Consent Statement
Conflicts of Interest
Appendix A

Appendix B
Appendix C. Robustness Checks
Appendix C.1. Parameter Instability
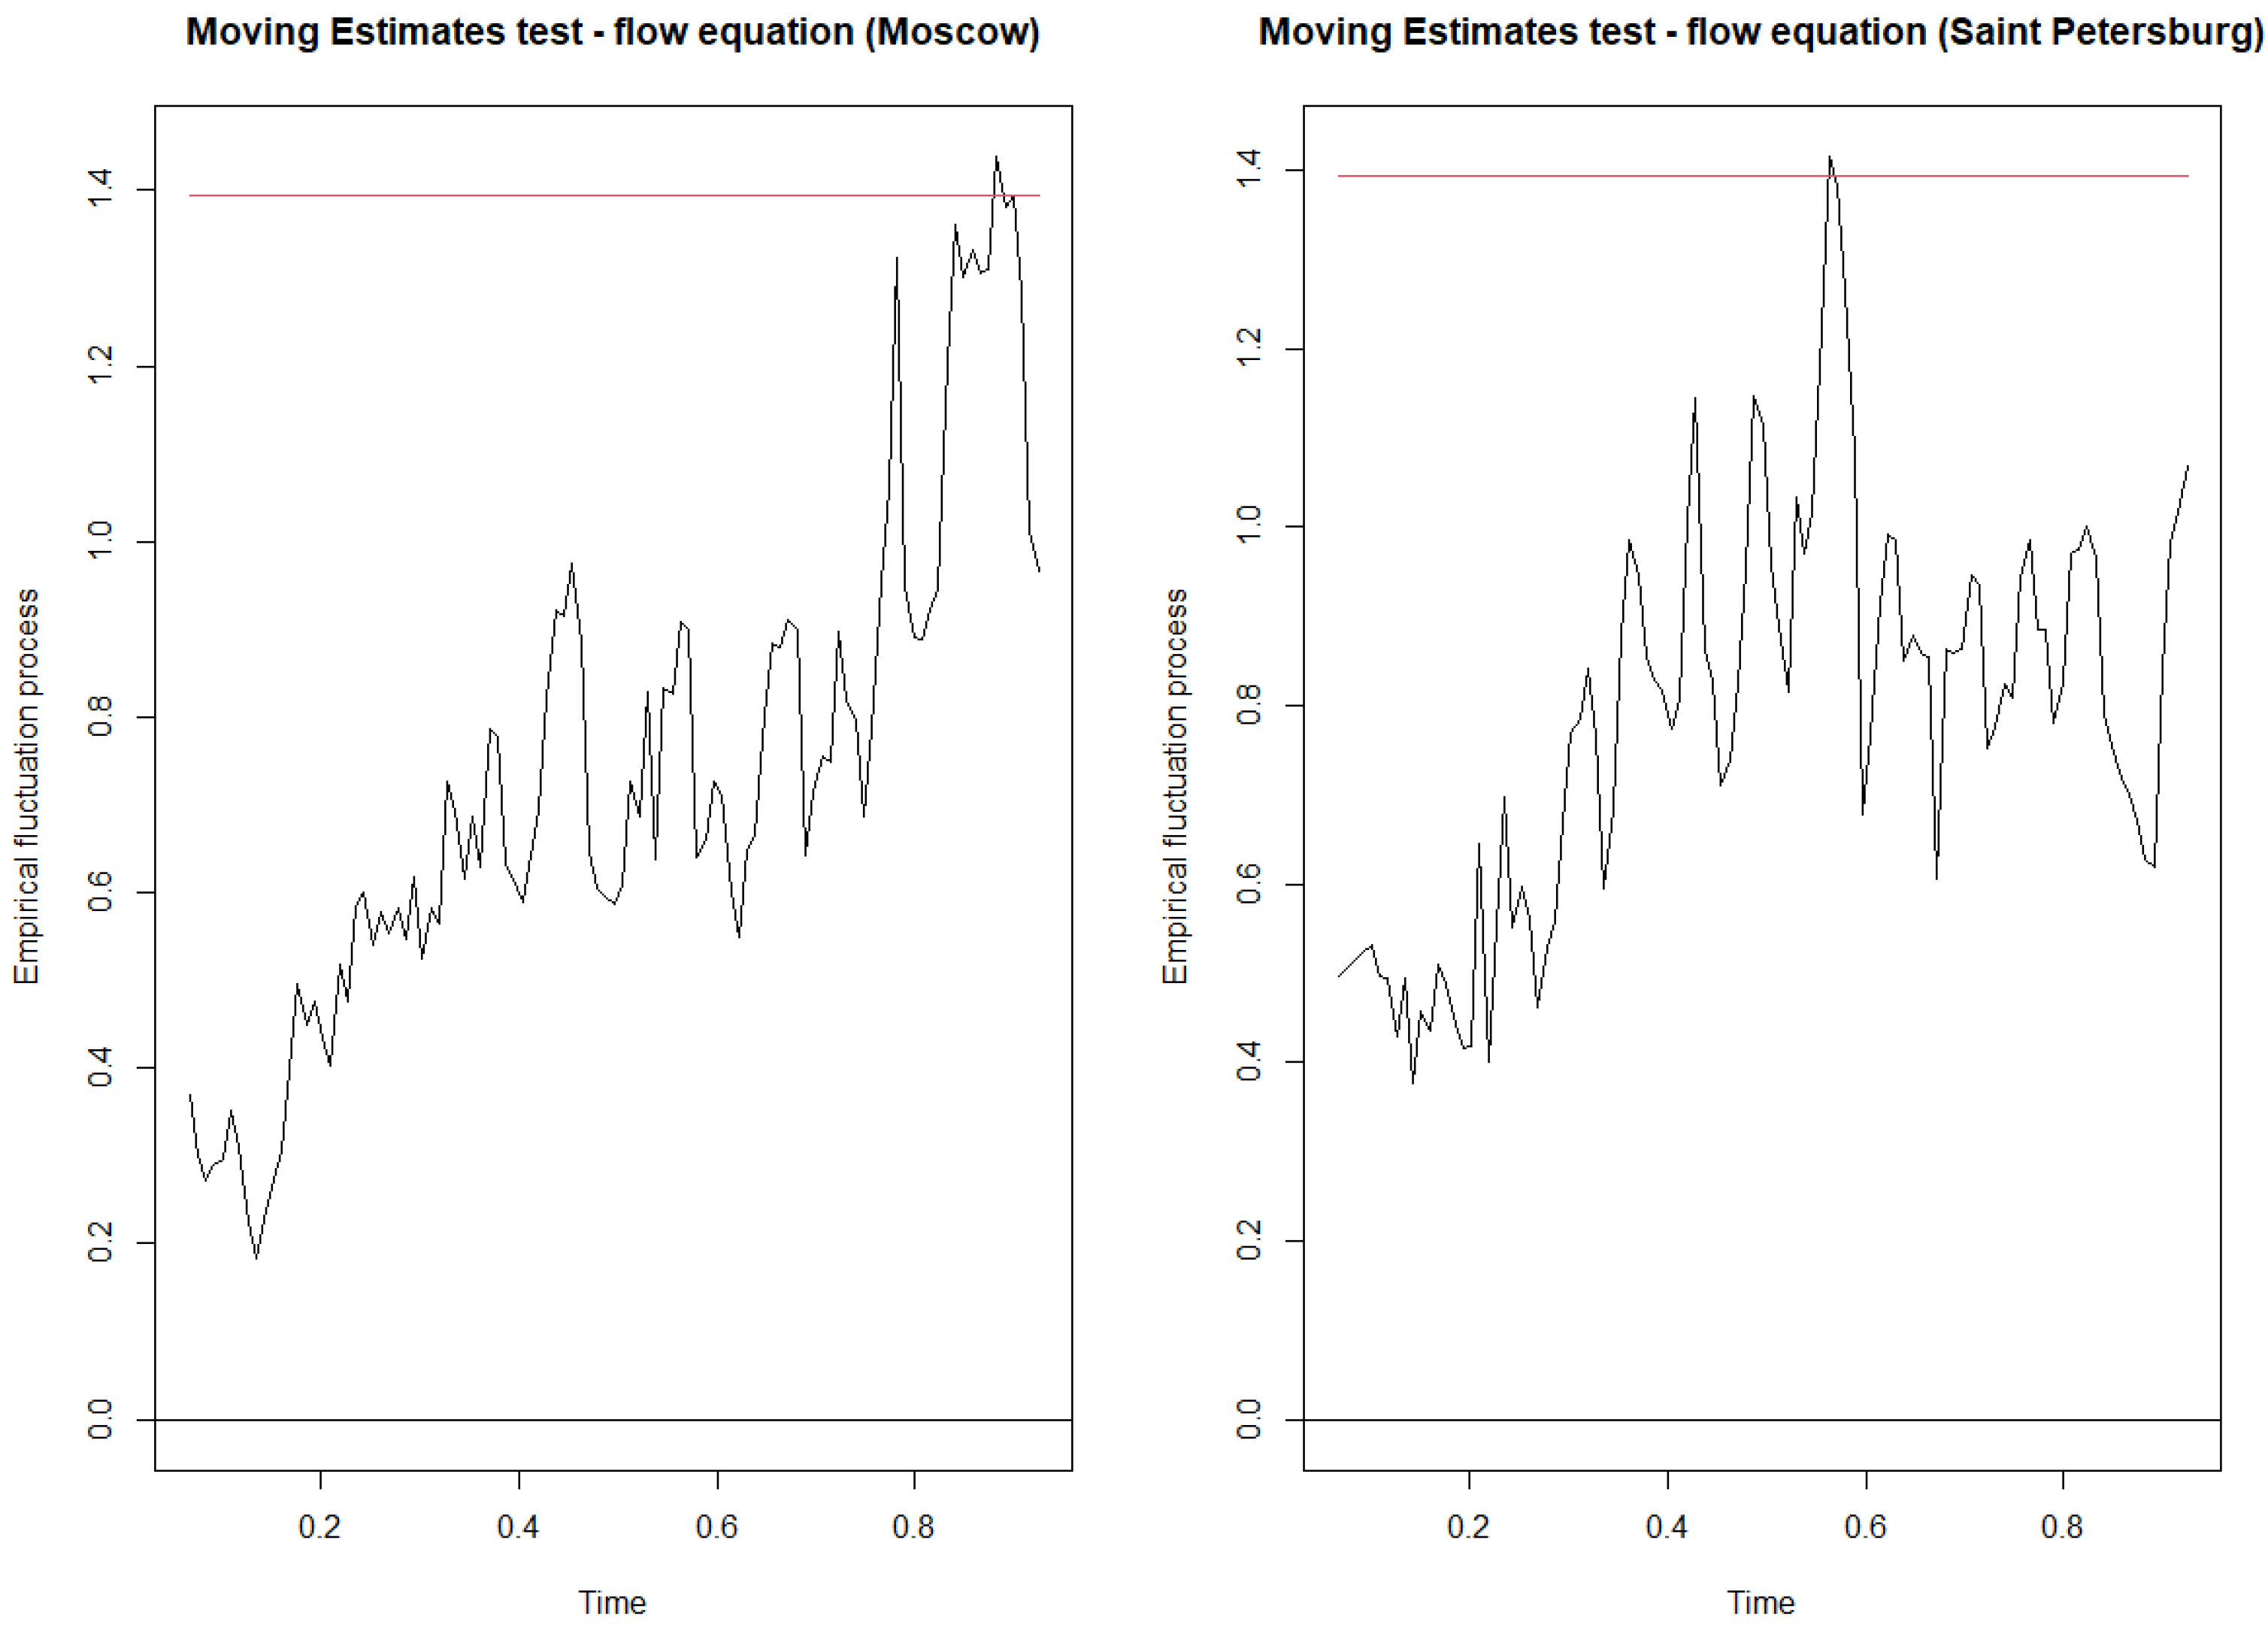


Appendix C.2. Additional Lags
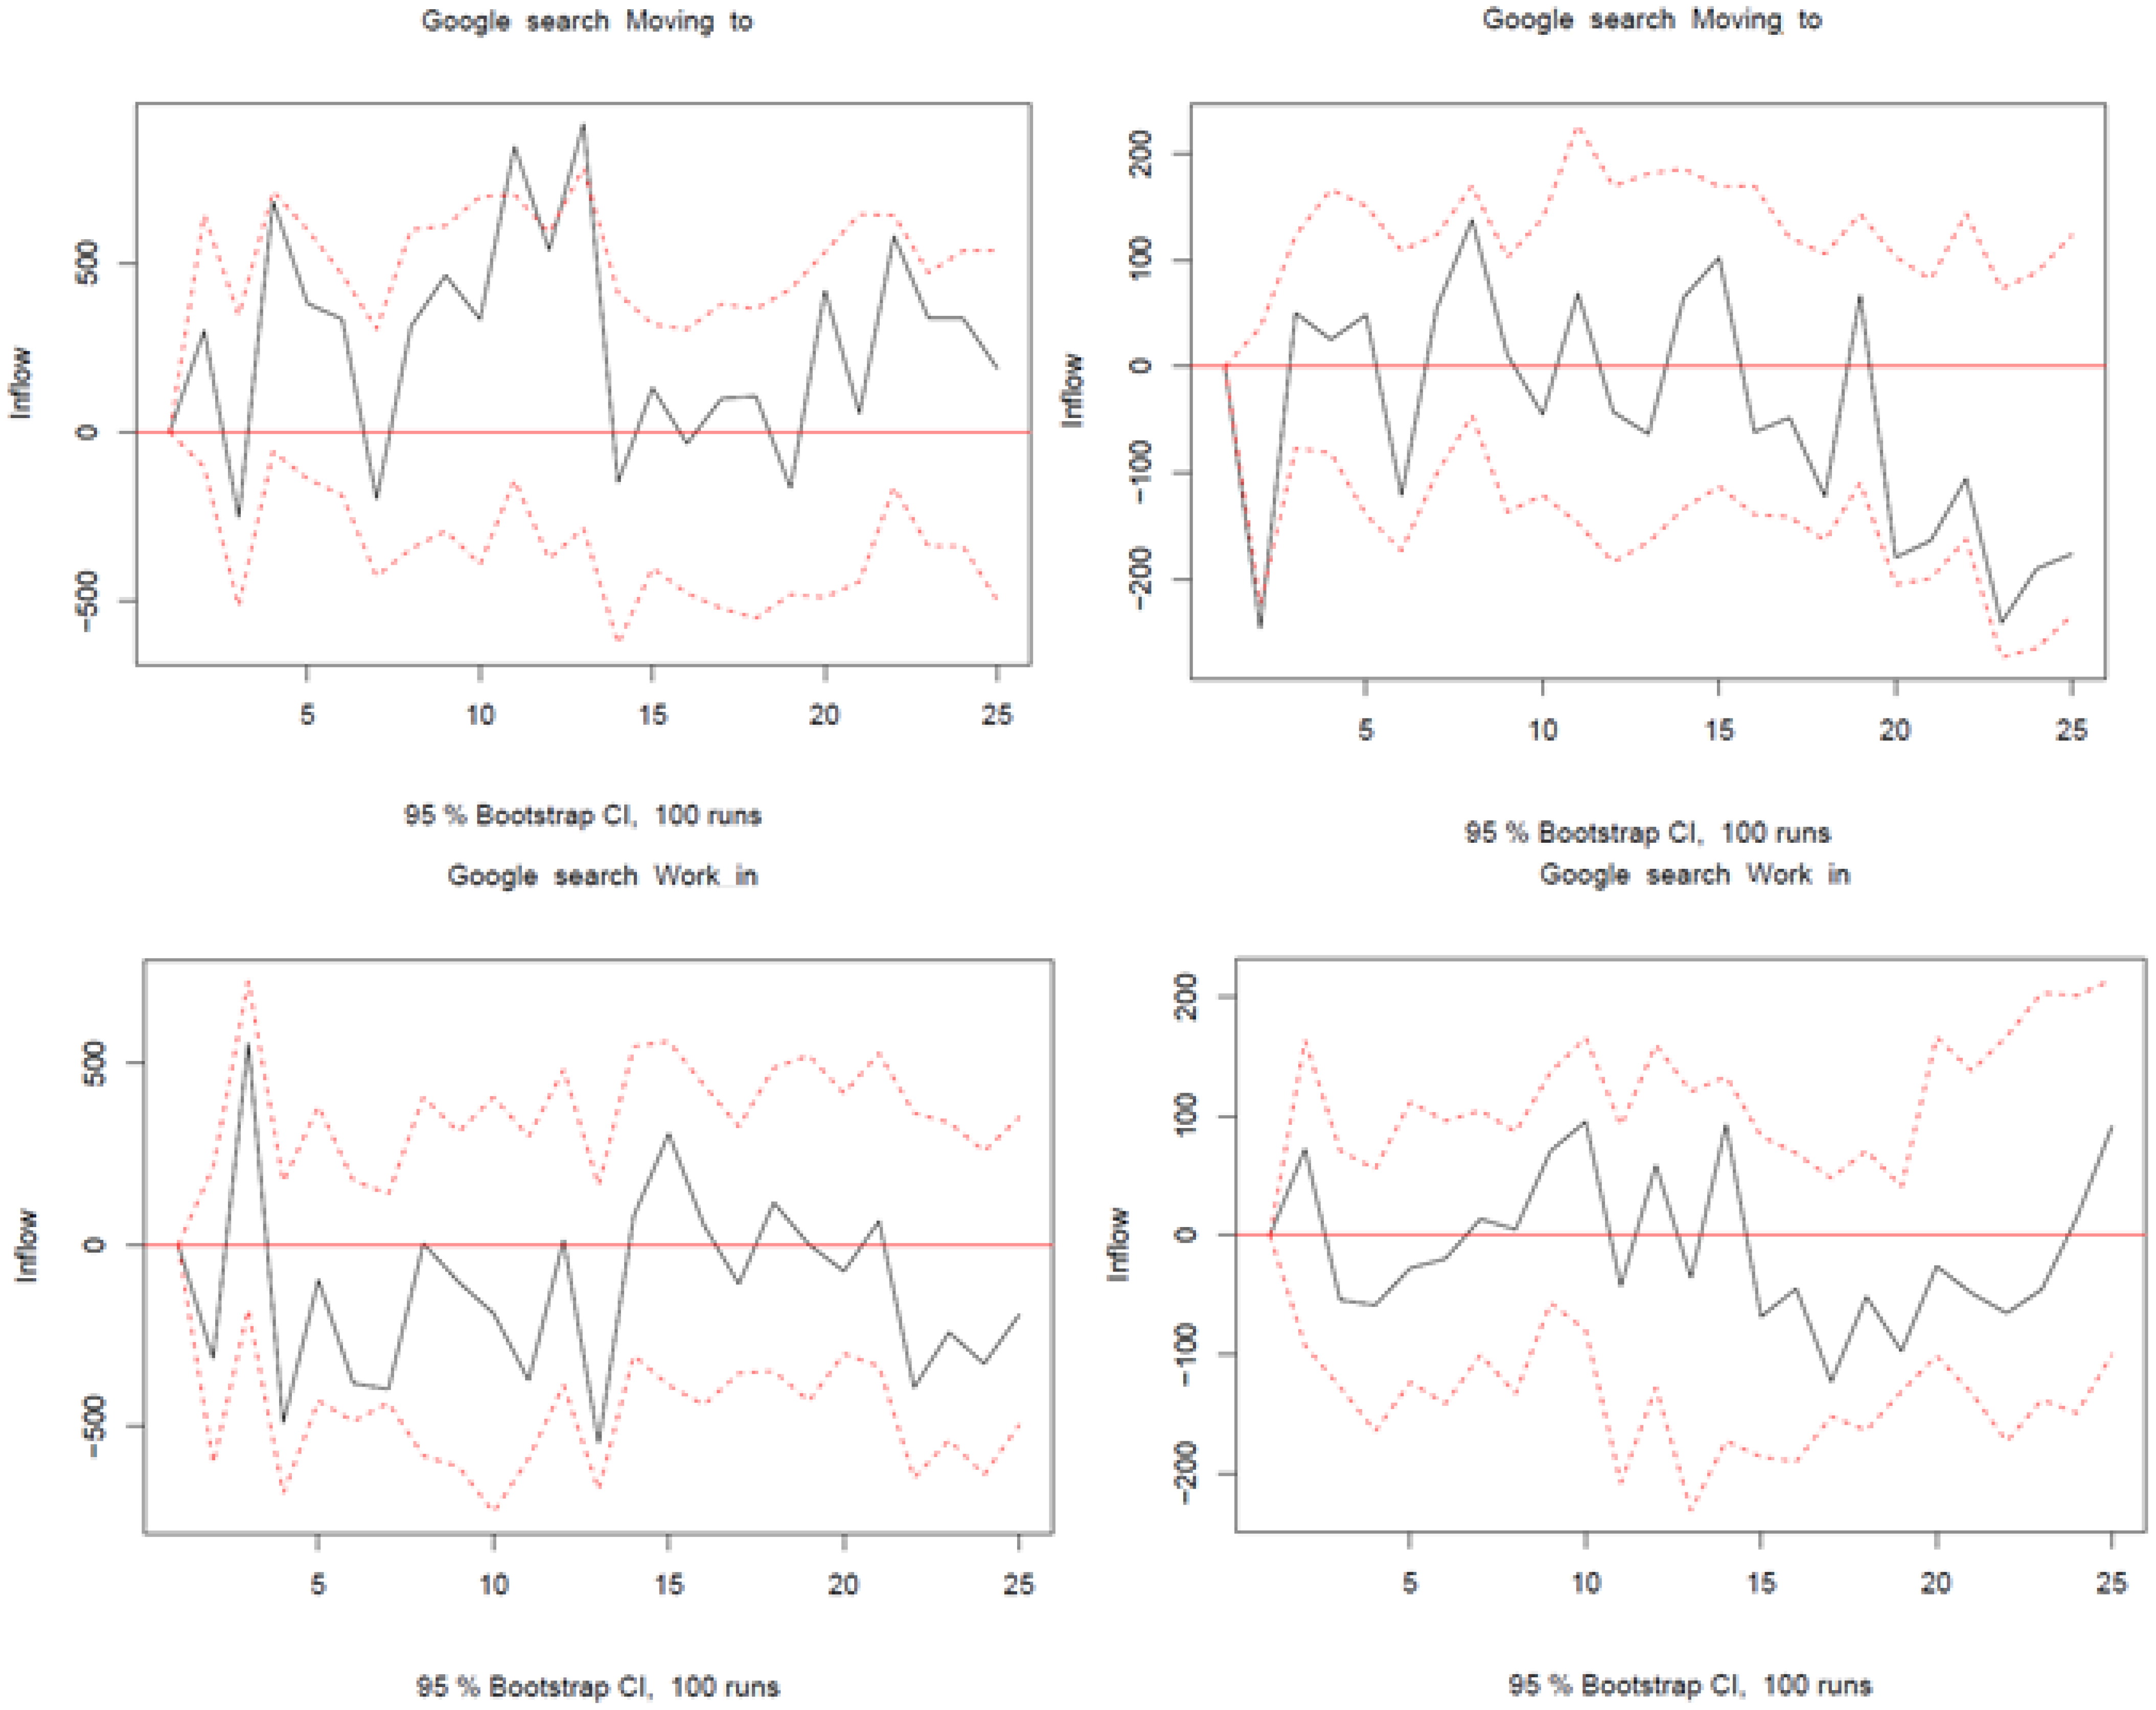
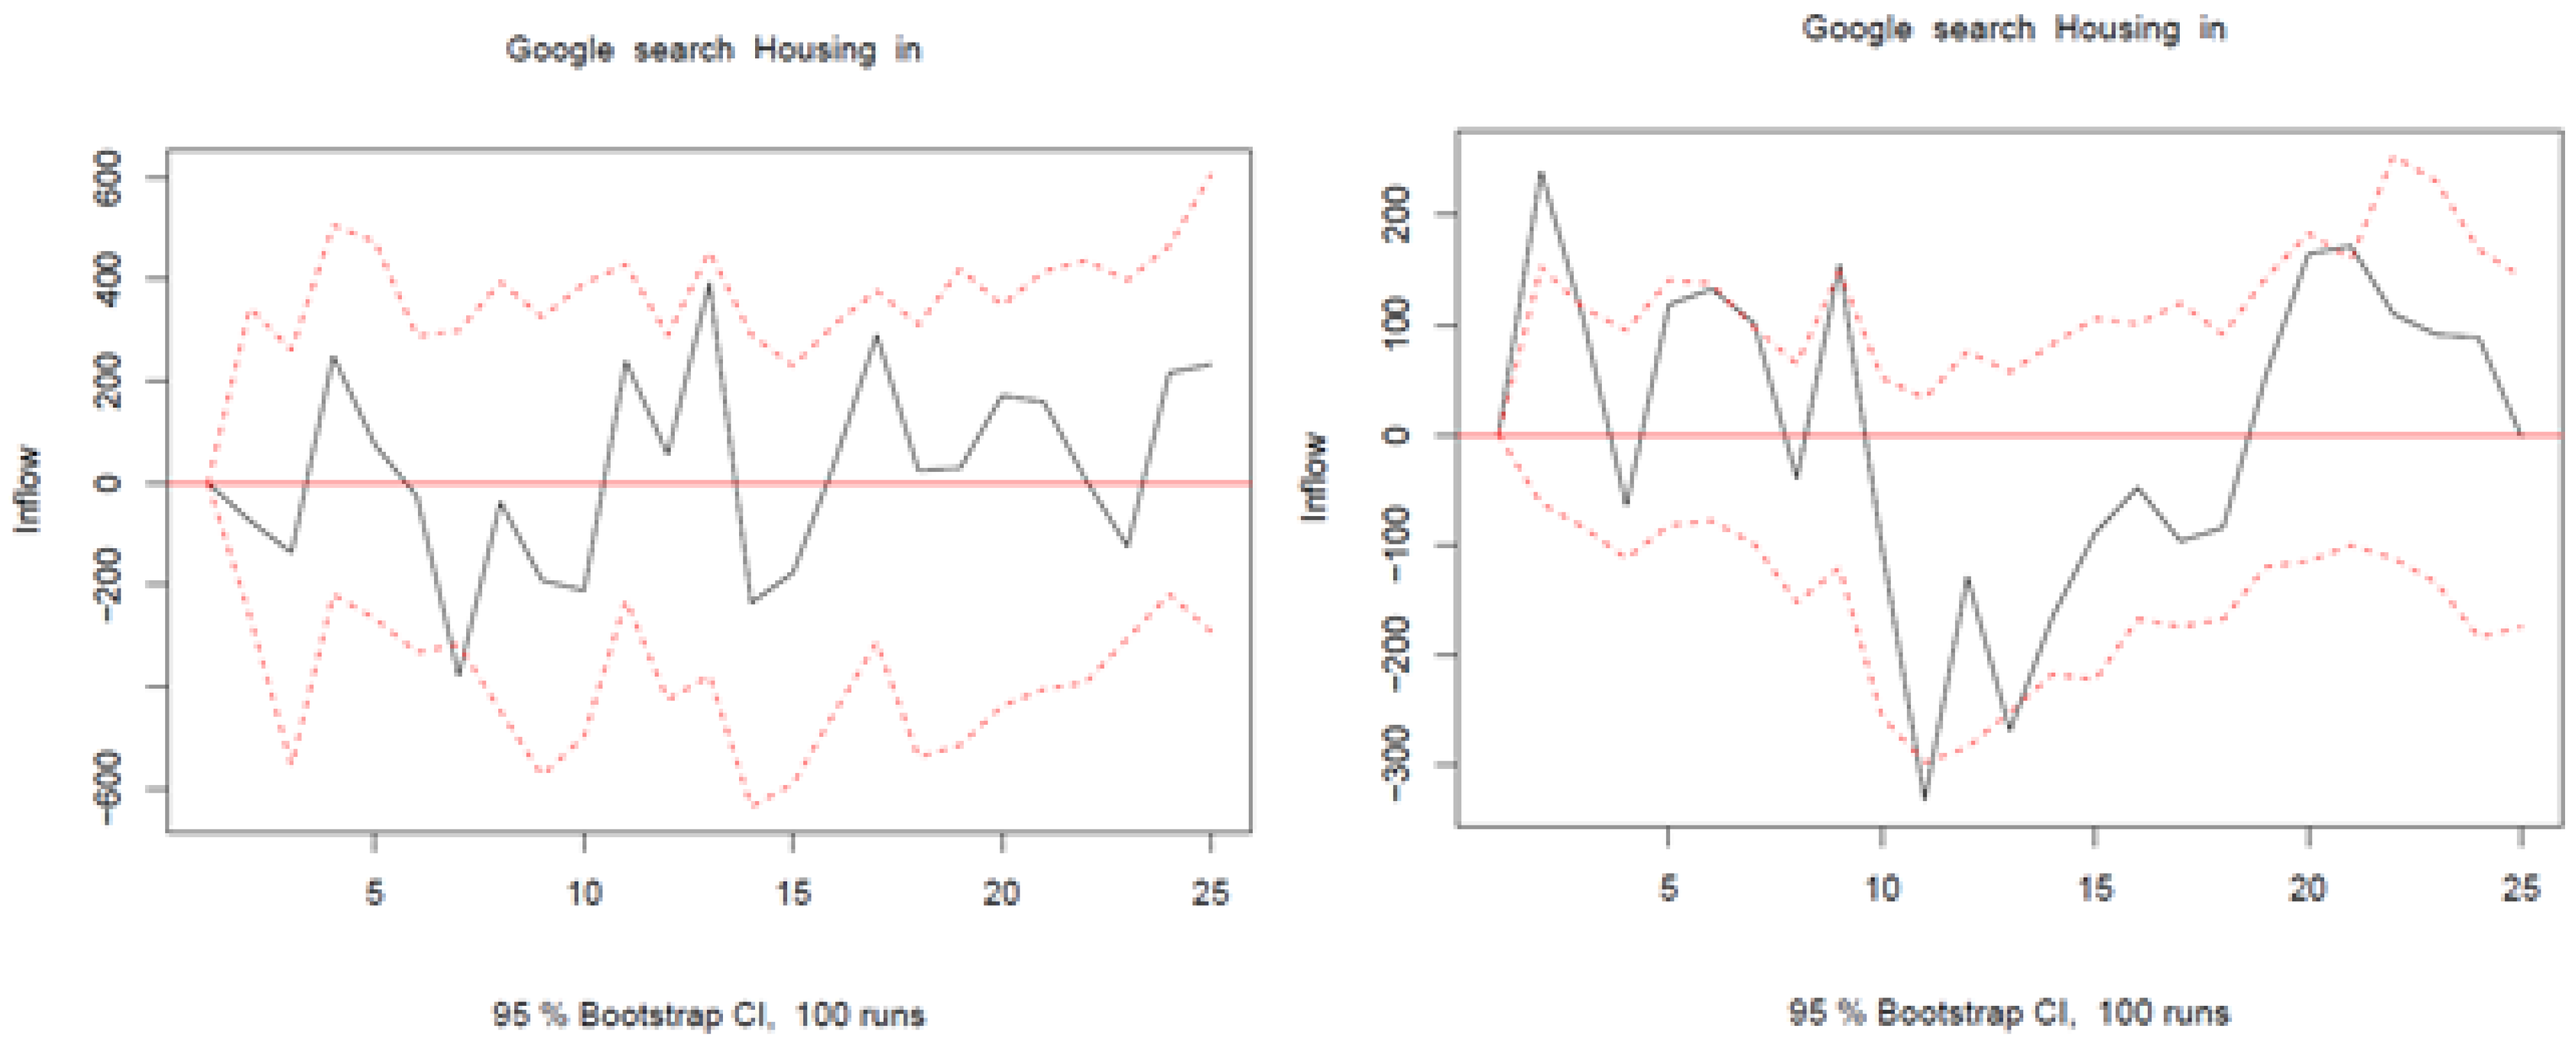
References
- Jun, S.-P.; Yoo, H.S.; Choi, S. Ten years of research change using Google Trends: From the perspective of big data utilizations and applications. Technol. Forecast. Soc. Chang. 2018, 130, 69–87. [Google Scholar] [CrossRef]
- Böhme, M.H.; Gröger, A.; Stöhr, T. Searching for a better life: Predicting international migration with online search keywords. J. Dev. Econ. 2019, 142, 102347. [Google Scholar] [CrossRef]
- Choi, H.; Varian, H. Predicting the Present with Google Trends. Econ. Rec. 2012, 88, 2–9. [Google Scholar] [CrossRef]
- Fantazzini, D.; Fomichev, N. Forecasting the real price of oil using online search data. Int. J. Comput. Econ. Econom. 2014, 4, 4–31. [Google Scholar] [CrossRef]
- D’Amuri, F.; Marcucci, J. The predictive power of Google searches in forecasting US unemployment. Int. J. Forecast. 2017, 33, 801–816. [Google Scholar] [CrossRef]
- Bulut, L. Google Trends and the forecasting performance of exchange rate models. Journal of Forecasting. 2018, 37, 303–315. [Google Scholar] [CrossRef]
- Yu, L.; Zhao, Y.; Tang, L.; Yang, Z. Online big data-driven oil consumption forecasting with Google trends. Int. J. Forecast. 2019, 35, 213–223. [Google Scholar] [CrossRef]
- Borup, D.; Schütte, E.C.M. In Search of a Job: Forecasting Employment Growth Using Google Trends. J. Bus. Econ. Stat. 2020, 1–15. [Google Scholar] [CrossRef]
- Nikolopoulos, K.; Tsinopoulos, C.; Vasilakis, C. Operational research in the time of COVID-19: The ‘science for better’or worse in the absence of hard data. J. Oper. Res. Soc. 2021, 290, 99–115. [Google Scholar] [CrossRef] [PubMed]
- Nikolopoulos, K.; Punia, S.; Schäfers, A.; Tsinopoulos, C.; Vasilakis, C. Forecasting and planning during a pandemic: COVID-19 growth rates, supply chain disruptions, and governmental decisions. Eur. J. Oper. Res. 2020, 290, 99–115. [Google Scholar] [CrossRef]
- Sîrbu, A.; Andrienko, G.; Andrienko, N.; Boldrini, C.; Conti, M.; Giannotti, F.; Sharma, R. Human migration: The big data perspective. Int. J. Data Sci. Anal. 2021, 11, 341–360. [Google Scholar] [CrossRef]
- Ravenstein, E.G. The laws of migration. J. Stat. Soc. Lond. 1885, 48, 167–235. [Google Scholar] [CrossRef]
- Wilson, A. Entropy in Urban and Regional Modelling (Routledge Revivals); Routledge: Oxford, UK, 2013. [Google Scholar] [CrossRef]
- Willekens, F. Entropy, multiproportional adjustment and the analysis of contingency tables. Syst. Urbani 1980, 2, 171–201. [Google Scholar]
- Alonso, W. Systemic and Log-Linear Models: From Here to There then to Now and This to That; Discussion Paper 86-10; Center for Population Studies, Harvard University: Cambridge, MA, USA, 1986. [Google Scholar]
- Bijak, J.; Disney, G.; Findlay, A.M.; Forster, J.J.; Smith, P.W.; Wiśniowski, A. Assessing time series models for forecasting international migration: Lessons from the United Kingdom. J. Forecast. 2019, 38, 470–487. [Google Scholar] [CrossRef] [Green Version]
- Mayda, A.M. International migration: A panel data analysis of the determinants of bilateral flows. J. Popul. Econ. 2009, 23, 1249–1274. [Google Scholar] [CrossRef]
- Constant, A.F.; Zimmermann, K.F. Circular and Repeat Migration: Counts of Exits and Years away from the Host Country. Popul. Res. Policy Rev. 2010, 30, 495–515. [Google Scholar] [CrossRef]
- Bijak, J. Forecasting International Migration in Europe: A Bayesian View. JSTOR 2011. [Google Scholar] [CrossRef] [Green Version]
- Ortega, F.; Peri, G. The effect of income and immigration policies on international migration. Migr. Stud. 2013, 1, 47–74. [Google Scholar] [CrossRef] [Green Version]
- Chort, I. Mexican migrants to the US: What do unrealized migration intentions tell us about gender inequalities? World Dev. 2014, 59, 535–552. [Google Scholar] [CrossRef]
- Docquier, F.; Peri, G.; Ruyssen, I. The Cross-country Determinants of Potential and Actual Migration. Int. Migr. Rev. 2014, 48, 37–99. [Google Scholar] [CrossRef] [Green Version]
- Dustmann, C.; Okatenko, A. Out-migration, wealth constraints, and the quality of local amenities. J. Dev. Econ. 2014, 110, 52–63. [Google Scholar] [CrossRef] [Green Version]
- Burkhauser, R.V.; Hahn, M.H.; Hall, M.; Watson, N. Australia Farewell: Predictors of Emigration in the 2000s. Popul. Res. Policy Rev. 2016, 35, 197–215. [Google Scholar] [CrossRef] [Green Version]
- Ette, A.; Heß, B.; Sauer, L. Tackling Germany’s Demographic Skills Shortage: Permanent Settlement Intentions of the Recent Wave of Labour Migrants from Non-European Countries. J. Int. Migr. Integr. 2015, 17, 429–448. [Google Scholar] [CrossRef]
- Kuhlenkasper, T.; Steinhardt, M.F. Who leaves and when? Selective outmigration of immigrants from Germany. Econ. Syst. 2017, 41, 610–621. [Google Scholar] [CrossRef] [Green Version]
- Docquier, F.; Rapoport, H. Globalization, brain drain, and development. J. Econ. Lit. 2012, 50, 681–730. [Google Scholar] [CrossRef] [Green Version]
- Fuchs, J.; Söhnlein, D.; Vanella, P. Migration Forecasting—Significance and Approaches. Encyclopedia 2021, 1, 54. [Google Scholar] [CrossRef]
- Hawelka, B.; Sitko, I.; Beinat, E.; Sobolevsky, S.; Kazakopoulos, P.; Ratti, C. Geo-located Twitter as proxy for global mobility patterns. Cartogr. Geogr. Inf. Sci. 2014, 41, 260–271. [Google Scholar]
- Zagheni, E.; Garimella, V.R.K.; Weber, I.; State, B. Inferring international and internal migration patterns from Twitter data. In Proceedings of the 23rd International Conference on World Wide Web, Seoul, Korea, 7–11 April 2014; pp. 439–444. [Google Scholar] [CrossRef]
- Moise, I.; Gaere, E.; Merz, R.; Koch, S.; Pournaras, E. Tracking language mobility in the Twitter landscape. In Proceedings of the 2016 IEEE 16th International Conference on Data Mining Workshops (ICDMW), Barcelona, Spain, 12–15 December 2016; pp. 663–670. [Google Scholar]
- Kikas, R.; Dumas, M.; Saabas, A. Explaining international migration in the skype network: The role of social network features. In Proceedings of the 1st ACM Workshop on Social Media World Sensors, Guselyurt, Nothern Cyprus, 1 September 2015; pp. 17–22. [Google Scholar]
- Bengtsson, L.; Lu, X.; Thorson, A.; Garfield, R.; Von Schreeb, J. Improved Response to Disasters and Outbreaks by Tracking Population Movements with Mobile Phone Network Data: A Post-Earthquake Geospatial Study in Haiti. PLoS Med. 2011, 8, e1001083. [Google Scholar] [CrossRef]
- Andrienko, Y.; Guriev, S. Determinants of interregional mobility in Russia. Econ. Transit. 2004, 12, 1–27. [Google Scholar] [CrossRef]
- Vakulenko, E.; Mkrtchyan, N.; Furmanov, K. Modeling registered migration flows between regions of the Russian Federation. Appl. Econom. 2011, 21, 35–55. [Google Scholar]
- Korovkin, A.; Dolgova, I.; Edinak, E. Analysis of the relationship between internal migration and socio-economic differentiation of regions (on the example of the central Federal District). In Scientific Works; Institute for Economic Forecasting, Russian Academy of Sciences: Moscow, Russia, 2013; pp. 71–94. [Google Scholar]
- Pavlovskij, E. Arima Models in the Short-Term Forecasting of Internal Migration in Russia. Voprosy Statistiki 2017, 1, 53–63. [Google Scholar]
- United Nations. International Migration Report 2017; United Nations Population Division: New York, NY, USA, 2017. [Google Scholar]
- Heleniak, T. Migration of the Russian Diaspora after the Breakup of the Soviet Union. J. Int. Aff. 2009, 57, 99–117. [Google Scholar]
- Chudinovskikh, O.; Denisenko, M. Russia: A Migration System with Soviet Roots; Migration Policy Institute: Washington, DC, USA, 2017; Available online: https://www.migrationpolicy.org/print/15920 (accessed on 1 October 2021).
- Gerber, T.P.; Zavisca, J. Experiences in Russia of Kyrgyz and Ukrainian labor migrants: Ethnic hierarchies, geopolitical remittances, and the relevance of migration theory. Post-Soviet Aff. 2019, 36, 61–82. [Google Scholar] [CrossRef]
- Ryazantsev, S. Labour Migration from Central Asia to Russia in the Context of the Economic Crisis. Russia in Global Affairs, 31 August 2016. Available online: http://eng.globalaffairs.ru/valday/Labour-Migration-from-Central-Asia-to-Russia-in-the-Context-of-the-Economic-Crisis-18334 (accessed on 1 October 2021).
- Schenk, C. Why Control Immigration? Strategic Uses of Migration Management in Russia; University of Toronto Press: Toronto, ON, Canada, 2018. [Google Scholar]
- Human Rights Watch. Are You Happy to Cheat Us? Exploitation of Migrant Construction Workers in Russia. 2009. Available online: https://www.hrw.org/report/2009/02/10/are-you-happy-cheat-us/exploitation-migrant-construction-workers-russia (accessed on 1 October 2021).
- Reeves, M. Clean fake: Authenticating documents and persons in migrant Moscow. Am. Ethnol. 2013, 40, 508–524. [Google Scholar] [CrossRef]
- Reeves, M. Living from the Nerves: Deportability, Indeterminacy, and the ‘feel of Law’ in Migrant Moscow. Soc. Anal. 2015, 59, 119–136. [Google Scholar] [CrossRef]
- Demintseva, E.; Peshkova, V. Migranty iz Srednei Azii v Moskve. Demoscope Wkly. 2014, 597–598. Available online: http://www.demoscope.ru/weekly/2014/0597/tema01.php (accessed on 1 October 2021).
- Demintseva, E.; Kashnitsky, D. Contextualizing Migrants’ Strategies of Seeking Medical Care in Russia. Int. Migr. 2016, 54, 29–42. [Google Scholar] [CrossRef]
- Demintseva, E. Labour migrants in post-Soviet Moscow: Patterns of settlement. J. Ethn. Migr. Stud. 2017, 43, 2556–2572. [Google Scholar] [CrossRef]
- Bedrina, E.; Tukhtarova, Y.; Neklyudova, N. Migration from Uzbekistan to Russia: Push-Pull Factor Analysis. In Proceedings of the International Science and Technology Conference “FarEastСon”, Vladivostok, Russia, 2–4 October 2018; Springer: Cham, Switzerland, 2018; pp. 283–296. [Google Scholar]
- Timoshkin, D. Construction of Horizontal Networks on “Migrant” Russian-Language Digital Platforms. J. Sib. Fed. Univ. Humanit. Soc. Sci. 2020, 13, 688–699. [Google Scholar] [CrossRef]
- Abashin, S. Migration from Central Asia to Russia in the New Model of World Order. Russ. Polit. Law 2014, 52, 8–23. [Google Scholar] [CrossRef]
- Chudinovskikh, O.; Mikhail, D. Labour Migration on the Post-Soviet Territory. In Migration from the Newly Independent States; Societies and Political Orders in Transition; Springer: Berlin/Heidelberg, Germany, 2020; pp. 55–80. [Google Scholar]
- Denisenko, M.; Mkrtchyan, N.; Chudinovskikh, O. Permanent Migration in the Post-Soviet Countries. In Migration from the Newly Independent States; Societies and Political Orders in Transition; Springer: Berlin/Heidelberg, Germany, 2020; pp. 23–53. [Google Scholar]
- Ettredge, M.; Gerdes, J.; Karuga, G. Using web-based search data to predict macroeconomic statistics. Commun. ACM 2005, 48, 87–92. [Google Scholar] [CrossRef]
- Artola, C.; Martínez-Galán, E. Tracking the future on the web: Construction of leading indicators using internet searches. SSRN 2012. [Google Scholar] [CrossRef]
- McLaren, N.; Shanbhogue, R. Using internet search data as economic indicators. Bank Engl. Q. Bull. 2011, 2011, Q2. [Google Scholar] [CrossRef] [Green Version]
- Billari, F.; D’Amuri, F.; Marcucci, J. Forecasting births using Google. In Proceedings of the CARMA 2016: 1st International Conference on Advanced Research Methods in Analytics, Valencia, Spain, 6–7 July 2016. [Google Scholar]
- Tamgno, J.K.; Faye, R.M.; Lishou, C. Verbal autopsies, mobile data collection for monitoring and warning causes of deaths. In Proceedings of the 2013—15th International Conference on Advanced Communications Technology (ICACT), Pyeongchang, Korea, 27–30 January 2013; pp. 495–501. [Google Scholar]
- Qin, Y.; Zhu, H. Run away? Air pollution and emigration interests in China. J. Popul. Econ. 2017, 31, 235–266. [Google Scholar] [CrossRef]
- Keilman, N.; Pham, D.Q.; Hetland, A. Norway’s Uncertain Demographic Future; Statistics Norway Social and Economic Studies No. 105; Statistics Norway: Oslo, Norway, 2001. [Google Scholar]
- Hamilton, J.D. Time Series Analysis; Princeton University Press: Princeton, NJ, USA, 1 September 2020. [Google Scholar]
- Gospodinov, N.; Herrera, A.M.; Pesavento, E. Unit roots, cointegration, and pretesting in VAR models. Adv. Econom. 2013, 32, 81–115. [Google Scholar]
- Elliott, G. On the Robustness of Cointegration Methods When Regressors Almost Have Unit Roots. Econometrica 1998, 66, 149. [Google Scholar] [CrossRef]
- Inoue, A.; Kilian, L. The uniform validity of impulse response inference in autoregressions. J. Econ. 2019, 215, 450–472. [Google Scholar] [CrossRef] [Green Version]
- Altissimo, F.; Cristadoro, R.; Forni, M.; Lippi, M.; Veronese, G. New Eurocoin: Tracking Economic Growth in Real Time. Rev. Econ. Stat. 2010, 92, 1024–1034. [Google Scholar] [CrossRef]
- Aruoba, S.B.; Diebold, F.X.; Scotti, C. Real-Time Measurement of Business Conditions. J. Bus. Econ. Stat. 2009, 27, 417–427. [Google Scholar] [CrossRef] [Green Version]
- Aprigliano, V.; Foroni, C.; Marcellino, M.; Mazzi, G.; Venditti, F. A daily indicator of economic growth for the euro area. Int. J. Comput. Econ. Econom. 2017, 7, 43–63. [Google Scholar] [CrossRef]
- Algan, Y.; Murtin, F.; Beasley, E.; Higa, K.; Senik, C. Well-being through the lens of the internet. PLoS ONE 2019, 14, e0209562. [Google Scholar] [CrossRef] [Green Version]
- Hyndman, R.; Khandakar, Y. Automatic Time Series Forecasting: The forecast Package for R. J. Stat. Softw. 2008, 27, 1–22. [Google Scholar] [CrossRef] [Green Version]
- Friedman, M. The Use of Ranks to Avoid the Assumption of Normality Implicit in the Analysis of Variance. J. Am. Stat. Assoc. 1937, 32, 675–701. [Google Scholar] [CrossRef]
- Kruskal, W.H.; Wallis, W.A. Use of Ranks in One-Criterion Variance Analysis. J. Am. Stat. Assoc. 1952, 47, 583. [Google Scholar] [CrossRef]
- Maravall, A. Seasonality Tests and Automatic Model Identification in TRAMO-SEATS; Bank of Spain: Madrid, Spain, 2011. [Google Scholar]
- Welch, B.L. On the Comparison of Several Mean Values: An Alternative Approach. Biometrika 1951, 38, 330–336. [Google Scholar] [CrossRef]
- Ollech, D.; Webel, K. A Random Forest-Based Approach to Identifying the Most Informative Seasonality Tests; Bundesbank Discussion Paper No. 55/2020; Bundesbank: Frankfurt am Main, Germany, 2020. [Google Scholar]
- Sugiura, N. Further analysts of the data by akaike’s information criterion and the finite corrections: Further analysts of the data by akaike’s. Commun. Stat.-Theory Methods 1978, 7, 13–26. [Google Scholar] [CrossRef]
- Hurvich, C.M.; Tsai, C.L. Regression and time series model selection in small samples. Biometrika 1989, 76, 297–307. [Google Scholar] [CrossRef]
- Johansen, S. Likelihood-Based Inference in Cointegrated Vector Autoregressive Models; Oxford University Press on Demand: Oxford, UK, 1995. [Google Scholar] [CrossRef]
- Johansen, S. Cointegration: A survey. In Palgrave Handbook of Econometrics: Volume 1, Econometric Theory; Mills, T.C., Patterson, K., Eds.; Palgrave MacMillan: Basingstoke, UK, 2006; pp. 540–577. [Google Scholar]
- Lütkepohl, H. New Introduction to Multiple Time Series Analysis; Springer: Berlin/Heidelberg, Germany, 2005. [Google Scholar] [CrossRef]
- Efimova, E.; Mikhaltsov, S. Road Traffic as a Factor of Regional Development: Case of Saint Petersburg Region, Russian Federation. Procedia Eng. 2017, 187, 135–142. [Google Scholar] [CrossRef]
- Varaksin, S.; Varaksina, N.Y. Application of fuzzy linear regression for modeling the migration process in Russia. In Economic and Social Development: Book of Proceedings; Varazdin Development and Entrepreneurship Agency (VADEA): Varazdin, Croatia, 2017; pp. 332–340. [Google Scholar]
- Demidova, A.V.; Druzhinina, O.V.; Masina, O.N.; Petrov, A.A. Computer research of the controlled models with migration flows. In Proceedings of the 10th International Conference in Information and Telecommunication Technologies and Mathematical Modeling of High-Tech Systems (ITTMM-2020), Moscow, Russia, 13–17 April 2020; Volume 2639, pp. 117–129. [Google Scholar]
- Vakulenko, E.; Mkrtchyan, N. Factors of Interregional Migration in Russia Disaggregated by Age. Appl. Spat. Anal. Policy 2019, 13, 609–630. [Google Scholar] [CrossRef]
- Hyndman, R.J.; Athanasopoulos, G. Forecasting: Principles and Practice; OTexts: Melbourne, Australia, 2018. [Google Scholar]
- Stock, J.H.; Watson, M.W. A Simple Estimator of Cointegrating Vectors in Higher Order Integrated Systems. Econometrica 1993, 61, 783. [Google Scholar] [CrossRef]
- Maddala, G.S.; Kim, I.M. Unit Roots, Cointegration, and Structural Change; Cambridge University Press: Cambridge, UK, 1998. [Google Scholar]
- Hayashi, F. Econometrics; Princeton University Press: Princeton, NJ, USA, 2000. [Google Scholar]
- Fantazzini, D.; Toktamysova, Z. Forecasting German car sales using Google data and multivariate models. Int. J. Prod. Econ. 2015, 170, 97–135. [Google Scholar] [CrossRef] [Green Version]
- Aaronson, D.; Brave, S.A.; Butters, R.A.; Fogarty, M.; Sacks, D.W.; Seo, B. Forecasting unem-ployment insurance claims in realtime with Google Trends. Int. J. Forecast. 2021, in press. [Google Scholar] [CrossRef]
- Ahrens, A.; Bhattacharjee, A. Two-Step Lasso Estimation of the Spatial Weights Matrix. Econometrics 2015, 3, 128–155. [Google Scholar] [CrossRef] [Green Version]
- Lam, C.; Souza, P.C. Estimation and Selection of Spatial Weight Matrix in a Spatial Lag Model. J. Bus. Econ. Stat. 2019, 38, 693–710. [Google Scholar] [CrossRef]
- Iacus, S.M.; Porro, G.; Salini, S.; Siletti, E. Controlling for Selection Bias in Social Media Indicators through Official Statistics: A Proposal. J. Off. Stat. 2020, 36, 315–338. [Google Scholar] [CrossRef]
- Iacus, S.; Porro, G. Subjective Well-Being and Social Media; CRC Press: Boca Raton, FL, USA, 2021. [Google Scholar] [CrossRef]
- Casas, I.; Fernandez-Casal, R. tvreg: Time-Varying Coefficients Linear Regression for Single and Multiple Equations [Computer Software Manual]. (R Package Version 0.5.4) 2018. Available online: https://CRAN.R-project.org/package=tvReg (accessed on 1 October 2021).
- Casas, I.; Ferreira, E.; Orbe, S. Time-Varying Coefficient Estimation in SURE Models. Application to Portfolio Management. J. Financial Econ. 2019, 19, 707–745. [Google Scholar] [CrossRef] [Green Version]
- Kuan, C.-M.; Hornik, K. The generalized fluctuation test: A unifying view. Econ. Rev. 1995, 14, 135–161. [Google Scholar] [CrossRef]
- Zeileis, A.; Leisch, F.; Kleiber, C.; Hornik, K. Monitoring structural change in dynamic econometric models. J. Appl. Econ. 2005, 20, 99–121. [Google Scholar] [CrossRef] [Green Version]
- Zeileis, A. Implementing a class of structural change tests: An econometric computing approach. Comput. Stat. Data Anal. 2006, 50, 2987–3008. [Google Scholar] [CrossRef] [Green Version]
- Hoerl, A.E.; Kennard, R.W. Ridge Regression: Biased Estimation for Nonorthogonal Problems. Technometrics 1970, 12, 55–67. [Google Scholar] [CrossRef]
- Dahlhaus, R. Fitting time series models to nonstationary processes. Ann. Stat. 1997, 25, 1–37. [Google Scholar] [CrossRef]
- Golub, G.H.; Heath, M.; Wahba, G. Generalized Cross-Validation as a Method for Choosing a Good Ridge Parameter. Technometrics 1979, 21, 215. [Google Scholar] [CrossRef]
- Opgen-Rhein, R.; Strimmer, K. Learning causal networks from systems biology time course data: An effective model selection procedure for the vector autoregressive process. BMC Bioinform. 2007, 8, S3. [Google Scholar] [CrossRef] [PubMed] [Green Version]
- Sun, D.; Ni, S. Bayesian analysis of vector-autoregressive models with noninformative priors. J. Stat. Plan. Inference 2004, 121, 291–309. [Google Scholar] [CrossRef]
- Ni, S.; Sun, D. Bayesian Estimates for Vector Autoregressive Models. J. Bus. Econ. Stat. 2005, 23, 105–117. [Google Scholar] [CrossRef]
- Lee, N.; Choi, H.; Kim, S.-H. Bayes shrinkage estimation for high-dimensional VAR models with scale mixture of normal distributions for noise. Comput. Stat. Data Anal. 2016, 101, 250–276. [Google Scholar] [CrossRef]
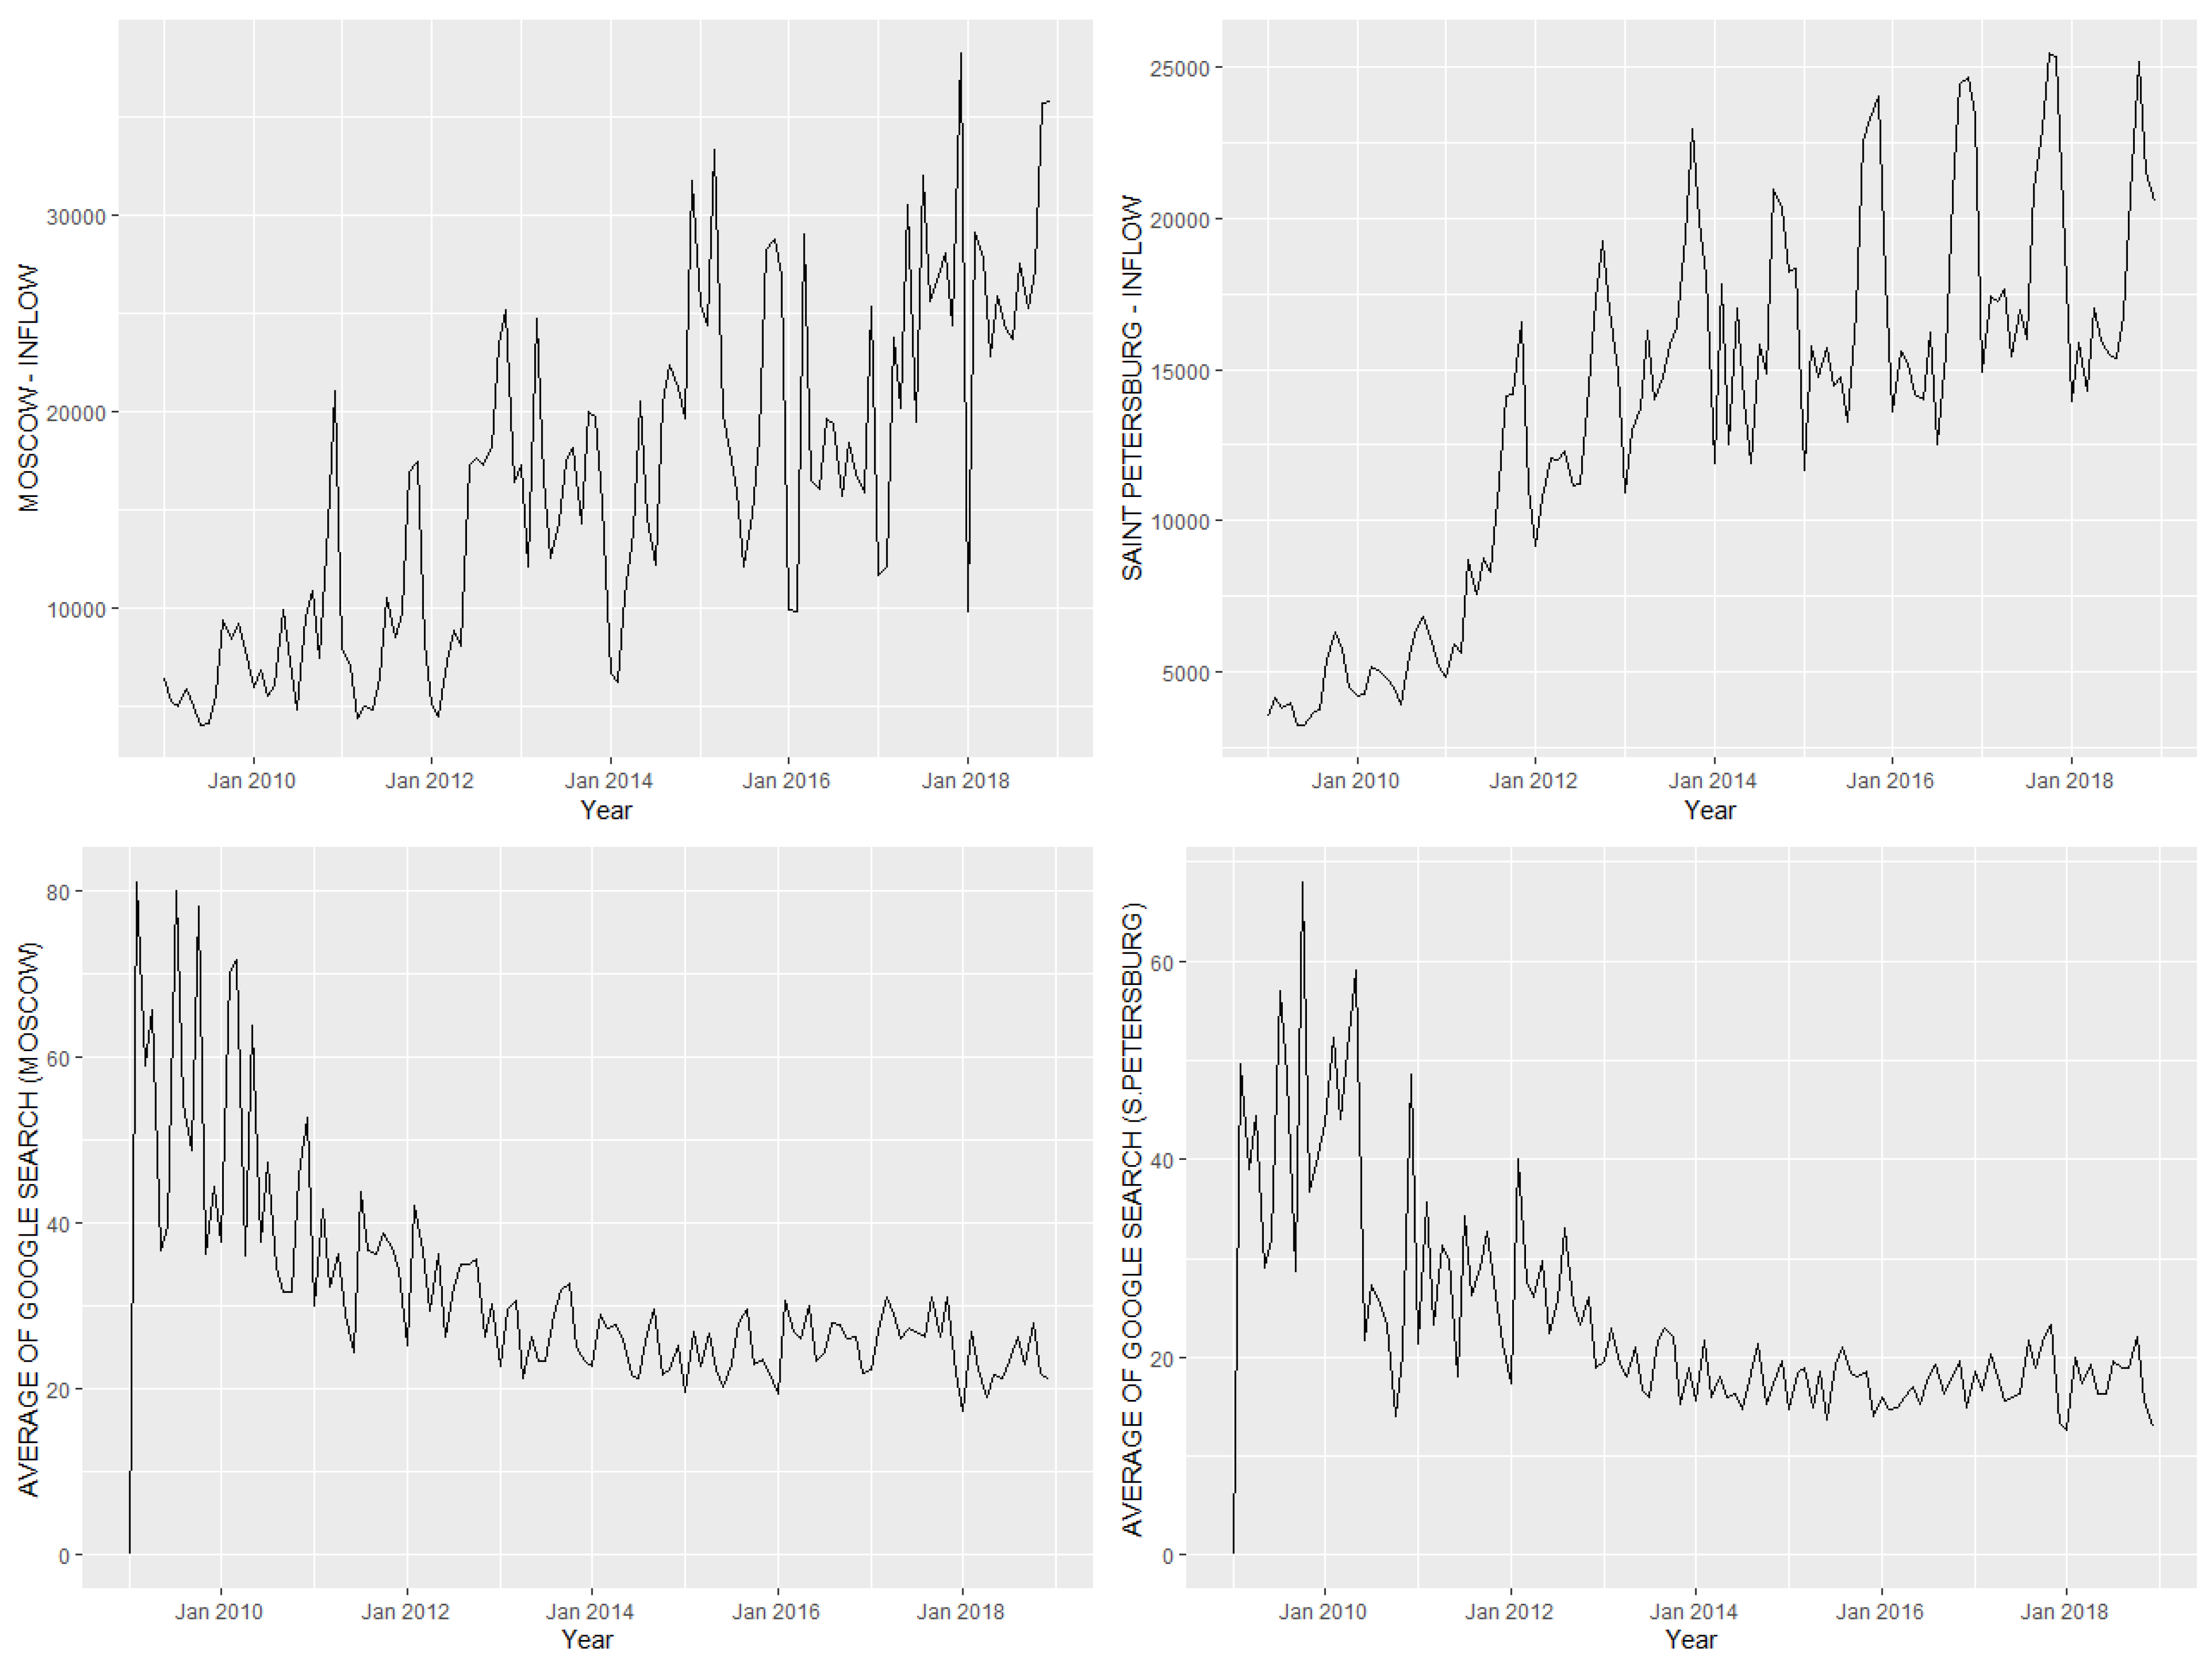


| Moscow | ||||||||
| Variable | Mean | Min | Q1 | Median | Q3 | Max | st.Dev | Source (Accessed on 1 October 2021) |
| Migration Inflow | 16,252 | 4024 | 8455 | 16,248 | 22,962 | 38,217 | 8534 | https://rosstat.gov.ru/folder/12781 |
| Number of employed | 6612 | 5800 | 6064 | 6853 | 7047 | 7224 | 502 | https://rosstat.gov.ru/labour_force |
| Nominal wage (per capita) | 60,666 | 29,797 | 42,719 | 59,833 | 69,791 | 361,938 | 32,509 | https://rosstat.gov.ru/labour_costs |
| GDP (Russia) | 44,167 | 8483 | 23,685 | 41,540 | 62,357 | 103627 | 23,783 | https://rosstat.gov.ru/compendium/document/50801 |
| Employers’ need | 156,347 | 97,163 | 134,390 | 153,704 | 169,585 | 272,824 | 33,380 | https://rosstat.gov.ru/labour_force |
| Residential construction v. | 242 | 1 | 95 | 171 | 294 | 1104 | 236 | https://rosstat.gov.ru/folder/13706 |
| Saint Petersburg | ||||||||
| variable | mean | min | Q1 | median | Q3 | max | st.dev | Source (Accessed on 1 October 2021) |
| Migration Inflow | 13,655 | 3225 | 8735 | 14,607 | 17,291 | 25,458 | 6061 | https://rosstat.gov.ru/folder/12781 |
| Number of employed | 2800 | 2537 | 2630 | 2839 | 2967 | 3027 | 161 | https://rosstat.gov.ru/labour_force |
| Nominal wage (per capita) | 39,923 | 21,998 | 29,623 | 38,873 | 48,426 | 72,342 | 11,698 | https://rosstat.gov.ru/labour_costs |
| GDP (Russia) | 44,167 | 8483 | 23,685 | 41,540 | 62,357 | 103,627 | 23,783 | https://rosstat.gov.ru/compendium/document/50801 |
| Employers’ need | 59,404 | 35,023 | 45,548 | 57,363 | 66,519 | 113,880 | 16,912 | https://rosstat.gov.ru/labour_force |
| Residential construction v. | 248 | 21 | 97 | 160 | 250 | 2200 | 285 | https://rosstat.gov.ru/folder/13706 |
| 2018 Total Inflow (in Thousands) | Share of Total Inflow | |
|---|---|---|
| Total migration within Russia | 4345.881 | 100% |
| Moscow Oblast | 343.373 | 7.9% |
| Moscow | 314.868 | 7.2% |
| Saint Petersburg | 213.83 | 4.9% |
| Krasnodar Krai | 178.326 | 4.1% |
| Tyumen Oblast | 153.596 | 3.5% |
| Republic of Bashkortostan | 135.867 | 3.1% |
| Krasnoyarsk Krai | 113.808 | 2.6% |
| Sverdlovsk Oblast | 113.222 | 2.6% |
| Leningrad Oblast | 110.254 | 2.5% |
| Rostov Oblast | 100.112 | 2.3% |
| Other regions and cities | 2568.625 | 59.1% |
| Seasonality Test | p-Values-Moscow | p-Values-Saint Petersburg | ||
|---|---|---|---|---|
| Levels | Log-Levels | Levels | Log-Levels | |
| F-test on seasonal dummies | 0.00 | 0.00 | 0.00 | 0.00 |
| Friedman test | 0.00 | 0.00 | 0.00 | 0.00 |
| Kruskal–Wallis test | 0.07 | 0.07 | 0.00 | 0.00 |
| QS test | 0.00 | 0.00 | 0.00 | 0.00 |
| Welch test | 0.08 | 0.04 | 0.05 | 0.25 |
| Ollech–Webel ML test | Seasonal | Seasonal | Seasonal | Seasonal |
| Information | Moscow | |||
| Criteria | Data in Levels | Data in Log-Levels | ||
| Best seasonal SARIMA | Best non-seasonal ARIMA | Best seasonal SARIMA | Best non-seasonal ARIMA | |
| ARIMA (0,1,1) (1,0,3) [12] | ARIMA (1,1,1) | ARIMA (1,1,1) (2,0,0) [12] | ARIMA (0,1,2) | |
| AICC | 2390 | 2399 | 83 | 92 |
| BIC | 2406 | 2408 | 97 | 103 |
| Best seasonal ARIMA-X | Best non-seasonal ARIMA-X | Best seasonal ARIMA-X | Best non-seasonal ARIMA-X | |
| ARIMA (0,1,1) (1,0,2) [12] | ARIMA (1,1,1) | ARIMA (1,1,1) (0,0,2) [12] | ARIMA (0,1,2) | |
| AICC | 2390 | 2401 | 89 | 95 |
| BIC | 2406 | 2412 | 105 | 108 |
| Information | Saint Petersburg | |||
| criteria | Data in Levels | Data in Log-Levels | ||
| Best seasonal SARIMA | Best non-seasonal ARIMA | Best seasonal SARIMA | Best non-seasonal ARIMA | |
| ARIMA (2,1,0) (0,1,1) [12] | ARIMA(0,1,0) | ARIMA(0,1,2)(0,1,1) [12] | ARIMA(0,1,0) | |
| AICC | 1910 | 2222 | −156 | −60 |
| BIC | 1920 | 2225 | −146 | −57 |
| Best seasonal ARIMA-X | Best non-seasonal ARIMA-X | Best seasonal ARIMA-X | Best non-seasonal ARIMA-X | |
| ARIMA (2,0,0) (0,1,1) [12] | ARIMA (0,1,0) | ARIMA (0,1,2) (0,1,1) [12] | ARIMA (1,1,1) | |
| AICC | 1929 | 2223 | −154 | −65 |
| BIC | 1944 | 2228 | −141 | −51 |
| Moscow | Saint Petersburg | |||||
|---|---|---|---|---|---|---|
| MSE | MAE | MAPE (%) | MSE | MAE | MAPE (%) | |
| ARIMA | 6.51 × 10⁹ | 5.79 × 10⁵ | 29.82 | 9.93 × 10⁸ | 2.59 × 10⁵ | 14.89 |
| SARIMA | 6.05 × 10⁹ | 5.50 × 10⁵ | 28.27 | 4.01 × 10⁸ | 1.69 × 10⁵ | 9.24 |
| ARIMAX (Google: Average) | 6.44 × 10⁹ | 5.65 × 10⁵ | 29.22 | 8.94 × 10⁸ | 2.40 × 10⁵ | 13.65 |
| SARIMAX (Google: Average) | 5.75 × 10⁹ | 5.14 × 10⁵ | 26.58 | 4.51 × 10⁸ | 1.76 × 10⁵ | 9.82 |
| ARIMAX1 (Google: Moving) | 6.49 × 10⁹ | 5.63 × 10⁵ | 29.11 | 9.82 × 10⁸ | 2.59 × 10⁵ | 14.95 |
| SARIMAX1 (Google: Moving) | 5.37 × 10⁹ | 5.13 × 10⁵ | 26.17 | 3.93 × 10⁸ | 1.67 × 10⁵ | 9.14 |
| ARIMAX2 (Google: Work) | 6.47 × 10⁹ | 5.69 × 10⁵ | 29.34 | 9.92 × 10⁸ | 2.65 × 10⁵ | 15.17 |
| SARIMAX2 (Google: Work) | 5.76 × 10⁹ | 5.31 × 10⁵ | 27.04 | 4.06 × 10⁸ | 1.71 × 10⁵ | 9.61 |
| ARIMAX3 (Google: Housing) | 6.51 × 10⁹ | 5.66 × 10⁵ | 29.54 | 1.04 × 10⁹ | 2.69 × 10⁵ | 15.58 |
| SARIMAX3 (Google: Housing) | 5.97 × 10⁹ | 5.33 × 10⁵ | 27.40 | 3.93 × 10⁸ | 1.67 × 10⁵ | 9.12 |
| ARIMA.LOG | 7.63 × 10⁹ | 6.16 × 10⁵ | 32.42 | 1.01 × 10⁹ | 2.45 × 10⁵ | 13.93 |
| SARIMA.LOG | 6.57 × 10⁹ | 5.74 × 10⁵ | 29.01 | 3.52 × 10⁸ | 1.56 × 10⁵ | 8.46 |
| ARIMAX.LOG (Google: Average) | 7.64 × 10⁹ | 6.17 × 10⁵ | 32.48 | 9.72 × 10⁸ | 2.45 × 10⁵ | 14.20 |
| SARIMAX.LOG (Google: Average) | 6.88 × 10⁹ | 5.84 × 10⁵ | 29.24 | 3.84 × 10⁸ | 1.63 × 10⁵ | 8.74 |
| ARIMAX.LOG1 (Google: Moving) | 8.63 × 10⁹ | 6.46 × 10⁵ | 34.34 | 1.06 × 10⁹ | 2.46 × 10⁵ | 14.11 |
| SARIMAX.LOG1 (Google: Moving) | 6.26 × 10⁹ | 5.83 × 10⁵ | 28.12 | 3.96 × 10⁸ | 1.70 × 10⁵ | 9.22 |
| ARIMAX.LOG2 (Google: Work) | 7.53 × 10⁹ | 6.13 × 10⁵ | 32.40 | 9.54 × 10⁸ | 2.46 × 10⁵ | 14.51 |
| SARIMAX.LOG2 (Google: Work) | 6.85 × 10⁹ | 5.85 × 10⁵ | 29.37 | 4.10 × 10⁸ | 1.67 × 10⁵ | 9.04 |
| ARIMAX.LOG3 (Google: Housing) | 7.55 × 10⁹ | 6.14 × 10⁵ | 32.48 | 9.87 × 10⁸ | 2.44 × 10⁵ | 13.91 |
| SARIMAX.LOG3 (Google: Housing) | 6.91 × 10⁹ | 5.87 × 10⁵ | 29.40 | 4.66 × 10⁸ | 1.87 × 10⁵ | 10.08 |
| Moscow | Saint Petersburg | |||||
|---|---|---|---|---|---|---|
| MSE | MAE | MAPE (%) | MSE | MAE | MAPE (%) | |
| SARIMA | 7.54 × 10⁷ | 7.21 × 10³ | 24.83 | 1.02 × 10⁷ | 2.70 × 10³ | 14.23 |
| SARIMA.log | 9.68 × 10⁷ | 7.84 × 10³ | 27.07 | 2.63 × 10⁷ | 3.89 × 10³ | 20.45 |
| VAR (NO Google) | 4.27 × 10⁷ | 5.70 × 10³ | 22.46 | 1.72 × 10⁷ | 3.27 × 10³ | 18.78 |
| VAR.log (NO Google) | 3.30 × 10⁷ | 4.52 × 10³ | 18.11 | 2.20 × 10⁷ | 3.34 × 10³ | 19.22 |
| VAR.diff (NO Google) | 7.44 × 10⁷ | 7.08 × 10³ | 26.32 | 1.09 × 10⁷ | 2.77 × 10³ | 14.81 |
| VAR.dlog (NO Google) | 9.89 × 10⁷ | 8.23 × 10³ | 28.73 | 3.89 × 10⁶ | 1.64 × 10³ | 8.62 |
| VAR (All 3 Google queries) | 5.23 × 10⁷ | 6.27 × 10³ | 23.81 | 8.24 × 10⁶ | 2.41 × 10³ | 13.55 |
| VAR.log (All 3 Google queries) | 4.90 × 10⁷ | 5.38 × 10³ | 19.72 | 6.59 × 10⁶ | 2.12 × 10³ | 11.54 |
| VAR.diff (All 3 Google queries) | 7.52 × 10⁷ | 6.91 × 10³ | 25.14 | 1.02 × 10⁷ | 2.67 × 10³ | 14.31 |
| VAR.dlog (All 3 Google queries) | 9.89 × 10⁷ | 8.23 × 10³ | 28.73 | 3.89 × 10⁶ | 1.64 × 10³ | 8.62 |
| VAR (Google average) | 4.52 × 10⁷ | 5.91 × 10³ | 23.17 | 1.69 × 10⁷ | 3.26 × 10³ | 18.79 |
| VAR.log (Google average) | 3.33 × 10⁷ | 4.51 × 10³ | 18.09 | 2.22 × 10⁷ | 3.38 × 10³ | 19.49 |
| VAR.diff (Google average) | 7.24 × 10⁷ | 6.95 × 10³ | 26.01 | 1.09 × 10⁷ | 2.77 × 10³ | 14.82 |
| VAR.dlog (Google average) | 9.89 × 10⁷ | 8.23 × 10³ | 28.73 | 3.89 × 10⁶ | 1.64 × 10³ | 8.62 |
| VECM (NO Google) | 6.94 × 10⁷ | 7.00 × 10³ | 27.12 | 1.07 × 10⁷ | 2.74 × 10³ | 14.33 |
| VECM.log (NO Google) | 7.46 × 10⁷ | 6.73 × 10³ | 25.82 | 7.00 × 10⁷ | 7.78 × 10³ | 40.25 |
| VECM (all 3 Google queries) | 5.95 × 10⁷ | 6.25 × 10³ | 24.21 | 1.12 × 10⁷ | 2.80 × 10³ | 14.65 |
| VECM.log (all 3 Google queries) | 5.69 × 10⁷ | 5.99 × 10³ | 21.91 | 8.01 × 10⁷ | 8.25 × 10³ | 42.62 |
| VECM (Google average) | 5.52 × 10⁷ | 5.94 × 10³ | 23.79 | 1.41 × 10⁷ | 3.22 × 10³ | 16.59 |
| VECM.log (Google average) | 5.63 × 10⁷ | 5.90 × 10³ | 23.28 | 6.93 × 10⁷ | 7.73 × 10³ | 40.02 |
Publisher’s Note: MDPI stays neutral with regard to jurisdictional claims in published maps and institutional affiliations. |
© 2021 by the authors. Licensee MDPI, Basel, Switzerland. This article is an open access article distributed under the terms and conditions of the Creative Commons Attribution (CC BY) license (https://creativecommons.org/licenses/by/4.0/).
Share and Cite
Fantazzini, D.; Pushchelenko, J.; Mironenkov, A.; Kurbatskii, A. Forecasting Internal Migration in Russia Using Google Trends: Evidence from Moscow and Saint Petersburg. Forecasting 2021, 3, 774-803. https://doi.org/10.3390/forecast3040048
Fantazzini D, Pushchelenko J, Mironenkov A, Kurbatskii A. Forecasting Internal Migration in Russia Using Google Trends: Evidence from Moscow and Saint Petersburg. Forecasting. 2021; 3(4):774-803. https://doi.org/10.3390/forecast3040048
Chicago/Turabian StyleFantazzini, Dean, Julia Pushchelenko, Alexey Mironenkov, and Alexey Kurbatskii. 2021. "Forecasting Internal Migration in Russia Using Google Trends: Evidence from Moscow and Saint Petersburg" Forecasting 3, no. 4: 774-803. https://doi.org/10.3390/forecast3040048


