
Assessing Goodness of Fit for Verifying Probabilistic Forecasts


1
School of Civil and Environmental Engineering, University of New South Wales, Sydney, NSW 2052, Australia
2
Water Resources Management Research Center, K-Water Institute, Deajeon 34350, Korea
*
Author to whom correspondence should be addressed.
Forecasting 2021, 3(4), 763-773; https://doi.org/10.3390/forecast3040047
Submission received: 29 July 2021
/
Revised: 18 October 2021
/
Accepted: 22 October 2021
/
Published: 27 October 2021
(This article belongs to the Special Issue Innovative Approaches for Environmental and Natural Hazard Forecasting: Proposals from Theory to Practice)
Abstract
:The verification of probabilistic forecasts in hydro-climatology is integral to their development, use, and adoption. We propose here a means of utilizing goodness of fit measures for verifying the reliability of probabilistic forecasts. The difficulty in measuring the goodness of fit for a probabilistic prediction or forecast is that predicted probability distributions for a target variable are not stationary in time, meaning one observation alone exists to quantify goodness of fit for each prediction issued. Therefore, we suggest an additional dissociation that can dissociate target information from the other time variant part—the target to be verified in this study is the alignment of observations to the predicted probability distribution. For this dissociation, the probability integral transformation is used. To measure the goodness of fit for the predicted probability distributions, this study uses the root mean squared deviation metric. If the observations after the dissociation can be assumed to be independent, the mean square deviation metric becomes a chi-square test statistic, which enables statistically testing the hypothesis regarding whether the observations are from the same population as the predicted probability distributions. An illustration of our proposed rationale is provided using the multi-model ensemble prediction for El Niño–Southern Oscillation.
1. Introduction
The use of probabilistic predictions (also referred to as probabilistic forecasts) is increasingly common in weather and climate systems [1,2,3,4,5,6] as well as in the field of hydrology [7]. The uncertainty estimated and expressed in such probabilistic predictions can be used to quantify the risk of potential disasters [3], which is crucial for rational decision-making [8,9]. Consequently, probabilistic forecast verification has become critical for ensuring the acceptability of products to end users [10] and improving prediction accuracy [10,11].
One of the most referenced metrics for probabilistic forecast verification is the Brier Score [12], suggested by Brier [13] for binary (or categorical) events such as rainfall occurrence. This metric was developed under the definition that a perfect probabilistic forecast is that for which the occurrence of an event has probability of 1. The Brier Score summarizes the mean squared difference between the observation probability (either 1 or 0, according to the occurrence of an event) and forecast probabilities.
As a generalization of the Brier Score [14], the Ranked Probability Score [15] measures the difference between observed and forecast probabilities of an event in the same manner as the Brier Score, but it compares the cumulative probability of categorical events using a sequence of such events (e.g., sequential categories of rainfall amount). For a continuous variable, this metric can be extended to the form of an integral, called the Continuous Ranked Probability Score (CRPS) [14,16,17], using the Heaviside function [14] to measure the distance between the observed cumulative distribution and the forecasted probability distribution.
Both the Brier score and the CRPS can be decomposed to assess forecast reliability [14,18], although in different ways. According to Murphy [18], the Brier Score can be decomposed into reliability, resolution, and uncertainty. The decomposed reliability metric is defined as the weighted average of the squared difference between the predicted probabilities and the corresponding conditional frequencies of observed events [19]. The reliability of a prediction increases as the predicted probabilities come closer to the actual frequency of the observations. Hersbach [14] similarly decomposed the CRPS and separated the reliability term, measuring whether the observations are distributed in greater alignment with the predicted probability distributions. These reliability metrics assess the degree to which a suggested probability distribution (the predicted probability distribution) matches observations, which is a measure of goodness of fit. This definition is important in probabilistic prediction verification because it assists developers and decision makers in both improving prediction and realising the reliabilities of the estimated probability and risk, and forms the premise for the metric proposed here.
We aim to use goodness of fit metrics as the basis for verifying the reliability of probabilistic forecasts. However, a traditional goodness of fit metric cannot be directly applied with a time-variant probabilistic forecast. To address this, we propose an additional dissociation step that dissociates the target information (the alignment of observations with the predicted probability distribution) from time-variant predictive uncertainty. The probability integral transformation is considered for the dissociation, as will be explained later in the paper. With the dissociation step based on the transformation, the root mean squared deviation can be utilized as a measure of goodness of fit, enabling a familiar means for assessing probabilistic forecast reliability to users who are familiar with this metric in the context of traditional goodness of fit tests in statistics. This transformation and the resulting goodness of fit metric is explained in Section 2. In Section 3, we extend the proposed methodology, presenting the basis for testing the hypothesis regarding whether observations can be considered to be from the same population as the predicted probability distribution. An example application to illustrate the goodness of fit metric and the associated statistical hypothesis test is provided in Section 4, and the methods and results are discussed in Section 5.
2. Goodness of Fit Metric
The goodness of fit, defining how closely a probability distribution fits observations, is closely related to probabilistic forecast reliability. This can be defined as the similarity between predicted and observed frequencies according to the reliability term of the decomposed Brier Score. However, goodness of fit metrics cannot be directly applied, since observations in the reliability verification are samples of time-variant predictive uncertainty. Each predicted probability distribution has only a single observation to be compared. An additional initial step that can dissociate the reliability information to be verified from the time-variant predictive uncertainty becomes necessary to enable the use of a collection of observations to compare to a predicted probability distribution.
2.1. Dissociation
One possible technique for the dissociation could be to apply a probability integral transformation (PIT) under the assumption that the probability–probability (p-p) relationship between the predictions and observations is time invariant. The time invariant assumption of the p-p relationship is actually necessary for general reliability metrics (e.g. the reliability term of the decomposed Brier Score) that uses observations of a certain period to estimate its frequency in comparison to a predicted probability value. We note that Jolliffe and Stepheson [20] implicitly implied that the PIT can be used for predictions with time-variant predictive uncertainty, and Nipen and Stull [21] applied the PIT for the purpose of calibration of a probabilistic prediction system with time-variant predictive uncertainty. Although Nipen and Stull [21] did not consider the goodness of fit metric and test, which requires an additional independence assumption that can be controversial in cases of probabilistic forecasts, we could see from related studies such as the studies of Anderson [22] and Wilks [23] that the independence assumption and chi-square test may not be fully impractical. The independence assumption and the goodness of fit test will be explained in the next section.
As the previous studies may imply, the dissociation could be carried out via the PIT together with the general assumption of the time-invariance of the p-p relationship to dissociate the target information (the observation alignment to the predicted probability distribution) to be verified from the time-variant predictive uncertainty. After the dissociation, the observations only contain information regarding the time-invariant p-p relationship with the predicted probability distribution and can be used collectively to measure the goodness of fit.
Equation (1) represents the probability integral transformation applied for a random variable having a predicted probability distribution at time . After the PIT, a random variable follows a uniform distribution U [0, 1] for all .
The same transformation can be applied to the observations (Equation (2)) so that the corresponding probabilities after the PIT can be compared with . Equation (2), under the assumption of a time-invariant p-p relationship, is referred to as ‘dissociation’ in this study since the PIT observations after the transformation only contain information regarding the p-p relationship to be verified.
It should be noted that, after the dissociation, while follows the standard uniform distribution, only for perfectly reliable probabilistic predictions can be considered to be from the same uniform distribution. Under the assumption of a time-invariant p-p relationship within a certain period, the distribution for is time-invariant as the standard uniform distribution of the prediction . Although the time-invariant assumption concerning the p-p relationship is the common assumption necessary for all reliability metrics such as the reliability term of the decomposed Brier Score that uses the observations of a certain period to estimate its frequency, special attention must be paid to check if the sets used can satisfy this assumption, in order to improve the verification and its interpretation. More discussions on this assumption are found in Section 3 and Section 4. We denote as the distribution of and as the standard uniform distribution for .
2.2. Goodness of Fit
To measure the goodness of fit, a root mean squared deviation (Equation (3)) is used. This summarizes the deviation in density between the predicted probability distribution () and the distribution () of the observations , which decreases as the two become more similar.
Equivalently, using the notation for the cdf:
where is the number of intervals (categorized by ) the distribution can be discretised into, given , , and . Assuming equally distanced intervals, the increment in the cumulative probability distribution can be denoted as:
where and are the expected and actual probabilities of falling within the interval range , respectively. Then, Equation (4) can be expressed in the form of Equation (5).
which for the equally distanced intervals can be simplified to
This becomes the proposed reliability distance, derived based on the root mean square deviation for the density of the predicted probability distributions from observations. Simply put, this reliability distance can be calculated by estimating the relative frequency of observations falling in the interval of the range [0, 1]:
where is the indicator function, which becomes 1 if the given condition is satisfied or 0 otherwise.
As a synthetic example, suppose that two different probabilistic prediction systems, an existing and a new forecasting system, are available to a forecaster (Figure 1) and that the aim is to identify which of these is more reliable. For simplicity, only nine-time steps are considered with very clear p-p relationships, as shown in Figure 1. At first, to test the existing system, the forecaster calculates () and decides to use three ranges (, so ). The relative frequency can be calculated by Equation (7), which is described in Figure 1a, and the reliability distance then measured using Equation (6) as follows:
To compare with the reliability of the existing system, the forecaster also calculates () for the new system. Again, using the same number of probability ranges () and estimating as described in Figure 1b, the reliability distance can be measured as:
The measured reliability distance () of the new system has a lower value than the existing system (). The value becomes closer to 0.0 when the observations are distributed more closely to the predicted probability distributions, implying higher reliability. For the existing system in this synthetic example, the observations are dispersed more sparsely than predicted, meaning that the probabilistic prediction system underestimated the uncertainty, whereas the new system predicted the uncertainty range more reliably.
2.3. Skill Score
The reliability distance (the root mean squared deviation of the density) can be interpreted via a relative comparison to reference predictions from a well-established model. However, if such reference predictions are not available, an alternative can be the skill score in Equation (8) that considers the reference prediction of the worst possible scenario as opposed to the best possible scenario of a perfect prediction. A perfect probabilistic prediction in terms of reliability is one where the predicted probabilities are the same as the actual event frequency, such that for the perfect prediction becomes 0. The for the worst possible scenario is the maximum reliability distance (Equation (9)) that can be calculated with probability ranges.
where is the indicator function, which is 1 if or 0 otherwise; categories other than (in the indicator function) also result in the same results. In Equation (9), represents the predictions with no measurable skill under ranges. With Equations (6) and (9), the Reliability Skill Score in Equation (8) can be written as:
assumes its minimum value of 0.0 for a probabilistic prediction system with no measurable skill and its maximum value of 1.0 for a system producing a perfectly predicted probability distribution in terms of the goodness of fit adopted (root mean squared deviation of probability density under categorised ranges).
3. Goodness of Fit Test
Assuming that the observations after the dissociation are independent for all considered, the squared reliability distance multiplied by the number of sampled observations equals the chi-square test statistic (Equation (11)) and follows a chi-squared distribution with degrees of freedom for the observation frequencies for probability ranges. The reliability distance, measuring the goodness of fit, can be used for the statistical hypothesis test if the observations can be considered to be from the same population as the predicted probability distribution. The p-value for the statistical test can be calculated using the chi-square distribution as in Equation (12).
The p-value in Equation (12) is the probability that the sampling error from the observation sample size can result in a higher reliability distance than the observed distance . A p-value higher than the significance level (generally 0.05) means that the reliability distance of the probabilistic forecasts from the observations is not statistically significant, considering the sampling error of the observation sample size. A higher p-value means that the sampling error of the limited observations itself is more likely to cause a higher reliability distance than the observed one. Since the verification of the reliability depends on the frequency estimation with the sampling error from a limited number of observations, significant evidence with a p-value lower than the significance level is necessary to reject the hypothesis of a reliable probabilistic prediction.
The independence assumption could be controversial depending on the sets of the probabilistic forecasts used for the verification. However, there are previous studies that show cases applying the independence assumption in practical applications of the chi-square test, such as the studies of Anderson [22] and Wilks [23], although they used ensemble members themselves as bins (and thus the number of bins was the number of ensemble members plus 1). This verification approach could be considered one special case of the verification approach in this study—if the number of bins in Equation (12) is set to be the same as the number of ensemble members plus 1, the results would become similar, although not exactly the same. These previous studies could imply that the independence assumption (including the time-invariance assumption of the p-p relationship between the predictions and observations) in the verification of the probabilistic forecast may not be fully impractical. Thus, with the independence assumption, we provide a way to directly apply the goodness of fit metric and test and interpret the reliability of the probabilistic forecasts based on the statistical goodness of fit results. For example, with the dissociation, the number of bins for the chi-square test in Equation (12) can determined by observations instead of the number of ensemble members, and other goodness of fit tests, such as the Kolmogorov–Smirnov goodness of fit test that measures the maximum distance between the prediction and observation distributions, can also be simply applied.
As an application example, consider the synthetic case in Figure 1, where the number of sampled observations is 9 and ranges were used in calculating the metric . With , such that , the p-value of Equation (12) for the measured reliability distance can be calculated as following:
For the existing system, the measured reliability distance of 0.47 (the root mean square deviation) gives a p-value of 0.37, which is larger than the general significance level 0.05. This means that the measured distance is not statistically significant enough to reject the hypothesis that the observations are from the same population as the predicted distribution. Although the existing system has a reliability distance higher than the new system ( = 0.0) in Figure 1, with a p-value of 0.37, a developer cannot conclude that the existing system is not reliable and needs to be changed to the new system. The measured reliability distance is not statistically significant given the sample size (9 observations, suggesting large sampling error), and no conclusion on the system reliability can be made yet. In this example, further observations are necessary.
If the p-value is higher than the significance level while the observed sample size is sufficiently large (and consequently the sampling error can be considered to be minor), then this can conclusively mean that the probabilistic predictions reliably predicted the period tested, showing only a minor error smaller than most of the sampling error from the large sample size used.
4. Application to IRI ENSO Predictions
The reliability assessment metrics presented in previous sections were applied to assess the reliability of a well-established and widely used El Niño–Southern Oscillation prediction system. A multi-model ensemble provides probabilistic prediction from the International Research Institute El Niño–Southern Oscillation (IRI ENSO), using dynamical and statistical models for predicting sea surface temperature in the Nino 3.4 region (http://iri.columbia.edu/ (accessed in 1 January 2015)). The purpose of the multi-model ensemble application could be to assess the possible range of different predictions from different experts as well as their agreement, but it was also interesting to see whether the observations (actual ENSO events) happened as frequently as predicted based on the multi-model ensemble. The reliability distance (the root mean square deviation) was applied to measure the goodness of fit between the predicted probability distribution and the observations, together with the skill score to evaluate the relative level of reliability.
The data consisted of monthly ensemble forecasts issued from January 2013 to January 2015 from 15 dynamic and 8 statistical models (Figure 2). At first, the dissociation via Equation (2) was applied to the observations under the assumption of a time-invariant p-p relationship for the verification period. Figure 3 shows the observations after the dissociation and the histograms for various values of . If the observations are samples from the same population as the predicted probability distribution, the observed variable will follow the uniform distribution (the predicted distribution after the dissociation by Equation (1)), but the histogram for various probability ranges consistently showed that the observed density was higher in the middle of the predicted distribution (Figure 3). This suggests that the multi-model ensemble had a relatively larger variance than the distribution of observations. However, as the number of probability ranges () became larger, the observed frequencies showed higher fluctuations and eventually became binary values (i.e., 0 or 1). To approximate the observation density properly, various guidelines have been suggested regarding the optimum number of categories. This study used a simple square root approach as follows:
where is the number of observations and is the number of the categories. With 25 observations in the IRI ENSO prediction data set, the chosen number of categories was 5.
Next, the relative frequencies were calculated from the frequencies of the observations for each range (Table 1) as Equation (7). The squared deviation of the prediction probability from the observation relative frequency was calculated (final column, Table 1) and the summation of this difference was 0.112. Applying Equations (6) and (10) with , the reliability distance and skill score were 0.75 and 0.63, respectively. The results can be interpreted as the goodness of fit of the predicted probability distributions (the root mean squared deviation of 0.75 in the density of the probability distribution), with 63% skill in comparison with perfectly predicted probability distributions.
Assuming that the observations after the dissociation are independent, the p-value for the goodness of fit (the reliability distance ) can be calculated (using Equation (12)) to statistically test the hypothesis regarding whether the observations can be considered to be samples from the same population as the predicted probability distribution. For the goodness of fit measured, the p-value (Equation (12)) is 0.01, which was lower than the general significance level 0.05. The measured distance from 25 observations was statistically significant and the hypothesis that the observations were from the same population as the predicted probability distribution could be rejected. If the ensemble approach’s aim is to reliably predict the frequency and risk of events, the approach can be improved by reducing the reliability distance measurable from the 25 observations used.
It should be noted that to maintain the simplicity and clarity of this application example, all samples were considered together, although there was mild correlation in the observations after the dissociation. In actual application, if the observations after the dissociation cannot be assumed to be independent, they can be divided into subsets that can satisfy the assumption—for example, if observations with a gap of a certain time step can be assumed to be independent, they can be selectively used as the set for the statistical hypothesis test.
5. Discussion and Conclusions
The reliability of probabilistic predictions has a specific meaning that is important to various users (such as developers, forecasters, and decision makers). It explains how reliable both the predicted probabilities and corresponding estimated risk are. The reliability (as the decomposed term of the Brier Score) has been measured as the difference in predicted probabilities from conditional observation frequencies given specific predicted probability values. This verification of the reliability is closely related to the goodness of fit. The metric and statistical hypothesis tests of the goodness of fit that are commonly known and can be shared across many disciplines can be a useful tool for the communication of reliability. In addition, our understanding and common experiences with the goodness of fit could improve the interpretation of reliability in application to the probabilistic forecasts. However, in the verification of reliability, the observations are single-valued samples from a time-variant predictive uncertainty and cannot be used collectively to assess goodness of fit in the traditional sense.
To apply the goodness of fit metric and its statistical test, a dissociation is applied for the predictions and observations under the assumption of a time-invariant p-p relationship for a specified period (Equations (1) and (2))—the periods can be specified to recognize different reliabilities for different periods (e.g., periods with different seasons or climate conditions) and to satisfy the assumption of a time-invariant p-p relationship for the goodness of fit metric and the assumption of independence for the statistical hypothesis test. After the dissociation, the observations and predicted probability distributions maintain the same p-p relationship as the original ones but are time-invariant within the period considered.
In this study, for the verification of the reliability, the goodness of fit is measured by the metric in Equation (6). The metric, called the reliability distance, is the root mean square deviation in the density of the predicted probability distribution. Assuming independence for the observations after the dissociation, the reliability distance provides the chi-square test statistic (Equation (12)) to test the hypothesis regarding whether the observations can be considered to be from the same population as the predicted probability distribution. The chi-square test is used to test the statistical significance of the observed reliability distance for sampling error from the limited number of observations. If the observed reliability distance is not statistically significant, one cannot reject the possibility of probabilistic forecasts being reliable, for which the observations can be considered to be samples from the same population as the predicted probability distribution. If the observation sample size of the test is sufficient, then this result can be used to conclude that the probabilistic forecasts reliably predicted the considered period, having observed error smaller than most of sampling error from the large sample size used.
As a practical application example, a multi-model ensemble of sea surface temperature in the Nino 3.4 region from the IRI ENSO predictions was tested for the period (2013 to 2015). The reliability distance for the predictions was 0.75, the goodness of fit measured by the root mean square deviation in the density of the predicted probability distribution. According to the reliability skill score for the measured distance, the predictions had 63% skill (= 0.63) in comparison with a perfectly reliable prediction system. The histogram of the observations (after the transformation by Equation (2)) suggested that the reduction in skill was mainly due to over-estimation of the predictive uncertainty. Finally, the p-value for the statistical hypothesis test was calculated to be 0.01 (for the reliability distance 0.75), which was lower than the general significance level 0.05. The reliability distance measured for the period with 25 observations was statistically significant. This indicates that the probabilistic predictions can be improved by upgrading the applied ensemble approach in such a way as to reduce the reliability distance for the given 25 observations.
Author Contributions
Methodology, T.-H.K.; Supervision, A.S. and L.M. All authors have read and agreed to the published version of the manuscript.
Funding
This research received no external funding.
Data Availability Statement
All data used in this paper is available in the websites referred in the main text.
Acknowledgments
T.-H.K. acknowledges the receipt of the University International Postgraduate Awards (UIPA) from the University of New South Wales.
Conflicts of Interest
The authors declare no conflict of interest.
References
- Sharma, A.; Mehrotra, R.; Li, J.; Jha, S. A programming tool for nonparametric system prediction using Partial Informational Correlation and Partial Weights. Environ. Model. Software 2016, 83, 271–275. [Google Scholar] [CrossRef]
- Sharma, A.; Luk, K.C.; Cordery, I.; Lall, U. Seasonal to interannual rainfall probabilistic forecasts for improved water supply management: Part 2—Predictor identification of quarterly rainfall using ocean-atmosphere information. J. Hydrol. 2000, 239, 240–248. [Google Scholar] [CrossRef]
- Gneiting, T.; Raftery, A.E. Weather forecasting with ensemble methods. Science 2005, 310, 248–249. [Google Scholar] [CrossRef] [Green Version]
- Gneiting, T.; Raftery, A.E. Strictly proper scoring rules, prediction, and estimation. J. Am. Stat. Assoc. 2007, 102, 359–378. [Google Scholar] [CrossRef]
- Palmer, T. The economic value of ensemble forecasts as a tool for risk assessment: From days to decades. Q. J. R. Meteorol. Soc. 2002, 128, 747–774. [Google Scholar] [CrossRef]
- Sankarasubramanian, A.; Lall, U.; Souza Filho, F.A.; Sharma, A. Improved water allocation utilizing probabilistic climate forecasts: Short-term water contracts in a risk management framework. Water Resour. Res. 2009, 45. [Google Scholar] [CrossRef] [Green Version]
- Li, L.; Xia, J.; Xu, C.Y.; Singh, V.P. Evaluation of the subjective factors of the GLUE method and comparison with the formal Bayesian method in uncertainty assessment of hydrological models. J. Hydrol. 2010, 390, 210–221. [Google Scholar] [CrossRef]
- Krzysztofowicz, R. Bayesian theory of probabilistic forecasting via deterministic hydrologic model. Water Resour. Res. 1999, 35, 2739–2750. [Google Scholar] [CrossRef] [Green Version]
- Todini, E. Predictive uncertainty assessment in real time flood forecasting. In Uncertainties in Environmental Modelling and Consequences for Policy Making; Baveye, P.C., Laba, M., Mysiak, J., Eds.; Springer: Berlin/Heidelberg, Germany, 2009; pp. 205–228. [Google Scholar]
- Bradley, A.A.; Schwartz, S.S.; Hashino, T. Sampling uncertainty and confidence intervals for the brier score and brier skill score. Weather Forecast. 2008, 23, 992–1006. [Google Scholar] [CrossRef]
- Welles, E.; Sorooshian, S.; Carter, G.; Olsen, B. Hydrologic verification: A call for action and collaboration. Bull. Am. Meteorol. Soc. 2007, 88, 503–511. [Google Scholar] [CrossRef]
- Siegert, S. Variance estimation for Brier Score decomposition. Q. J. R. Meteorol. Soc. 2014, 140, 1771–1777. [Google Scholar] [CrossRef] [Green Version]
- Brier, G.W. Verification of forecasts expressed in terms of probability. Mon. Weather Rev. 1950, 78, 1–3. [Google Scholar] [CrossRef]
- Hersbach, H. Decomposition of the continuous ranked probability score for ensemble prediction systems. Weather Forecast. 2000, 15, 559–570. [Google Scholar] [CrossRef]
- Epstein, E.S. A scoring system for probability forecasts of ranked categories. J. Appl. Meteorol. 1969, 8, 985–987. [Google Scholar] [CrossRef] [Green Version]
- Brown, T.A. Admissible Scoring Systems for Continuous Distributions (Report P-5235); The Rand Corporation: Santa Monica, CA, USA, 1974. [Google Scholar]
- Matheson, J.E.; Winkler, R.L. Scoring rules for continuous probability distributions. Manag. Sci. 1976, 22, 1087–1096. [Google Scholar] [CrossRef]
- Murphy, A.H. A new vector partition of the probability score. J. Appl. Meteorol. 1973, 12, 595–600. [Google Scholar] [CrossRef] [Green Version]
- Wilks, D.S. Statistical Methods in the Atmospheric Sciences; Academic Press: Cambridge, MA, USA, 1995; p. 262. [Google Scholar]
- Jolliffe, I.T.; Stephenson, D.B. Forecast Verification: A Practitioner’s Guide in Atmospheric Science; John Wiley & Sons: Hoboken, NJ, USA, 2012. [Google Scholar]
- Nipen, T.; Stull, R. Calibrating probabilistic forecasts from an NWP ensemble. Dyn. Meteorol. Oceanogr. 2011, 63, 858–875. [Google Scholar] [CrossRef]
- Anderson, J.L. A method for producing and evaluating probabilistic forecasts from ensemble model integrations. J. Clim. 1996, 9, 1518–1530. [Google Scholar] [CrossRef]
- Wilks, D.S. Indices of rank histogram flatness and their sampling properties. Mon. Weather Rev. 2019, 147, 763–769. [Google Scholar] [CrossRef]
Figure 1.
Synthetic example illustrating a hypothetical probabilistic prediction system ( is a predicted probability distribution from an existing system, is from a new prediction system, and is after the dissociation by Equation (2)).
Figure 1.
Synthetic example illustrating a hypothetical probabilistic prediction system ( is a predicted probability distribution from an existing system, is from a new prediction system, and is after the dissociation by Equation (2)).
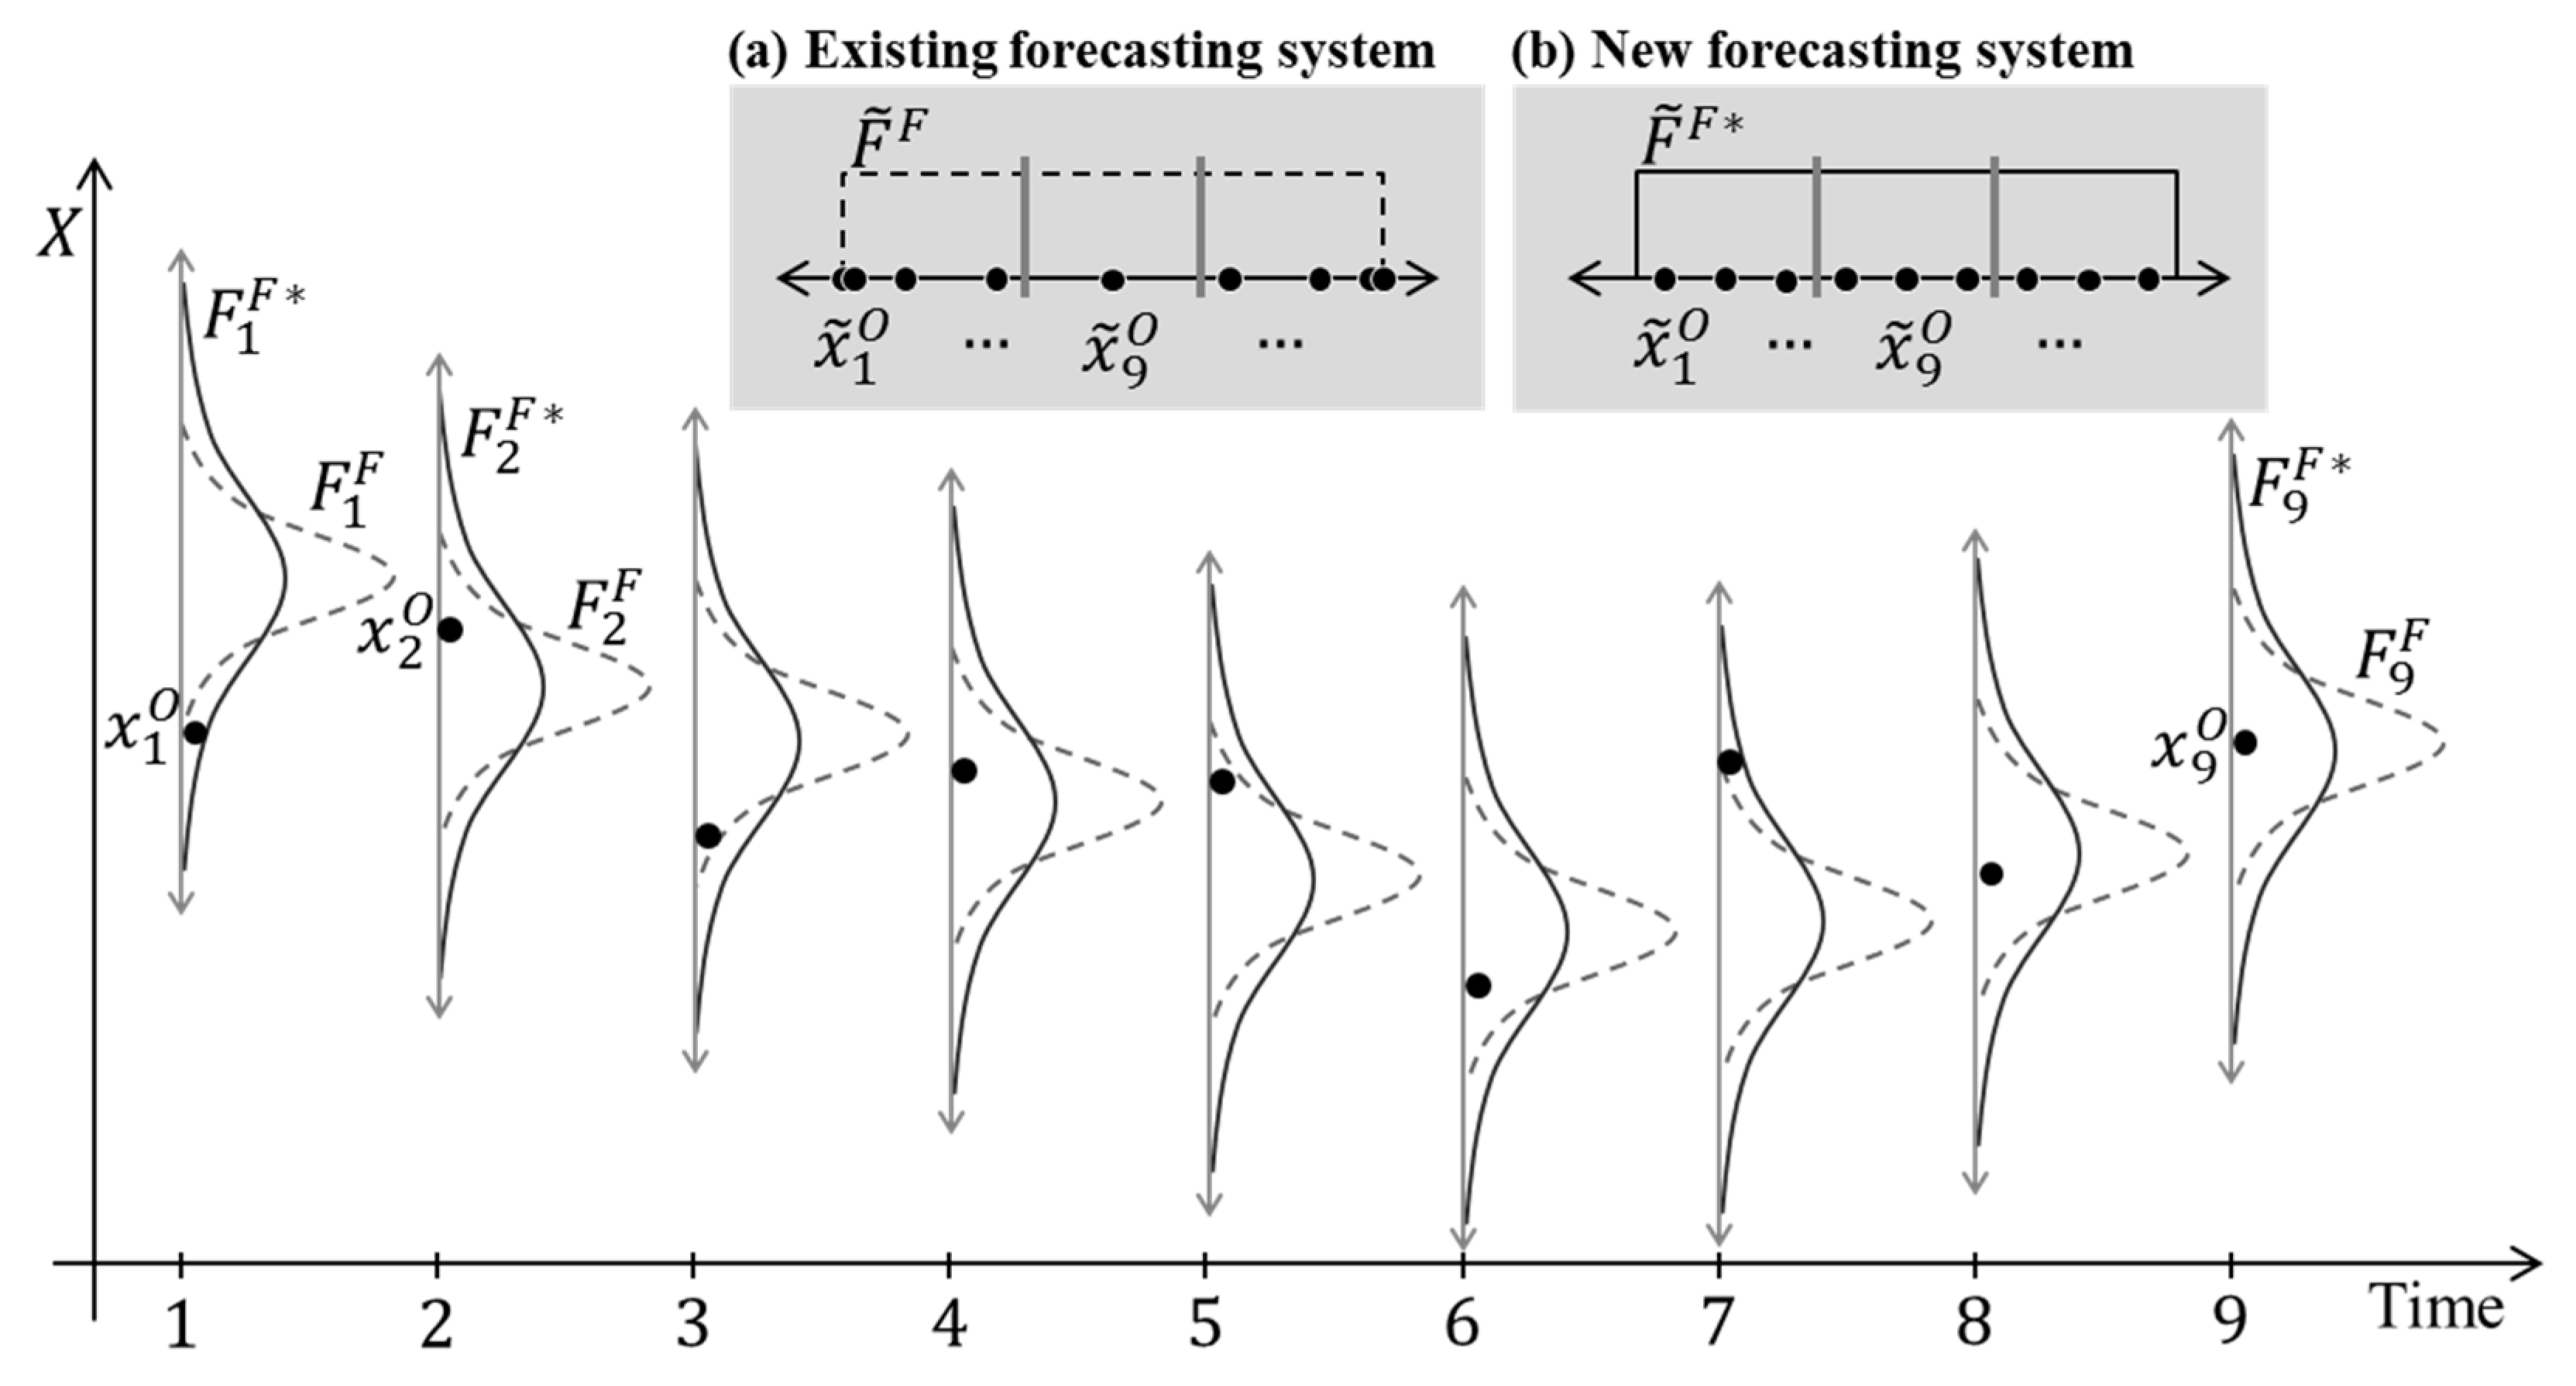
Figure 2.
ENSO forecasts from various dynamical and statistical models and corresponding observations (thick black line).
Figure 2.
ENSO forecasts from various dynamical and statistical models and corresponding observations (thick black line).
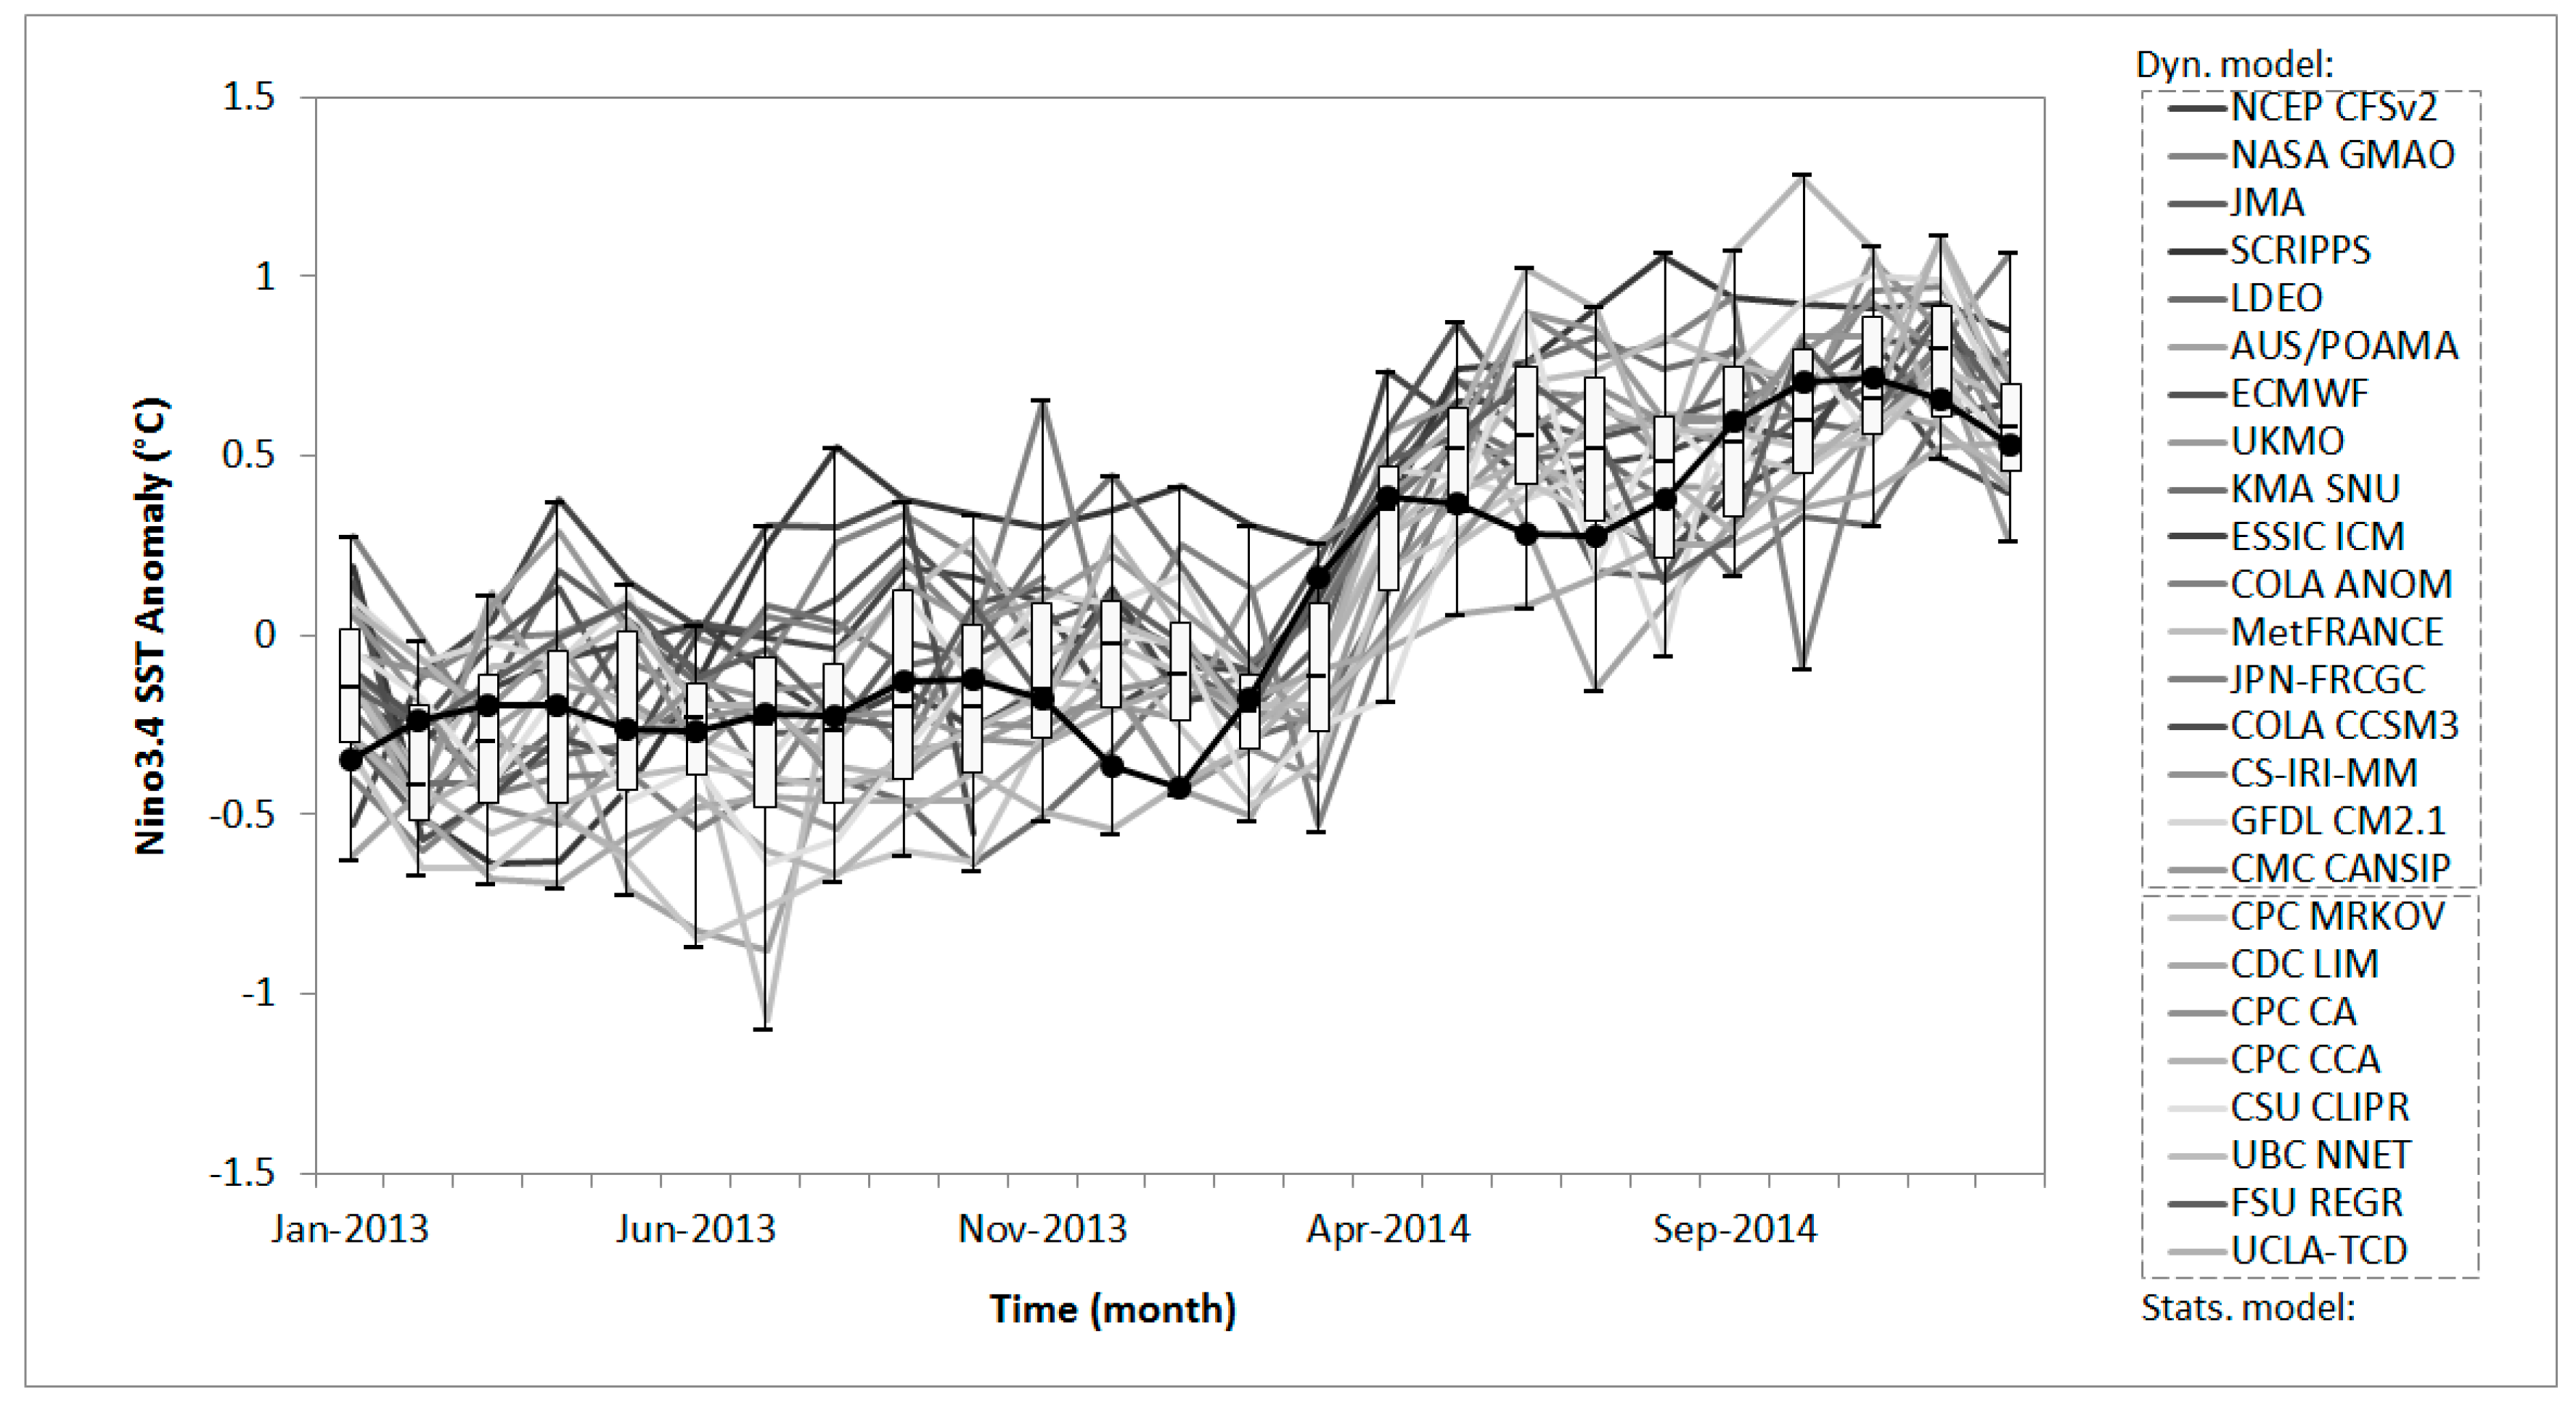
Figure 3.
Histogram of observations according to ranges (cross marks on the bottom of each histogram are the observations and the dotted line is the expected frequency from the predicted distribution ).
Figure 3.
Histogram of observations according to ranges (cross marks on the bottom of each histogram are the observations and the dotted line is the expected frequency from the predicted distribution ).


Table 1.
Reliability distance and skill score with for IRI ENSO forecasts.
| Range | Frequency | |||
|---|---|---|---|---|
| 1 | 0.0–0.2 | 5 | 0.20 | 0 |
| 2 | 0.2–0.4 | 4 | 0.16 | 0.0016 |
| 3 | 0.4–0.6 | 12 | 0.48 | 0.0784 |
| 4 | 0.6–0.8 | 3 | 0.12 | 0.0064 |
| 5 | 0.8–1.0 | 1 | 0.04 | 0.0256 |
| Sum | 25 | 1.00 | 0.1120 | |
Publisher’s Note: MDPI stays neutral with regard to jurisdictional claims in published maps and institutional affiliations. |
© 2021 by the authors. Licensee MDPI, Basel, Switzerland. This article is an open access article distributed under the terms and conditions of the Creative Commons Attribution (CC BY) license (https://creativecommons.org/licenses/by/4.0/).
Share and Cite
MDPI and ACS Style
Kang, T.-H.; Sharma, A.; Marshall, L. Assessing Goodness of Fit for Verifying Probabilistic Forecasts. Forecasting 2021, 3, 763-773. https://doi.org/10.3390/forecast3040047
AMA Style
Kang T-H, Sharma A, Marshall L. Assessing Goodness of Fit for Verifying Probabilistic Forecasts. Forecasting. 2021; 3(4):763-773. https://doi.org/10.3390/forecast3040047
Chicago/Turabian StyleKang, Tae-Ho, Ashish Sharma, and Lucy Marshall. 2021. "Assessing Goodness of Fit for Verifying Probabilistic Forecasts" Forecasting 3, no. 4: 763-773. https://doi.org/10.3390/forecast3040047