
Aerodynamic Modification of High-Rise Buildings by the Adjoint Method

1
Mechanical Engineering Department, Faculty of Engineering, Ferdowsi University of Mashhad, Mashhad 9177948974, Iran
2
Mechanical Engineering Department, School of Engineering, Aalto University, 02150 Espoo, Finland
3
NOVA School of Science and Technology, Center of Technology and Systems (UNINOVA-CTS) and Associated Lab of Intelligent Systems (LASI), NOVA University Lisbon, 2829-516 Lisbon, Portugal
*
Author to whom correspondence should be addressed.
J 2024, 7(1), 72-93; https://doi.org/10.3390/j7010004
Submission received: 29 December 2023
/
Revised: 23 January 2024
/
Accepted: 26 January 2024
/
Published: 5 February 2024
(This article belongs to the Section Engineering)
Abstract
:This study presents a novel numerical methodology that is designed for the dynamic adjustment of three-dimensional high-rise building configurations in response to aerodynamic forces. The approach combines two core components: a numerical simulation of fluid flow and the adjoint method. Through a comprehensive sensitivity analysis, the influence of individual variables on aerodynamic loads, including lift and drag coefficients, is assessed. The findings underscore that the architectural design, specifically the building’s construction pattern, exerts the most substantial impact on these forces, accounting for a substantial proportion (76%). Consequently, the study extends its evaluation to the sensitivity of fluid flow across various sections of the tower by solving the adjoint equation throughout the entire fluid domain. As a result, the derived sensitivity vector indicates a remarkable reduction of approximately 31% in the applied loads on the tower. This notable improvement has significant implications for the construction of tall buildings, as it effectively mitigates aerodynamic forces, ultimately enhancing the overall comfort and structural stability of these architectural marvels.
1. Introduction
In the past decade, significant attention has been directed toward the field of optimization in a multitude of engineering contexts, with the findings yielding substantial impacts on the realm of engineering sciences. Optimization techniques have been embraced across all engineering disciplines, encompassing automotive [1], medical [2], civil engineering [3] and other fields. The significance of optimization strategies is poised to grow even further, especially for engineering challenges whose design and construction involve exorbitant costs [4,5,6].
For instance, the construction of high-rise buildings is experiencing continuous expansion, necessitating the development of new methodologies due to their considerable cost. High-rise structures, characterized by their lower natural frequencies, low damping characteristics, and susceptibility to high wind speeds—particularly at elevated sections—render them exceptionally vulnerable to wind-induced perturbations, including vortex-induced oscillations. Consequently, constructing wind-resistant high-rise buildings mandates a meticulous consideration of aerodynamic factors. The aerodynamic optimization of large towers and high-rise structures will enhance resident satisfaction, structural durability, and the overall safety of skyscrapers.
The discourse on aerodynamic optimization and sustainable design is a cutting-edge and contemporary subject within the domain of architectural design. As a result, parametric studies of aerodynamics have recently garnered considerable attention from researchers and scientists [7,8]. Moreover, experimental research of high-rise buildings is being pursued with fervor, including investigations into the influence of building corners on aerodynamic loads [9], the step and cone effects [10,11], and torsional effects [12]. The assessment of economic considerations, such as cost and efficient space utilization within high-rise buildings following aerodynamic modifications, is also under scrutiny [13]. Despite recent comprehensive wind tunnel testing that sought to optimize the shape of various building structures, including square, circular, rectangular, and elliptical models [14,15,16,17,18,19], the obtained information primarily serves as a preliminary design resource and offers a solid foundation for future research in the realm of building aerodynamics, but does not provide designers with direct guidance for aerodynamic optimization.
Advances in computer science and computational fluid dynamics over the past few decades have greatly facilitated the research efforts of scientists and engineers, and aerodynamic approaches that have been successfully implemented in the design of high-rise structures are being rigorously analyzed [20,21]. Zhang et al. executed a comprehensive modeling of wind flow and aerodynamics pertaining to towers [22], Tominaga et al. conducted numerical investigations that aimed to optimize the roof designs of high-rise structures [23]. Subsequently, the effects of wind-induced forces on towers have been examined in greater detail [24,25]: numerical simulations have enabled the examination of various aspects of fluid flow around structures, meaning the impact of parameter variations can be swiftly assessed at a lower cost. Computational fluid dynamics simulations have also been utilized to model wind loading on tall buildings [26], and Irwin has probed the influence of wind flow turbulence and Reynolds number on the generation of vortices in tall structures [27]. Numerical simulation has also been employed to study wind flow over tall buildings with complex geometries [28].
Additionally, numerical methods have offered valuable insights into aerodynamic forces; for example, Li et al.’s research investigated the impact of various taper ratios on wind load reduction in tall rectangular buildings [29], underscoring that increasing the taper ratio enhances the aerodynamic efficiency of rectangular high-rise structures and supplies pivotal data to the wind-resistant design of such buildings [30]. Daemei et al. employed large eddy simulation (LES) to assess drag forces on different buildings [31], while Meena et al. compared various models, including Y-shaped models with rounded corners, to evaluate their responses to severe winds [32]. In recent years, the use of computational fluid dynamics and numerical simulations have experienced significant growth in the field of tall building aerodynamics, with each developing a unique focus [33,34,35].
Previous studies primarily concentrated on evaluating factors that influence the aerodynamics of buildings, and modifications were then made to high-rise structures based on the manipulation of these parameters. Aerodynamic optimization can be categorized into the two distinct classes of aerodynamic design optimization and aerodynamic modification optimization [30]. In aerodynamic design optimization, aerodynamic considerations are integrated into the initial stages of high-rise building design. Nonetheless, these endeavors often necessitate wind tunnel testing involving various body shapes, significantly increasing costs and prolonging the design process. Aerodynamic modification, on the other hand, allows for limited adjustments to the building’s shape to enhance its aerodynamic properties. The challenge lies in identifying where these modifications should be made within the structure. Therefore, the development of a system capable of illustrating the sensitivity of different structural elements, from aerodynamic loads to tower designers, can substantially reduce design costs and revolutionize the high-rise construction market. The overarching objective of this paper is to leverage information about the derivatives of aerodynamic performance metrics that are related to the building’s structure location. This knowledge aids the evaluation of the optimal location for modification and enhances the desired metrics. The primary aim of this study is to devise a system that facilitates the optimization of high-rise buildings and estimates the sensitivity of their various components to aerodynamic loads. This method is founded on the combined solution of three-dimensional fluid flow equations and adjoint method equations. Consequently, turbulent airflow around high-rise buildings is meticulously and comprehensively simulated in three dimensions, with a focus on studying the aerodynamic effects and the underlying mechanisms for reducing the load on towers. The significance of this research is two-fold, namely solving the continuous adjoint method to ascertain the importance of parameters influencing tower aerodynamics. This section takes into consideration four pivotal parameters: the building’s cross-section, flow incident angle, structural placement, and environmental conditions. The results obtained from the numerical solutions of the continuous adjoint method equations then pinpoint the most influential parameter. The discrete adjoint method is also employed across the entire solution domain to ascertain the sensitivity of various tower components to aerodynamic forces.
The structure of this paper is as follows. Section 1 briefly summarizes previous work on simulating and optimizing high-rise buildings. Section 2 describes the governing equations and details the methods utilized for adjoint method optimization and flow numerical simulation, including all relevant parameters. Section 3 presents the computational mesh set-up and verification of the numerical simulations to demonstrate validity. The results and discussion are covered in Section 4, which examines the aerodynamic forces of four different kinds of high-rise buildings and investigates the flow behavior around each building type, both before and after optimization, and also compares each one, Additionally, a sensitivity analysis of each parameter is conducted to inform future optimization work targeting improved outcomes.
2. Governing Equation
In the realm of computational fluid dynamics, the foundational equations governing the conservation of mass and momentum (as represented by Equations (1) and (2)) are systematically solved through the formulation of the Navier-Stokes equation. To tackle this numerical challenge, a discretized finite volume approach is harnessed, underpinned both by the implicit pressure-based algorithm and the utilization of the SIMPLE method, which is an acronym for the semi-implicit method for pressure-linked equations. In the context of this research, the ANSYS Fluent software is employed as the numerical tool of choice for simulating fluid flow. These governing equations, rooted in the principles set forth by Gossans, are systematically applied across all control volumes within the computational domain. To account for displacement terms, the central difference and the second-order upstream differential methods are thoughtfully employed in the estimation of Diffusion rate. Additionally, the turbulence model is intricately integrated with these equations, closely resembling the treatment of the Navier-Stokes equations. The intricate dynamics of large eddies forming in the wake of the studied structure, coupled with the presence of wall effects, establish that this study employs a hybrid approach, combining large eddy simulation (LES) models with the Reynolds-averaged Navier-Stokes (RANS) equations. This combination enables the prediction of substantial flow separations, particularly in scenarios characterized by high Reynolds numbers [36]. Consequently, the chosen approach incorporates the detached eddy simulation (DES) turbulence model, a method that effectively amalgamates LES and RANS. In this specific study, the delayed detached eddy simulation (DDES) model, founded on the principles of shear stress transfer, emerges as the preferred turbulence model, owing to its robust capabilities [37,38]. Furthermore, within the domain proximate to the walls, the SST K-ω model, characterized by its emphasis on shear stress transfer, is adopted from the suite of Reynolds-averaged Navier-Stokes (RANS) equations [39]. The foundational equations for the delayed detached eddy simulation (DDES) model, rooted in the concept of shear stress transfer, are encapsulated by Equations (3) and (4).
The length scale of the delayed detached eddy simulation (DDES) model is obtained based on the following equation:
In the above relations, β* = 0.09, k is the turbulence kinetic energy, ω is the dissolution term, Δmax is the maximum line length of a cell, and , are also the mixing functions of the shear stress transfer model [39]. The function that has been used is also a mixing function, and is in fact responsible for changing the models; it is defined as follows:
Adjoint Method
The adjoint method is a specialized tool that broadens the scope of analysis by providing sensitivity information and determining the sensitivity of a desired function in relation to input variables. To gain a better grasp of this method, let us consider a scenario where a comprehensive understanding of a system’s behavior is available. In the event that a modification is introduced into this system, the existing body of knowledge is also subject to change, and the magnitude of this change is contingent on how sensitive the problem is to the altered parameter. In simpler terms, the adjoint method involves the computation of derivatives for one or more quantities that concern one or more independent variables. It is worth noting that the Navier-Stokes equations (Equations (1)–(4)) can be reformulated in a pseudo-discrete manner, as outlined below:
So that is the vector of main variables, and R is also the total residual. To model the changes applied to the solution, a source term is assumed to be added to the continuity and momentum equations, as follows:
These terms can be precisely defined, and apply not only to mass but to various other physical quantities. The additional vector notation is employed to distinguish between terms representing the effectiveness of a specific part and the influence of the object on the fluid. This method is particularly noteworthy because of its generality, which allows it to be applied to model a wide range of problems.
The additional information acquired through the adjoint method plays a pivotal role in enhancing the accuracy of numerical solutions. High-sensitivity regions indicate the strong impact of particular areas on the overall solution: consequently, when adjustments or corrections are needed, these sensitive areas become focal points for consideration. The adjoint method can be classified into two main categories: continuous and discrete. The continuous adjoint method primarily relies on the mathematical properties of the partial differential equations that govern the physics of the problem at hand. While this approach is straightforward, it may not be suitable for problems featuring complex physics and intricate boundary conditions. Conversely, the discrete adjoint method does not hinge on the governing partial differential equations of fluid dynamics, and instead leverages specialized discretized forms of these equations. This approach fosters a closer integration with the flow solver, providing valuable insights into data sensitivity. Importantly, the discrete adjoint method is well suited to problems that encompass complex physics, intricate boundary conditions, or wall functions. In the context of this research, the discrete adjoint method is adopted, and the adjoint equations are derived based on the Giles method [40], as elucidated in the following:
So that F = F(w, S) is the observer function, w is the vector of variables related to the fluid, such as pressure and velocities, and is called the state variable, S is the control variables obtained from solving the flow, ψ is the adjoint variable, and R is the expression of convergency in fluid equations, defined as follows:
M is the number of cells in the problem. In fact, the values of F, R, as well as their derivatives, will be obtained after solving the flow; it is on the basis and resolution of the adjoint equations that the adjoint variables can be seen. The sensitivity of the observer function to the control variables is also obtained on the basis of the adjoint method, in the form of the following relation:
Unlike the adjoint system in Equation (13), the effect of design variables in the above equation is defined as a gradient, although the vector and matrix are defined as partial derivatives. Similar to the calculation of the terms in Equation (13), the calculation process of dF/dS and dR/dS is obtained by the average automatic differential method [41].
Furthermore, The Lift and Drag coefficients are also calculated as follows:
where, r is defined as radius, L, A and v are, respectively, defined as Lift force, Area and velocity. Also, D is defined as the Drag force in the above equations.
The pressure coefficient is also calculated as follows:
where, is the static pressure, is the static pressure in the freestream, is the freestream fluid density, and is the freestream velocity of the fluid.
3. Computational Mesh and Numerical Verification
The designated structure is regarded as a rigid model, and is assumed to exhibit no elastic deformations. With a towering height of 160 m, its width and length dimensions vary within the range of 40 to 80 m, contingent upon the specific cross-sectional configuration employed. To facilitate numerical simulations, a scale factor of 1:400 was employed, thus simplifying the computational process. Thus, a boundary condition was defined, using an exponential power-law function with respect to height, to establish the impact of the boundary layer formation near the ground. This choice reflects the need to account for the complex flow patterns and aerodynamic interactions that occur close to the ground surface.
Three essential parameters, namely the free stream wind velocity (), the exponential power-law coefficient (α), and the turbulence intensity (), serve as reference values for the current investigation, and are crucial for characterizing the flow dynamics around the building. The comprehensive flow conditions employed in this simulation are meticulously outlined in Table 1, encompassing vital parameters for the analysis. In this simulation, a discrete time step of 0.0125 s was employed as a baseline, with a preliminary assessment that aimed to halve this value to assess time-step independence, with the intent of ascertaining that the chosen time step did not significantly affect the results. The results of this preliminary step unequivocally demonstrated the precision and stability of the selected time step, confirming its independence from temporal variations. This methodological step reinforces the reliability of the subsequent findings.
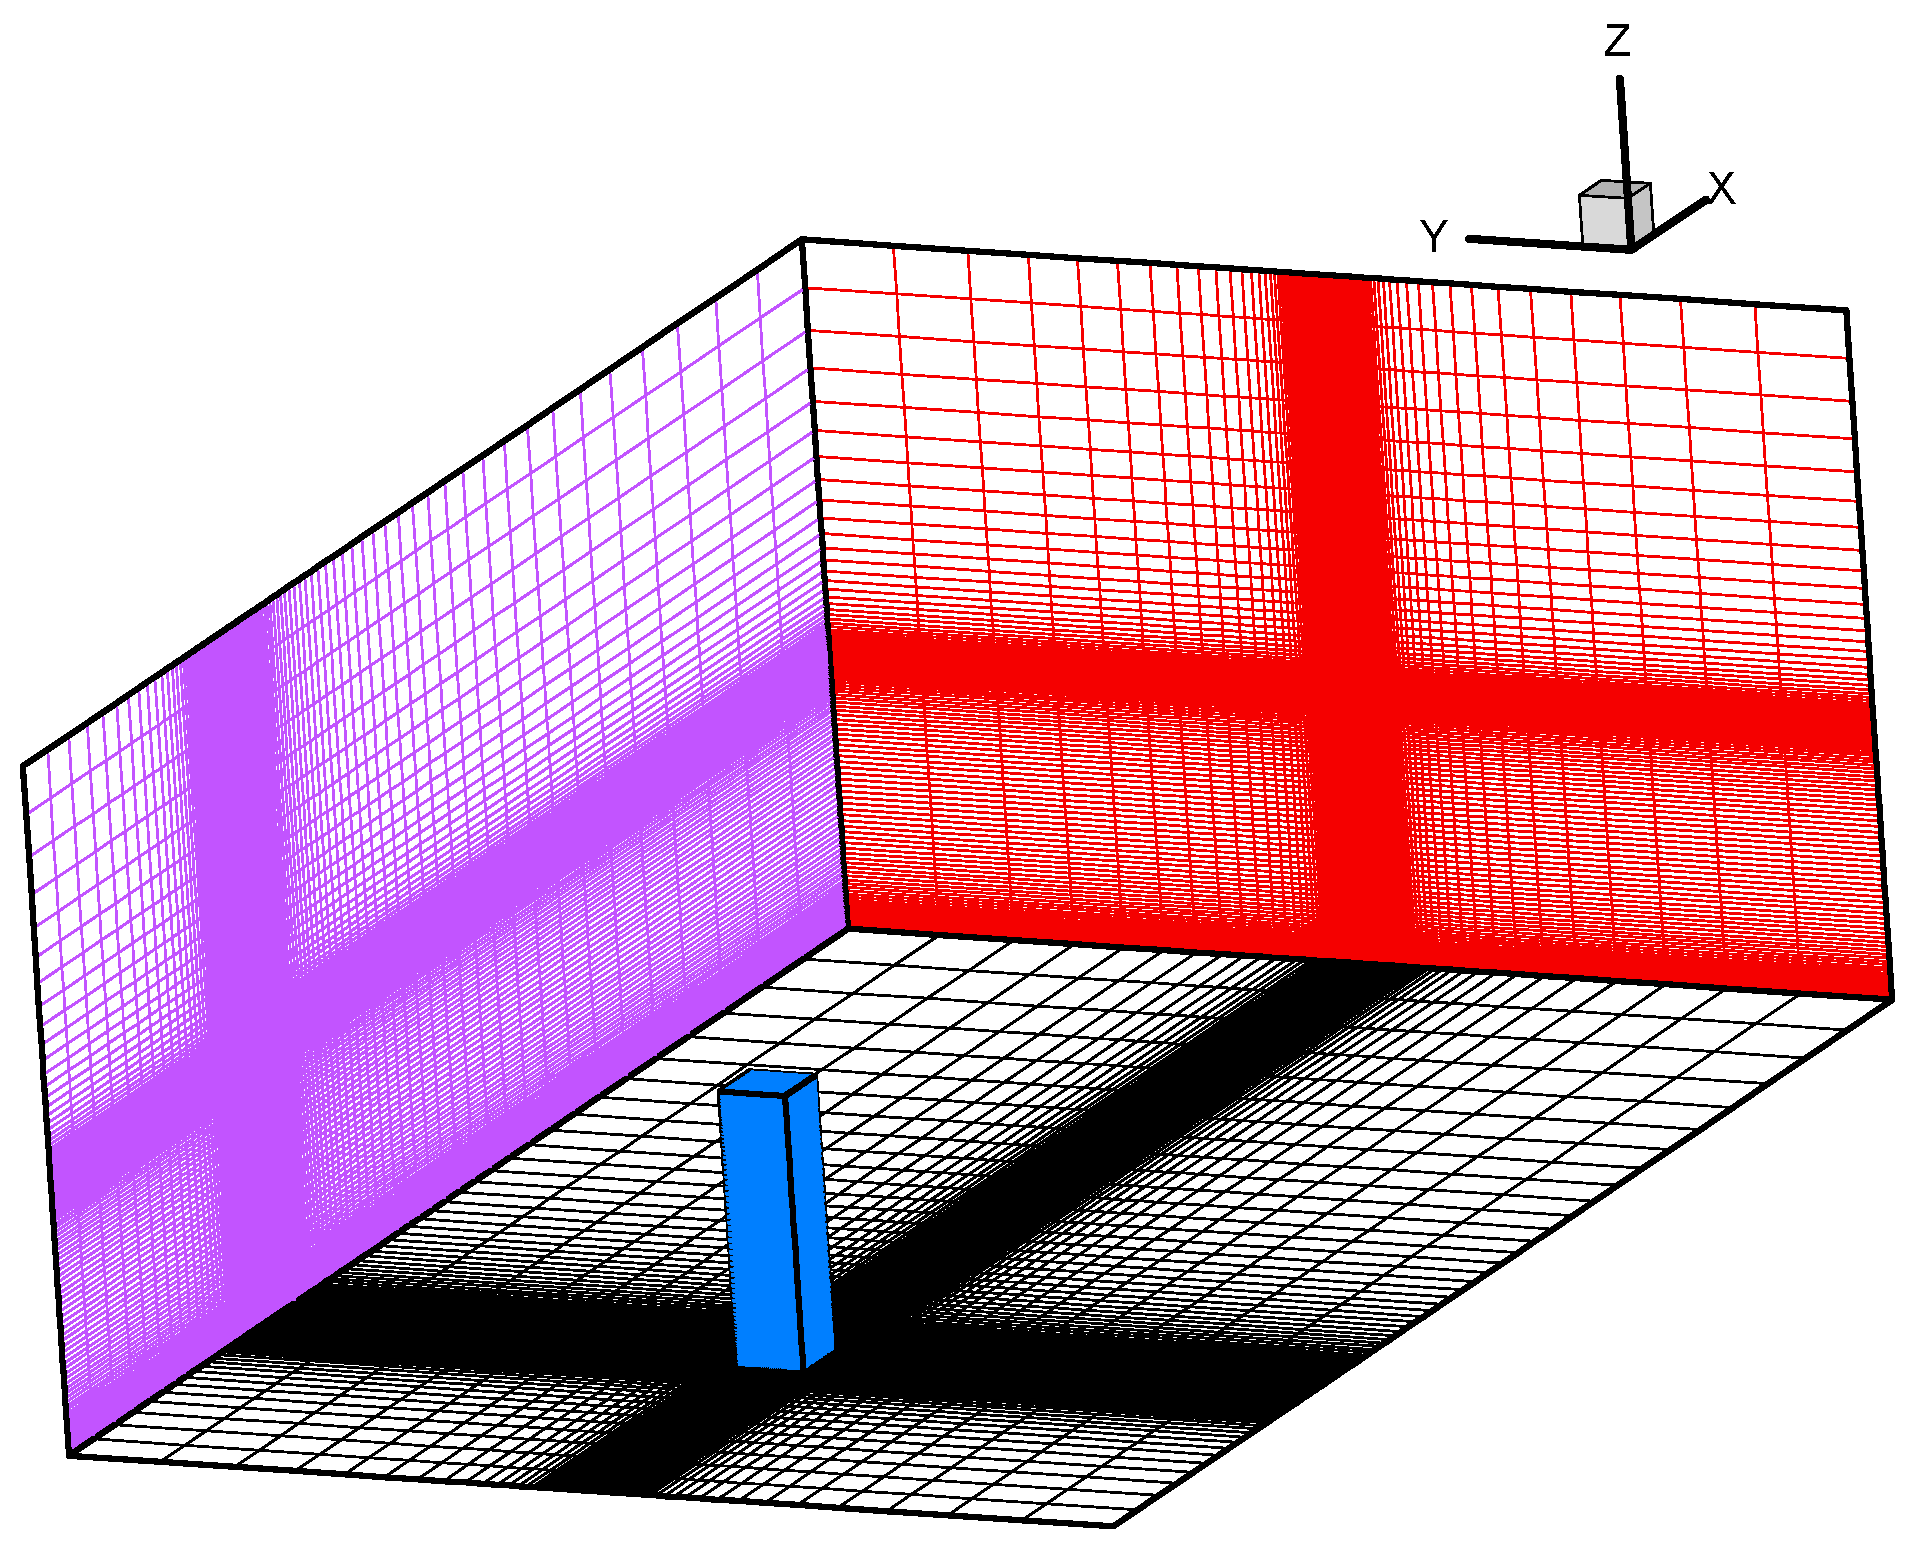
The simulation of the three-dimensional tall building is conducted using computational fluid dynamics (CFD). In this computational framework, the problem domain and meshing are intricately configured to encapsulate the building. A structured grid, essential for the CFD simulation, is generated to discretize the spatial domain effectively. Specifically, an H-type grid structure, as illustrated in Figure 1, is employed. Also, the expansion ratio of the Mesh is considered 1.2. The grid structure employed consists of approximately 18,000 cells on the input and output boundaries to ensure grid independence. Moreover, the free boundaries are composed of 21,600 cells. An important consideration is the wall of the tower, which consists of 6000 cells, maintaining a low value of to address near-wall turbulence effects. Grid organization techniques are employed to ensure grid quality, with particular attention to the boundary layer regions where is about 1.
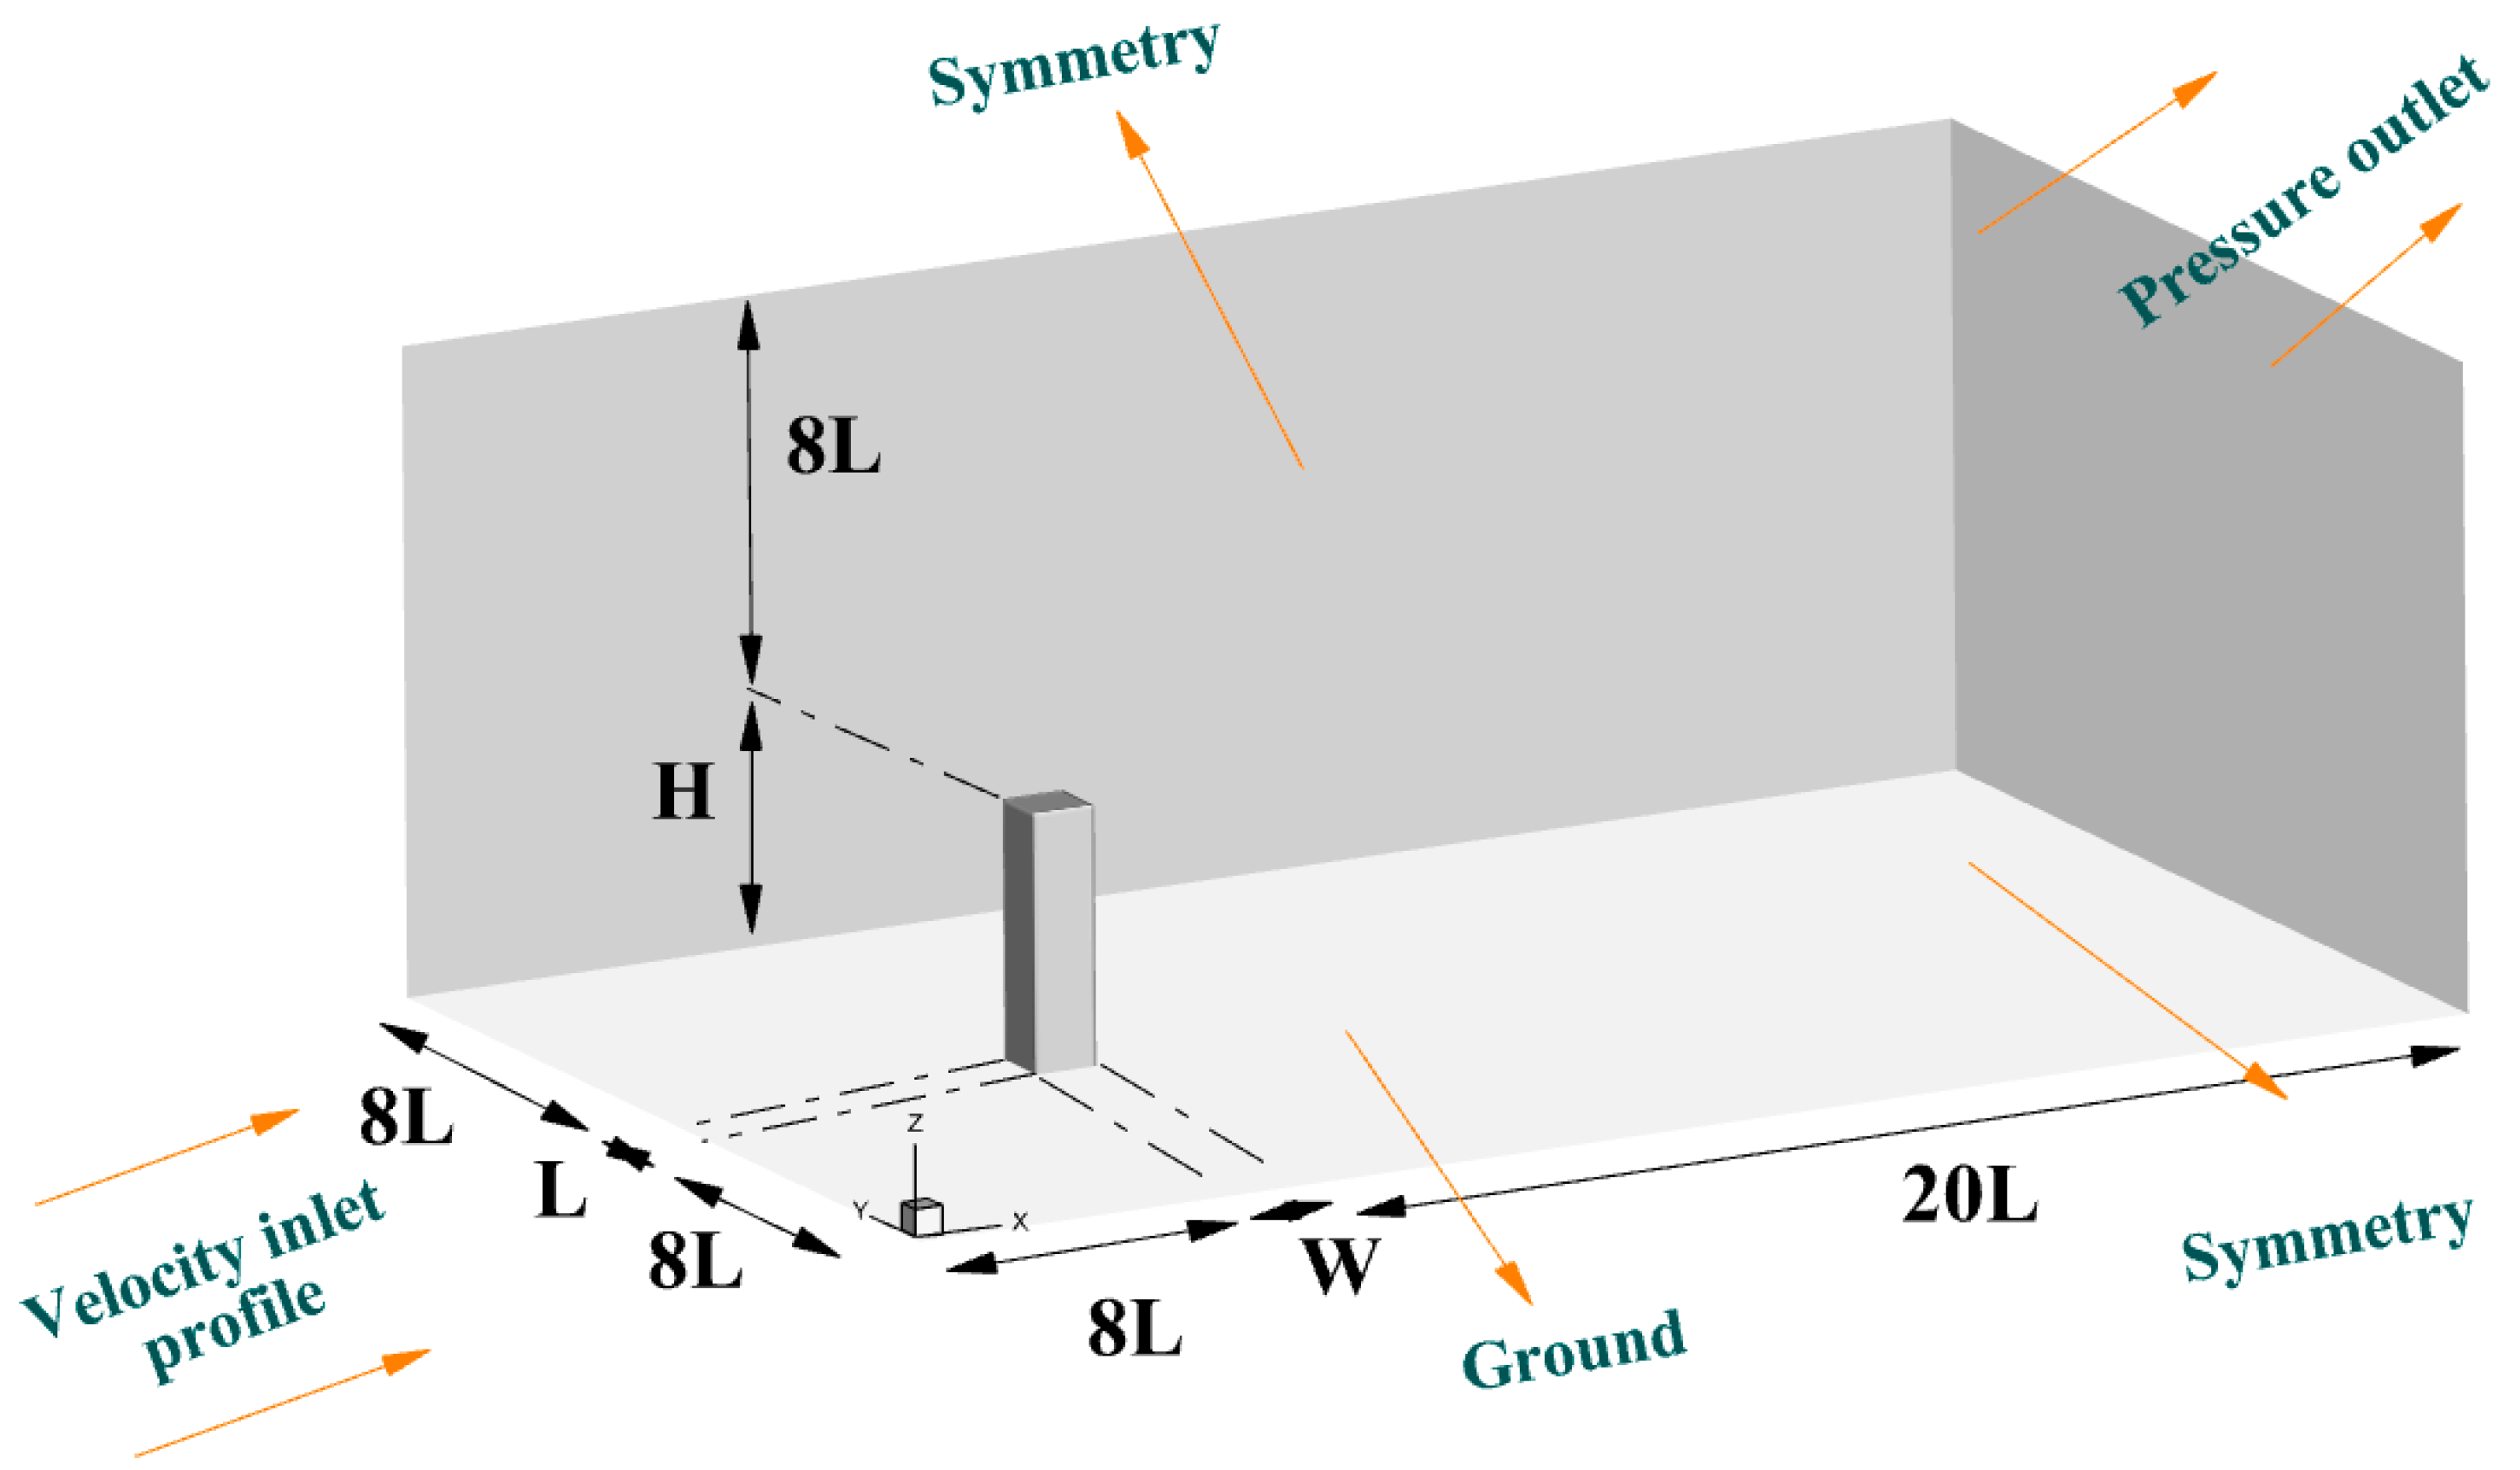
As depicted in Figure 2, the velocity inlet is positioned at approximately 8L from the high-rise building, while the outlet boundary condition, implemented at a location 20L downstream, enforces an outlet pressure condition. The lateral and upper boundaries are also set at approximately 8L distance. The upper and side walls of the computational domain are subjected to slip boundary conditions, while wall boundary conditions are applied to the building surfaces and the ground, as indicated in Figure 2.
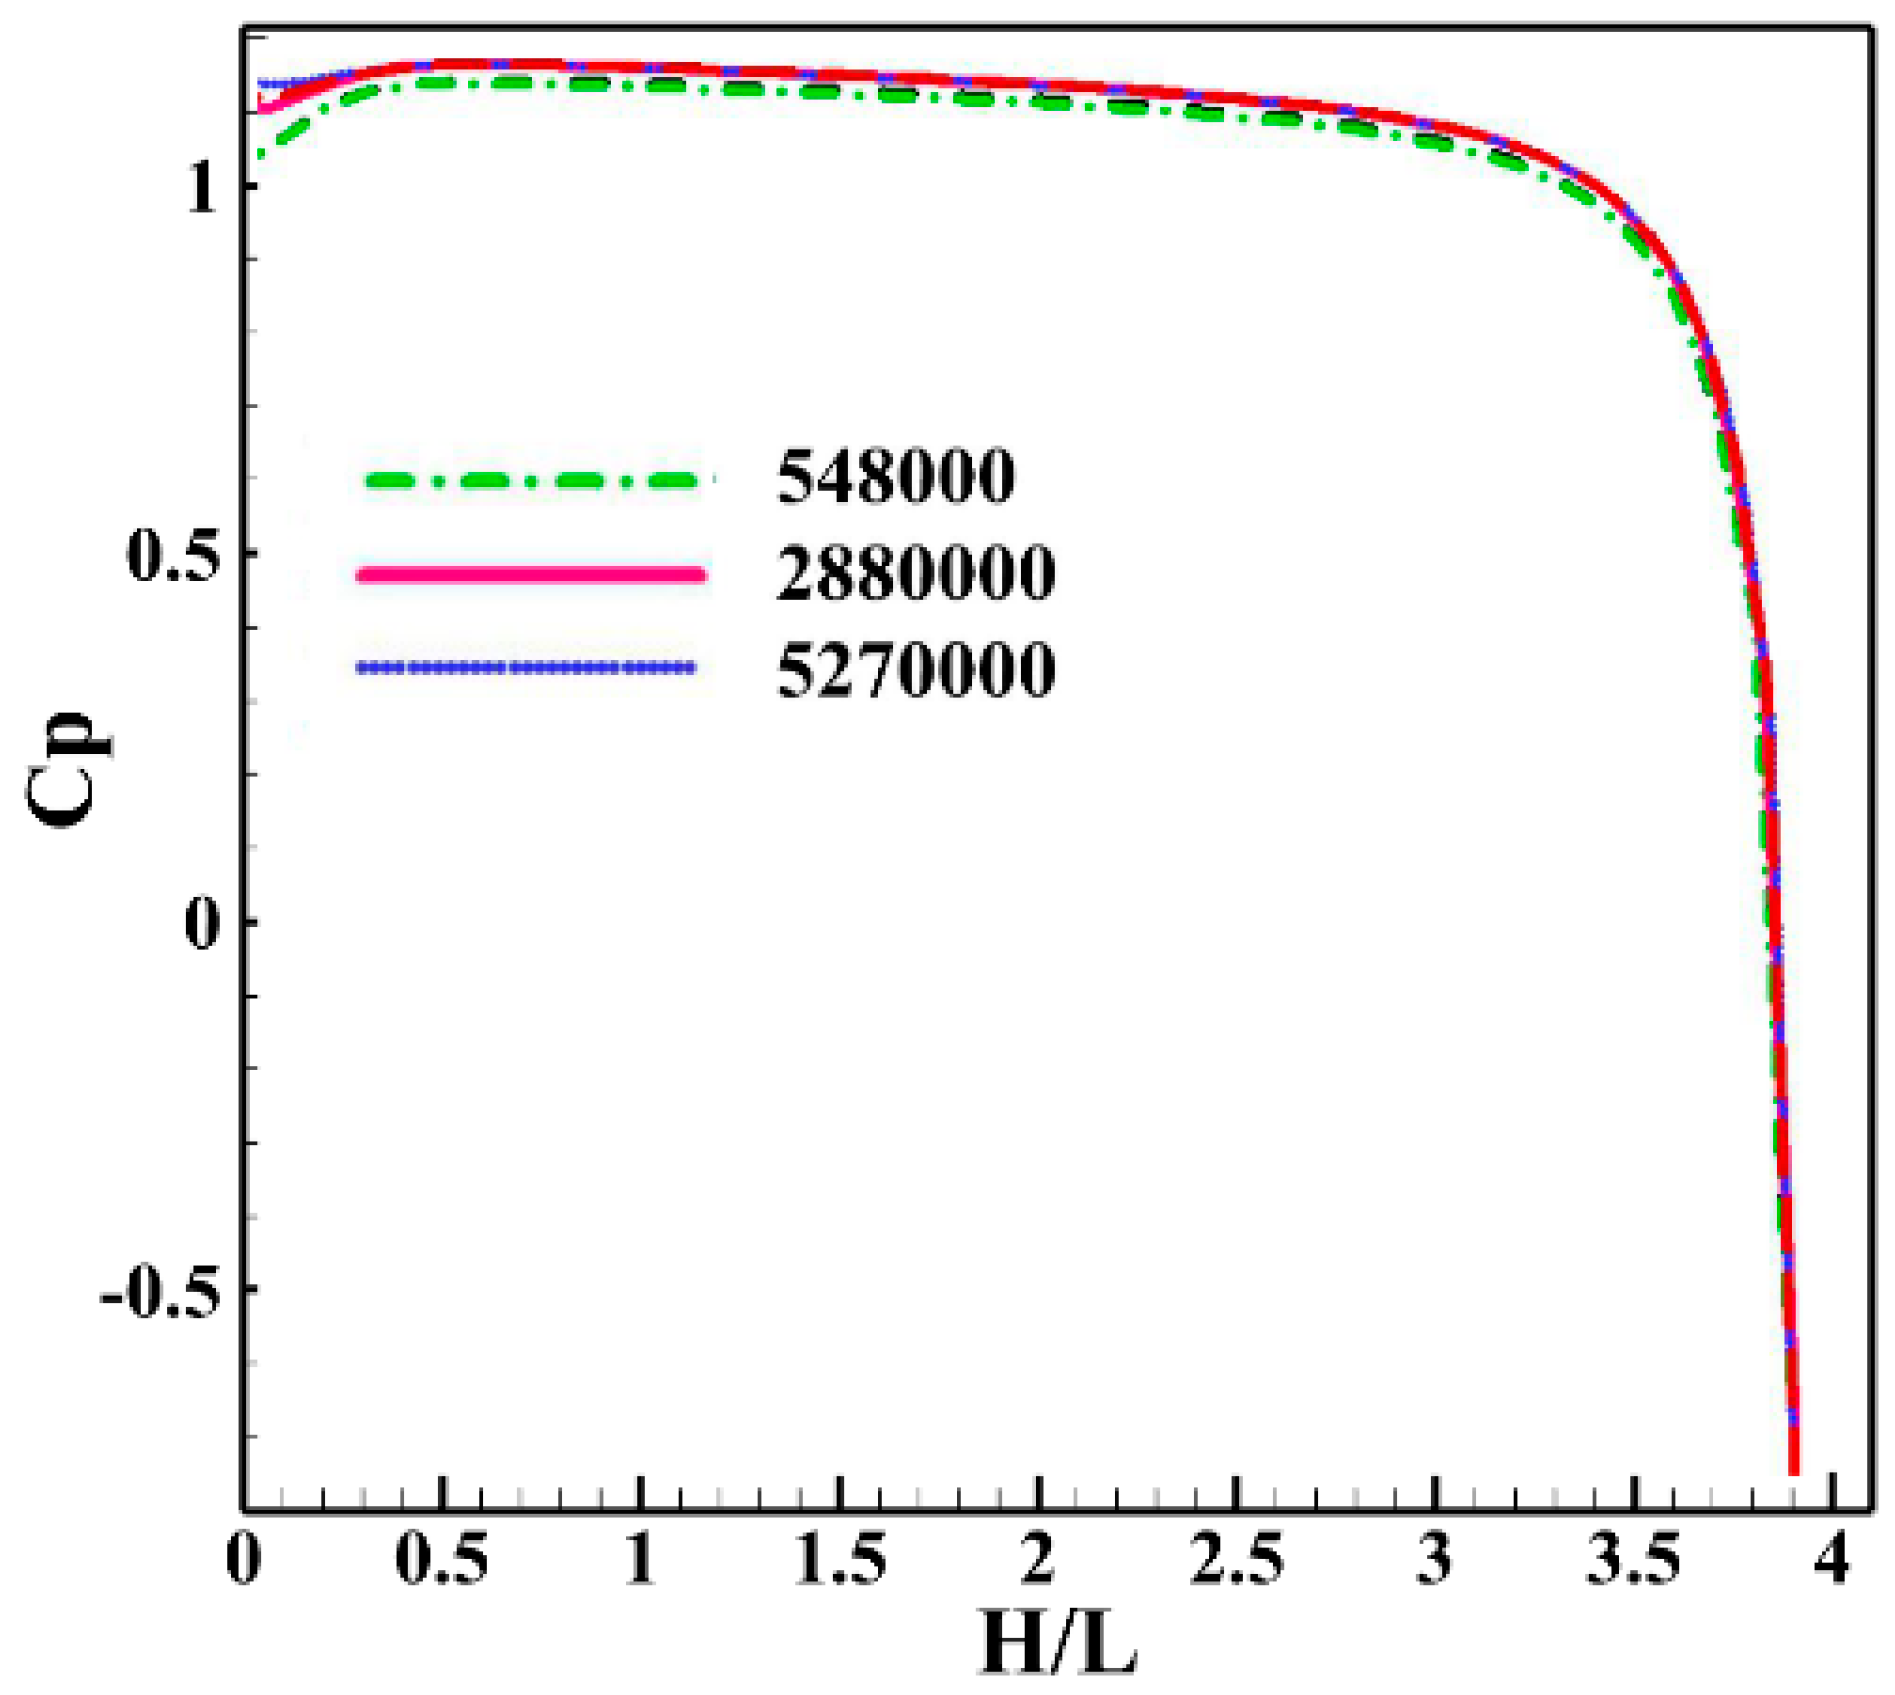
Following the delineation of the computational domain and specification of boundary conditions for the fluid flow, it is imperative to ensure mesh independence of the numerical solution. The initial step in this regard involves a systematic analysis of the impact of varying cell counts around the square building, in the context of undisturbed airflow (i.e., zero angle of attack). This analysis encompasses three grid configurations, each characterized by different cell counts. Subsequently, the drag coefficient applied to the building is calculated for these various mesh structures and the results are summarized in Table 2. Error percentages are computed according to Equation (21) to quantify the disparities between the numerical and experimental drag coefficients. Notably, Table 2 reveals that a mesh exceeding 2,880,000 cells yields the drag coefficient closest to experimental data. Mesh independence with respect to the pressure coefficient is assessed on the frontal side of these three grid configurations, as depicted in Figure 3.
For the purpose of validation, a subset of the computed results is compared with published experimental data [42]. This comparative analysis demonstrates a remarkable alignment between the numerical simulations and experimental measurements, as detailed in Table 3. Particularly at lower angles of attack, the error differences between the experimental and numerical data remain under 5%, while in cases of higher angles of attack, the disparity increases to 11%. Furthermore, Table 3 provides these comparative assessments for square high-rise buildings across a spectrum of attack angles and two distinct Reynolds numbers. The close agreement observed in these coefficients underscores the accuracy of the numerical simulation.
4. Result and Discussion
This research encompasses an examination of the factors that significantly influence the aerodynamics of high-rise buildings. Subsequently, we explore the sensitivity of these factors to aerodynamic loads by using the continuous adjoint approach and propose aerodynamic adjustments by employing the discrete adjoint method. One of the foremost challenges in numerical simulations of environmental wind flow pertains to the accurate modeling of flow separations and vortices occurring around complex structures. Initially, the authors sought to simulate this flow by using Reynolds-averaged Navier-Stokes (RANS) equations [43,44,45,46]. However, the Reynolds averaging technique of the RANS approach filters out a portion of the fluctuating flow information that is essential for capturing the dynamic interactions of structures, rendering the results less reliable. To address these limitations, large eddy simulation (LES) was considered as an alternative turbulence modeling approach, on the basis it explicitly resolves the larger turbulence eddies while modeling the smaller-scale eddies through sub-grid scale models. Nevertheless, LES necessitates a fine mesh in the boundary layer and near-wall regions to accurately capture the minor disturbances, which can substantially increase computational costs. Consequently, a hybrid turbulence model known as detached eddy simulation (DES) was adopted in subsequent sections [47,48]. DES combines the strengths of RANS and LES, allowing for a more cost-effective yet accurate simulation of turbulent flows around three-dimensional high-rise buildings. Given the complex three-dimensional nature of the solution domain and the turbulent nature of flow around high-rise structures, a thorough examination of various turbulence models is imperative to identify the most suitable model for enhancing the accuracy of the simulations.
4.1. Effects of Turbulence Models
In the scope of this research, a systematic investigation into the performance of various turbulence models has been undertaken, with the objective of identifying the most suitable model for simulating the aerodynamics of tall buildings. To achieve this aim, numerical simulations of the airflow around a square tall building were conducted, by using different turbulence models that operated under the conditions of zero wind flow angle and a Reynolds number (Re) of . The simulation results were rigorously compared with experimental data [42] to evaluate the accuracy and reliability of each turbulence model. These comparative assessments are summarized in Table 4.
The findings of this comparative analysis reveal that the delayed detached eddy simulation (DDES) turbulence model exhibits the smallest deviation from the experimental results, and it can consequently be inferred that DDES is the most suitable and accurate turbulence model for simulating the aerodynamics of high-rise buildings. This research does not only shed light on the significance of turbulence modeling in tall building simulations but also underscores the practical utility of DDES in achieving the highest level of fidelity in such simulations.
4.2. Investigation of Effective Parameters on the Aerodynamics of High-Rise Buiildings
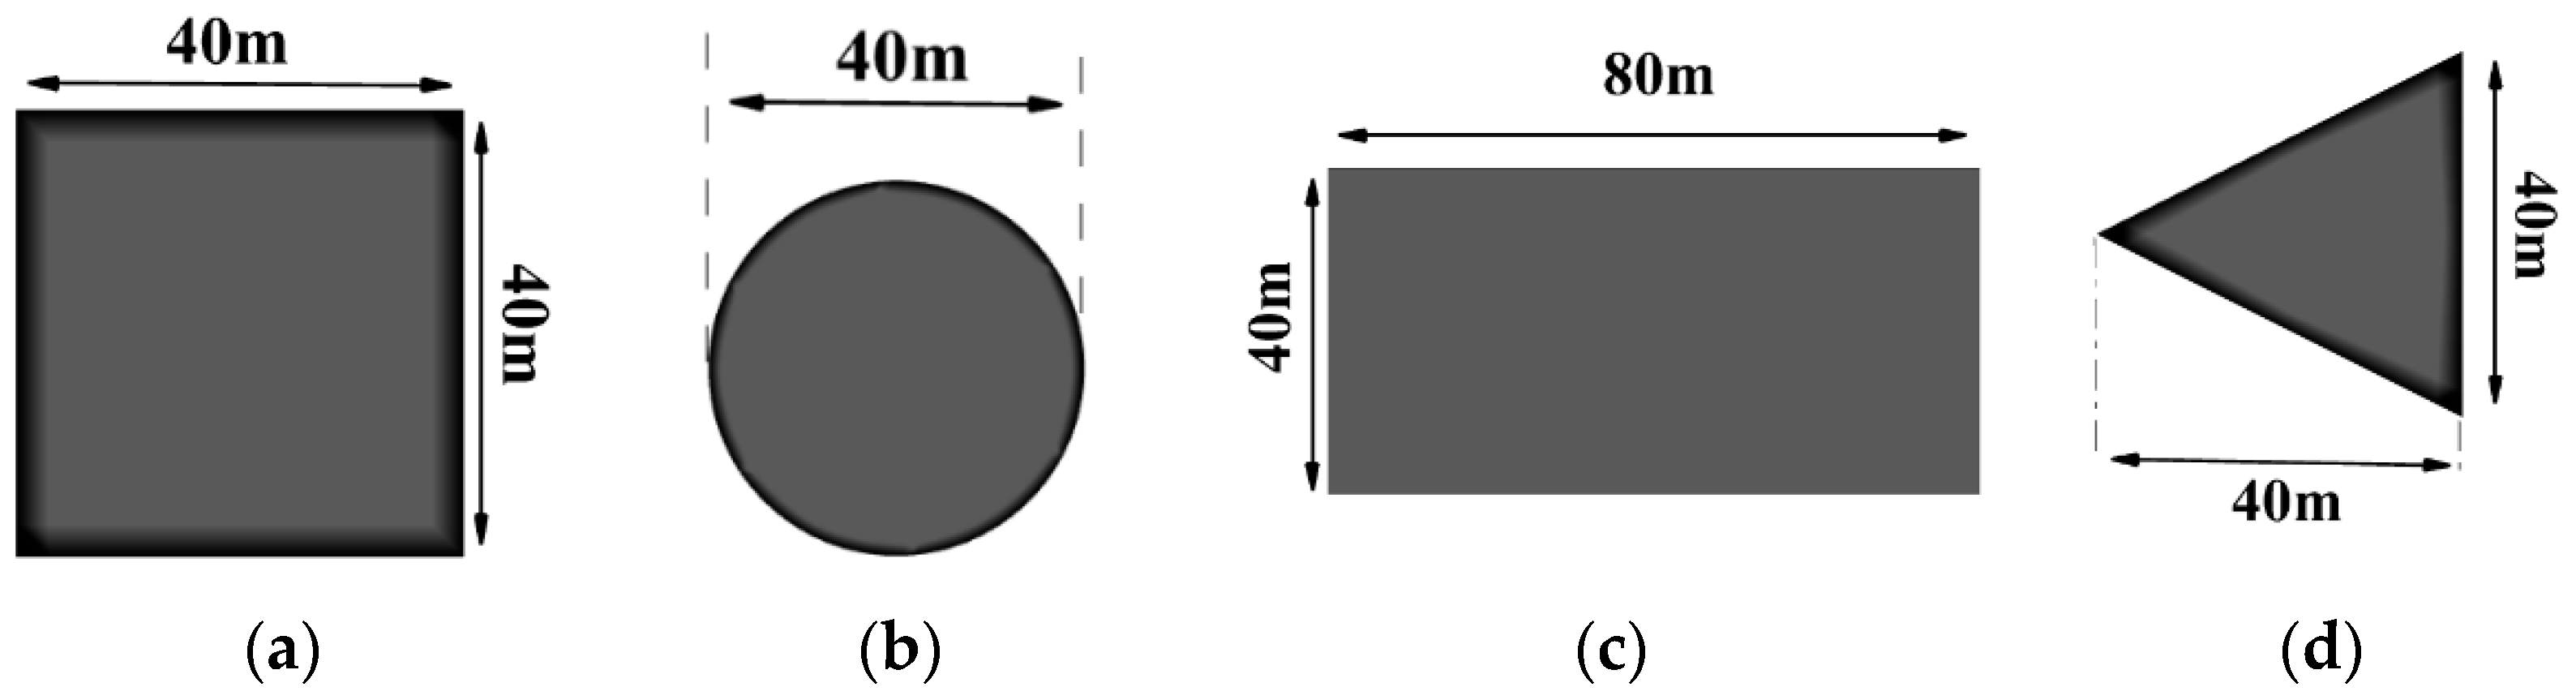
As previously outlined, this research encompasses a comprehensive examination of four key parameters: the building’s cross-sectional shape; the wind flow direction within the range of 0 < φ < 30 degrees; the positioning of the building at φ = 180 degrees, relative to the wind; and the fluid conditions. Of these parameters, the cross-sectional shape of the building is of paramount importance to understanding and influencing the aerodynamics of high-rise structures. To investigate the impact of cross-sectional shape, this study considered four distinct building shapes: square, circular, rectangular, and triangular. The drag coefficients associated with each shape are detailed in Table 5. The findings reveal that the circular building, characterized by its unique shape, exhibits the lowest drag coefficient, while the square cross-sectional building experiences the highest drag coefficient. Figure 4 provides visual representations of the dimensions and configurations of these diverse cross-sectional shapes. The outcomes of this investigation underscore the profound influence of the building’s cross-sectional geometry on its aerodynamic performance; this insight offers valuable guidance to architectural and engineering considerations, and therefore has direct implications for the design and optimization of high-rise structures.
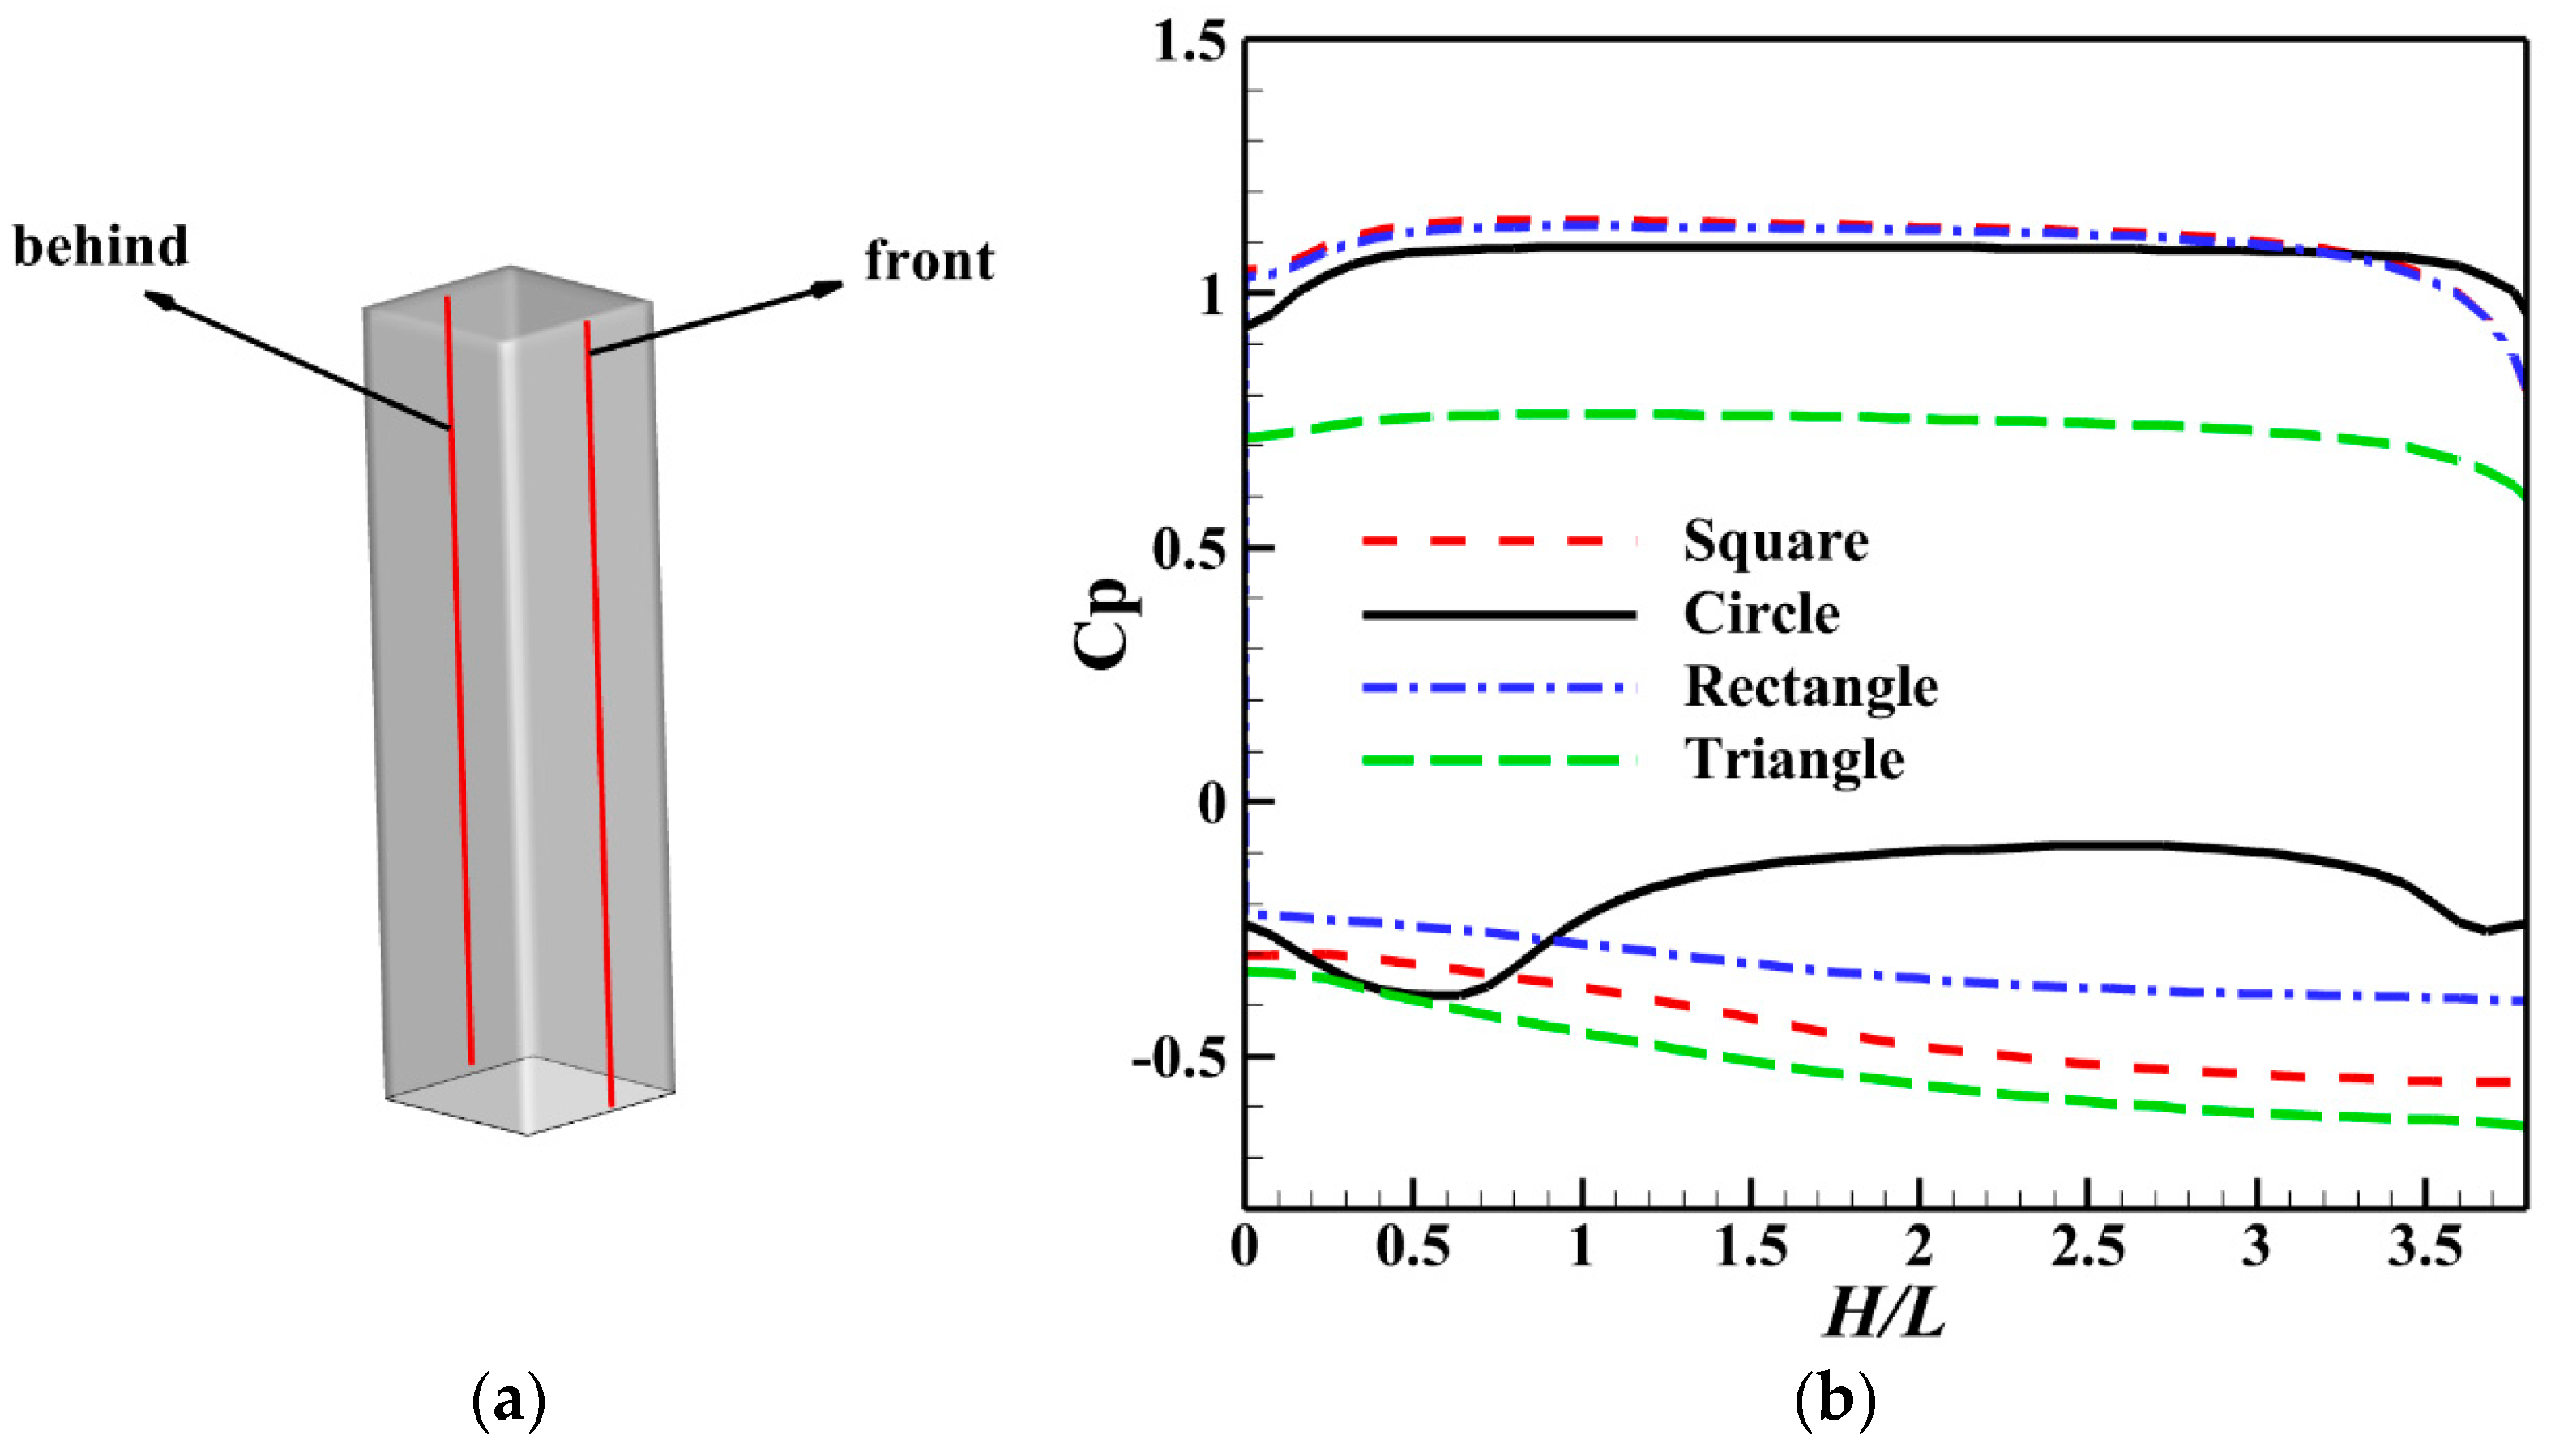
Furthermore, Table 5 offers a comparative analysis of drag coefficients under varying flow conditions, revealing an intriguing trend. Specifically, the data illustrates that, in general, drag coefficients tend to decrease with increasing wind speed, a phenomenon observed for most buildings with cross-sectional shapes. However, a noteworthy exception to this trend is observed for triangular and circular cross-sectional buildings, where the deviation from the expected decrease in drag coefficient can be attributed to the formation of boundary layers on their surfaces. The unique characteristics of circular buildings warrant particular attention when seeking to explain the lower drag coefficient they exhibit. The underlying reason for this phenomenon can be traced to the distinct pressure coefficient distribution on the front and back surfaces of the building, as depicted in Figure 5. This figure provides a vertical comparison of pressure coefficient distributions for various building shapes, and the key insight that emerges is the pressure difference between the front and rear surfaces. When this difference is more pronounced, it leads to an increase in drag force. Notably, the circular building stands out by maintaining lower pressure differences between its front and rear surfaces, as Figure 5 illustrates.
It is important to note that the pressure coefficient on the front surfaces is consistent across circular, square, and rectangular buildings. However, a substantial decrease in this coefficient is observed for triangular buildings. This unique behavior arises from the shape of the building, which facilitates the easy passage of fluid flow, resulting in a significant reduction in stagnation pressure on the front surface. When the pressure difference is lower, so is the drag force experienced by the building. Figure 5 clearly shows that circular buildings exhibit the lowest pressure difference of all building shapes.
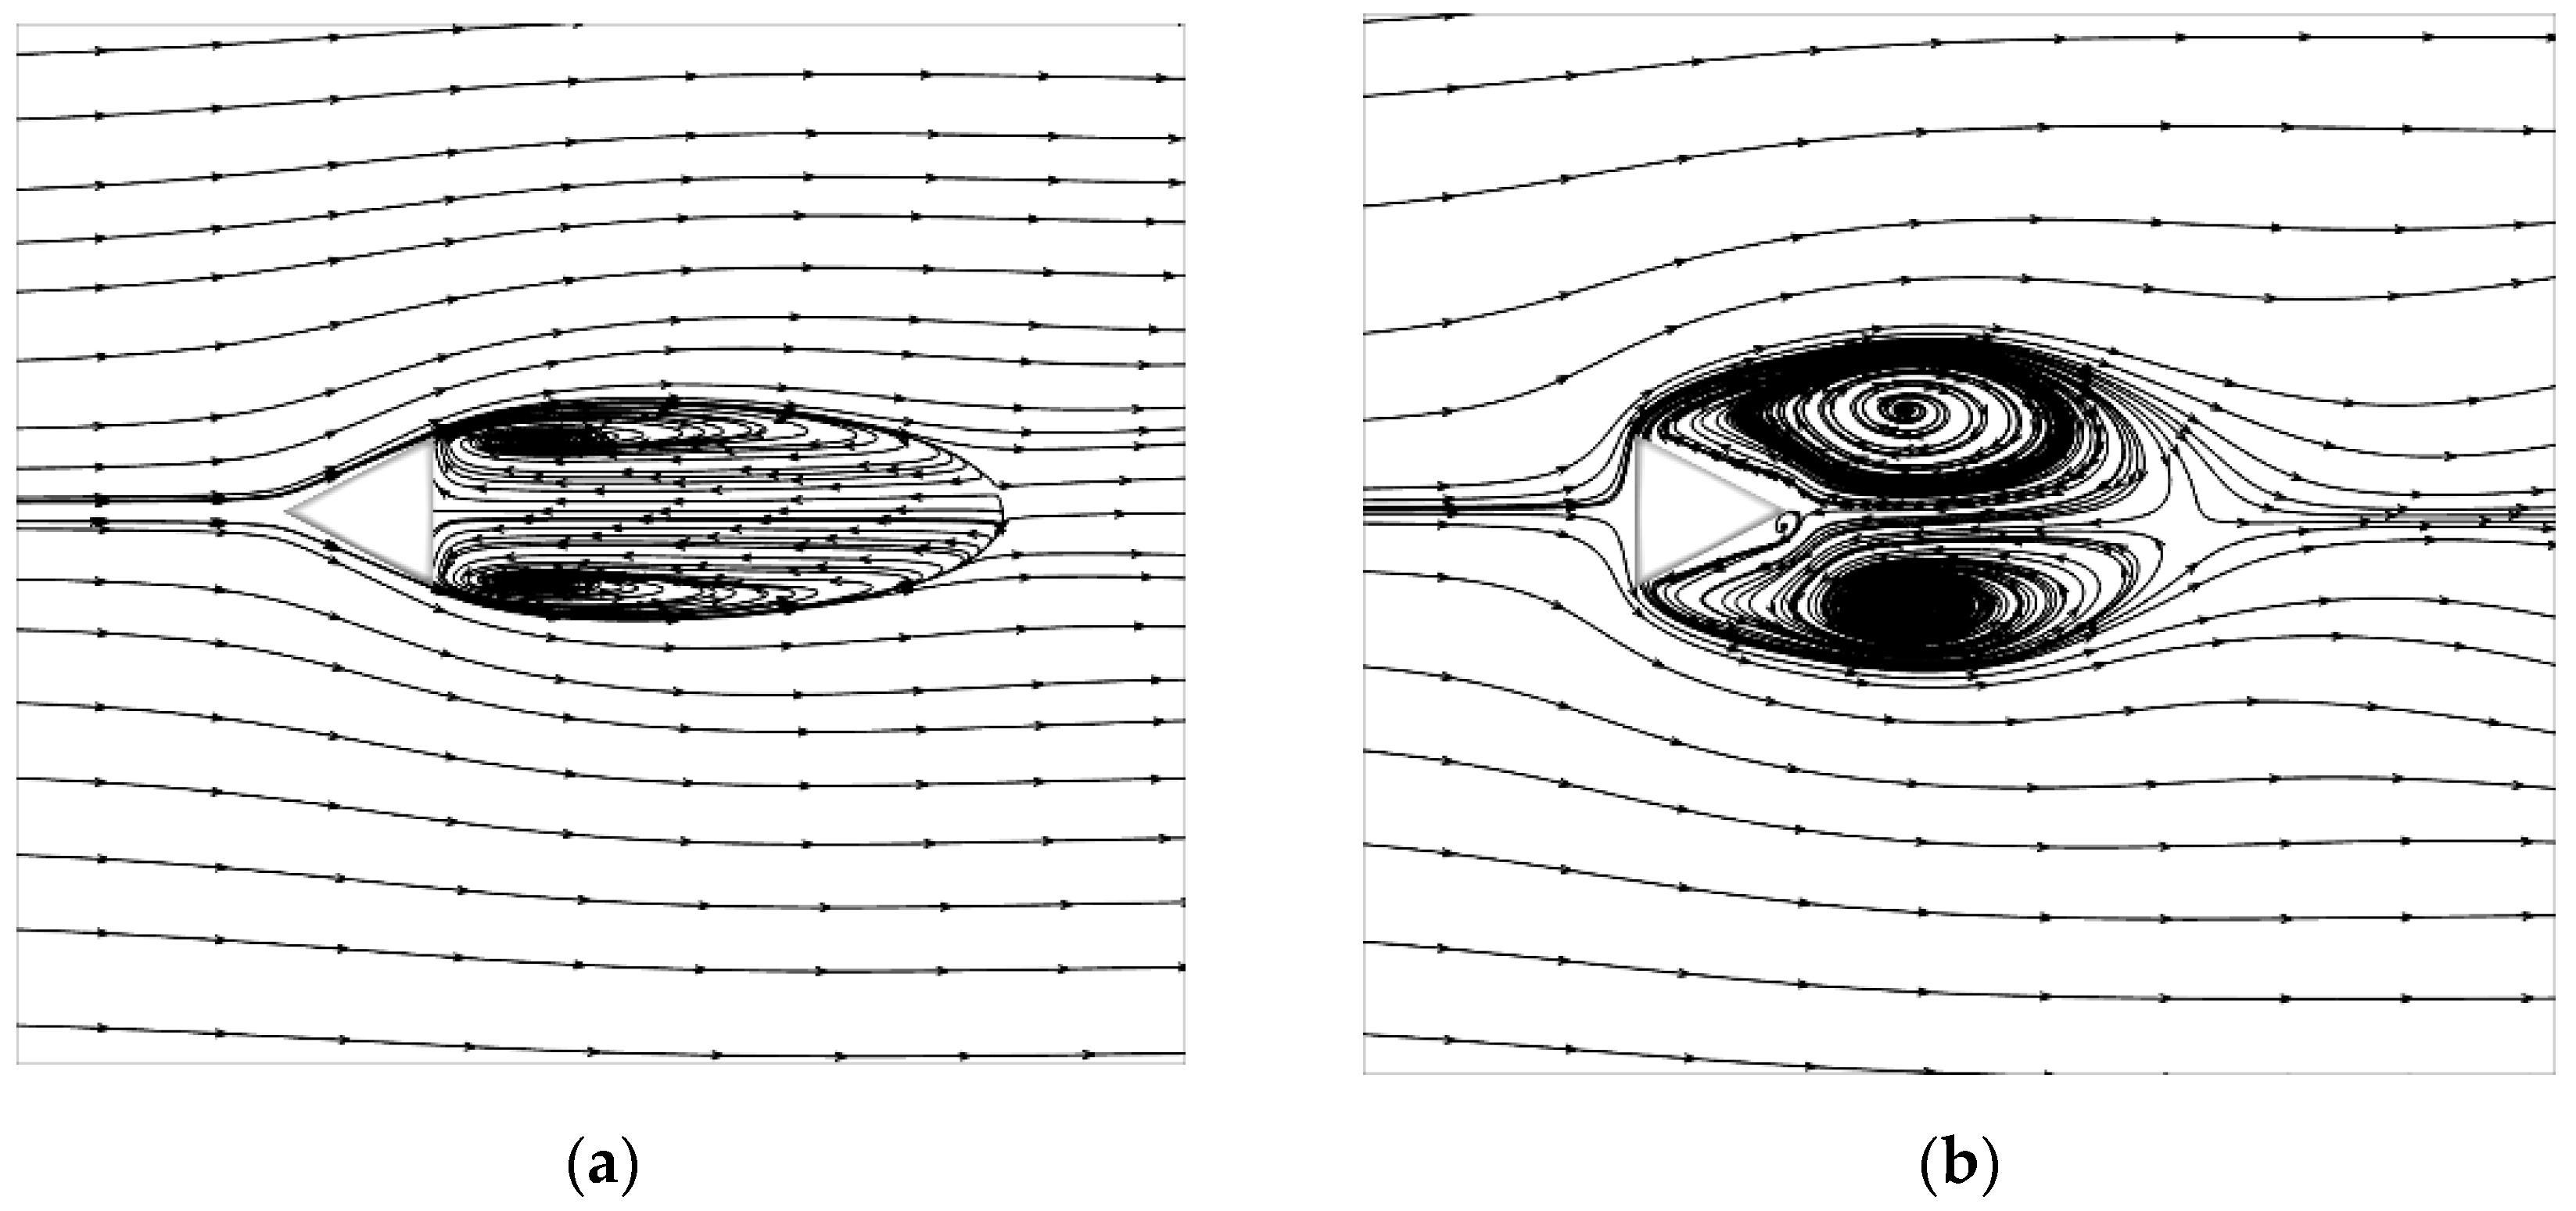
It is crucial to underscore that the positioning of the structure (φ = 180) in relation to the incoming wind plays a significant role in determining wind loads. The flow field around the triangular building compellingly illustrates this phenomenon. In Figure 6, the streamline patterns for the mentioned building are presented in two distinct positions, shedding light on the influence of orientation on generated vorticity. A marked increase in vorticity is observed behind the building when it is positioned in the converse direction, as opposed to the direct position. The primary driver of this phenomenon is the triangular shape of the building, as this geometric configuration facilitates the smooth passage of fluid flow, causing a rapid decrease in stagnation pressure on the front surface. Consequently, a significant generation of vorticity ensues when the building is positioned in the converse direction.
This observation underscores the critical role that structural orientation plays in shaping the aerodynamic behavior of buildings, especially those with unconventional cross-sectional shapes. Wind load assessments of, and design considerations for, such structures must take into account the complex interactions that arise from different positioning scenarios.
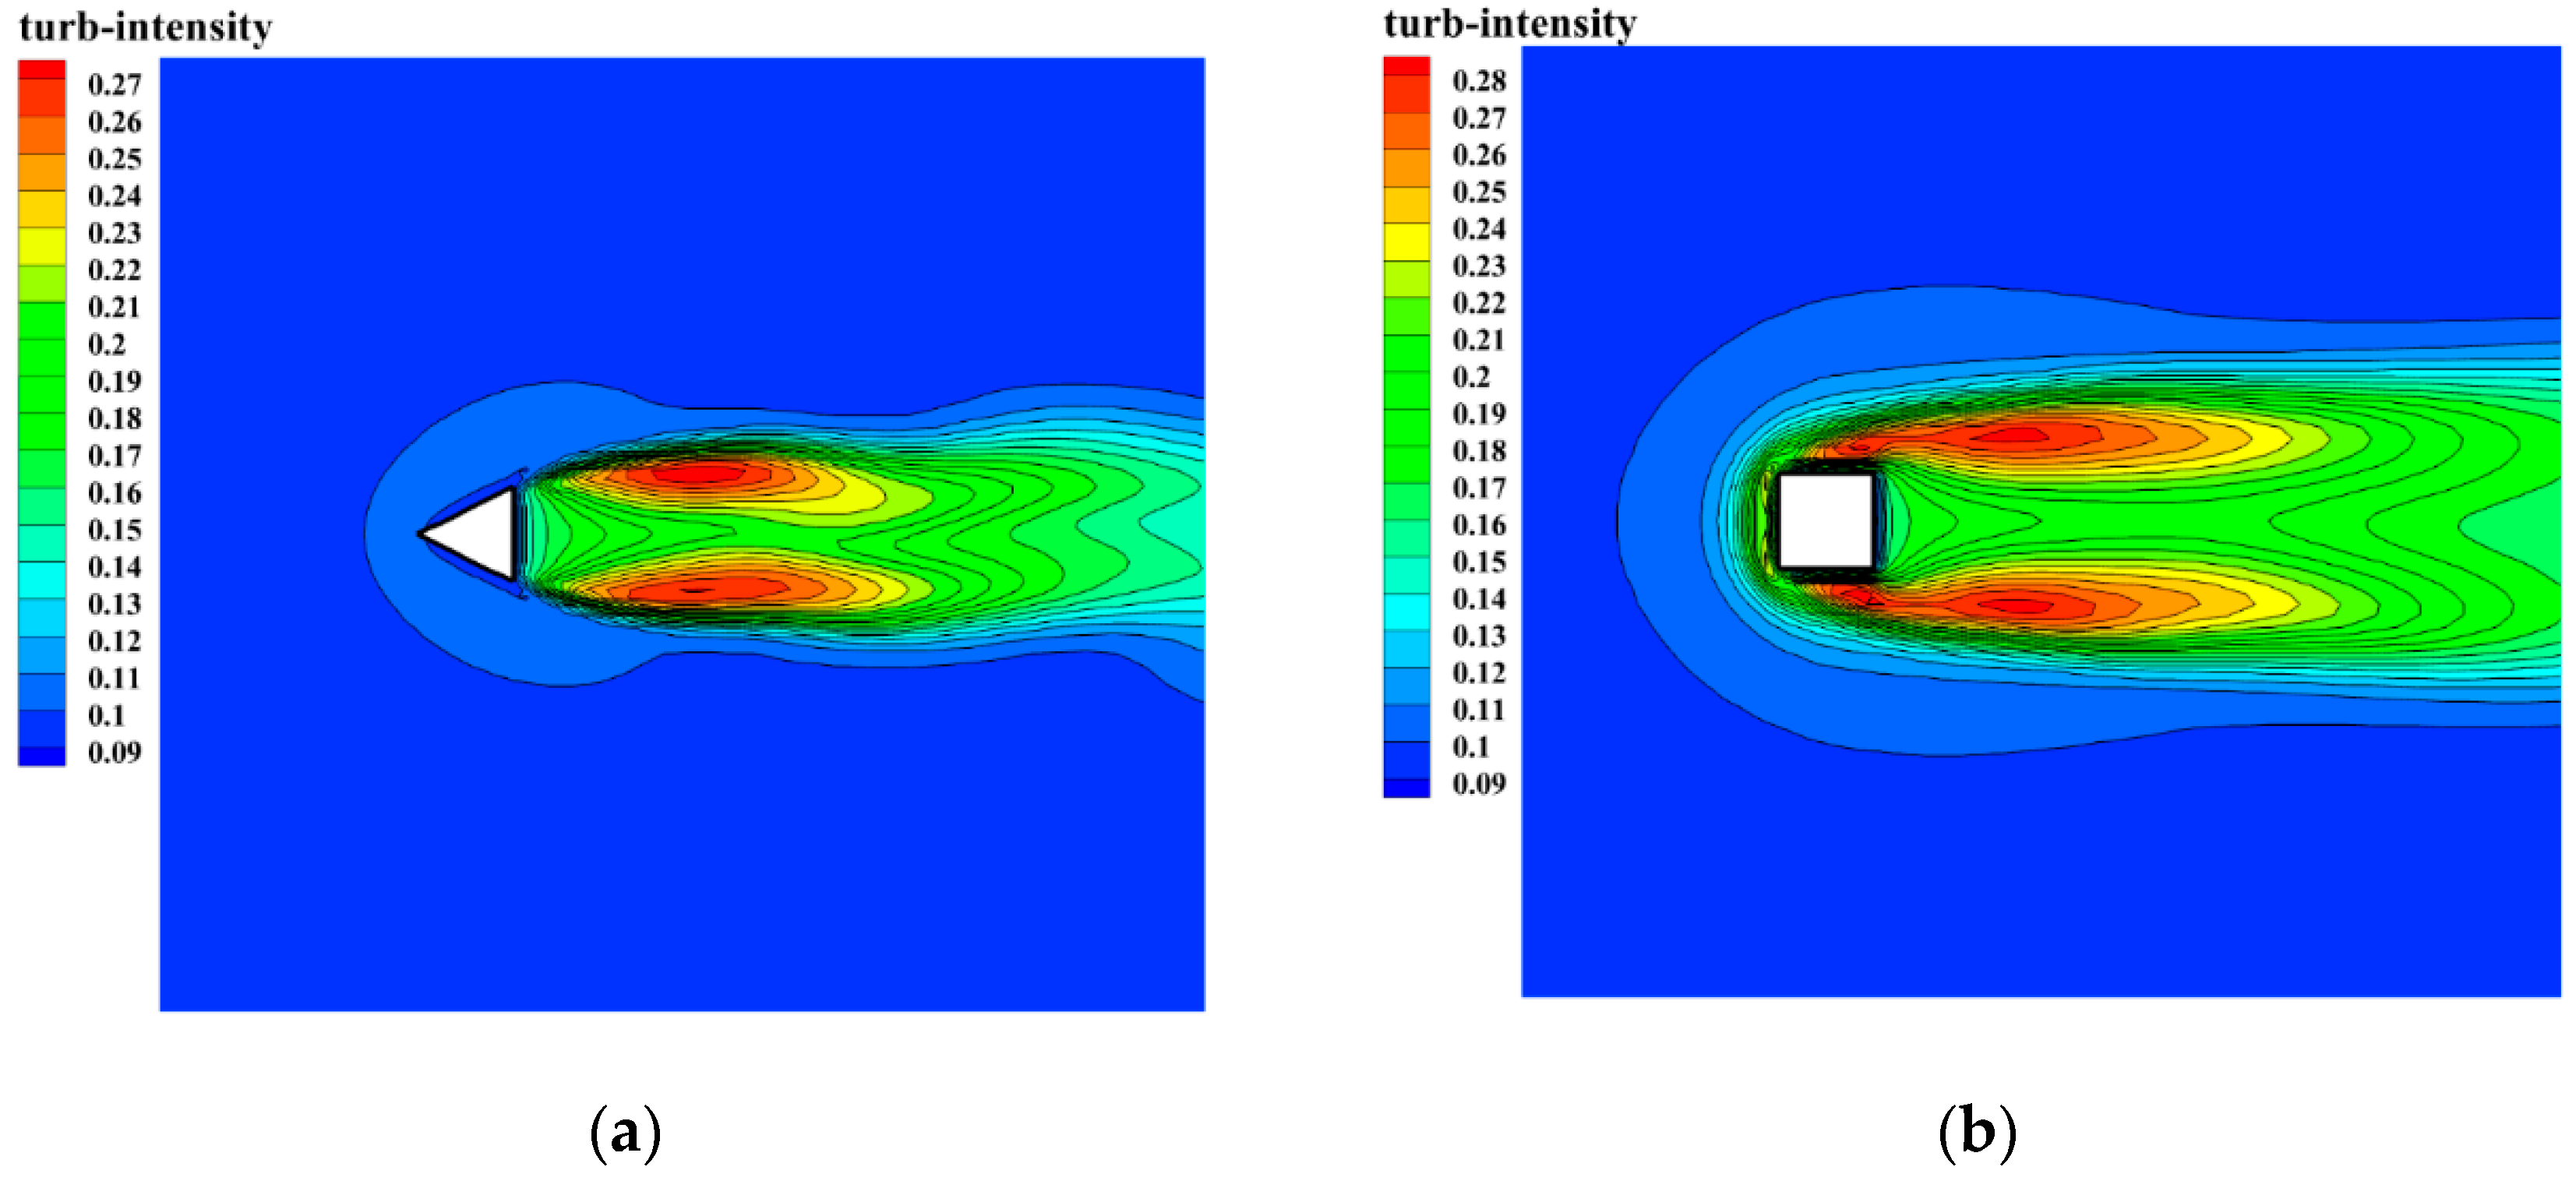
The findings clearly show that turbulence intensity is notably lower in the vicinity of triangular buildings. The contour plots of turbulence intensity, as shown in Figure 7, highlight this disparity, particularly when triangular and square building configurations are compared. The visual representation underscores that turbulence intensity around the square building surpasses that around triangular structures, revealing a notable discrepancy.
The distinctive turbulence characteristics observed in this context are primarily attributed to the building’s geometry. The unique shape of a building, such as a triangle, creates a flow pattern that tends to minimize turbulence intensity in its immediate surroundings. In contrast, square buildings exhibit a flow behavior that results in stronger turbulence intensity, as indicated by the contour plots. This finding offers valuable insight into the impact of building shape on turbulence patterns and intensity, which has direct implications for architectural design and engineering considerations, particularly in contexts where turbulence mitigation is of importance.
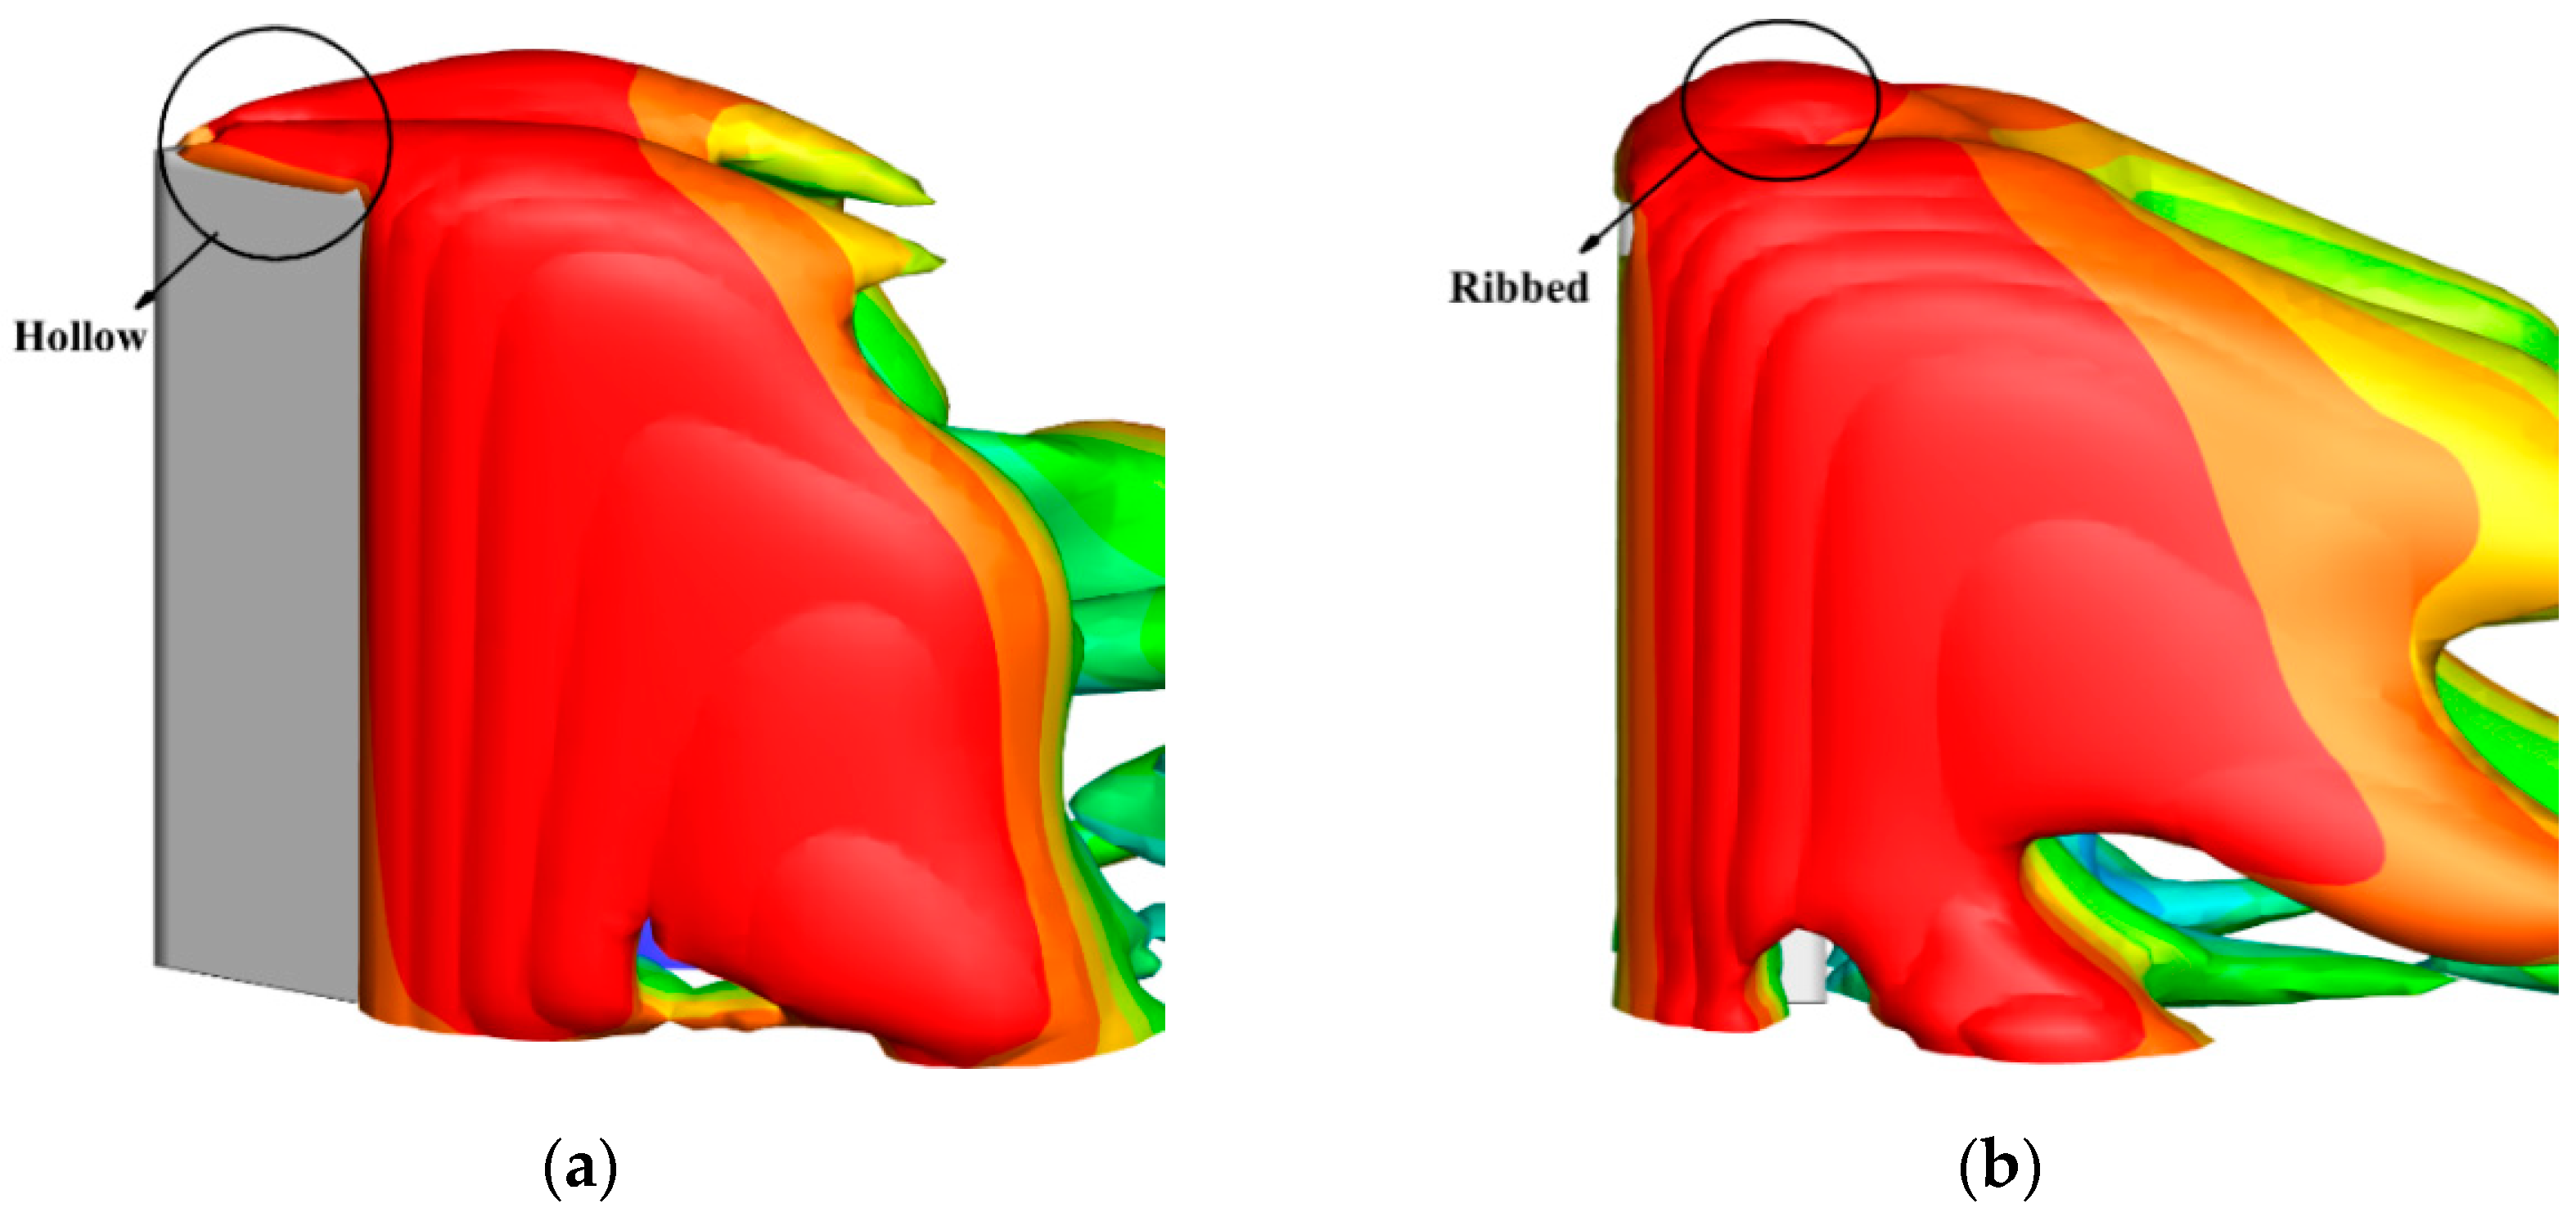
Figure 8 offers a series of instantaneous snapshots that depict a Q-criterion (Q = 50) iso surface, presenting a visual tool to examine the structure of vortices in the flow field. These snapshots correspond to a specific moment, marking the conclusion of an actuation cycle when the shear layer roll-through commences for the first time. It is essential to note that, in the context of the Q-criterion, a value of Q > 0 indicates that the rotation rate dominates over the strain rate, effectively identifying the presence of a vortex core [49].
The Q-criterion visualization in Figure 8 unequivocally verifies the existence of substantial vortices behind the buildings under consideration. Furthermore, it is notable that the Q-criterion generated by the edges of the tall buildings exhibits significant variations in the building’s direction, not least because, in reality, the distinct flow behavior induced by the edges of both triangular and square buildings leads to the rotation of fluid flow behind the structures. In order to gain a deeper understanding, it is worthwhile to first highlight that vortices appear to roll up incrementally in case ‘a’ within Figure 8, with the presence of these structures further upstream appearing to enhance the momentum transfer over a larger region of the buildings. This phenomenon aids in diminishing the separation over time by re-energizing the flow near the building’s surface, thus assisting it in overcoming unfavorable pressure gradients. As a result, the most discernible difference in the vortical structures of these two building types lies in the formation of vortical bubbles at the top of the building and their streamwise characteristics. Specifically, the vortical structures generated by triangular buildings exhibit a ribbed appearance, while those associated with square buildings appear hollow in nature. These distinctions in vortical structure can have significant implications for aerodynamic performance and energy exchange within the flow field around high-rise buildings.
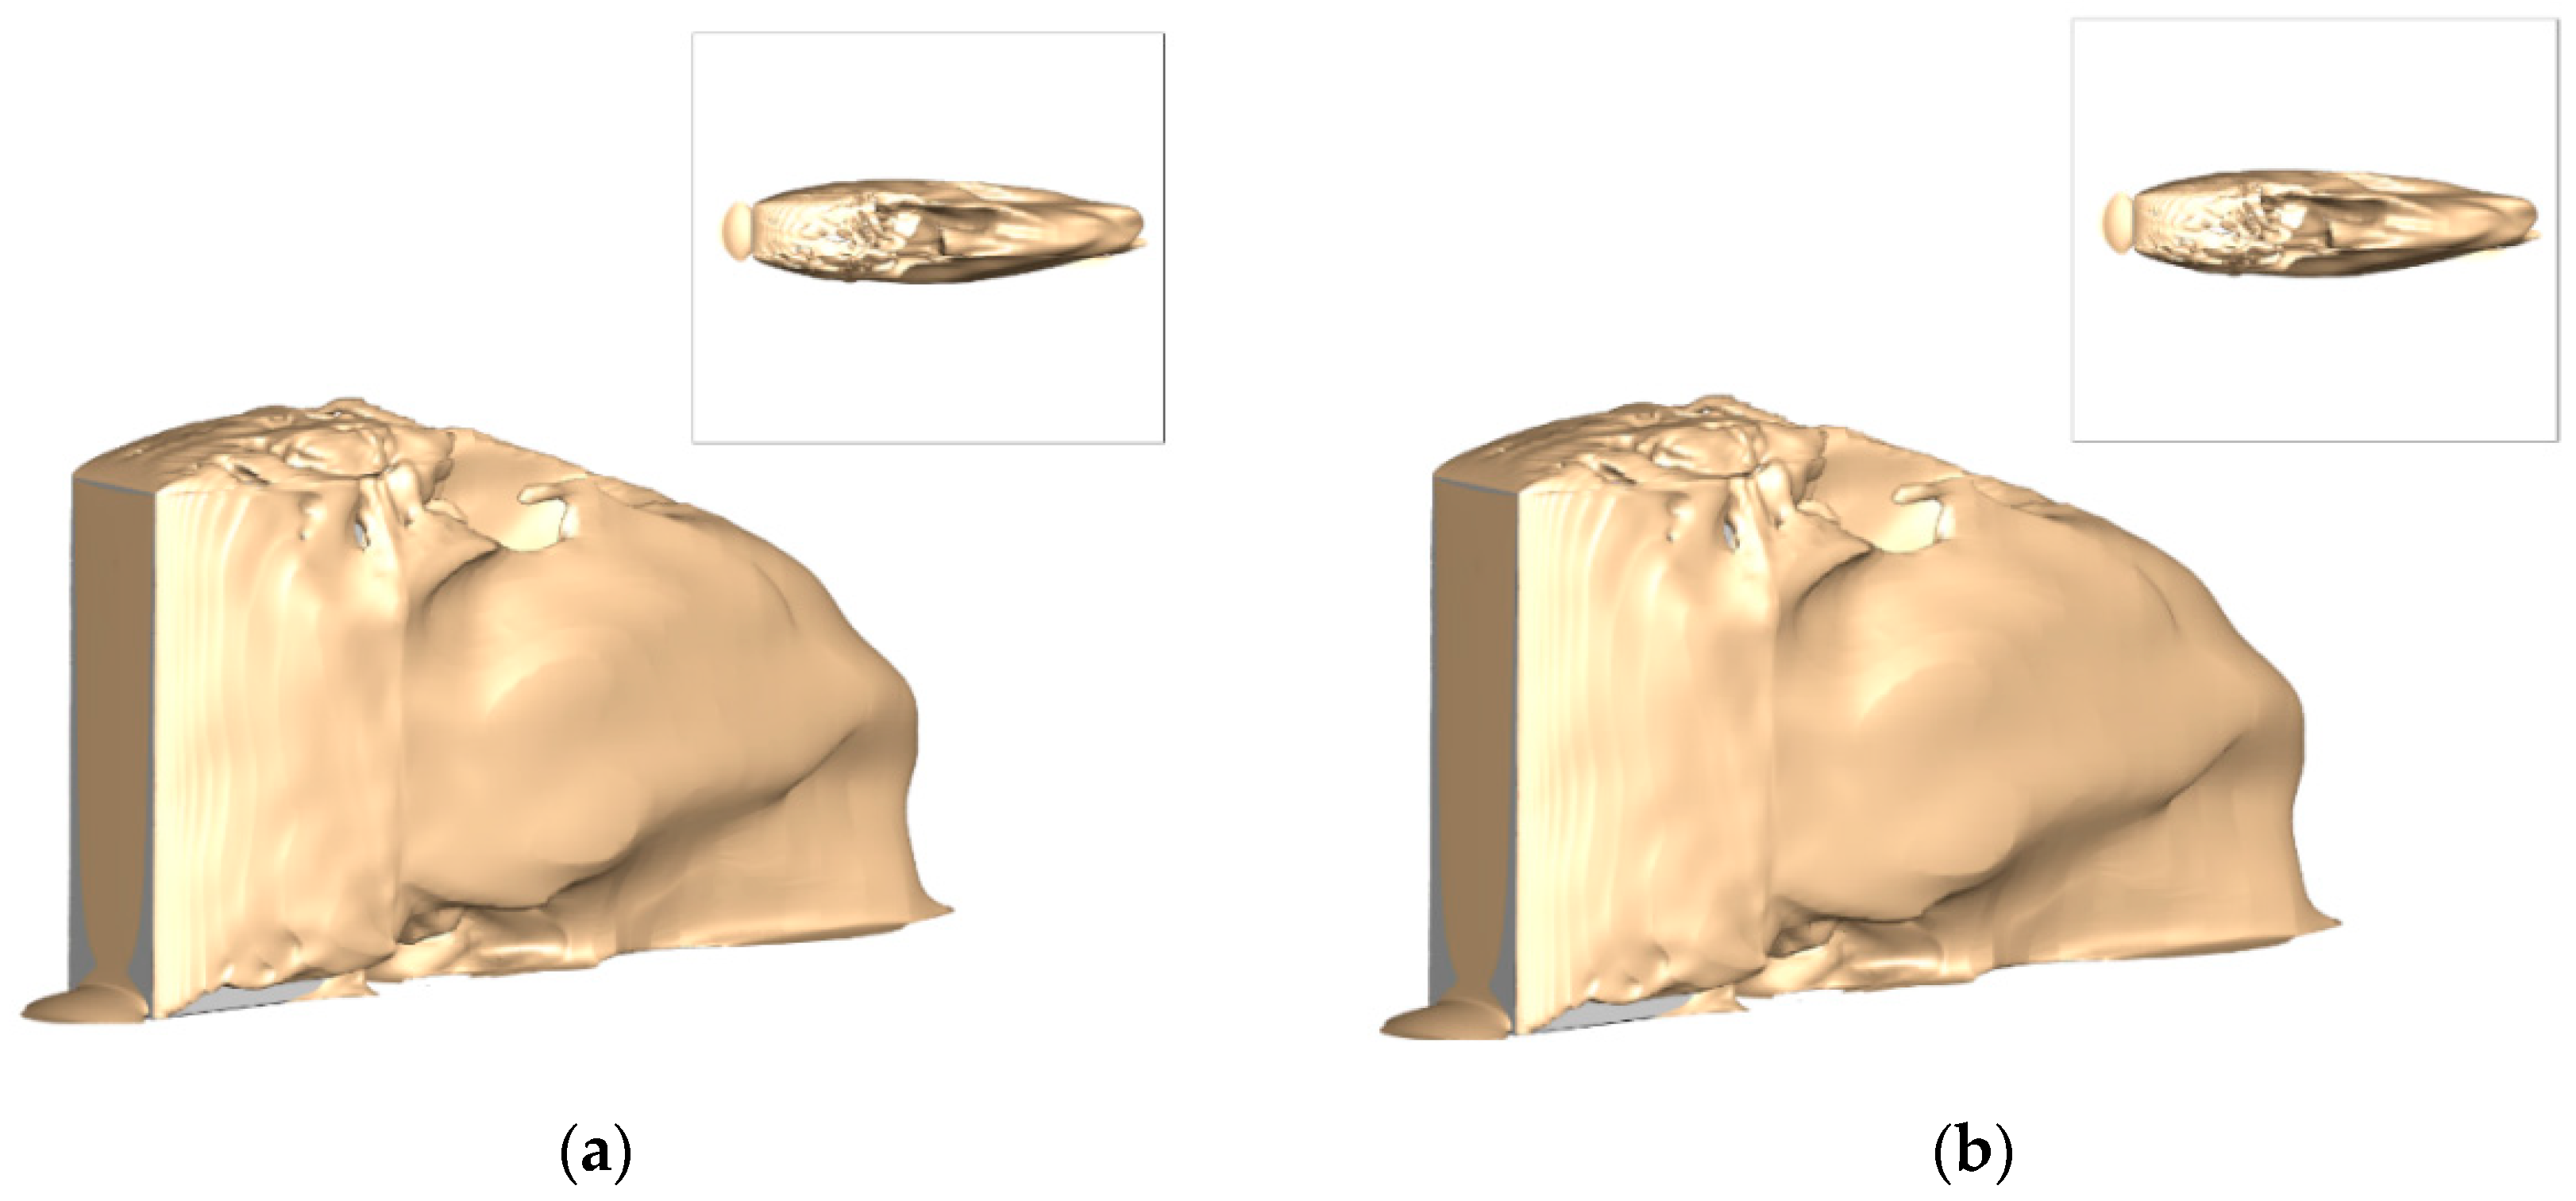
The comparison of the drag coefficients of different building shapes reveals an interesting observation: the rectangular building exhibits a lower drag coefficient than the square construction. This outcome can be attributed to the unique geometry of the rectangle, where the length of one side exceeds that of the square building, even though the width of the rectangle remains equal to the length of the square’s side. For a more profound understanding of the observed differences in drag coefficients (between rectangular and square high-rise buildings), we turn to Figure 9, which presents a visual representation of the bubble dimensions, and achieves this depiction by plotting iso-surfaces of zero-time streamwise velocity (). These iso-surfaces demarcate the interfaces between attached and separated flow regions and offer insight into the bubble structure.
It is crucial to note that the ratio of building corner edges plays a pivotal role in determining the dimensions of these bubbles. Figure 9 effectively illustrates the impact of building corner edges on bubble dimensions, with particular focus on bubble width. The visual evidence presented in the figure unequivocally indicates that the bubble size, encompassing height, length, and width, is significantly greater for a rectangular building, compared to a square building. This observation underscores a vital relationship: as the bubble size increases, there is a corresponding increase in the drag coefficient. The dimensions of these vortical structures have a direct bearing on the aerodynamic performance of high-rise buildings, with wider and larger bubbles contributing to higher drag coefficients. Consequently, the unique geometrical characteristics of rectangular buildings, and more specifically their larger bubble dimensions, offer an explanation for the lower drag coefficients observed in this context.
The direction of the wind flow and the angle at which it impinges on the building’s structure are critical factors that exert a substantial influence on the aerodynamics of tall buildings. This research encompasses a thorough exploration of these influences by examining the effects of fluid flow at various angles, including 0, 15, and 30 degrees, in the context of high-rise buildings.
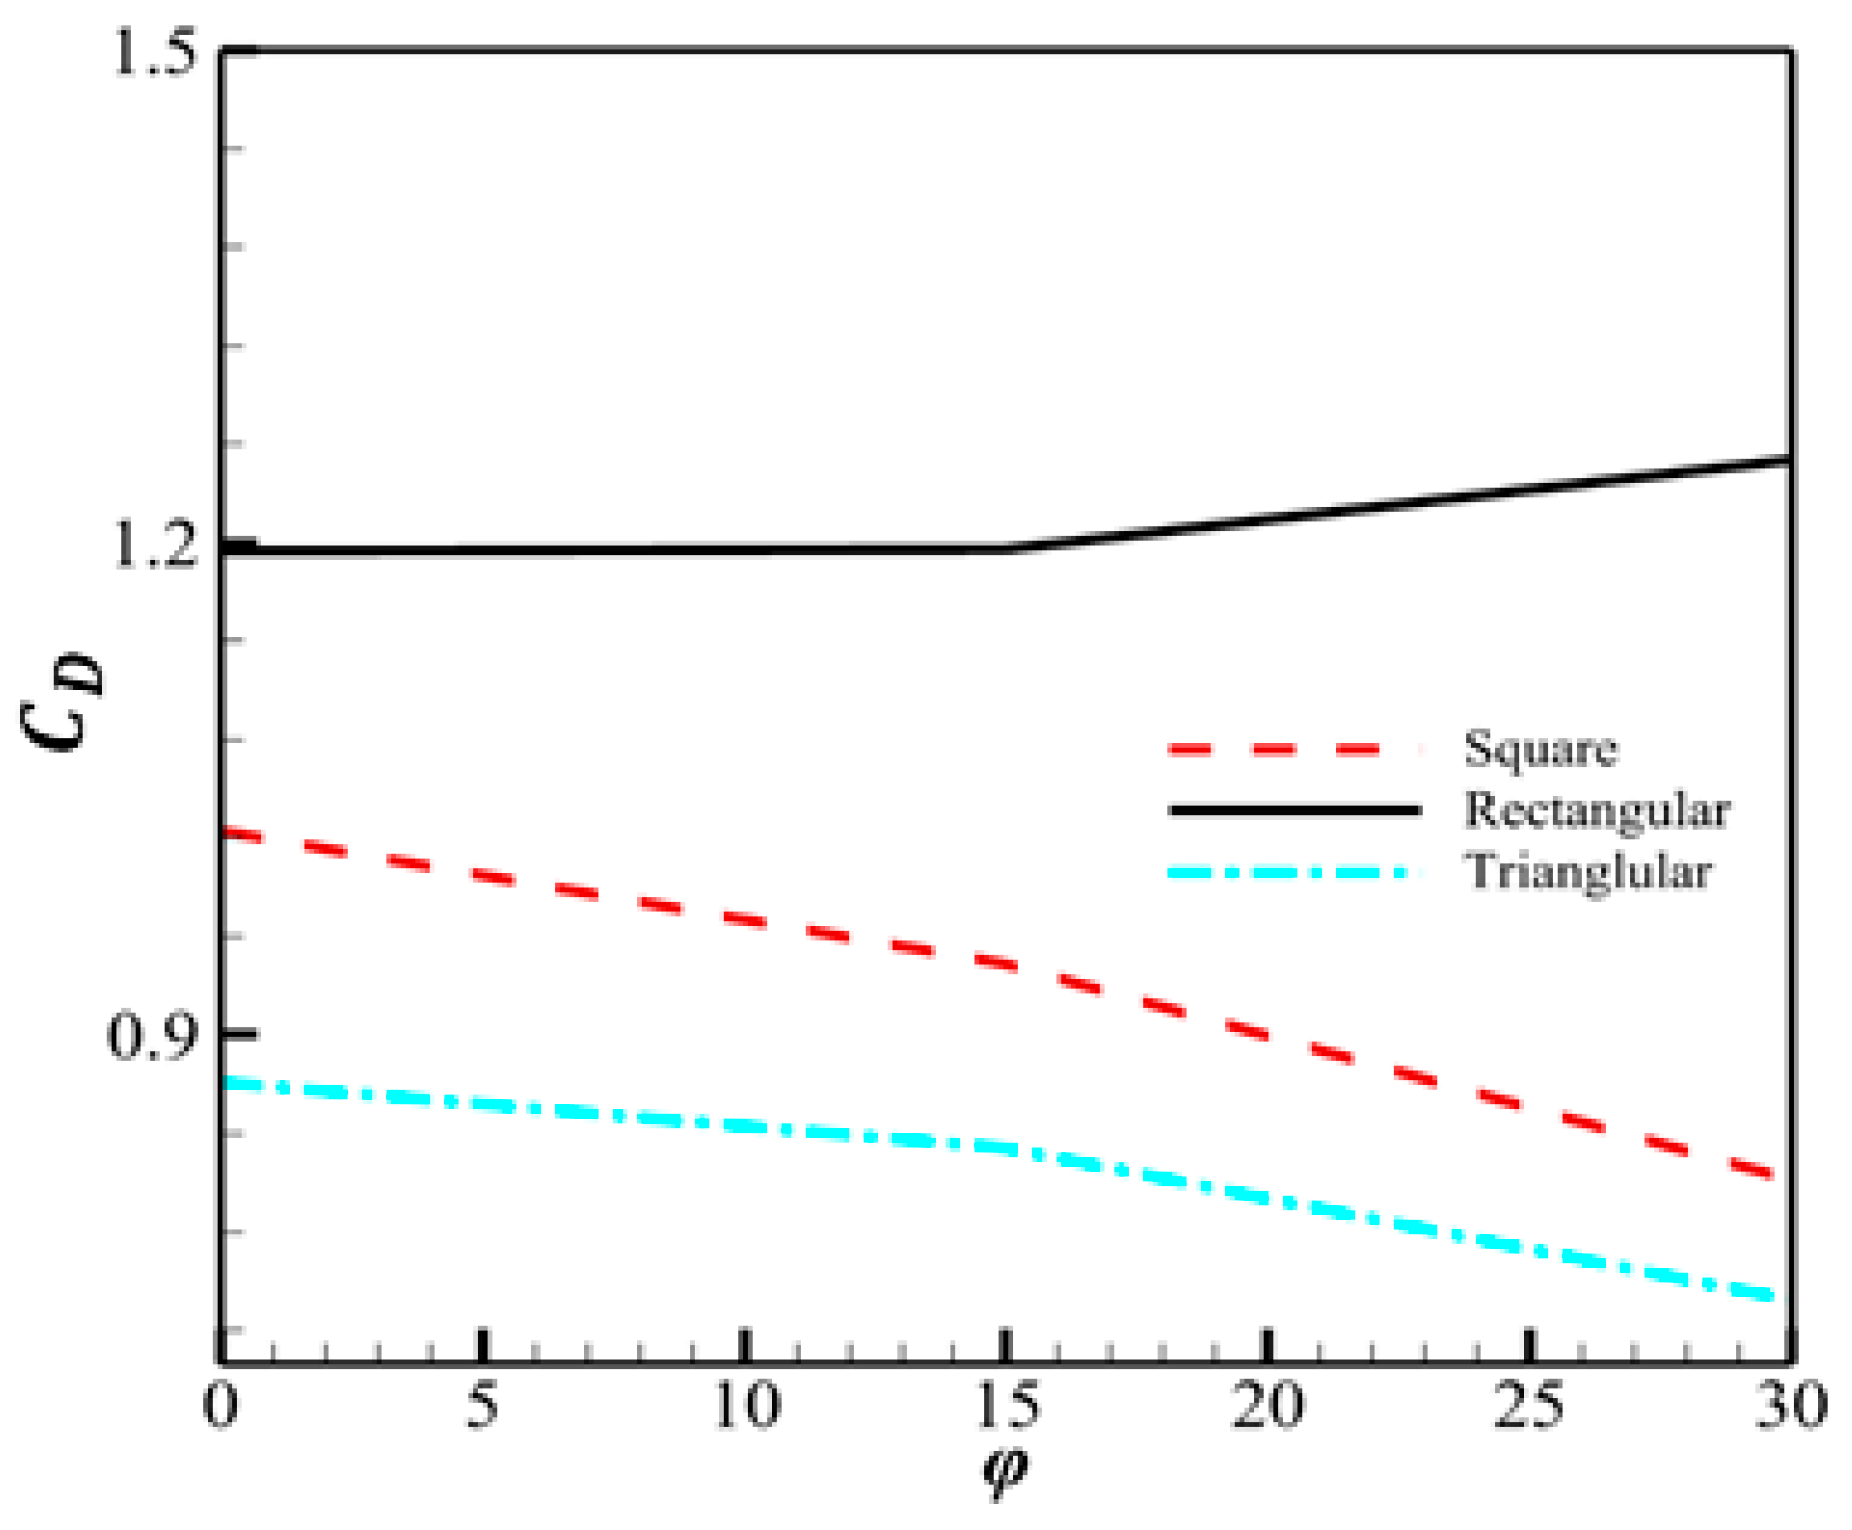
Figure 10 provides a visual representation of the results, showcasing the variations in drag coefficients for multiple buildings subjected to different attack angles. The data within the figure underscores the significant role that the angle of wind flow incidence has in shaping the aerodynamic performance of these structures. It is important to note that the drag coefficient values vary as a function of attack angle, highlighting the dynamic nature of wind-induced forces on high-rise buildings. The findings presented in Figure 10 contribute to a deeper understanding of the complex interplay between wind direction, angle of attack, and building design, offering valuable insights for architectural and engineering consideration, particularly in regions where wind loads are a critical design factor.
As depicted in Figure 10, the drag coefficient exhibits a noticeable decline as the wind flow direction (0 < φ < 30), relative to the building, increases. Notably, this trend holds true for most building shapes, with the exception of rectangular buildings, where the drag coefficient shows an increasing trend as the angle of attack rises, a unique behavior that is intricately linked to the distinctive geometric attributes of the rectangular structure or, more precisely, the rectangular building’s drag coefficient responding to the angle of attack due to its elongated shape. As the length of the building’s side surface significantly exceeds its width, an increase in the angle of attack results in a larger surface area of the building encountering the wind flow. Consequently, a more substantial obstruction is created in front of the flow, leading to an increase in the drag coefficient. These dynamics highlight the role of geometry in shaping the aerodynamic response of high-rise buildings to varying wind directions and angles of attack.
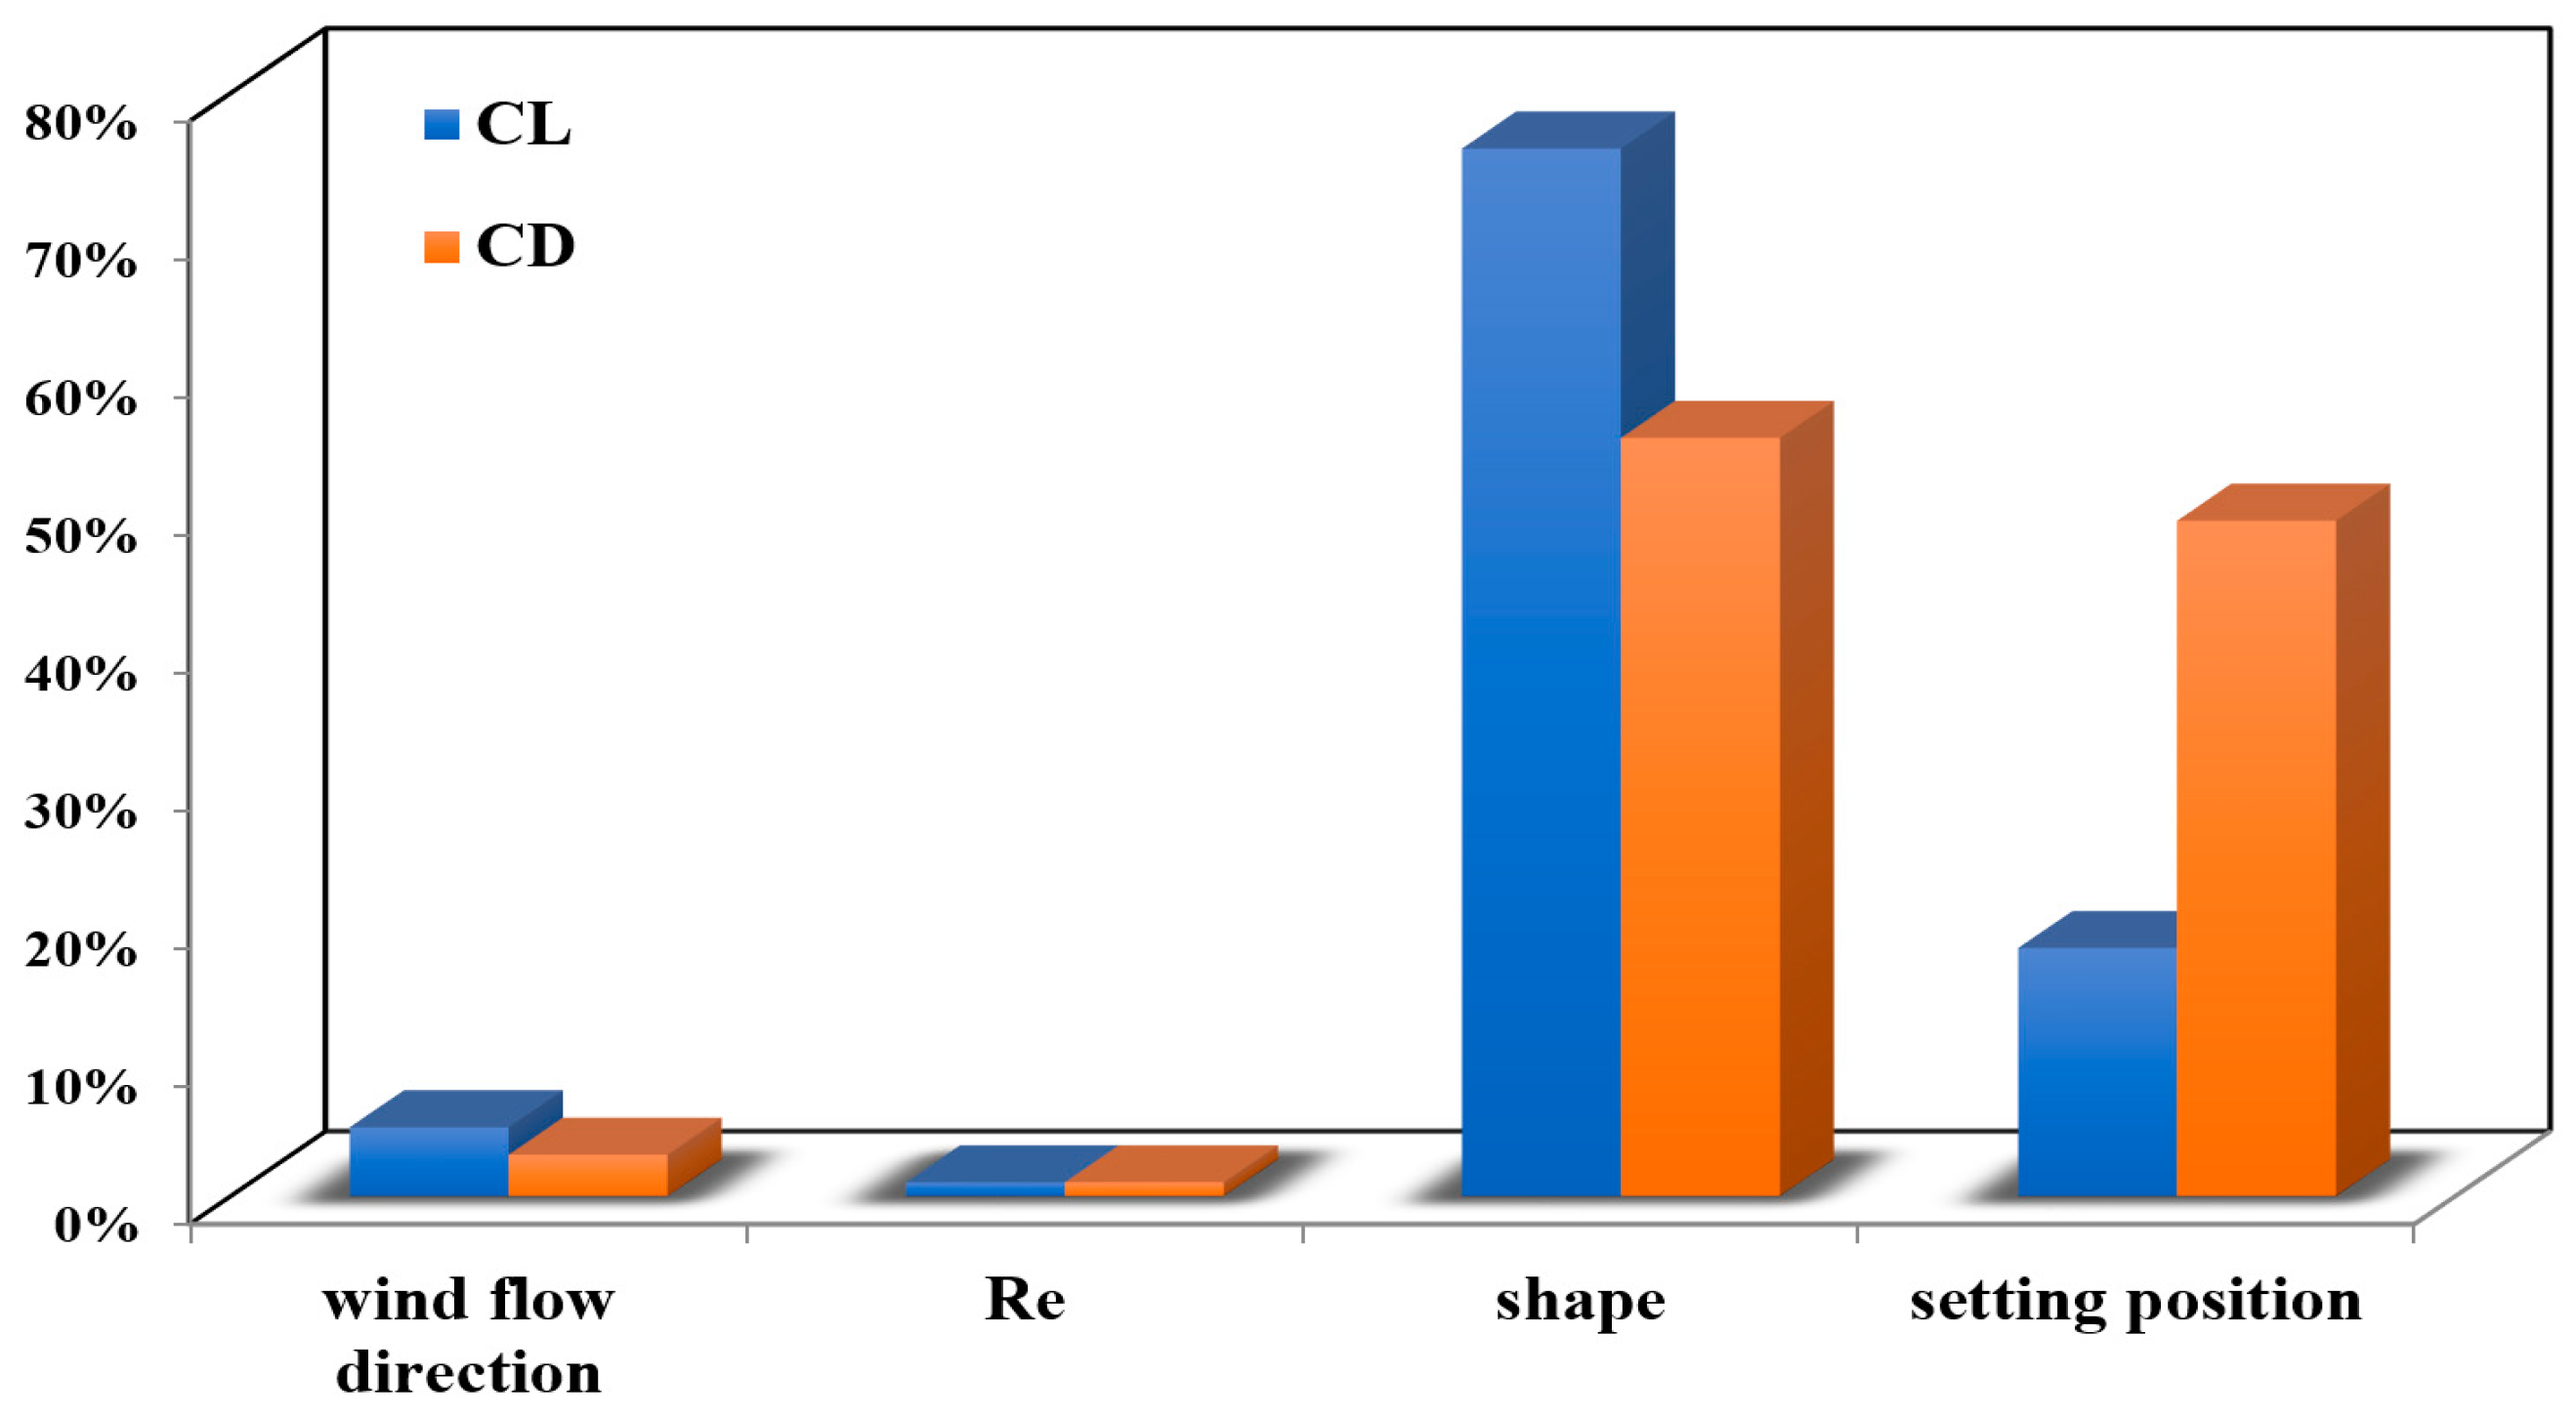
Furthermore, this research extends its contribution by delving into sensitivity analysis that considers the impact of key parameters (including wind flow direction (0 < φ < 30), Reynolds number (Re), building shape, and setting position (φ = 180)) on aerodynamic coefficients ( and ). Sensitivity analysis is a financial technique employed to assess the impact of changes in input variables on target variables, offering insights into the relationships between variables and their outcomes. Figure 11 provides a comparative overview of sensitivity analysis of aerodynamic coefficients of these influential parameters. The statistical analysis in this study utilizes analysis of variance (ANOVA) procedures, and employs F-tests to assess the equality of means when the study involves three or more groups. The F-value represents the ratio of two variances, with mean squares accounting for degrees of freedom. The results confirm the appropriateness of the suggested quadratic model for lift and drag coefficients. Notably, among the influential characteristics, the shape of a tall building exerts a profound influence on all aerodynamic coefficients. Furthermore, the setting position (φ = 180) significantly impacts the drag coefficient (); in contrast, the wind flow direction and Reynolds number exhibit relatively lower effects.
These findings underline the significance of specific design characteristics in high-rise structures and raise the pertinent question of which elements of a building have the most substantial impact on its aerodynamic loads. It is crucial to note that such insights are not easily attainable through wind tunnel tests, and even numerical simulations face limitations when seeking to provide this level of detail. To address this challenge, this research employs the discrete adjoint method to assess different regions of the building. Through numerical simulations and the solution of adjoint equations in each cell, the sensitivity levels of various parts of the building are quantified, offering a valuable means of understanding and optimizing the aerodynamic performance of high-rise structures.
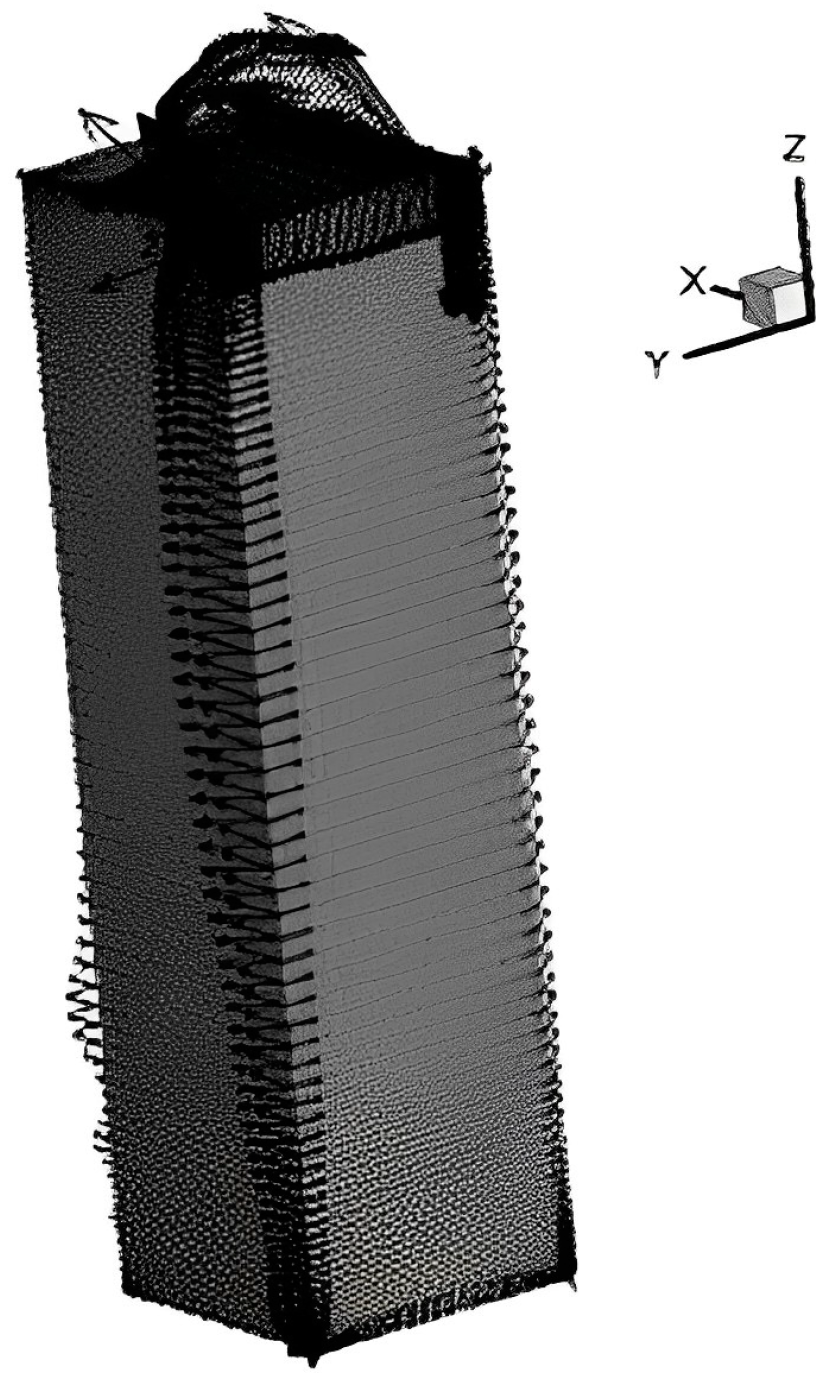
After it is deemed that square high-rise buildings experience greater aerodynamic loads and are more commonly utilized in practice, the need for aerodynamic optimization becomes particularly evident. In light of this, additional equations were employed to address the aerodynamic challenges specific to this building type. Figure 12 provides a visualization of the sensitivity vector around the square tall building, accompanied by sensitivity contours. The figure offers valuable insights into the areas of the building where sensitivity to aerodynamic modifications is most pronounced. A close examination of the figure reveals that the front edges of the building exhibit the highest degree of sensitivity, an observation with significant implications for efforts to enhance the aerodynamics of square high-rise buildings. It can be inferred that, if substantial reductions in the applied aerodynamic loads on square high-rise buildings are to be achieved, a strategic focus on altering and optimizing the design of their front edges is warranted. This design approach has the potential to mitigate the aerodynamic challenges associated with square structures, leading to improved performance and safety.
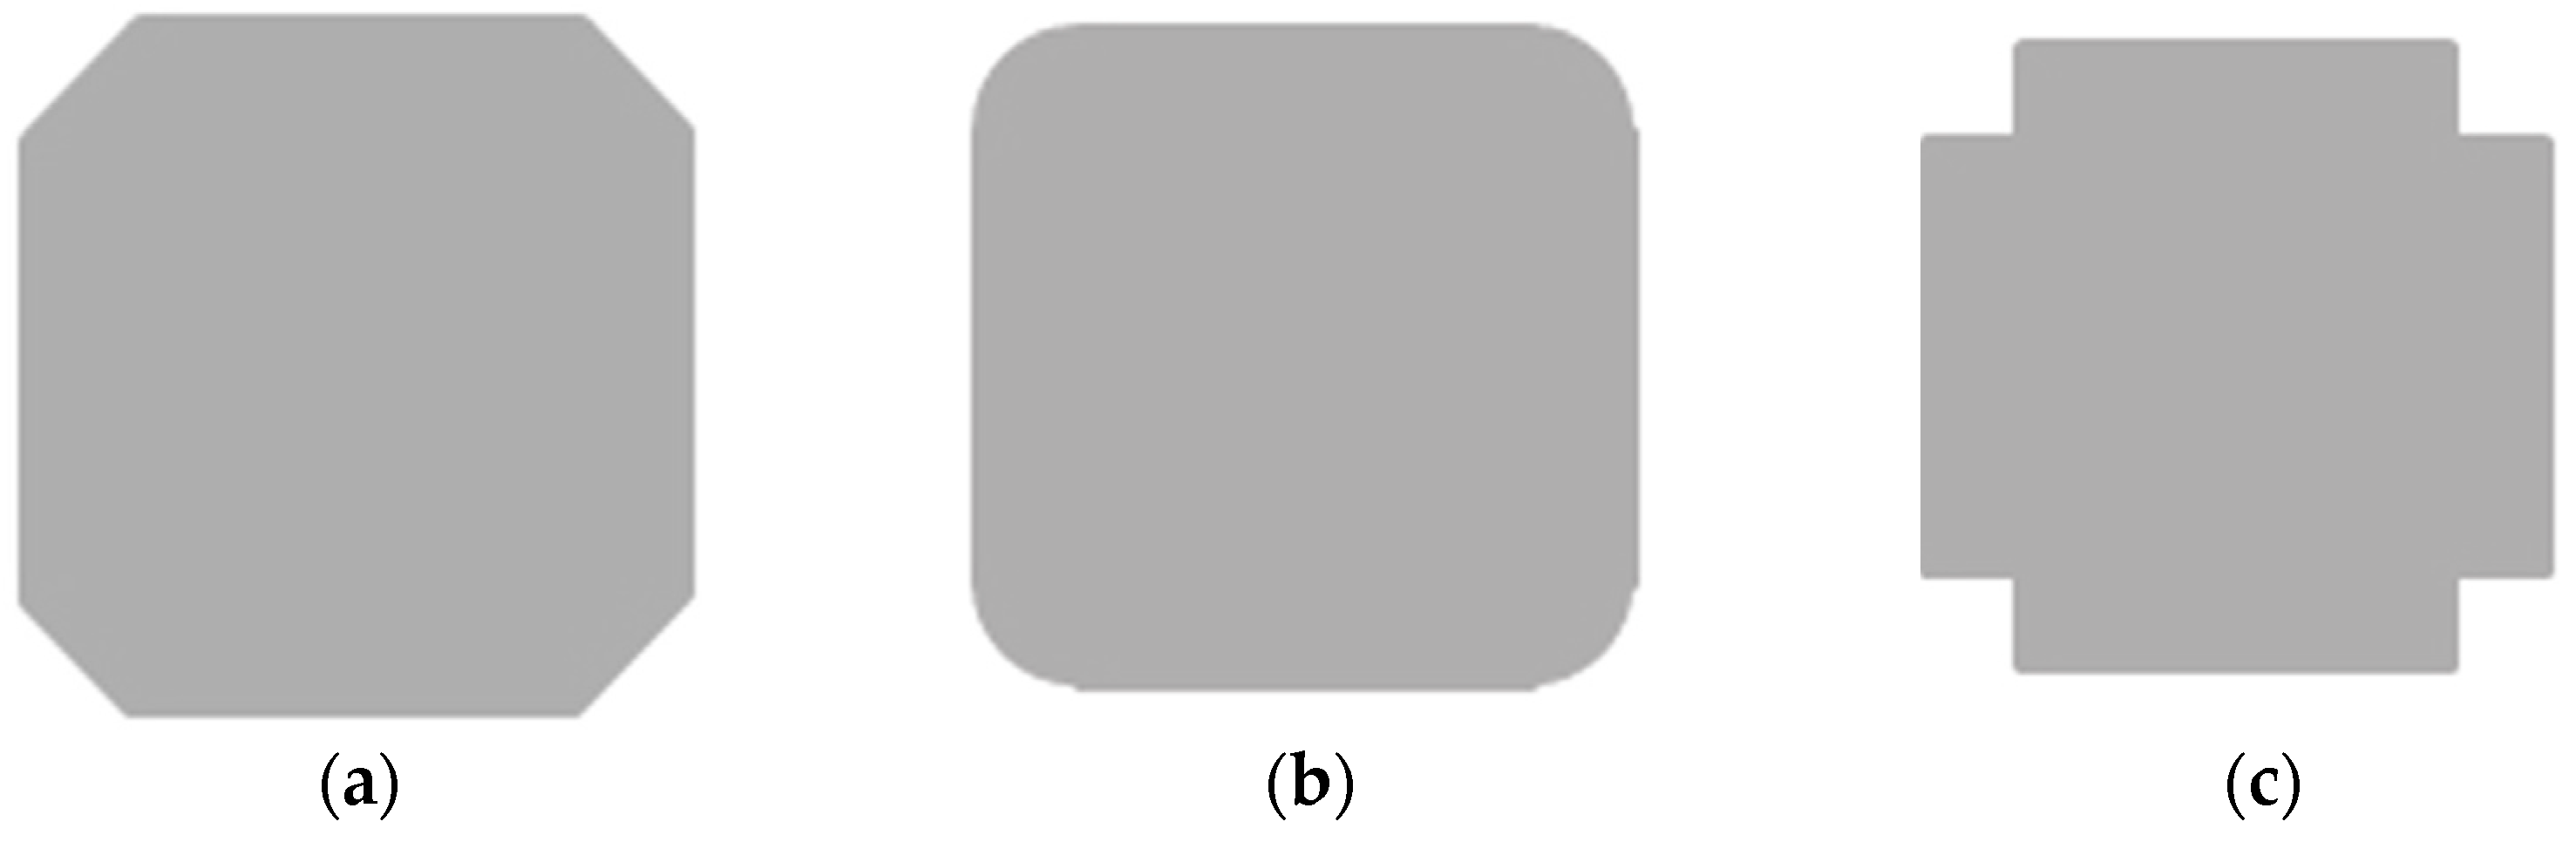
One promising approach to effectively reducing the applied aerodynamic loads on square high-rise buildings is to introduce bevelled corners. Various modes of corner correction have been conceptualized, as Figure 13 schematically illustrates. The dimensions of these proposed modifications have been deliberated, with each reform approximating to 10% of the building’s width. The idea behind these corner corrections is to strategically alter the geometry of the building’s corners in a manner that will diminish the adverse aerodynamic effects experienced by square high-rise structures. These modifications have the potential to improve the aerodynamic performance, safety, and stability of such buildings when they are subjected to wind loads. However, it is worth noting that the practical implementation of these design changes necessitates careful consideration and further analysis, as both are essential to ensure that the desired reduction in aerodynamic loads is effectively achieved. This research thus underscores the importance of innovative design approaches in optimizing the performance of high-rise structures.
The drag coefficient of square high-rise structures and buildings with aerodynamic modification are compared in Table 6. As shown in this table, the total applied forces to the beveled edge building are reduced compared to the square building. In other words, this table states that if roundness is used in the corners of the building, the applied forces to the buildings will be reduced. The reason for this reduction can be attributed to the corners’ aerodynamic modification of the building. These modifications make the flow of fluid pass around the building more easily and even reduce the vortices formed at the back and both sides of the building.
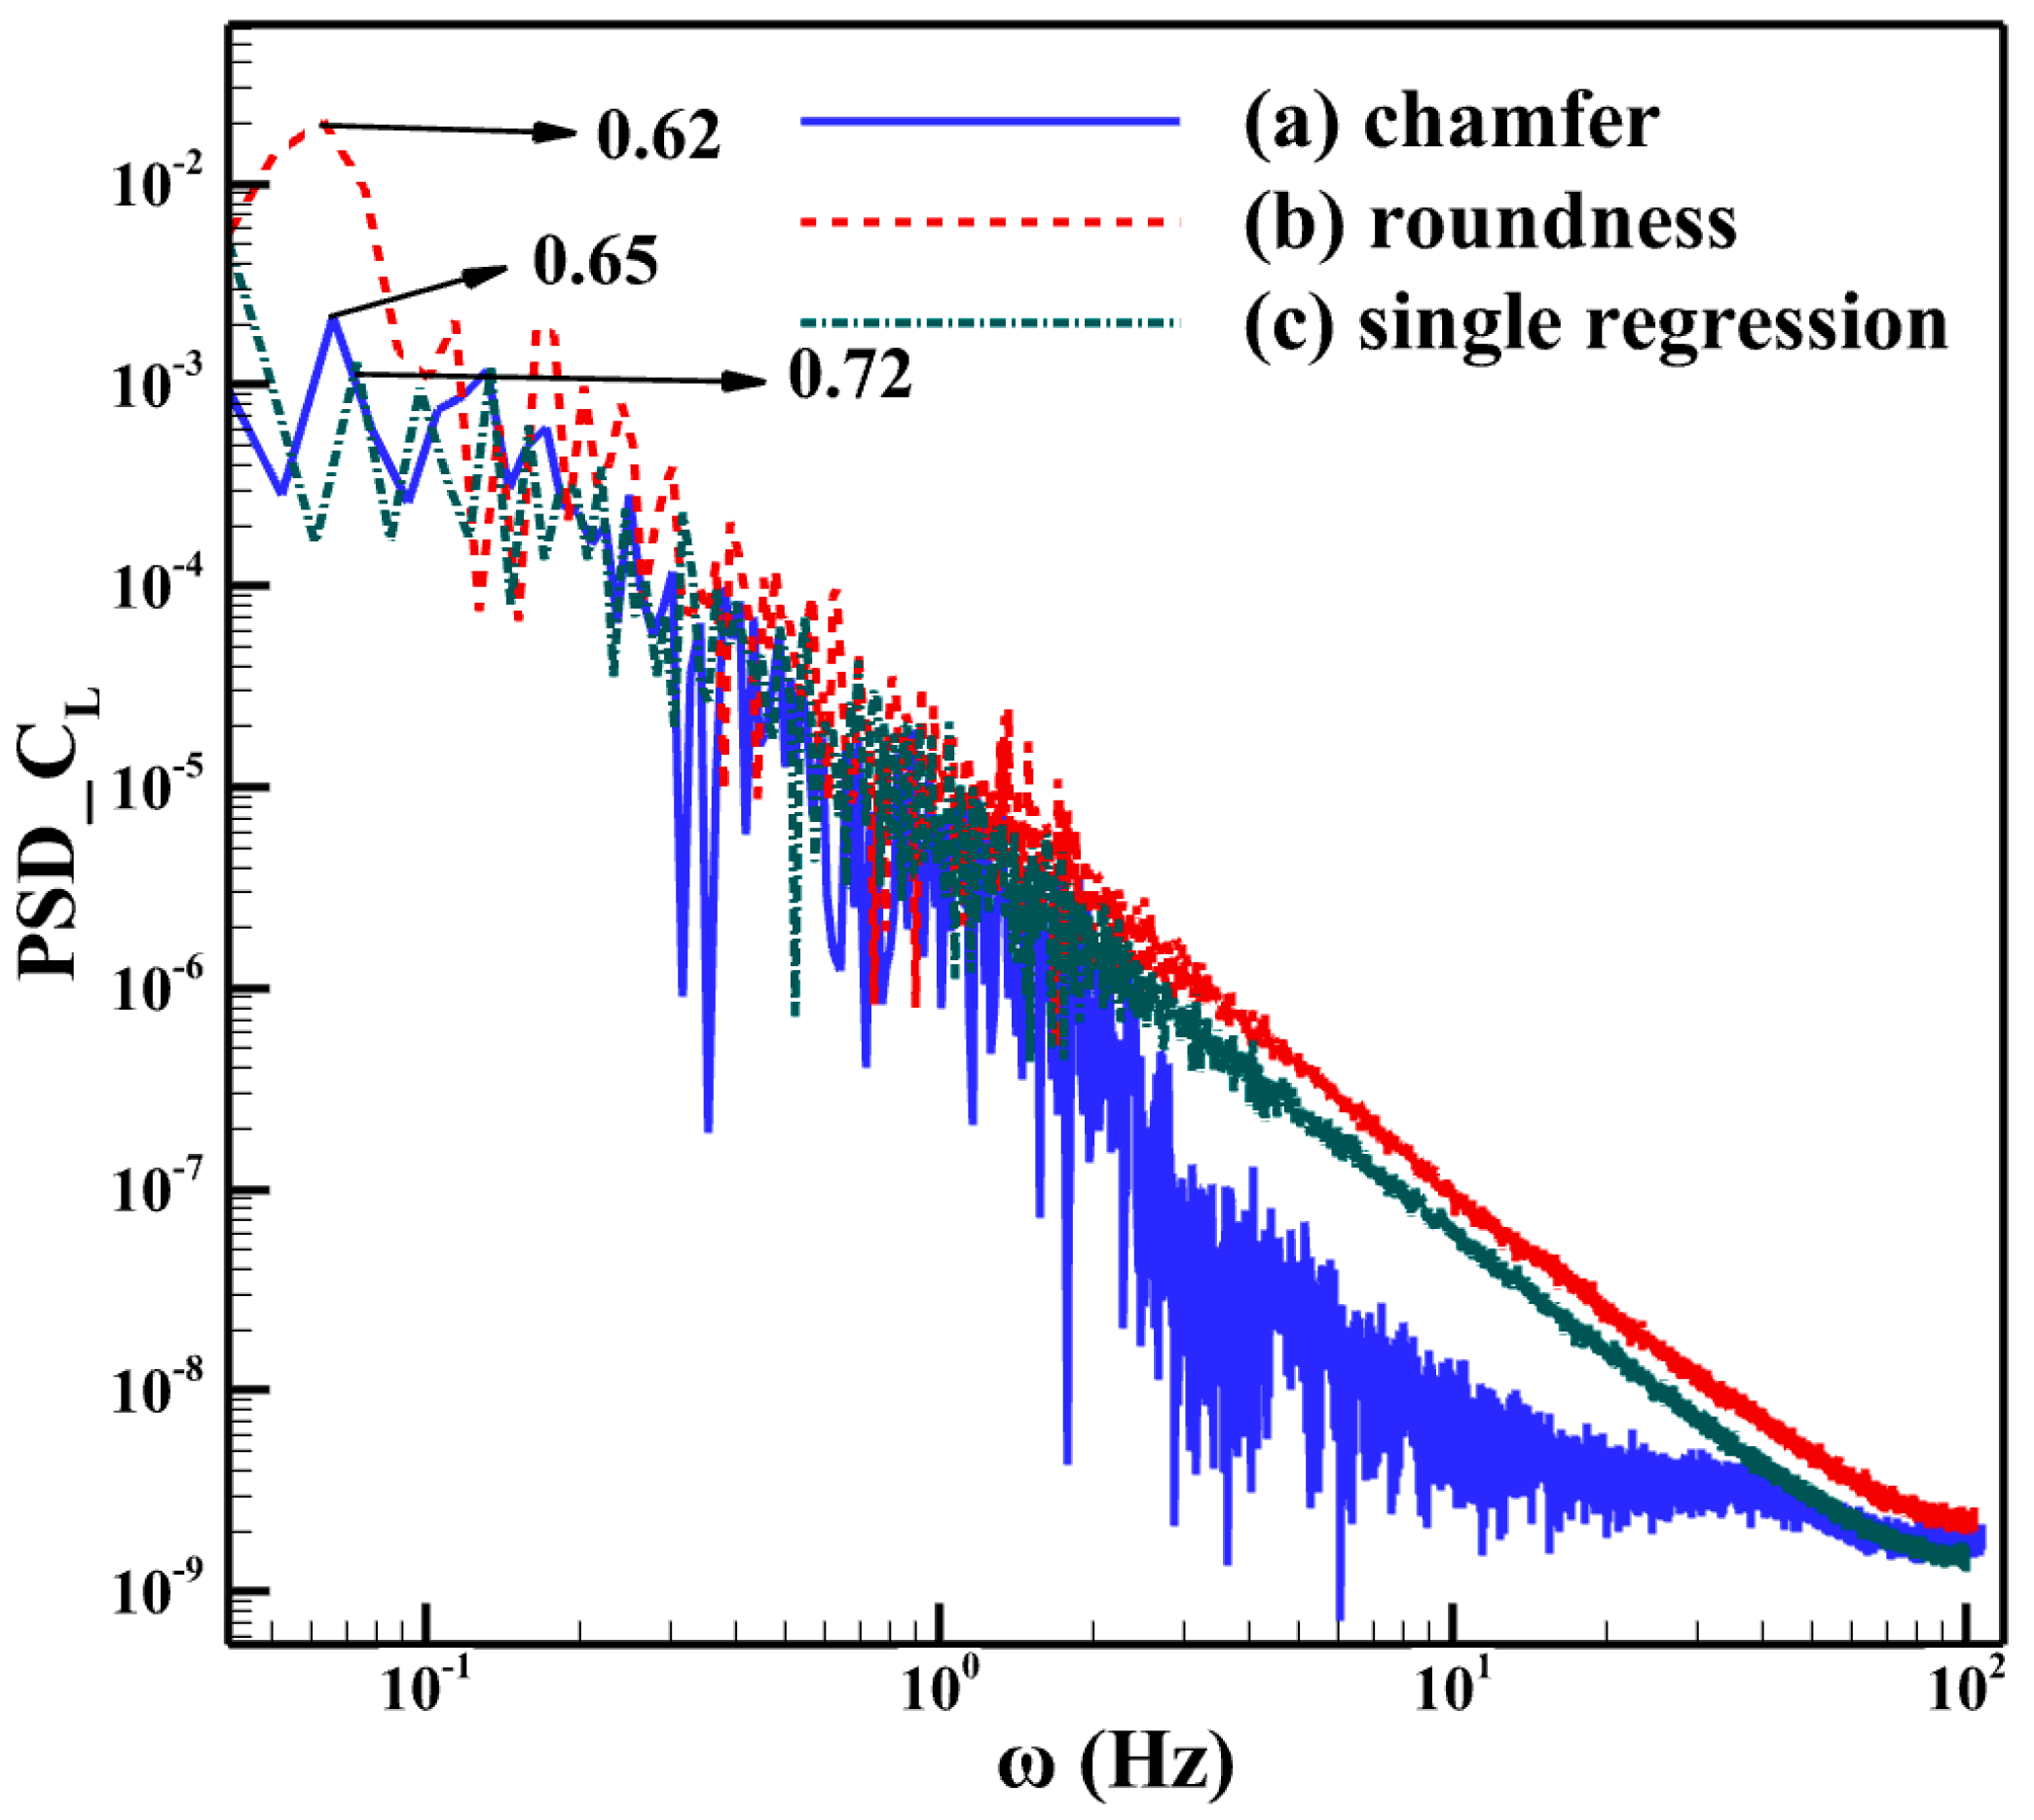
To comprehend the observed behavior, we turn our attention to the analysis of the lift coefficient’s spectral characteristics, which are represented by the power spectral density (PSD) as a function of frequency in time. Figure 14 illuminates the spectra of the lift coefficient, allowing for a comparative assessment of the results for three different building modifications. In each of these spectra, an initial peak emerges, which corresponds to the descent of vortices. The second peak, observed subsequently, can be attributed to the cyclic pressure variations associated with each vortex. This phenomenon is closely linked to the fluctuating pressure patterns in the wake of the building. The principal peak, however, arises from the interaction of vortices with asymmetric rotation and the induced velocity between consecutive vortices.
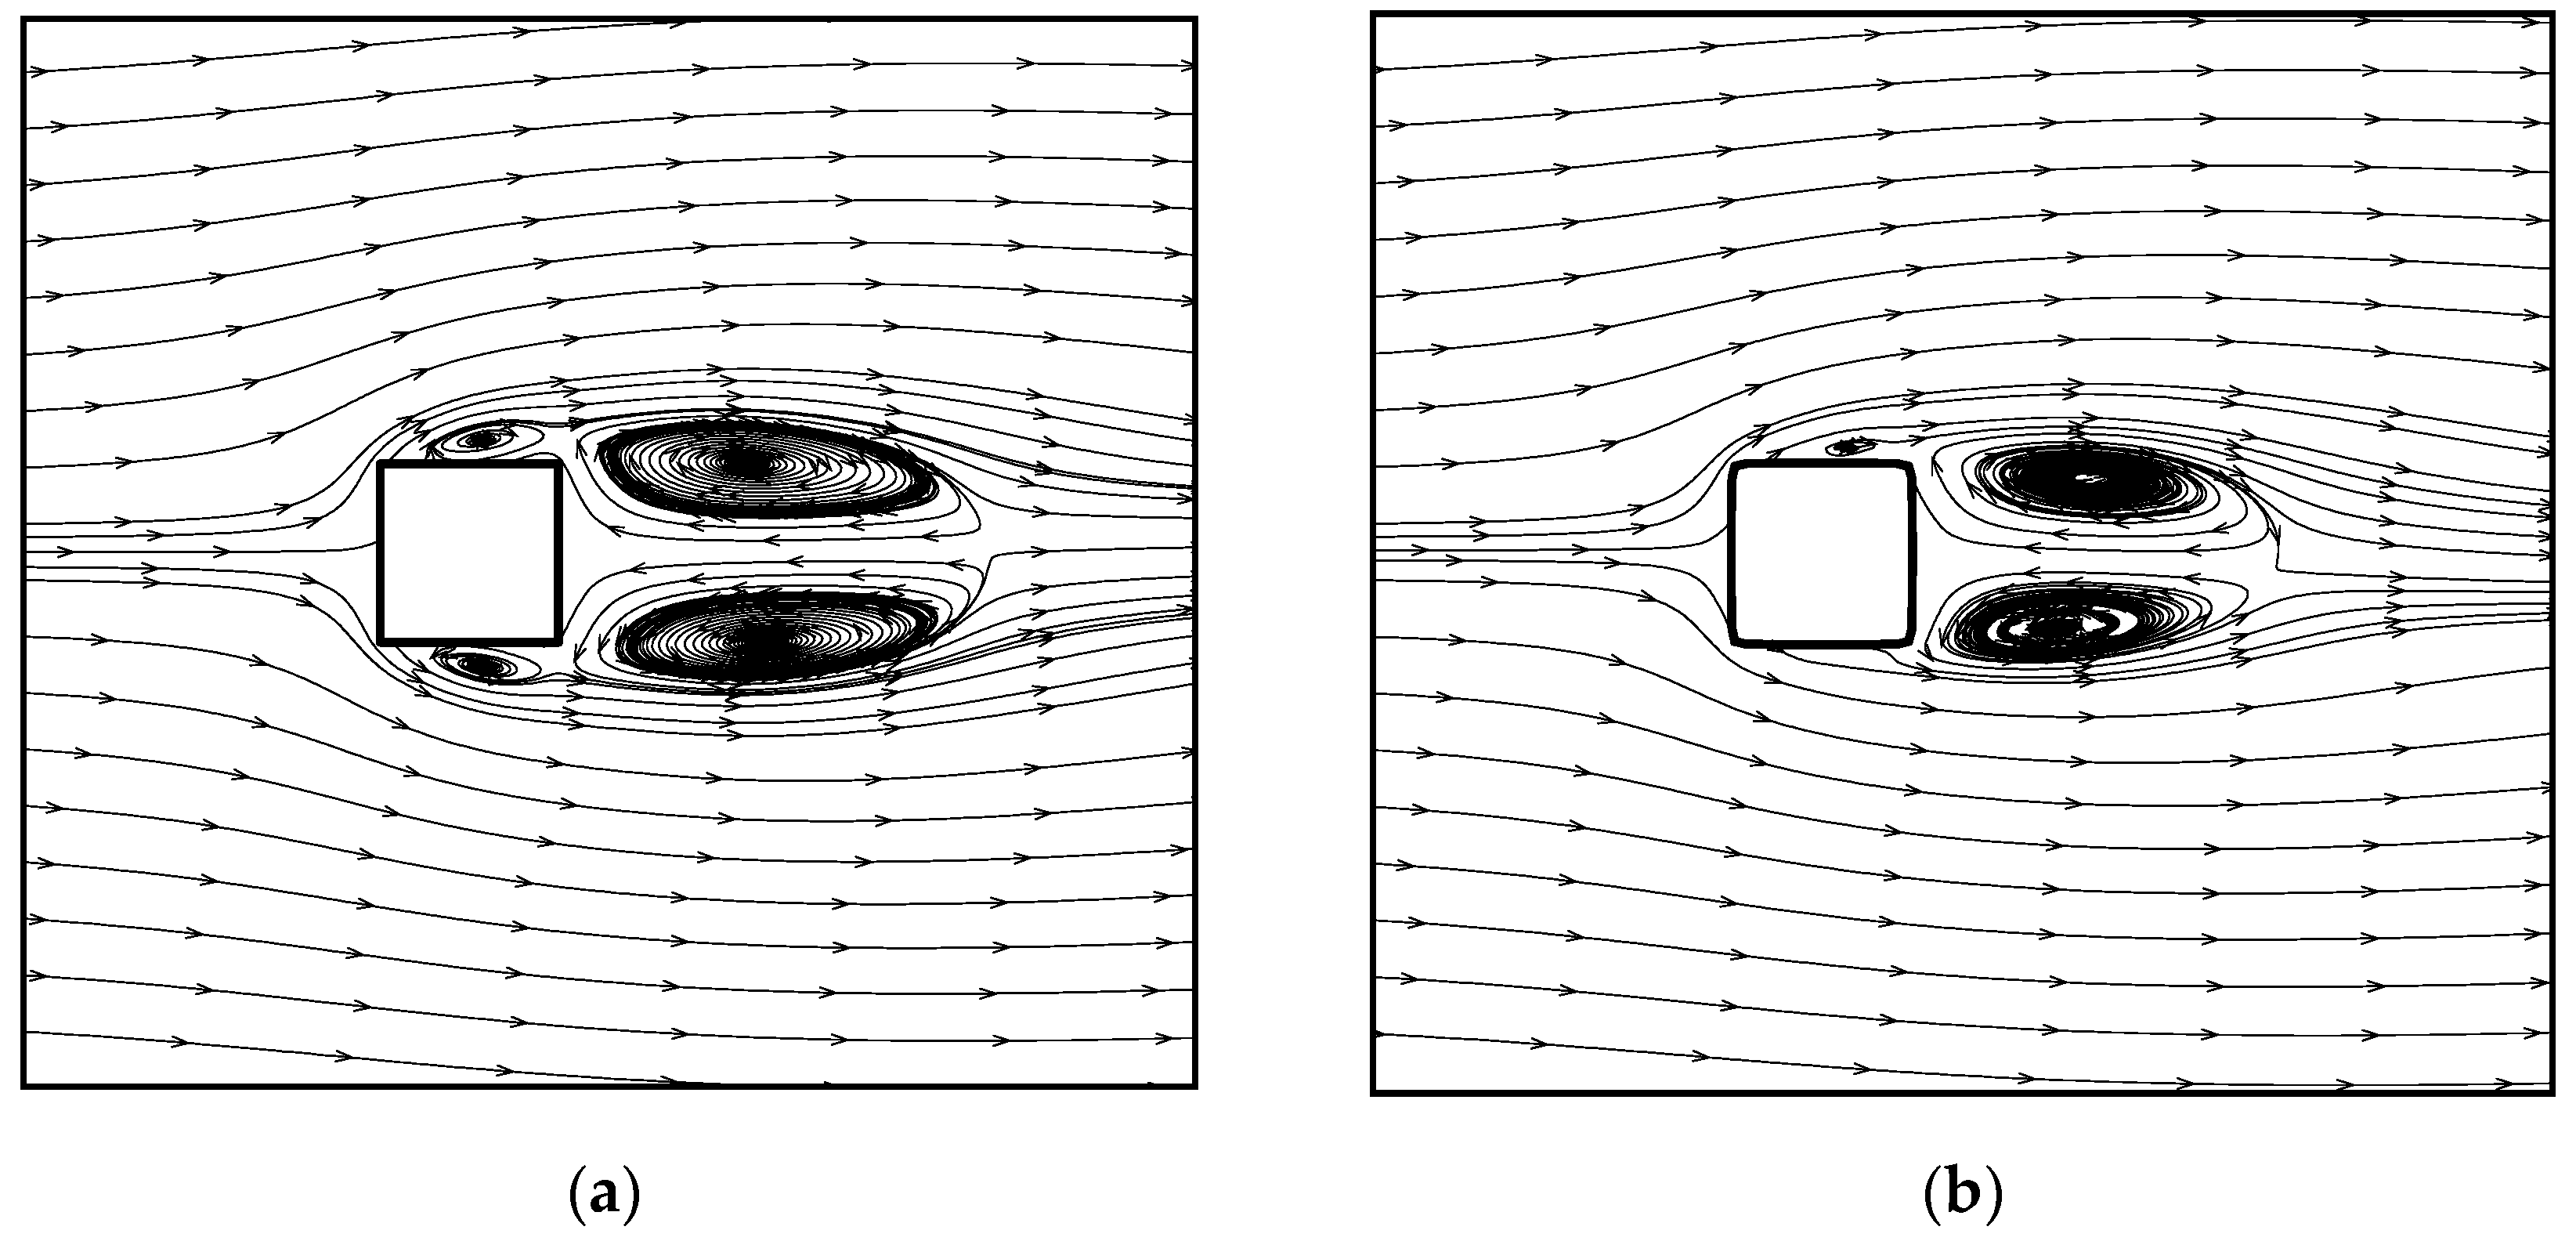
Figure 14 highlights that the first peak in the spectrum for the rounded building occurs prior to those for the chamfered and non-modified square buildings. This early occurrence of the first peak in the rounded building’s spectrum indicates an altered vortex shedding behavior, potentially leading to improved aerodynamic performance. Figure 15 complements this analysis by presenting streamline patterns around both square and rounded buildings. The discernible effect of rounded edges is the notable increase in fluid velocity on the building’s surfaces, leading to a postponement of flow separation. Moreover, the vorticity patterns around the square building are considerably more pronounced than those around the rounded structure. This heightened vorticity gives rise to a significantly higher drag coefficient for the square building, with clear signs of flow separation on the side surfaces and the generation of substantial vortices. Consequently, the square building experiences a greater bending moment, adding to its structural load. These observations underscore the significance of corner modifications in altering the flow behavior and, in turn, the aerodynamic performance of high-rise buildings. The results demonstrate the potential for enhanced aerodynamic stability and reduced loads through innovative design modifications.
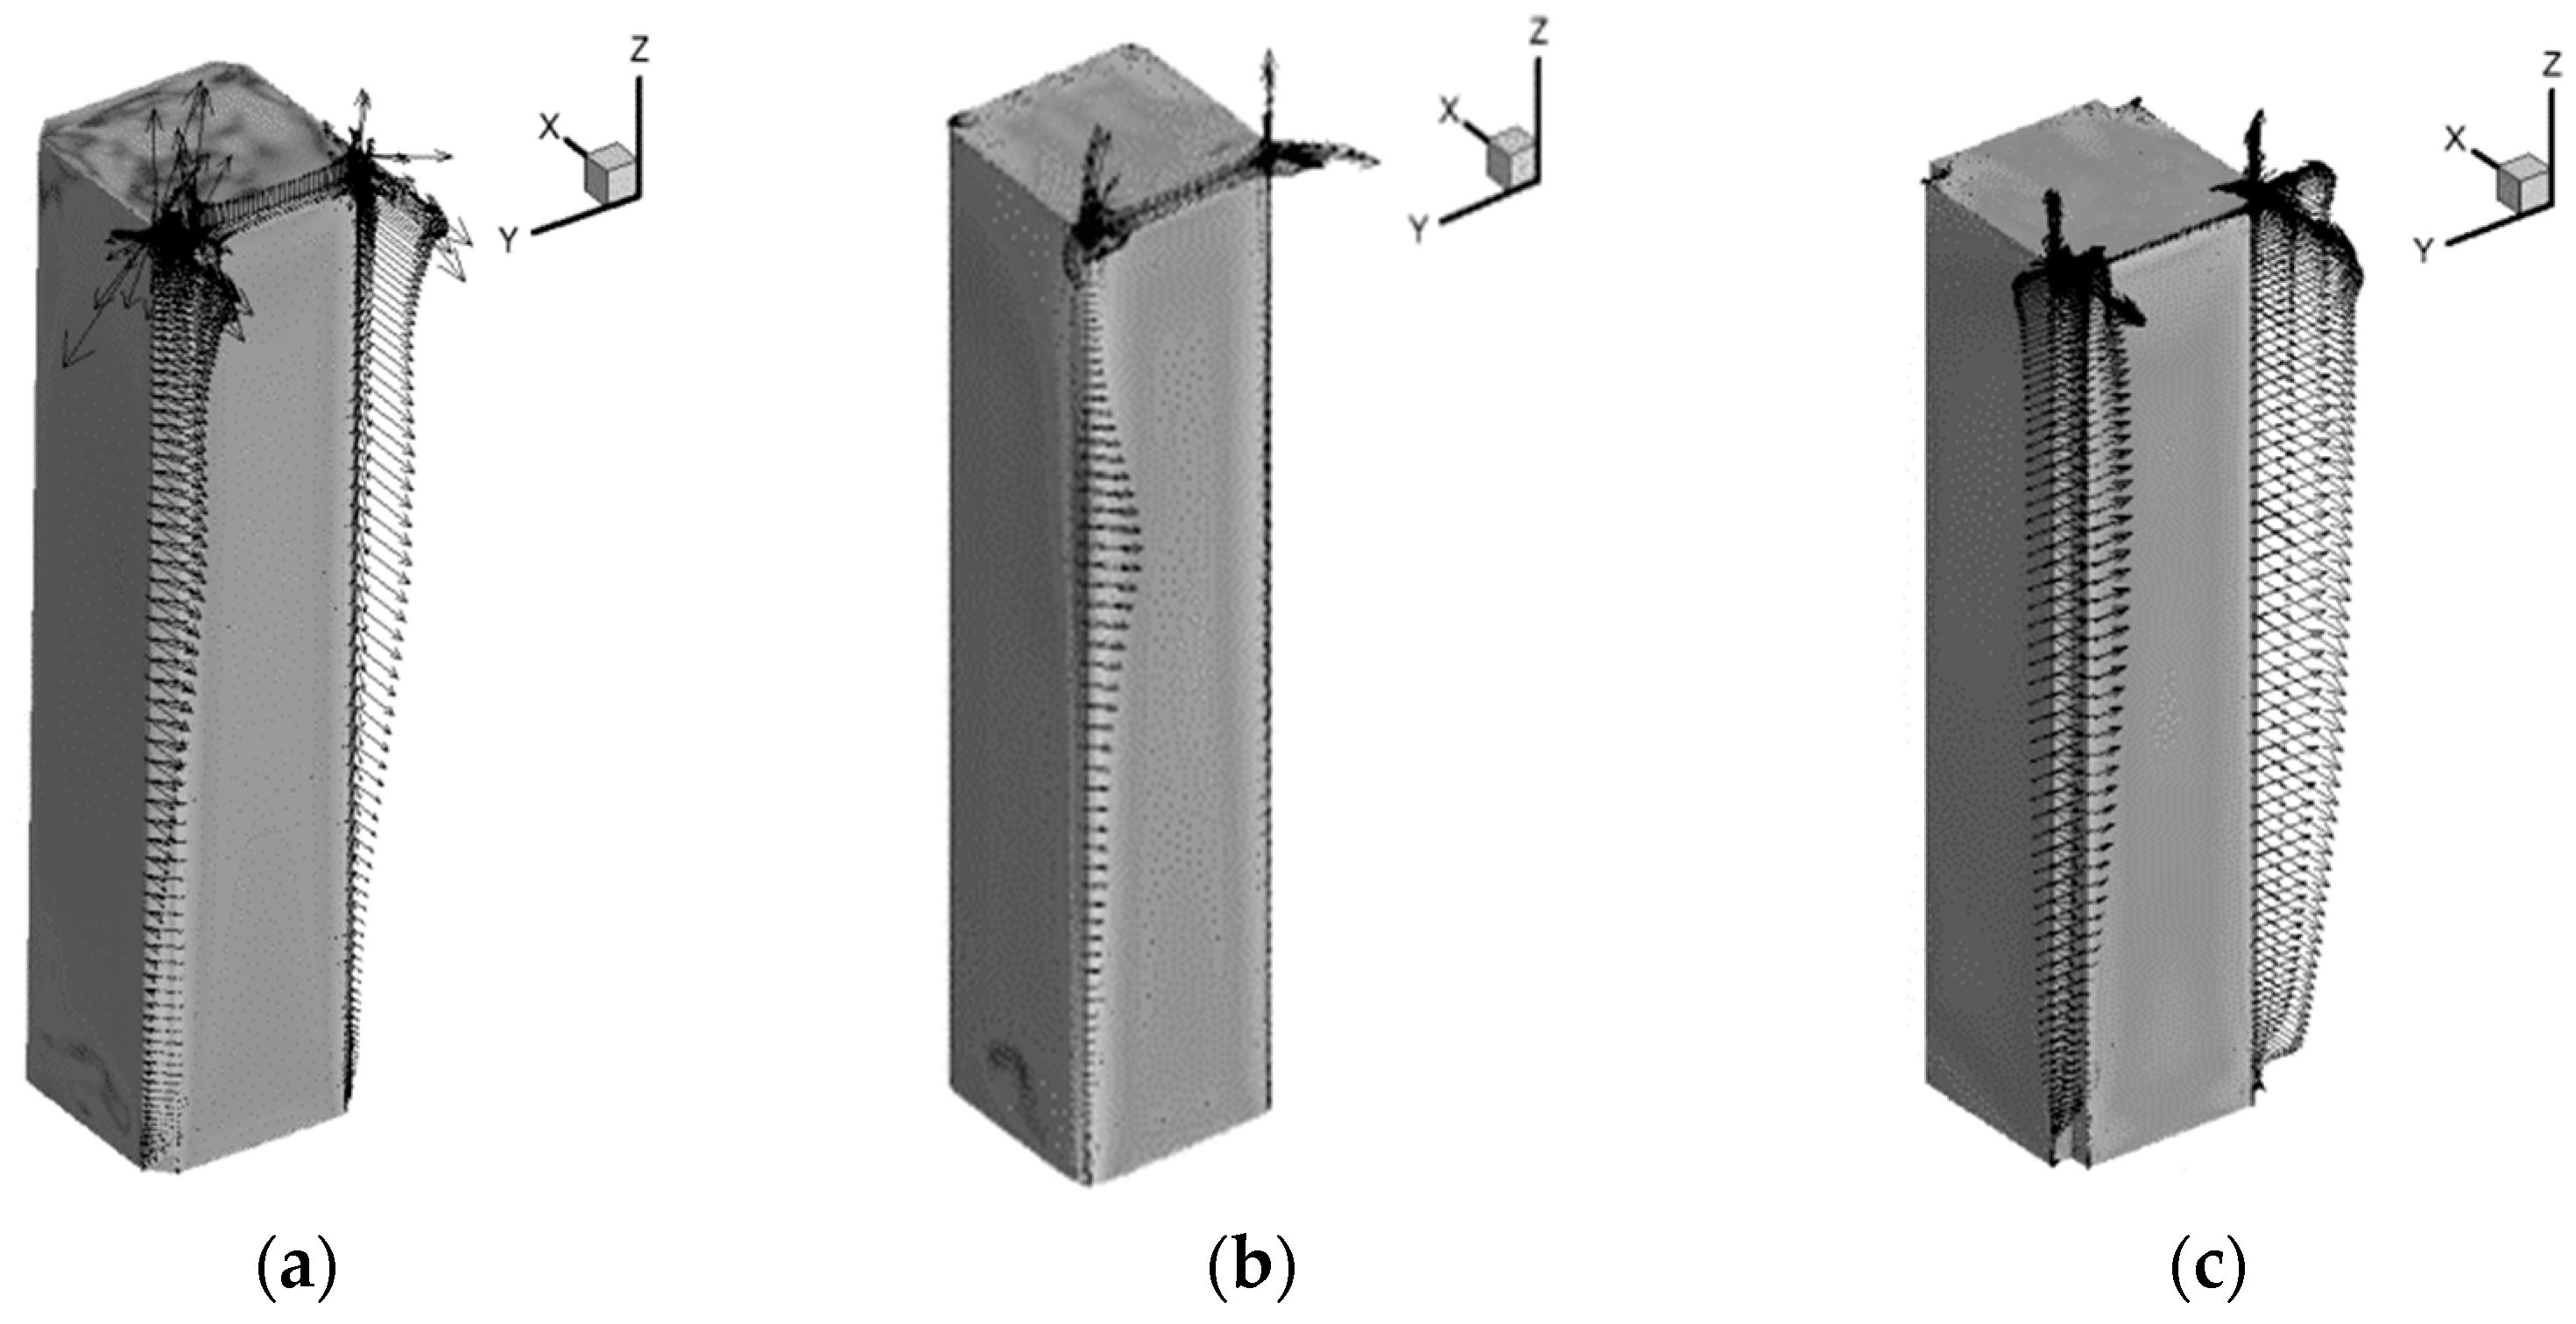
Flow separation on the side surfaces of the square building leads to the formation of vortices along these walls, resulting in the application of additional torque by the wind flow. However, these aerodynamic modifications have an impact on the building’s flow sensitivity. This interplay between flow behavior and sensitivity to modifications is a key consideration in the analysis of high-rise building aerodynamics. In Figure 16, we gain valuable insight into the sensitivity of flow behavior by examining the flow sensitivity contour for three buildings subjected to aerodynamic modifications. A careful comparison of these sensitivity contours with those presented in Figure 12 reveals a notable transformation in the flow behavior and its sensitivity.
The modifications introduced to these buildings have proven highly effective in reducing the intensity of flow sensitivity, and this reduction in sensitivity implies that the aerodynamic changes have not only improved the overall performance but have also made the buildings less responsive to variations, enhancing their stability and resilience in the face of fluctuating wind conditions. These findings underscore the considerable potential of aerodynamic modifications in optimizing high-rise building performance and enhancing their robustness in varying wind environments. The balance between flow behavior and sensitivity to modifications plays a critical role in achieving these improvements.
5. Conclusions
This study introduces a novel technique, with the potential to profoundly influence the field of aerodynamic optimization for tall buildings and their structural modifications, that leverages a combination of numerical fluid flow simulation and the adjoint method. The approach begins by examining a range of influential parameters affecting the aerodynamics of tall buildings, including the building’s cross-sectional shape, its orientation, different flow conditions, and the angle of attack of the incoming flow. Subsequently, the adjoint method is employed to analyze the sensitivity of these parameters to the aerodynamic forces acting on the structure. The results derived from this comprehensive investigation reveal that the cross-sectional shape of a high-rise building significantly dominates the aerodynamic loads, accounting for approximately 76% of the overall forces. However, given the immense scale of these structures, implementing comprehensive alterations to the building’s shape can be economically impractical and resource-intensive during the construction phase. Therefore, this research goes a step further by discretizing the adjoint equation across all cells within the solution domain. By meticulously identifying the specific regions of the tall building that exert the most pronounced influence on aerodynamic loads, targeted and cost-effective modifications can be introduced in these areas. These strategic changes result in noteworthy improvements in the building’s aerodynamic performance, ultimately leading to a substantial 31% reduction in applied aerodynamic loads on the building’s structure. The demonstrated ability of this technique to achieve a significant reduction in aerodynamic loads with relatively modest expenses underscores its effectiveness. This method holds the promise of facilitating desirable optimizations in the design of very large structures while keeping construction costs in check. The practical applications of this method extend beyond high-rise buildings, offering an efficient and innovative solution to challenges in various engineering disciplines. The successful implementation of this approach in this research highlights its potential broader applications and role in revolutionizing engineering practices.
In the context of future research, these topics may direct attention to the following areas:
- Investigating additional components of high-rise structures and examining their aerodynamic performance, considering elements like balconies, roofs, pedestrian areas, and others.
- Conducting a sensitivity analysis of the aforementioned geometric parameters (balconies length, width, …, and pedestrian displacement and etc.) in high-rise buildings, enabling the impact of each parameter to be ascertained.
- Employing heuristic and deterministic optimization techniques, including response surface methodology (RSM), genetic algorithms, and the adjoint method, to determine optimal solutions for the identified parameters.
Author Contributions
Conceptualization, A.E.; methodology, A.E. and A.N.; software, A.E. and A.N.; validation, A.E. and A.N.; formal analysis, A.E., A.N. and S.R.; investigation, A.E., M.Z., S.R. and A.N.; resources, A.E. and M.Z.; data curation, A.E. and A.N.; writing—original draft preparation, A.N. and S.R.; writing—review and editing, A.E., S.R. and A.N.; visualization, A.N.; supervision, A.E.; project administration, A.E. and M.Z. All authors have read and agreed to the published version of the manuscript.
Funding
This research received no external funding.
Institutional Review Board Statement
Not applicable.
Informed Consent Statement
Not applicable.
Data Availability Statement
The datasets generated and/or analyzed during the current study are available from the corresponding author on reasonable request.
Acknowledgments
The authors are grateful to the anonymous referees for their valuable suggestions.
Conflicts of Interest
The authors declare no conflicts of interest.
Nomenclature
| Drag coefficient | |
| Lift coefficient | |
| CP | Mean pressure coefficient |
| CFD | Computational fluid dynamic |
| DDES | Delayed detached eddy simulation |
| DES | Detached eddy simulation |
| Distance from the wall surface | |
| K | Turbulent kinetic energy |
| LES | Large eddy simulation |
| Length scale of the delayed detached eddy simulation | |
| Length scale of the large eddy simulation | |
| Length scale of the Reynold average navier-stokes | |
| RANS | Reynold average navier-stokes |
| Greek Symbols | |
| φ | Wind flow direction |
References
- Szalai, S.; Szívós, B.F.; Kurhan, D.; Németh, A.; Sysyn, M.; Fischer, S. Optimization of Surface Preparation and Painting Processes for Railway and Automotive Steel Sheets. Infrastructures 2023, 8, 28. [Google Scholar] [CrossRef]
- Chalermsinsuwan, B.; Li, Y.H.; Manatura, K. Optimization of gasification process parameters for COVID-19 medical masks using response surface methodology. Alex. Eng. J. 2023, 62, 335–347. [Google Scholar] [CrossRef]
- Zaheer, Q.; Manzoor, M.M.; Ahamad, M.J. A review on developing optimization techniques in civil engineering. Eng. Comput. 2023, 40, 348–377. [Google Scholar] [CrossRef]
- Djavareshkian, M.H.; Esmaeili, A. Heuristic optimization of submerged hydrofoil using ANFIS–PSO. Ocean Eng. 2014, 92, 55–63. [Google Scholar] [CrossRef]
- Djavareshkian, M.H.; Esmaeili, A. Neuro-fuzzy based approach for estimation of Hydrofoil performance. Ocean Eng. 2013, 59, 1–8. [Google Scholar] [CrossRef]
- Nikkhoo, A.; Esmaeili, A. Effect of different aero-structural optimization in the commercial airplane. J. Comput. Appl. Mech. 2023, 54, 268–284. [Google Scholar]
- Egorychev, O.O.; Churin, P.S.; Poddaeva, O.I. Experimental Study of Aerodynamic Loads on High-Rise Buildings. Adv. Mater. Res. 2015, 1082, 250–253. [Google Scholar] [CrossRef]
- Elshaer, A.; Bitsuamlak, G.; El Damatty, A. Enhancing wind performance of tall buildings using corner aerodynamic optimization. Eng. Struct. 2017, 136, 133–148. [Google Scholar] [CrossRef]
- Li, Y.; Tian, X.; Tee, K.F.; Li, Q.S.; Li, Y.G. Aerodynamic treatments for reduction of wind loads on high-rise buildings. J. Wind Eng. Ind. Aerodyn. 2018, 172, 107–115. [Google Scholar] [CrossRef]
- Kim, Y.M.; You, K.P.; Ko, N.H. Across-wind responses of an aeroelastic tapered tall building. J. Wind Eng. Ind. Aerodyn. 2008, 96, 1307–1319. [Google Scholar] [CrossRef]
- Kim, Y.; Kanda, J. Effects of taper and set-back on wind force and wind-induced response of tall buildings. Wind Struct. 2010, 13, 499–517. [Google Scholar] [CrossRef]
- Xie, J. Wind engineering studies for Shanghai Center Tower. RWDI Rep. 2009. [Google Scholar]
- Tse, K.T.; Hitchcock, P.A.; Kwok, K.C.S.; Thepmongkorn, S.; Chan, C.M. Economic perspectives of aerodynamic treatments of square tall buildings. J. Wind Eng. Ind. Aerodyn. 2009, 97, 455–467. [Google Scholar] [CrossRef]
- Wang, Z.; Hu, G.; Zhang, D.; Kim, B.; Xu, F.; Xiao, Y. Aerodynamic Characteristics of a Square Cylinder with Vertical-Axis Wind Turbines at Corners. Appl. Sci. 2022, 12, 3515. [Google Scholar] [CrossRef]
- Tanaka, H.; Tamura, Y.; Ohtake, K.; Nakai, M.; Chul Kim, Y. Experimental investigation of aerodynamic forces and wind pressures acting on tall buildings with various unconventional configurations. J. Wind Eng. Ind. Aerodyn. 2012, 107–108, 179–191. [Google Scholar] [CrossRef]
- Toja-Silva, F.; Lopez-Garcia, O.; Peralta, C.; Navarro, J.; Cruz, I. An empirical–heuristic optimization of the building-roof geometry for urban wind energy exploitation on high-rise buildings. Appl. Energy 2016, 164, 769–794. [Google Scholar] [CrossRef]
- Lu, W.T.; Phillips, B.M.; Jiang, Z. Surrogate-based cyber-physical aerodynamic shape optimization of high-rise buildings using wind tunnel testing. J. Wind Eng. Ind. Aerodyn. 2023, 242, 105586. [Google Scholar] [CrossRef]
- Li, Y.; Zhu, Y.; Chen, F.-B.; Li, Q.S. Aerodynamic loads of tapered tall buildings: Insights from wind tunnel test and CFD. Structures 2023, 56, 104975. [Google Scholar]
- Whiteman, M.L.; Fernández-Cabán, P.L.; Phillips, B.M.; Masters, F.J.; Davis, J.R.; Bridge, J.A. Cyber-physical aerodynamic shape optimization of a tall building in a wind tunnel using an active fin system. J. Wind Eng. Ind. Aerodyn. 2022, 220, 104835. [Google Scholar] [CrossRef]
- Elshaer, A.; Bitsuamlak, G.; Damatty, A. El Aerodynamic shape optimization of tall buildings using twisting and corner modifications. In Proceedings of the 8th International Colloquium on Bluff Body Aerodynamics and Applications, Boston, MA, USA, 7–11 June 2016. [Google Scholar]
- Elshaer, A.; Bitsuamlak, G. Multiobjective Aerodynamic Optimization of Tall Building Openings for Wind-Induced Load Reduction. J. Struct. Eng. 2018, 144, 04018198. [Google Scholar] [CrossRef]
- Zhang, Y.; Khurram, R.A.; Habashi, W.G. Multiscale finite element method applied to detached-eddy simulation for computational wind engineering. Wind Struct. 2013, 17, 1–19. [Google Scholar] [CrossRef]
- Tominaga, Y.; Akabayashi, S.-I.; Kitahara, T.; Arinami, Y. Air flow around isolated gable-roof buildings with different roof pitches: Wind tunnel experiments and CFD simulations. Build. Environ. 2015, 84, 204–213. [Google Scholar] [CrossRef]
- Wang, Q.; Qiao, H.; De Domenico, D.; Zhu, Z.; Xie, Z. Wind-Induced Response Control of High-Rise Buildings Using Inerter-Based Vibration Absorbers. Appl. Sci. 2019, 9, 5045. [Google Scholar] [CrossRef]
- Li, B.; Li, C.; Yang, Q.; Tian, Y. Experimental study on the coupling effects of wind-induced vibration of square-sectioned high-rise buildings with different stiffness ratios. Eng. Struct. 2022, 252, 113746. [Google Scholar] [CrossRef]
- Huang, M. A Hybrid RANS and Kinematic Simulation of Wind Load Effects on Full-Scale Tall Buildings. In High-Rise Buildings under Multi-Hazard Environment; Springer: Singapore, 2017; pp. 55–81. [Google Scholar]
- Irwin, P.A. Bluff body aerodynamics in wind engineering. J. Wind Eng. Ind. Aerodyn. 2008, 96, 701–712. [Google Scholar] [CrossRef]
- Guo, S.; Chen, S.-F. Numerical Simulation of Wind Pressures and Wind Environment around a Complex-Shaped High-Rise Building. Eng. Mech. 2006, 23, 144–149. [Google Scholar]
- Li, Z.; Wang, C.; Zhao, S.; Wei, Q.; Liu, H. Wind Tunnel Test and Numerical Simulation of Wind-Induced Loads on Complex-Shaped High-Rise Buildings. Archit. Civ. Eng. Environ. 2009, 5, 69–73. [Google Scholar]
- Li, Y.; Song, Q.; Li, C.; Huang, X.; Zhang, Y. Reduction of wind loads on rectangular tall buildings with different taper ratios. J. Build. Eng. 2022, 45, 103588. [Google Scholar] [CrossRef]
- Daemei, A.B.; Darvish, A.; Aeinehvand, R.; Razzaghipour, A. Large-Eddy Simulation (LES) on the Square and Triangular Tall Buildings to Measure Drag Force. Adv. Civ. Eng. 2021, 2021, 6666895. [Google Scholar] [CrossRef]
- Meena, R.K.; Raj, R.; Anbukumar, S. Effect of wind load on irregular shape tall buildings having different corner configuration. Sādhanā 2022, 47, 126. [Google Scholar] [CrossRef]
- Baghaei Daemei, A.; Khotbehsara, E.M.; Nobarani, E.M.; Bahrami, P. Study on wind aerodynamic and flow characteristics of triangular-shaped tall buildings and CFD simulation in order to assess drag coefficient. Ain Shams Eng. J. 2019, 10, 541–548. [Google Scholar] [CrossRef]
- Elshaer, A. Aerodynamic Optimization and Wind Load Evaluation Framework for Tall Buildings. Ph.D. Thesis, The University of Western Ontario, London, ON, Canada, 2017. [Google Scholar]
- Liu, J.; Niu, J. CFD simulation of the wind environment around an isolated high-rise building: An evaluation of SRANS, LES and DES models. Build. Environ. 2016, 96, 91–106. [Google Scholar] [CrossRef]
- Spalart, P.R.; Jou, W.H.; Strelets, M.K.; Allmaras, S.R. Comments on the feasibility of LES for wings and on a hybrid RANS/LES approach. In Proceedings of the Advances in DNS/LES, Ruston, LA, USA, 4–8 August 1997; Volume 1, pp. 4–8. [Google Scholar]
- Gritskevich, M.S.; Garbaruk, A.V.; Schütze, J.; Menter, F.R. Development of DDES and IDDES Formulations for the k-ω Shear Stress Transport Model. Flow Turbul. Combust. 2011, 88, 431–449. [Google Scholar] [CrossRef]
- Spalart, P.R.; Deck, S.; Shur, M.L.; Squires, K.D.; Strelets, M.K.; Travin, A. A New Version of Detached-eddy Simulation, Resistant to Ambiguous Grid Densities. Theor. Comput. Fluid Dyn. 2006, 20, 181–195. [Google Scholar] [CrossRef]
- Menter, F.; Kuntz, M.; Turbulence, R. Ten years of industrial experience with the SST turbulence model. Turbul. Heat Mass Transf. 2003, 4, 625–632. [Google Scholar]
- Giles, M.B.; Pierce, N.A. An Introduction to the Adjoint Approach to Design. Flow Turbul. Combust. 2000, 65, 393–415. [Google Scholar] [CrossRef]
- Marta, A.C.; Mader, C.A.; Martins, J.R.R.A.; Van Der Weide, E.; Alonso, J.J. A methodology for the development of discrete adjoint solvers using automatic differentiation tools. Int. J. Comut. Fluid Dyn. 2007, 21, 307–327. [Google Scholar] [CrossRef]
- Kim, Y.; Kanda, J. Characteristics of aerodynamic forces and pressures on square plan buildings with height variations. J. Wind Eng. Ind. Aerodyn. 2010, 98, 449–465. [Google Scholar] [CrossRef]
- Lateb, M.; Masson, C.; Stathopoulos, T.; Bédard, C. Comparison of various types of k–ε models for pollutant emissions around a two-building configuration. J. Wind Eng. Ind. Aerodyn. 2013, 115, 9–21. [Google Scholar] [CrossRef]
- Yang, Y.; Gu, M.; Chen, S. New inflow boundary conditions for modelling the neutral equilibrium atmospheric boundary layer in computational wind engineering. J. Wind Eng. Ind. Aerodyn. 2009, 97, 88–95. [Google Scholar] [CrossRef]
- Gan, V.J.L.; Wang, B.; Chan, C.M.; Weerasuriya, A.U.; Cheng, J.C.P. Physics-based, data-driven approach for predicting natural ventilation of residential high-rise buildings. Build. Simul. 2021, 15, 129–148. [Google Scholar] [CrossRef]
- Huang, X.; Gao, L.; Guo, D.; Yao, R. Impacts of high-rise building on urban airflows and pollutant dispersion under different temperature stratifications: Numerical investigations. Atmos. Pollut. Res. 2021, 12, 100–112. [Google Scholar] [CrossRef]
- Wilson, R.P.; Haupt, S.E.; Peltier, L.J.; Kunz, R.F. Detached Eddy Simulation of Atmospheric Flow About a Surface Mounted Cube at High Reynolds Number. In Proceedings of the ASME Fluids Engineering Division Summer Meeting, Miami, FL, USA, 17–20 July 2006; Volume 1, pp. 1213–1222. [Google Scholar]
- Zhang, Y.; Habashi, W.G.; Khurram, R.A. Predicting wind-induced vibrations of high-rise buildings using unsteady CFD and modal analysis. J. Wind Eng. Ind. Aerodyn. 2015, 136, 165–179. [Google Scholar] [CrossRef]
- Jones, G.; Santer, M.; Papadakis, G. Control of low Reynolds number flow around an airfoil using periodic surface morphing: A numerical study. J. Fluids Struct. 2018, 76, 95–115. [Google Scholar] [CrossRef]
Figure 1.
The computational mesh.

Figure 2.
The domain and boundary condition.

Figure 3.
The mesh refinement for pressure convergence.

Figure 4.
The specification of geometry. (a) square. (b) circle. (c) rectangular. (d) triangular.

Figure 5.
Comparison of pressure coefficient distribution at the front and behind various tall buildings in zero-degree wind flow direction, Re = 5.6 × 10⁴. (a) the place of front and behind, (b) the graph.
Figure 5.
Comparison of pressure coefficient distribution at the front and behind various tall buildings in zero-degree wind flow direction, Re = 5.6 × 10⁴. (a) the place of front and behind, (b) the graph.

Figure 6.
Comparison of pressure coefficient distribution at the front and behind two different triangular high-rise buildings at zero degree wind flow direction, Re = 5.6 × 10⁴. (a) Front. (b) Behind.
Figure 6.
Comparison of pressure coefficient distribution at the front and behind two different triangular high-rise buildings at zero degree wind flow direction, Re = 5.6 × 10⁴. (a) Front. (b) Behind.

Figure 7.
Turbulence intensity around buildings (a) the triangular (b) square buildings at zero degree wind flow direction, BL1.
Figure 7.
Turbulence intensity around buildings (a) the triangular (b) square buildings at zero degree wind flow direction, BL1.

Figure 8.
Q-criterion distribution between two different buildings (a) the triangular (b) square buildings colored by streamwise x velocity at zero degree wind flow direction, BL1.
Figure 8.
Q-criterion distribution between two different buildings (a) the triangular (b) square buildings colored by streamwise x velocity at zero degree wind flow direction, BL1.

Figure 9.
The iso surface x velocity of two different high-rise building configurations (a) rectangle (b) square at zero degree wind flow direction in BL1 condition.
Figure 9.
The iso surface x velocity of two different high-rise building configurations (a) rectangle (b) square at zero degree wind flow direction in BL1 condition.

Figure 10.
Comparison of the drag coefficient of several buildings in different wind flow directions at BL1.
Figure 10.
Comparison of the drag coefficient of several buildings in different wind flow directions at BL1.

Figure 11.
Comparison of sensitivity analysis of the aerodynamic coefficients of effective parameters.
Figure 11.
Comparison of sensitivity analysis of the aerodynamic coefficients of effective parameters.

Figure 12.
Sensitivity vector around the square building at zero-degree wind flow direction, BL1.

Figure 13.
Aerodynamic modification of a designed square section based on adjoint method. (a) chamfer. (b) roundness. (c) single recession.
Figure 13.
Aerodynamic modification of a designed square section based on adjoint method. (a) chamfer. (b) roundness. (c) single recession.

Figure 14.
Power spectral density of lift coefficient; the aerodynamic modified buildings at zero-degree wind flow direction and BL1, (a) chamfer, (b) roundness, (c) single recession.
Figure 14.
Power spectral density of lift coefficient; the aerodynamic modified buildings at zero-degree wind flow direction and BL1, (a) chamfer, (b) roundness, (c) single recession.

Figure 15.
Comparison of the streamlines around the buildings (a) square, (b) roundness oblong at zero-degree wind flow direction, BL1.
Figure 15.
Comparison of the streamlines around the buildings (a) square, (b) roundness oblong at zero-degree wind flow direction, BL1.

Figure 16.
Sensitivity vector around the aerodynamic modified buildings at zero-degree wind flow direction and BL1, (a) chamfer, (b) roundness, (c) single recession.
Figure 16.
Sensitivity vector around the aerodynamic modified buildings at zero-degree wind flow direction and BL1, (a) chamfer, (b) roundness, (c) single recession.


Table 1.
Flow characteristics and turbulence intensity in the different flow conditions.
| No Cases | Reynolds Number | Exponential Power-Low Factor | Wind Velocity | Turbulence Intensity |
|---|---|---|---|---|
| BL1-Flow condition | 0.24 | 8 | 19 | |
| BL2-Flow condition | 0.13 | 6.5 | 15 | |
| BL3-Flow condition | 0.07 | 5 | 12 |
Table 2.
Comparison of drag coefficient according to different mesh cells around the square building in BL1.
Table 2.
Comparison of drag coefficient according to different mesh cells around the square building in BL1.
| Number of Cell | Drag Coefficient | Error (%) |
|---|---|---|
| 548,000 | 0.986 | 5.2 |
| 2,880,000 | 1.024 | 1.5 |
| 5,270,000 | 1.11 | 6.9 |
Table 3.
Comparison of drag coefficient between experimental results and numerical simulations for square high-rise building in various wind flow directions and (a) Re = 5.6 × 10⁴, (b) Re = 4.5 × 10⁴.
Table 3.
Comparison of drag coefficient between experimental results and numerical simulations for square high-rise building in various wind flow directions and (a) Re = 5.6 × 10⁴, (b) Re = 4.5 × 10⁴.
| AOA | (a) BL1 | (b) BL2 | ||||
|---|---|---|---|---|---|---|
| Error (%) | (EXP) [42] | Error (%) | (EXP) [42] | |||
| 0 | 1.5 | 1.04 | 1.024 | 1.4 | 1.19 | 1.173 |
| 15 | 4.8 | 0.9 | 0.943 | 7.6 | 0.98 | 1.054 |
| 30 | 11.7 | 0.92 | 0.812 | 8.3 | 0.99 | 0.908 |
| 45 | 11.1 | 0.94 | 1.044 | 9.8 | 1.02 | 1.120 |
Table 4.
Study of different turbulence models and comparison with experimental data.
| Turbulence Model | (Experimental) = 1.04 [11] | |
|---|---|---|
| (Numeric) | Error (%) | |
| S A | 1.401 | 34.7 |
| Standard | 1.245 | 22.6 |
| RNG | 1.553 | 49.3 |
| Realize | 1.425 | 37 |
| Standard | 1.635 | 57.2 |
| SST | 0.998 | 4 |
| Reynolds Stress | 0.866 | 16.8 |
| DES | 1.057 | 1.7 |
| DDES | 1.024 | 1.5 |
Table 5.
Comparison of the drag coefficient of different buildings in several flow conditions.
| Shape | Re = 5.6 × 10⁴, BL1 | Re = 4.5 × 10⁴, BL2 | Re = 3.5 × 10⁴, BL3 |
|---|---|---|---|
| Square | 1.024 | 1.173 | 1.199 |
| Circle | 0.423 | 0.4021 | 0.385 |
| Rectangular | 1.176 | 1.230 | 1.268 |
| Triangular | 0.871 | 0.846 | 0.84 |
Table 6.
Lift and drag coefficients loaded on the square and oblong buildings at BL1, zero-degree wind flow direction.
Table 6.
Lift and drag coefficients loaded on the square and oblong buildings at BL1, zero-degree wind flow direction.
| Shape | Lift Coefficient | Drag Coefficient |
|---|---|---|
| Square | −0.0004 | 1.024 |
| Chamfer | −0.0033 | 0.783 |
| Roundness | 0.0068 | 0.7044 |
| Single recession | −0.0065 | 0.745 |
Disclaimer/Publisher’s Note: The statements, opinions and data contained in all publications are solely those of the individual author(s) and contributor(s) and not of MDPI and/or the editor(s). MDPI and/or the editor(s) disclaim responsibility for any injury to people or property resulting from any ideas, methods, instructions or products referred to in the content. |
© 2024 by the authors. Licensee MDPI, Basel, Switzerland. This article is an open access article distributed under the terms and conditions of the Creative Commons Attribution (CC BY) license (https://creativecommons.org/licenses/by/4.0/).
Share and Cite
MDPI and ACS Style
Nikkhoo, A.; Esmaeili, A.; Rabizade, S.; Zamiri, M. Aerodynamic Modification of High-Rise Buildings by the Adjoint Method. J 2024, 7, 72-93. https://doi.org/10.3390/j7010004
AMA Style
Nikkhoo A, Esmaeili A, Rabizade S, Zamiri M. Aerodynamic Modification of High-Rise Buildings by the Adjoint Method. J. 2024; 7(1):72-93. https://doi.org/10.3390/j7010004
Chicago/Turabian StyleNikkhoo, Amirfarhang, Ali Esmaeili, Shayan Rabizade, and Majid Zamiri. 2024. "Aerodynamic Modification of High-Rise Buildings by the Adjoint Method" J 7, no. 1: 72-93. https://doi.org/10.3390/j7010004