
Estimating Flooding at River Spree Floodplain Using HEC-RAS Simulation


1
Department of Civil & Environmental Engineering, Idaho State University, Pocatello, ID 83209, USA
2
School of Aerospace & Mechanical Engineering, University of Oklahoma, Norman, OK 73019, USA
3
Department of Civil and Environmental Engineering, Villanova University, Villanova, PA 19085, USA
*
Author to whom correspondence should be addressed.
J 2022, 5(4), 410-426; https://doi.org/10.3390/j5040028
Submission received: 20 August 2022
/
Revised: 1 October 2022
/
Accepted: 1 October 2022
/
Published: 10 October 2022
(This article belongs to the Section Engineering)
Abstract
:River renaturation can be an effective management method for restoring a floodplain’s natural capacity and minimizing the effects during high flow periods. A 1D-2D Hydrologic Engineering Center–River Analysis System (HEC-RAS) model, in which the flood plain was considered as 2D and the main channel as 1D, was used to simulate flooding in the restored reach of the Spree River, Germany. When computing in this model, finite volume and finite difference approximations using the Preissmann approach are used for the 1D and 2D models, respectively. To comprehend the sensitivity of the parameters and model, several scenarios were simulated using different time steps and grid sizes. Additionally, dikes, dredging, and changes to the vegetation pattern were used to simulate flood mitigation measures. The model predicted that flooding would occur mostly in the downstream portion of the channel in the majority of the scenarios without mitigation measures, whereas with mitigation measures, flooding in the floodplain would be greatly reduced. By preserving the natural balance on the channel’s floodplain, the restored area needs to be kept in good condition. Therefore, mitigating measures that balance the area’s economic and environmental aspects must be considered in light of the potential for floods.
1. Introduction
Naturally, rivers show dynamic behavior that results in alteration of their morphology over time. However, this is a slow process that gives the river time to adjust to its new status while maintaining its capability. On the other hand, things are different when there is artificial manipulation of the river and its surrounding areas [1,2]. One example is the Spree River in Germany. Over the years, the river was changed for navigation purposes [3]. The river was straightened, and dikes were constructed along the river stretch. This led to a decrease in flood retention areas and, as a result, the river could not cope naturally with high-water conditions. Flooding is a condition where the water reaches a high level in the river and overtops the banks, deviating from its natural course and causing inundation in the floodplains. One of the main reasons for flooding is when the river cannot route the incoming water due to low conveyance capacity [4,5,6,7]. It is a natural disaster of great magnitude, causing the destruction of anything on its way. This has been evident from history: flooding in various parts of the world has caused great destruction of life and property, leading to about two-thirds of all such destruction in terms of number and economic loss [8,9]. These are generally natural phenomena, but the impacts and effects can be exacerbated by human interventions.
A floodplain is an area of low-lying ground adjacent to a stream or river which stretches from the bank of its channel to the base of enclosing valley walls, and which experiences flooding during the period of high discharge [6,7,8,9,10,11,12,13]. Floodplains are formed as the rivers erode their own banks. As the river flows, it washes material downstream of the bank, and when a flood occurs, this material or sediment—largely composed of a layer of silt, sand, and mud—is suspended in water and added to the floodplain [14,15,16,17]. Floodplains constitute a valuable part of the environment as they filter, store, and release floodwaters, recharge aquifers, store a variety of sediments, and also provide a habitat for a diversity of wildlife [18,19,20,21,22]. Floodplain soils absorb water during the wet season, then slowly release moisture to plants and into the streams. This lessens the impact of peak runoff and keeps plants growing and streams flowing longer into the dry season. Also, the streambank vegetation helps to cool the surface water temperature and creates an important habitat for fish, waterfowl, and other wildlife species. River renaturation can be helpful to some extent in flood reduction in the floodplain. A study carried out in Floha river on the border of Germany and Czech Republic showed that afforestation in the floodplain reduced the peak flow by 4%, as compared to application on a barren floodplain [23,24,25]. Although this study did not show a significant impact of renaturation on flood reduction, and although it may not be a major tool for flood defense, these methods contribute to the management of flood.
The impacts of flood and the significance of floodplains to maintaining the naturality of rivers made it necessary to carry out studies to understand the behavior of river systems for better management. The concept of river models started during the 1970s, and later on, hydraulic models for rivers, channels, and pipe systems emerged during the 1980s for flow prediction, finding the travel time and water level variations in rivers, channels, and canal systems. In simple terms, modeling is a process of creating a simulation of reality by different computational process in order to understand the complex phenomena of nature. These days, modeling is an important aspect in every field of research, water resources being one of them. The governing equations are generally the same for most of the models, but the approach will vary depending on the research topic. The purpose of this study is to simulate a 2-D flooded area (clear water) for the entire reach (about 11 km), with sensitivity analysis on the time step and grid dimensions and management strategies to reduce the flood risk. This study provides an opportunity to apply the Hydrologic Engineering Center–River Analysis System (HEC-RAS) code to simulate flooding events after the main restoration measures and to gain a greater understanding of the theoretical basis and practical application of two-dimensional floodplain modeling. The objectives of this project were accomplished by simulation of a two-dimensional model for different flooding scenarios in the entire reach, along with the implementation of some flood reduction strategies.
2. Literature Review
2.1. Hydraulic Modeling
The dynamics of rivers have been assessed using various techniques over the years. Hydraulic models were developed as a means of simulating flooding events to understand their potential effects and come up with a feasible solution. Conventionally, 1D models were used as a means of modeling flood events. This approach provides reasonable results for the flow within the channel even though it is one dimensional and assumes uniform velocity and consistent water level across the cross section [26]. It should also be taken into account that the lateral movement of flooding in a river with complex topography is not addressed through this approach. On the other hand, 2D models are structured in a way such that the lateral flow over the floodplains can also be modeled, even though the computational process might be more complex. The irregular topography in the rivers leads to a mixed flow regime, which leads to complex computation due to the wider range of boundary and initial conditions to be considered [27,28,29]. Any model is a function of the underlying governing equations, which are solved using numerical approximations. The first stage of any model is the preparation of the base, such as the schematics of the river (geometry), which is basically created by interconnecting nodes and allocating the upstream and downstream boundaries for the river section under study. The computation of parameters is done at these nodes. It should be noted that not all the nodes correspond with available cross section measurements, and interpolations are carried out at nodes where the data for cross sections are not available. Among the various hydraulic modelling tools, HEC-RAS is one of the most widely used tools, and it is explained in the section below.
2.2. Modeling in HEC-RAS
Hydraulic Engineering Center’s River Analysis System (HEC-RAS 6.0) is a software product developed by the U.S. Army Corps of Engineers of the US [30,31,32]. This software provides a wide range of applications in the area of water resource management, such as steady and unsteady flow simulations, sediment transport, and water quality analysis. Initially, there was only the capability for 1D analysis of unsteady flow, but the developers installed a new feature in the system for 2D flow analysis in rivers. An overview of the components of HEC-RAS is given in the following section.
The geometry in the 1D and 2D models is created in a different manner. In 1D, the geometry is basically described by the connectivity between river reach cross section data and the hydraulic structures. The division between the main channel and the floodplain is made by using different roughness coefficients for the cross sections. In case of the 2D model, the main channel has a 1D geometry, whereas the floodplain has geometry as a computational mesh created by interconnecting cells with no more than 8 faces. The mesh is connected to the 1D channel and the boundary condition by connecting the cell points to the cell 1D structure. The flow between the faces is calculated during the computation, and a single water depth for each cell is calculated.
HEC-RAS uses the Saint Venant shallow water equations as a basis for the analysis of the flow in the rivers. Both 1D and 2D unsteady flow work on the basis of conservation of mass (Continuity Equation) and momentum (Momentum Equation). The computations are carried out through the Preissmann scheme using the finite difference method [33,34]. The governing equations for each of the 1D and 2D flows are described in the following sections.
The continuity equation for 1D flow is written as:
where Q is the flow rate, A is the cross-sectional area, and q is the lateral inflow.
The momentum equation for the 1D flow is given as:
where v is the velocity, g is the gravitational acceleration, h is the water depth, S0 is the bed slope, and Sf is the friction slope.
The continuity equation for 2D flow is written as:
where H is the water surface elevation, h is the water depth, u and v are the depth averaged velocities in the x- and y-directions, and q is the source term.
The momentum equations for the 2D flow are given as:
- In the x-direction:
- In the y-direction:
The friction coefficient can be determined by using Manning’s formula, which is expressed as:
where n is Manning’s n, g is the acceleration due to gravity, u is the velocity in the x-direction, and R is the hydraulic radius. A combination of a hybrid discretization scheme with finite differences and finite volumes is used in HEC-RAS to take advantage of orthogonality in grids. Using a Newton-like solution technique, the discrete solution for the hydraulic equations is computed. A finite difference scheme expresses a derivative as the difference of two quantities. This technique has already been tacitly used in the equation mentioned below, to discretize the volume derivative with respect to time as the difference between the volumes at times n and n+1, divided by the time step Δt.
Finite differences in space work identically. Given two adjacent cells j1 and j2 with water surface elevation H1 and H2, respectively, the directional derivative in the direction n′ determined by the cell centers is approximated by the equation below (HEC-RAS). ∆n′ is the distance between the cell centers.
Two finite volume methods are used. The first is a cell vertex method and the second is cell-centered. The cell vertex method uses a secondary mesh made up of a cell for every vertex. HEC-RAS generates a new cell for every vertex by joining the centroids of the grid cells. The finite volume formulation is applied on these newly generated cells. The advantage of the cell vertex method is that the application of boundary conditions becomes easy because the cell centroids lie on the boundaries.
2.3. Flood Mitigation Measures
Attempts by humans to protect themselves from flooding are as old as the history of civilization. Flood control measures may be divided into engineering measures (e.g., the construction of reservoirs, dikes, diversion of flood flows, and improvement of river channels) or administrative measures (flood forecasting, flood plain zoning, and flood insurance) [36]. Storing flood water in the upstream part of a drainage basin is the most direct way to reduce the flood hazard in the downstream part of the basin. There are three places where water can be stored: in the ground, in small reservoirs on creeks and minor streams, and in large reservoirs on the major stream channels of the river system.
The oldest, most common, and often most economical means of flooding protection is by constructing a system of dikes. Dikes should be kept at a good distance away from river channels. The very need for dikes indicates that we are probably dealing with an alluvial river flowing in a flood plain. Such rivers have a natural habit of continuously eroding their banks. The great hazard involved in a diking system is that it provides full protection up to a certain flood stage and no protection at all for higher stages. A long period of absence of extreme flood stages will create a feeling of security for inhabitants of dike-protected areas, leaving them unprepared for an eventual failure of the dike [31].
The most direct and effective way to cope with a flood situation is to take water away from the river channel. A primitive way of accomplishing this is to breach a dike on purpose, in an area where the resultant damage is relatively small, in order to save the dikes that protect another area where the damage would be relatively large. One requirement is that the area into which the floodwaters are diverted is free of habitation. A diversion channel will be most effective in lowering water levels if the diverted water can be taken away from the river, without returning it farther downstream. Dredging is the operation of removing material from one part of the water environment and relocating it to another [37,38]. The overall goal of most dredging activities is to reduce the extent of flooding, and it is performed as a flood management tool. It is sometimes effective because nature always fills the riverbed with sediments. For this reason, as a long-term solution, dredging is sometimes not a good concept. By increasing the channel roughness, flooding can be mitigated. However, if the channel roughness is increased, some inferior ecological effects might be experienced.
3. Data and Methods
3.1. Study Area
The Spree River originates in the Lausatian Mountains on the border of Czech Republic and Germany. It flows over a stretch of 380 km before meeting the Havel River in Berlin [39]. The study area includes approximately 11 km of the restored river reach of Spree River, which was used to simulate flooding scenarios using a one- and two-dimensional hydrodynamic model. The study site is located approximately 10 km north (downstream) of Cottbus, near coal mining activities (Figure 1). The catchment area is about 62 km2. The longitudinal gradient of the river reach is around 0.07%. The river has a mean discharge of 7.5 m3/s and a bankfull discharge of 35 m3/s [40,41].
3.2. Renaturation Project
There has been much manipulation of the Spree River over the years. The river was straightened, regulated, and diked. On top of that, agricultural lands were created by clearing out the forests along the river. This led to the deterioration of the natural structure of the area, causing a decline in regenerative capacity and ecological efficiency. Previously, the Spree River consisted of a widely branched river system with a floodplain extending up to 5 km, which was changed by the involvement of humans to change the landscape for their benefit. Therefore, in order to reestablish the efficient natural environment in the river, various works were carried out over the period of 2006 to 2014.
3.3. 2D Unsteady Model
An unsteady simulation for the basic model was created with a simulation window from 1 September to 31 October. Different time steps were considered, such as 1 s, 5 s, 10 s, 15 s, etc., up to 1 min. The initial condition was chosen as initial flow of 14 m3/s at reach no. 58. There are four types of external boundary conditions that may be linked directly to the 2D flow: flow hydrograph, stage hydrograph, normal depth, and rating curve. The normal depth and rating curve boundary conditions can only be used at locations where flow will leave the 2D flow area. The flow and stage hydrograph boundary conditions can be used for putting flow into or taking flow out of a 2D flow area. For a flow hydrograph, positive flow values will send flow into a 2D flow area, and negative flow values will take flow out of the 2D area. For the stage hydrograph, stages higher than the ground/water surface in a 2D flow area will send flow in, and stages lower than the water surface in the 2D flow area will send flow out. If a cell is dry and the stage boundary condition is lower than the 2D flow area cell minimum elevation, then no flow will be transferred [35]. In this model (Figure 2), a flow hydrograph was considered upstream and normal depth was considered downstream as the boundary conditions. A friction slope of 0.0003 was considered in the normal depth section as a boundary condition at downstream cross sections.
3.3.1. Implementation of the 2D Floodplain Model
HEC-RAS 5.0 can perform simulations with a 2D floodplain with the desired mesh size. This section provides a detailed description for creating a 1D and 2D floodplain model using HEC-RAS for the Spree River and its floodplain. The terrain data do not often include the actual channel bathymetry underneath the water surface. RAS Mapper can now modify the terrain data to include channel bathymetry by using the individual HEC-RAS cross-sectional geometry and the cross-sectional interpolation feature. The result from this step is to generate the channel terrain layer. The channel terrain layer is created by taking the channel bathymetry data from the cross sections and using the interpolation feature to interpolate an elevation for each grid cell between any two cross sections.
3.3.2. 2D Flow Area Mesh
The main concept of 2D floodplain modeling is the usage of a computational mesh. HEC-RAS uses an amalgamation of finite difference and finite volume methods to compute the water elevation at the center of each computational cell for a specific time step. The 2D modeling features in HEC-RAS allow the user to generate a computational mesh. In the Geometric Data Editor, the modeler can specify the limits of the computational mesh that envelopes the channel itself plus any adjacent floodplain areas.
Spatial details describing the polygon can be defined using the 2D Flow Area Editor button. Spatial details include the size of the individual 2D flow cells, as well as Manning’s roughness values for each cell. Manning’s roughness values can be defined for specified land use using a geographic information system (GIS) techniques. After the spatial details of the computational mesh are set, detailed information describing the computational grid, including a hydraulic property table, can be generated. There are tolerance input boxes that allow the user to have some control of the 2D grid. Finally, boundary conditions at the upstream and downstream ends using must be defined [41,42,43].
3.3.3. Connecting a 2D Flow Area to a 1D River Reach with a Lateral Structure
The 2D flow area elements can be connected to 1D elements in several ways: directly to the downstream end or the upstream end of a river reach; laterally to 1D river reaches using a Lateral (s); and/or directly to another 2D area or storage area using the SA/2D Area Connection. The process for connecting the 2D flow area to other hydraulic elements is accomplished in the HEC-RAS Geometric Editor. The 2D flow areas can be used to model areas behind levees or overbank flow by connecting a 1D river reach to the 2D area using a lateral structure. In general, lateral structure weir coefficients should be lower than typical values used for inline weirs. Additionally, when a lateral structure (i.e., weir equation) is being used to transfer flow from the river (1D region) to the floodplain (2D flow area), the weir coefficients that are used need to be very low, or too much flow will be transferred. Below is a table (Table 1) of rough guidelines for lateral weir coefficients under different conditions [44,45,46].
4. Results and Discussion
4.1. Sensitivity Analysis
Appropriate grid dimensions and computational time step are very important to assess flooding in 2D areas. The hydraulic modeling systems are powerful systems to choose spatial and time variables to the desired degree of accuracy (HEC-RAS manual) [44,45,46]. In this study, different computational time steps and grid sizes were analyzed to assess the flooding situation in the project area (Figure 3). The total project area was divided into six sub-floodplains (sub-reach), and a set of eight cells was selected to represent the response in the water depth due to the variation in time steps and grid size.
Figure 3 displays the project area with several cells for comparing flood depth at various time steps. Quantification of flood depth in HEC-RAS is substantially sensitive to the computational time step, which is a crucial parameter in numerical discretization of the computational domain and computational efficiency. Eight computational cells were chosen to show the sensitivity of varying computational time steps in Table 2.
4.2. Computational Time Step
For the sub-reach K6, flooding was calculated in a specific area for different time steps; the following table (Table 2) shows a comparison of flood depth. The table shows the change in the flood depth at the set of selected cells (Figure 3) with the change in computational time step. Figure 4 and Figure 5 show the response in flood depth with increasing time step. For all cells, the variation takes a parabolic shape where a certain maximum flood depth was reached (at time step 6s). The range of variation in flood depth was found to be 0.99 to 1.37 m. The corresponding time step of highest flood depth, i.e., 6s, can be considered for design purposes to be on the safe side. The computational time step is directly linked to the Courant number for the stability and accuracy of an unsteady model. Time steps were chosen by confirming the Courant number to be less than unity for numerical stability.
Figure 4 and Figure 5 illustrate the relationship between time step and flood depth at cells in the floodplain. Both figures show the impact of computational time step over the flood depth at the computational cells. Figure 6 and Figure 7 show the relationship between cross section distance in sub-reaches and flood depth at cells in the floodplain.
For the sub-reach K6, flooding was calculated in a specific area for different cross sections; the following table (Table 3) shows a comparison of flood depth.
4.3. Flood Management Strategy
Dredging and dike construction were carried out in different flood-prone locations along the Spree River to create a greater depth of water and to regulate water levels, respectively, with the main objective being to prevent flood. At certain locations, the riverbed was dredged approximately 0.3 m to 0.7 m, and dikes were constructed on the riverbank with a height of nearly 1 m to 3 m. Table 5 presents the details of dredging and dike construction.
5. Conclusions
Model simulations were performed for different time steps, grid size, and roughness coefficient, and it was observed that the model was sensitive to these parameters. When the time step was changed while keeping the same Manning’s value and cross-sectional distance, the overtopping of flow was prominent at the right bank of the river. This flood inundation increased with increasing time step. A curved pattern was observed, which suggested that even though the model was stable for different time steps, greater accuracy could be observed in the 6 s to 10 s range. This suggest that the model shows sensitivity to the time step. On the other hand, when different interpolated distances between cross sections were taken into account, there was an insignificant change in the flood inundation pattern.
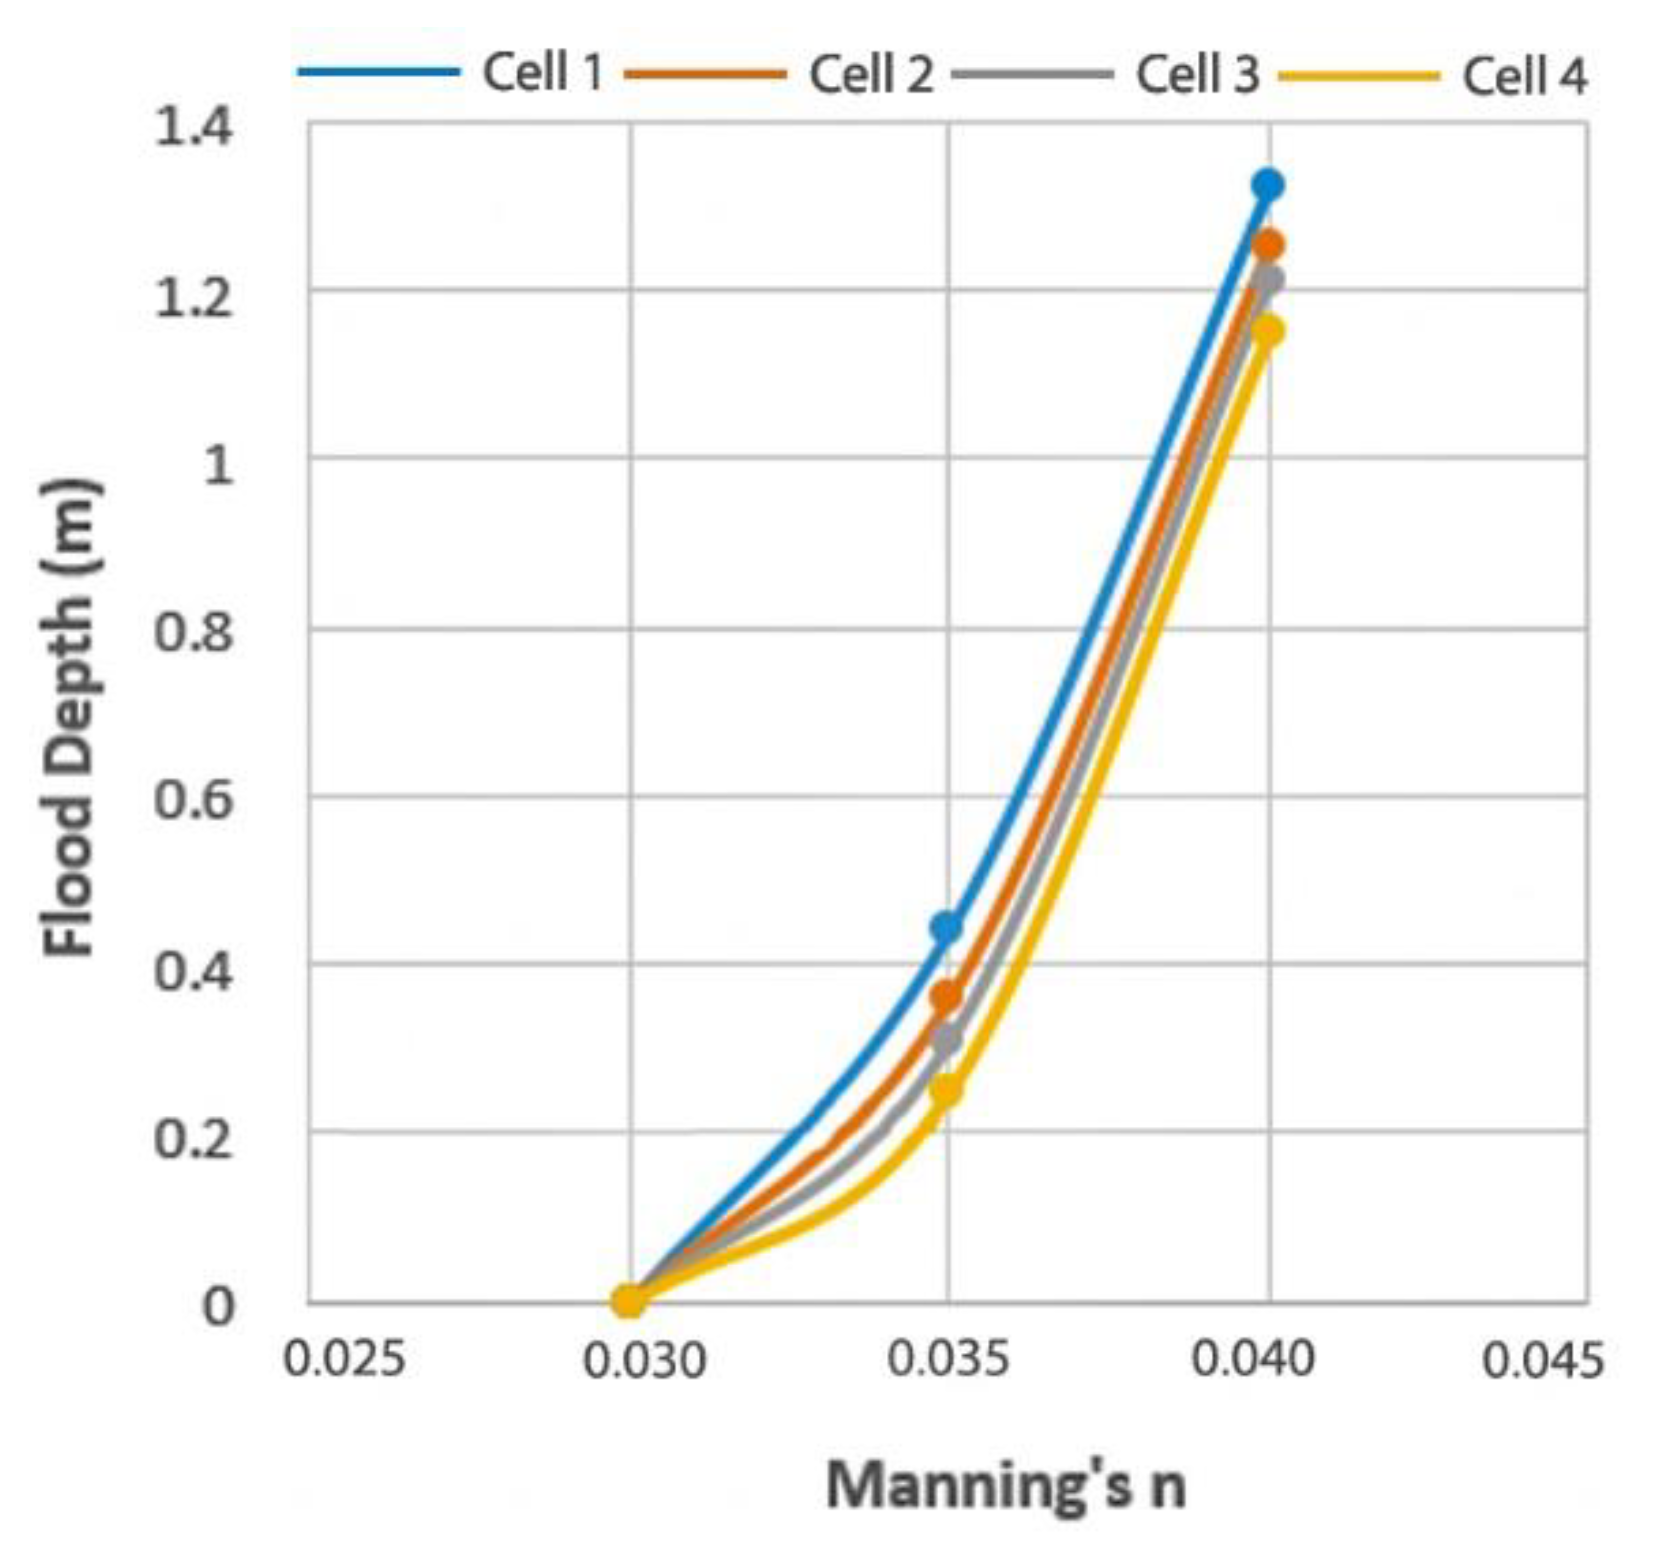
Also, the model showed sensitivity to the roughness coefficient. The extent of flooding was different for different roughness coefficients, which implies that the factors that increase the roughness in the floodplain are of vital importance in preventing flooding. Higher Manning’s n (more roughness) led to more flooding than lower Manning’s n (less roughness), which clearly suggests the importance of vegetation on the banks of the river to prevent flooding.
This renaturation project was one of the largest river renovations in the state of Brandenburg. The extent of the renaturation was over a length of 11 km and an area of 400 ha. Different mitigation measures adopted in the model provided a change in the inundation pattern. As the results show above, all the measures like change in vegetation pattern (Manning’s n), dredging, and dike inclusion in the model reduced the flood inundation significantly. This suggests that the use of such measures could be important to protect the surrounding areas, which hold economical value due to their touristic appeal. However, it should also be considered that these flood prevention strategies are not the perfect way to keep the riverine area natural, which is the essence of any renaturation project. This can be achieved by creating an environment where the flora and fauna can survive and flourish. As seen in many different places, the ecological balance in the area can play a vital role in the stability of the river and its floodplain. In some cases, however, the presence of residential areas could be more important than maintaining the ecological balance. Therefore, measures should be taken considering the trade-off between the environmental impact due to human intervention and the natural losses.
Even though a fairly good result was obtained from this model, there are still some areas which could potentially be included in further study. This model provided a good result to visualize the flood area. However, the model created a coupling of 1D and 2D. One approach could be to use a 2D model for the entire study area, both the channel and the floodplain. This way, the visualization could be clearer. Since 2D analysis using 1D–2D coupling is a relatively new element in the HEC-RAS software, there is room for further improvement in the approach.
In addition, this model was constructed for fluvial flooding but not for pluvial flooding, as the aspect of rainfall was not included. A more realistic result could be obtained if storm water was incorporated into the model. A model that couples storm water modeling and the 1D–2D coupled model could help to obtain a more realistic outcome. When the underlying equations are taken into account, this model did not cover both the equations for 2D flow. The effect of fully dynamic equations for the river flow could create different results than the diffusive wave model. The results of both the equations can be simulated and compared, which could create a basis for application in another similar area. Even with the restored land, there has been some flooding in the area. Adopting structural measures to mitigate it could neglect the integrity of renaturation. Therefore, further investigations and study could be carried out to analyze other new renaturation techniques and structural flood mitigation measures and compare them to find the best solution which is feasible both environmentally and economically.
The parameters in the model showed sensitivity to changes as indicated by different results for different scenarios in the preceding section. Initially, the model was unstable due to the presence of lateral structures. Some of them had elevation lower than the connecting cell elevation of the 2D floodplain area. This created flow errors in the model, causing instability, which suggests that the alignment of the lateral structure plays an important role in the model stability. There are several ways to couple the 1D model and 2D floodplain, such as by connecting a 2D flow area to a 1D river reach via a lateral structure or by directly connecting an upstream river reach to a downstream/upstream 2D flow. Among them, the lateral structure method is more frequently used. However, connecting a 1D river with a 2D floodplain via a lateral structure is sometimes cumbersome due to some inconsistency between the terrain and lateral structure elevation. On the other hand, to predict the real extent of flooding, terrain data are needed beyond the original floodplain area. However, only a portion of the floodplain is considered in the geometry file. Design engineers and contractors alike seek to furnish projects that basically alleviate the impact of flooding. With other responsibilities and concerns, such as the market situation, budget allotment, and even climate change effects, it is important to stay one step ahead. Putting a scheme in place that is built to be efficacious and reliable will require a concept for flood mitigation that remains adaptable and meets environmental and regulatory requirements at the same time.
Author Contributions
Conceptualization, M.A.A.M.; Methodology, M.A.A.M. and M.M.S.Y.; Investigation, M.A.A.M. and M.M.S.Y.; Formal Analysis, M.A.A.M. and M.M.S.Y.; Resources, M.A.A.M.; Data Preparation, M.A.A.M.; Writing—Original Draft Preparation, M.A.A.M., M.M.S.Y., M.T.A. and R.K. Writing—Review and Editing, M.M.S.Y., M.T.A. and R.K.; Visualization, M.A.A.M. and M.M.S.Y.; and Project Administration, M.A.A.M. All authors have read and agreed to the published version of the manuscript.
Funding
This research received no external funding.
Institutional Review Board Statement
Not applicable.
Informed Consent Statement
Not applicable.
Data Availability Statement
Not applicable.
Conflicts of Interest
The authors declare no conflict of interest.
References
- Islam, A.; Deb Barman, S. Drainage basin morphometry and evaluating its role on flood-inducing capacity of tributary basins of Mayurakshi River, India. SN Appl. Sci. 2020, 2, 1087. [Google Scholar] [CrossRef]
- Sanyal, J.; Lu, X.X. Application of remote sensing in flood management with special reference to monsoon Asia: A review. Nat. Hazards 2004, 33, 283–301. [Google Scholar] [CrossRef]
- Mehedi, M.A.A.; Khosravi, M.; Yazdan, M.M.S.; Shabanian, H. Exploring Temporal Dynamics of River Discharge using Univariate Long Short-Term Memory (LSTM) Recurrent Neural Network at East Branch of Delaware River. Preprints 2022, 2022090398. [Google Scholar] [CrossRef]
- Yazdan, M.M.S.; Kumar, R.; Leung, S.W. The Environmental and Health Impacts of Steroids and Hormones in Wastewater Effluent, as Well as Existing Removal Technologies: A Review. Ecologies 2022, 3, 206–224. [Google Scholar] [CrossRef]
- Kumar, R.; Yazdan, M.M.S.; Mehedi, M.A.A. Demystifying the Preventive Measures for Flooding from Groundwater Triggered by the Rise in Adjacent River Stage. Preprints 2022, 2022090452. [Google Scholar] [CrossRef]
- Lóczy DOpperman, J.J.; Moyle, P.B.; Larsen, E.W.; Florsheim, J.L.; Manfree, A.D. Floodplains: Processes and Management for Ecosystem Services. Hung. Geogr. Bull. 2018, 67, 189–190. [Google Scholar] [CrossRef] [Green Version]
- Islam, A.; Ghosh, S. Community-based riverine flood risk assessment and evaluating its drivers: Evidence from Rarh Plains of India. Appl. Spat. Anal. Policy 2022, 15, 1–47. [Google Scholar] [CrossRef]
- Sanyal, J.; Lu, X.X. Remote sensing and GIS-based flood vulnerability assessment of human settlements: A case study of Gangetic West Bengal, India. Hydrol. Process. Int. J. 2005, 19, 3699–3716. [Google Scholar] [CrossRef]
- Chapman, G.P.; Rudra, K. Water as foe, water as friend: Lessons from Bengal’s millennium flood. J. South Asian Dev. 2007, 2, 19–49. [Google Scholar] [CrossRef]
- Laplante, P.A. Encyclopedia of Image Processing; CRC Press: Boca Raton, FL, USA, 2018. [Google Scholar] [CrossRef]
- Gibling, M.R.; Nanson, G.C.; Maroulis, J.C. Anastomosing river sedimentation in the Channel Country of central Australia. Sedimentology 1998, 45, 595–619. [Google Scholar] [CrossRef]
- Ahmad, M.; Al Mehedi, M.A.; Yazdan, M.M.S.; Kumar, R. Development of Machine Learning Flood Model Using Artificial Neural Network (ANN) at Var River. Liquids 2022, 2, 147–160. [Google Scholar] [CrossRef]
- Mehedi, M.A.A.; Yazdan, M.M.S. Automated Particle Tracing & Sensitivity Analysis for Residence Time in a Saturated Subsurface Media. Liquids 2022, 2, 72–84. [Google Scholar] [CrossRef]
- Yazdan, M.M.S.; Rahaman, A.Z.; Noor, F.; Duti, B.M. Establishment of co-relation between remote sensing based trmm data and ground based precipitation data in north-east region of bangladesh. In Proceedings of the 2nd International Conference on Civil Engineering for Sustainable Development (ICCESD-2014), KUET, Khulna, Bangladesh, 14–16 February 2014. [Google Scholar]
- Crosato, A.; Saleh, M.S. Numerical study on the effects of floodplain vegetation on river planform style. Earth Surf. Process. Landf. 2011, 36, 711–720. [Google Scholar] [CrossRef]
- Yazdan, M.M.S.; Khosravia, M.; Saki, S.; Mehedi, M.A.A. Forecasting Energy Consumption Time Series Using Recurrent Neural Network in Tensorflow. Preprints 2022, 2022090404. [Google Scholar] [CrossRef]
- Maillard, P.; Gomes, M.F.; Pôssa, É.M.; Paula, R.S.D. Challenges of defining the floodplain through the “mean ordinary flood line” approach using remote sensing in Brazil: A case study of the São Francisco River. RBRH 2022, v27, e5. [Google Scholar] [CrossRef]
- Mallick, J.; Salam, R.; Amin, R.; Islam, A.R.M.; Islam, A.; Siddik, M.; Alam, N.; Alam, G.M. Assessing factors affecting drought, earthquake, and flood risk perception: Empirical evidence from Bangladesh. Nat. Hazards 2022, 112, 1633–1656. [Google Scholar] [CrossRef]
- Das, S.; Kar, N.S.; Bandyopadhyay, S. Glacial lake outburst flood at Kedarnath, Indian Himalaya: A study using digital elevation models and satellite images. Nat. Hazards 2015, 77, 769–786. [Google Scholar] [CrossRef]
- Mehedi, M.A.A.; Yazdan, M.M.S.; Ahad, M.T.; Akatu, W.; Kumar, R.; Rahman, A. Quantifying Small-Scale Hyporheic Streamlines and Resident Time under Gravel-Sand Streambed Using a Coupled HEC-RAS and MIN3P Model. Eng 2022, 3, 276–300. [Google Scholar] [CrossRef]
- Al Mehedi, M.A.; Reichert, N.; Molkenthin, F. Sensitivity Analysis of Hyporheic Exchange to Small Scale Changes in Gravel-Sand Flumebed Using A Coupled Groundwater-Surface Water Model. In Proceedings of the EGU General Assembly 2020, Online, 4–8 May 2020. [Google Scholar] [CrossRef]
- Scamardo, J.; Wohl, E. Sediment storage and shallow groundwater response to beaver dam analogues in the Colorado Front Range, USA. River Res. Appl. 2020, 36, 398–409. [Google Scholar] [CrossRef]
- Mambretti, S. Flood Risk Assessment and Management; WIT Press: Ashurst, UK, 2012; Available online: http://www.witpress.com/978-1-84564-6 (accessed on 20 August 2022).
- Andreani, L.; Stanek, K.P.; Gloaguen, R.; Krentz, O.; Domínguez-González, L. DEM-based analysis of interactions between tectonics and landscapes in the Ore Mountains and Eger Rift (East Germany and NW Czech Republic). Remote Sens. 2014, 6, 7971–8001. [Google Scholar] [CrossRef] [Green Version]
- Yazdan, M.M.S.; Ahad, M.T.; Jahan, I.; Mazumder, M. Review on the Evaluation of the Impacts of Wastewater Disposal in Hydraulic Fracturing Industry in the United States. Technologies 2020, 8, 67. [Google Scholar] [CrossRef]
- Tayefi, V.; Lane, S.N.; Hardy, R.J.; Yu, D. A comparison of one-and two-dimensional approaches to modelling flood inundation over complex upland floodplains. Hydrol. Process. Int. J. 2007, 21, 3190–3202. [Google Scholar] [CrossRef]
- Bates, P.D.; De Roo, A.P.J. A simple raster-based model for flood inundation simulation. J. Hydrol. 2000, 236, 54–77. [Google Scholar] [CrossRef]
- Bladé, E.; Gómez-Valentín, M.; Dolz, J.; Aragón-Hernández, J.L.; Corestein, G.; Sánchez-Juny, M. Integration of 1D and 2D finite volume schemes for computations of water flow in natural channels. Adv. Water Resour. 2012, 42, 17–29. [Google Scholar] [CrossRef]
- Al Hossain, B.M.T.; Ahmed, T.; Aktar, M.N.; Fida, M.; Khan, A.; Islam, A.S.; Yazdan, M.M.S.; Noor, F.; Rahaman, A.Z. Climate Change Impacts on Water Availability in the Meghna Basin. In Proceedings of the 5th International Conference on Water and Flood Management (ICWFM-2015), Dhaka, Bangladesh, 6–8 March 2015; pp. 6–8. [Google Scholar]
- Lane, S.N. Hydraulic modelling in hydrology and geomorphology: A review of high resolution approaches. Hydrol. Process. 1998, 12, 1131–1150. [Google Scholar] [CrossRef]
- Yazdan, M.M.S.; Ahad, M.T.; Mallick, Z.; Mallick, S.P.; Jahan, I.; Mazumder, M. An Overview of the Glucocorticoids’ Pathways in the Environment and Their Removal Using Conventional Wastewater Treatment Systems. Pollutants 2021, 1, 141–155. [Google Scholar] [CrossRef]
- HEC-RAS. Available online: https://www.hec.usace.army.mil/software/hec-ras/ (accessed on 25 June 2019).
- Akbari, G.; Firoozi, B. Implicit and explicit numerical solution of Saint-Venant equations for simulating flood wave in natural rivers. In Proceedings of the 5th National Congress on Civil Engineering, Mashhad, Iran, 4–6 May 2010. [Google Scholar]
- Mańko, R. The influence of weight coefficients in the Preissman scheme on flows in the lower Odra river network using the Hec-Ras software. ITM Web Conf. 2018, 23, 00024. [Google Scholar] [CrossRef] [Green Version]
- HEC-RAS User’s Manual. Available online: https://www.hec.usace.army.mil/confluence/rasdocs/rasum/latest (accessed on 19 April 2019).
- Pinos, J.; Timbe, L. Performance assessment of two-dimensional hydraulic models for generation of flood inundation maps in mountain river basins. Water Sci. Eng. 2019, 12, 11–18. [Google Scholar] [CrossRef]
- Baan, P.J.; Klijn, F. Flood risk perception and implications for flood risk management in the Netherlands. Int. J. River Basin Manag. 2004, 2, 113–122. [Google Scholar] [CrossRef] [Green Version]
- Nones, M.; Gerstgraser, C. Morphological changes of a restored reach: The case of the Spree River, Cottbus, Germany. In Hydrodynamic and Mass Transport at Freshwater Aquatic Interfaces; Springer: Cham, Switzerland, 2016; pp. 167–182. [Google Scholar] [CrossRef]
- Gädeke, A.; Hölzel, H.; Koch, H.; Pohle, I.; Grünewald, U. Analysis of uncertainties in the hydrological response of a model-based climate change impact assessment in a subcatchment of the Spree River, Germany. Hydrol. Process. 2014, 28, 3978–3998. [Google Scholar] [CrossRef]
- Nones, M. Sediment management of rivers and Water Framework Directive: The case of the Spree River. In Proceedings of the 36th IAHR World Congress, The Hague, The Netherlands, 28 June–3 July 2015; p. 28. [Google Scholar]
- Brunner, G.W. HEC-RAS river analysis system. In Hydraulic Reference Manual; Version 1.0; Hydrologic Engineering Center: Davis, CA, USA, 1995. [Google Scholar]
- Floodplain Modeling Manual; 2002; 78p. Available online: https://www.fema.gov/sites/default/files/documents/fema_floodplain-modeling-manual_hec-ras-procedures-hec-2-modelers_4-2002.pdf (accessed on 20 August 2022).
- Federal Highway Administration (FHWA). Hydraulics of Bridge Waterways, Hydraulic Design Series No. 1, 2nd ed.; Joseph, N., Bradley, U.S., Eds.; Department of Transportation: Washington, DC, USA, 1978. [Google Scholar]
- Ippen, A.T. Channel Transitions and Controls, Chap. VIII in Hunter Rouse (Editor): Engineering Hydraulics; John Wiley & Sons, Inc.: New York, NY, USA, 1950; pp. 496–588. [Google Scholar]
- Unites State Bureau of Reclamation (USBR). Water Measurement Manual. 2001. Available online: http://www.usbr.gov/tsc/techreferences/mands/wmm/ (accessed on 25 March 2017).
- U.S. Army Corps of Engineers (COE). Hydraulic Design of Spillways; EM 1110-2-1603, Plate 33; Department of the Army, Office of the Chief of Engineers: Arlington County, VA, USA, 1965. [Google Scholar]
Figure 1.
(a) Satellite image of the study area, (b) Channel across the major geographic locations, and (c) river location in Germany are illustrated in the figure.
Figure 1.
(a) Satellite image of the study area, (b) Channel across the major geographic locations, and (c) river location in Germany are illustrated in the figure.
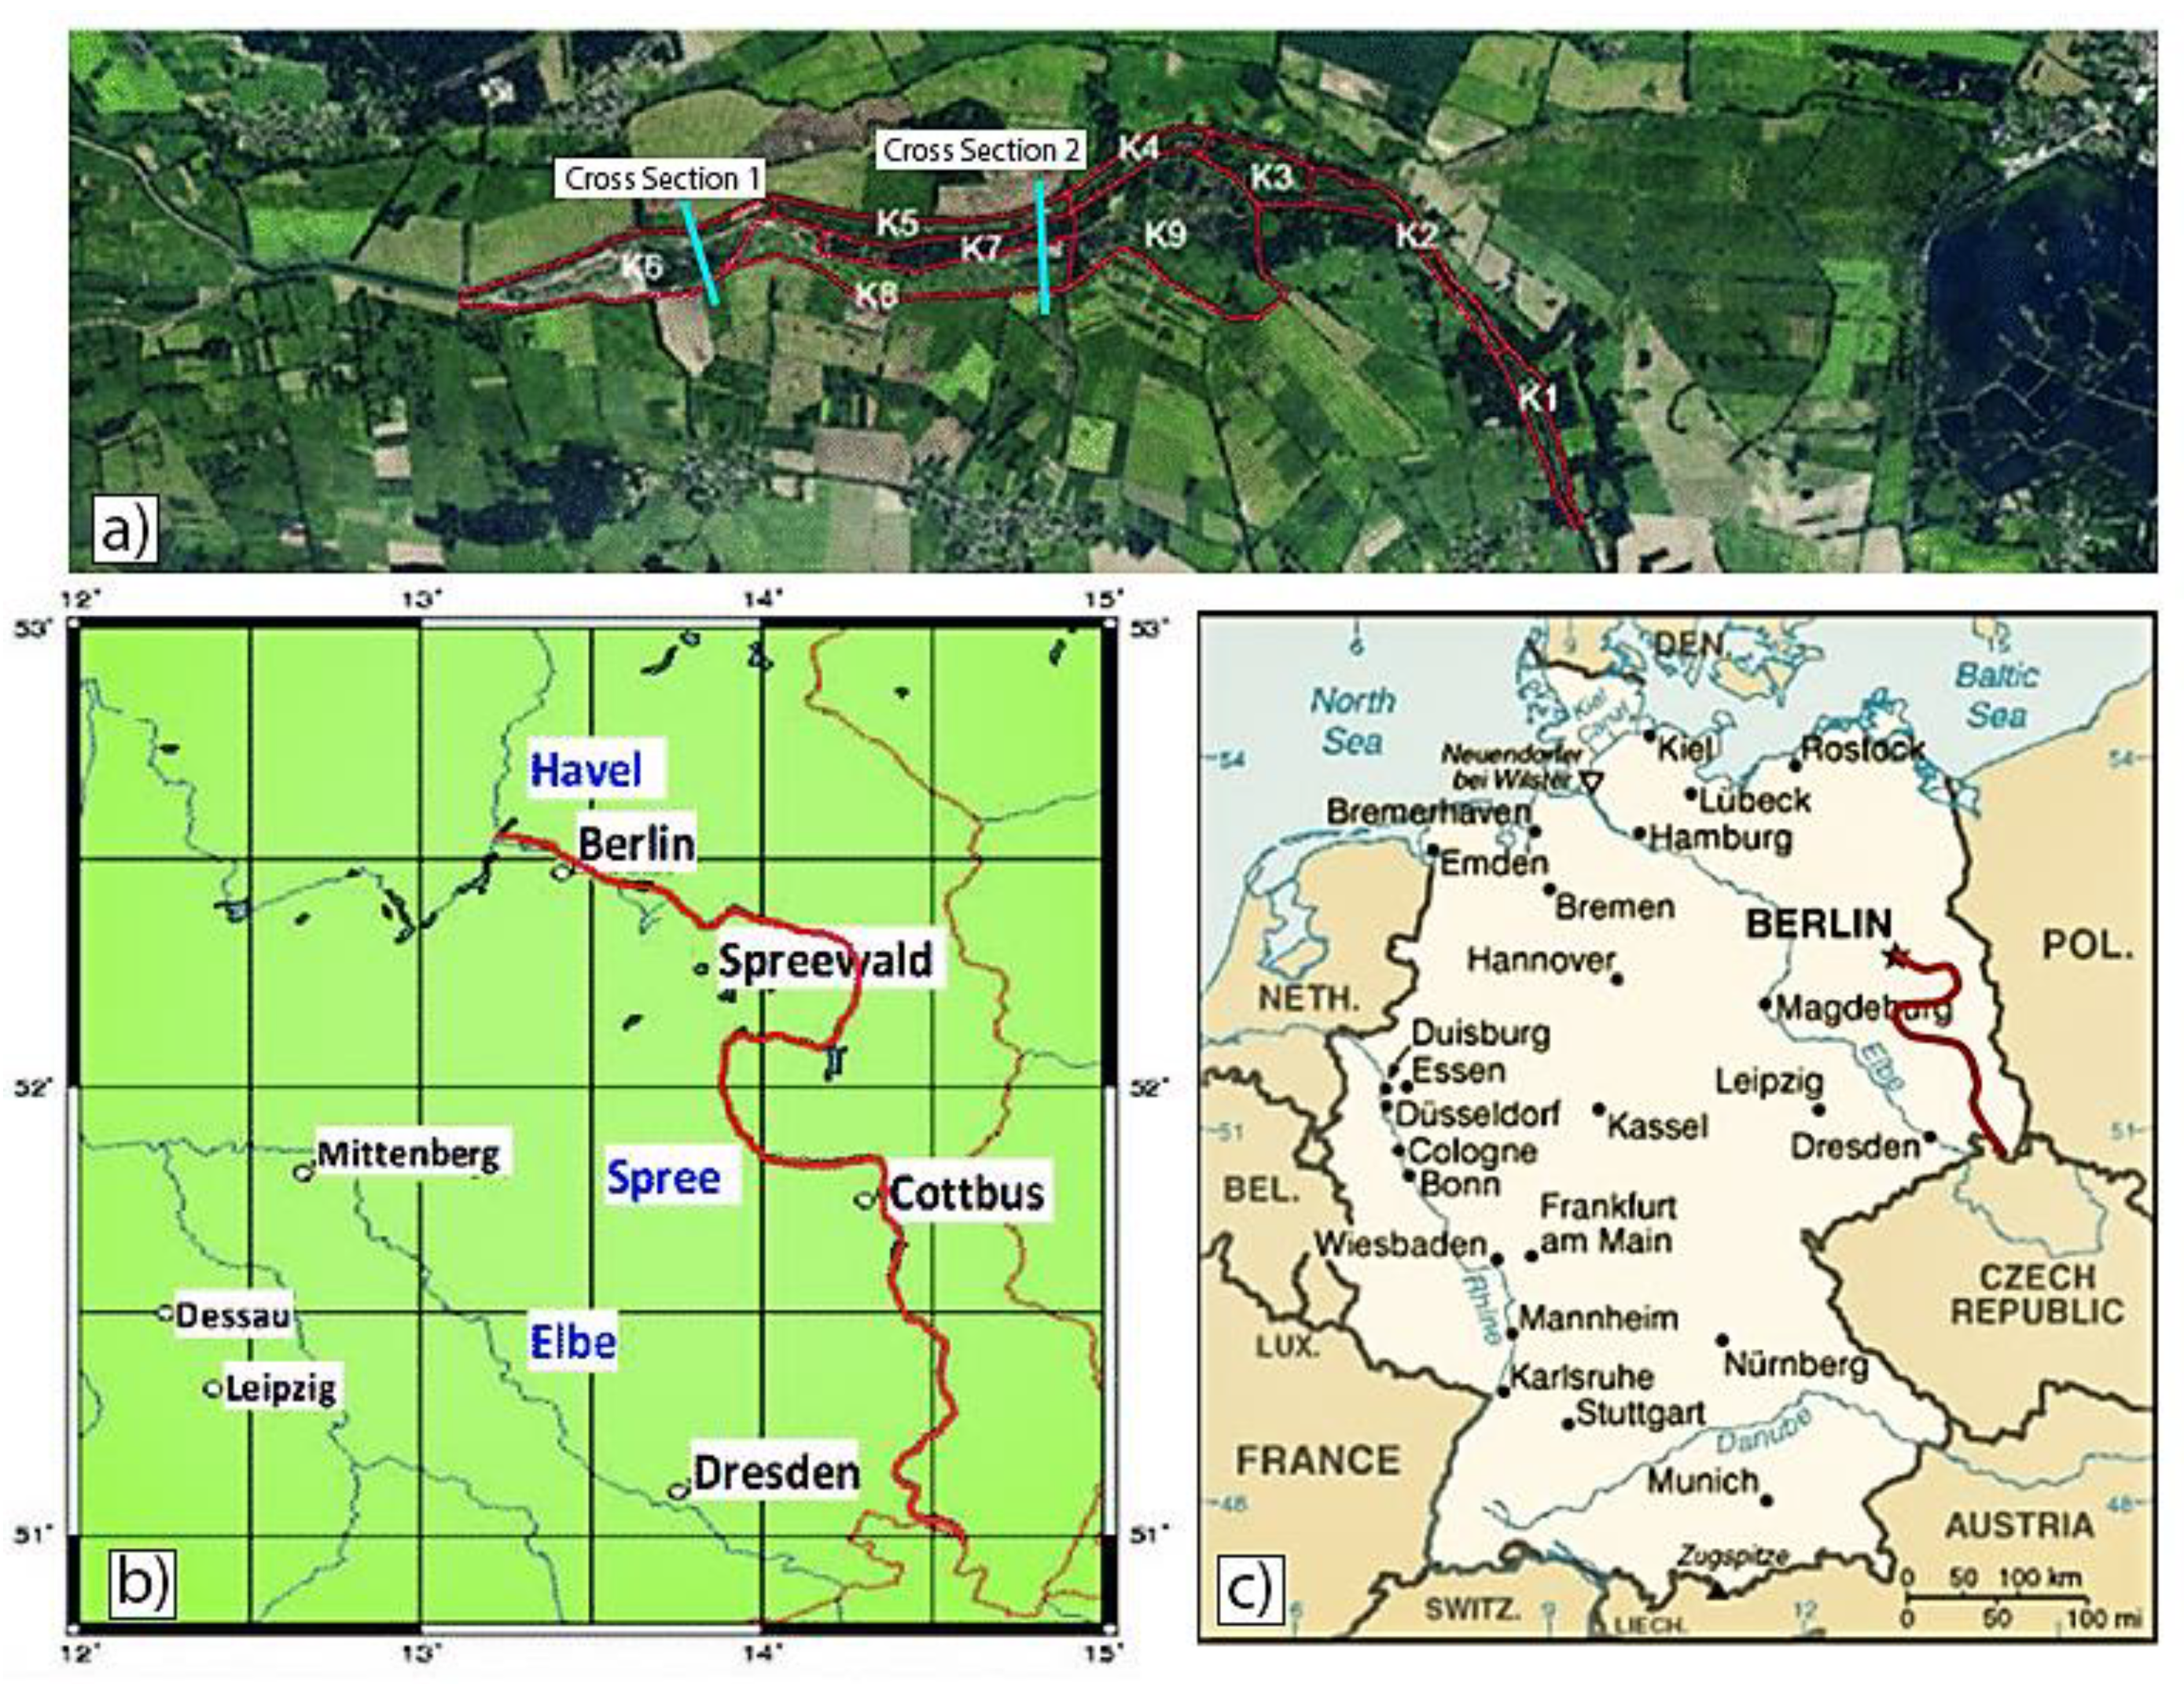
Figure 2.
The flow hydrograph for an upstream section shows the time range of the maximum flow during the observed flood in September 2014.
Figure 2.
The flow hydrograph for an upstream section shows the time range of the maximum flow during the observed flood in September 2014.

Figure 3.
Project area showing different cells for flood depth comparison in different time steps.

Figure 4.
The relation between time step and flood depth at four indicated cells (Cells 1–4) in the floodplain.
Figure 4.
The relation between time step and flood depth at four indicated cells (Cells 1–4) in the floodplain.
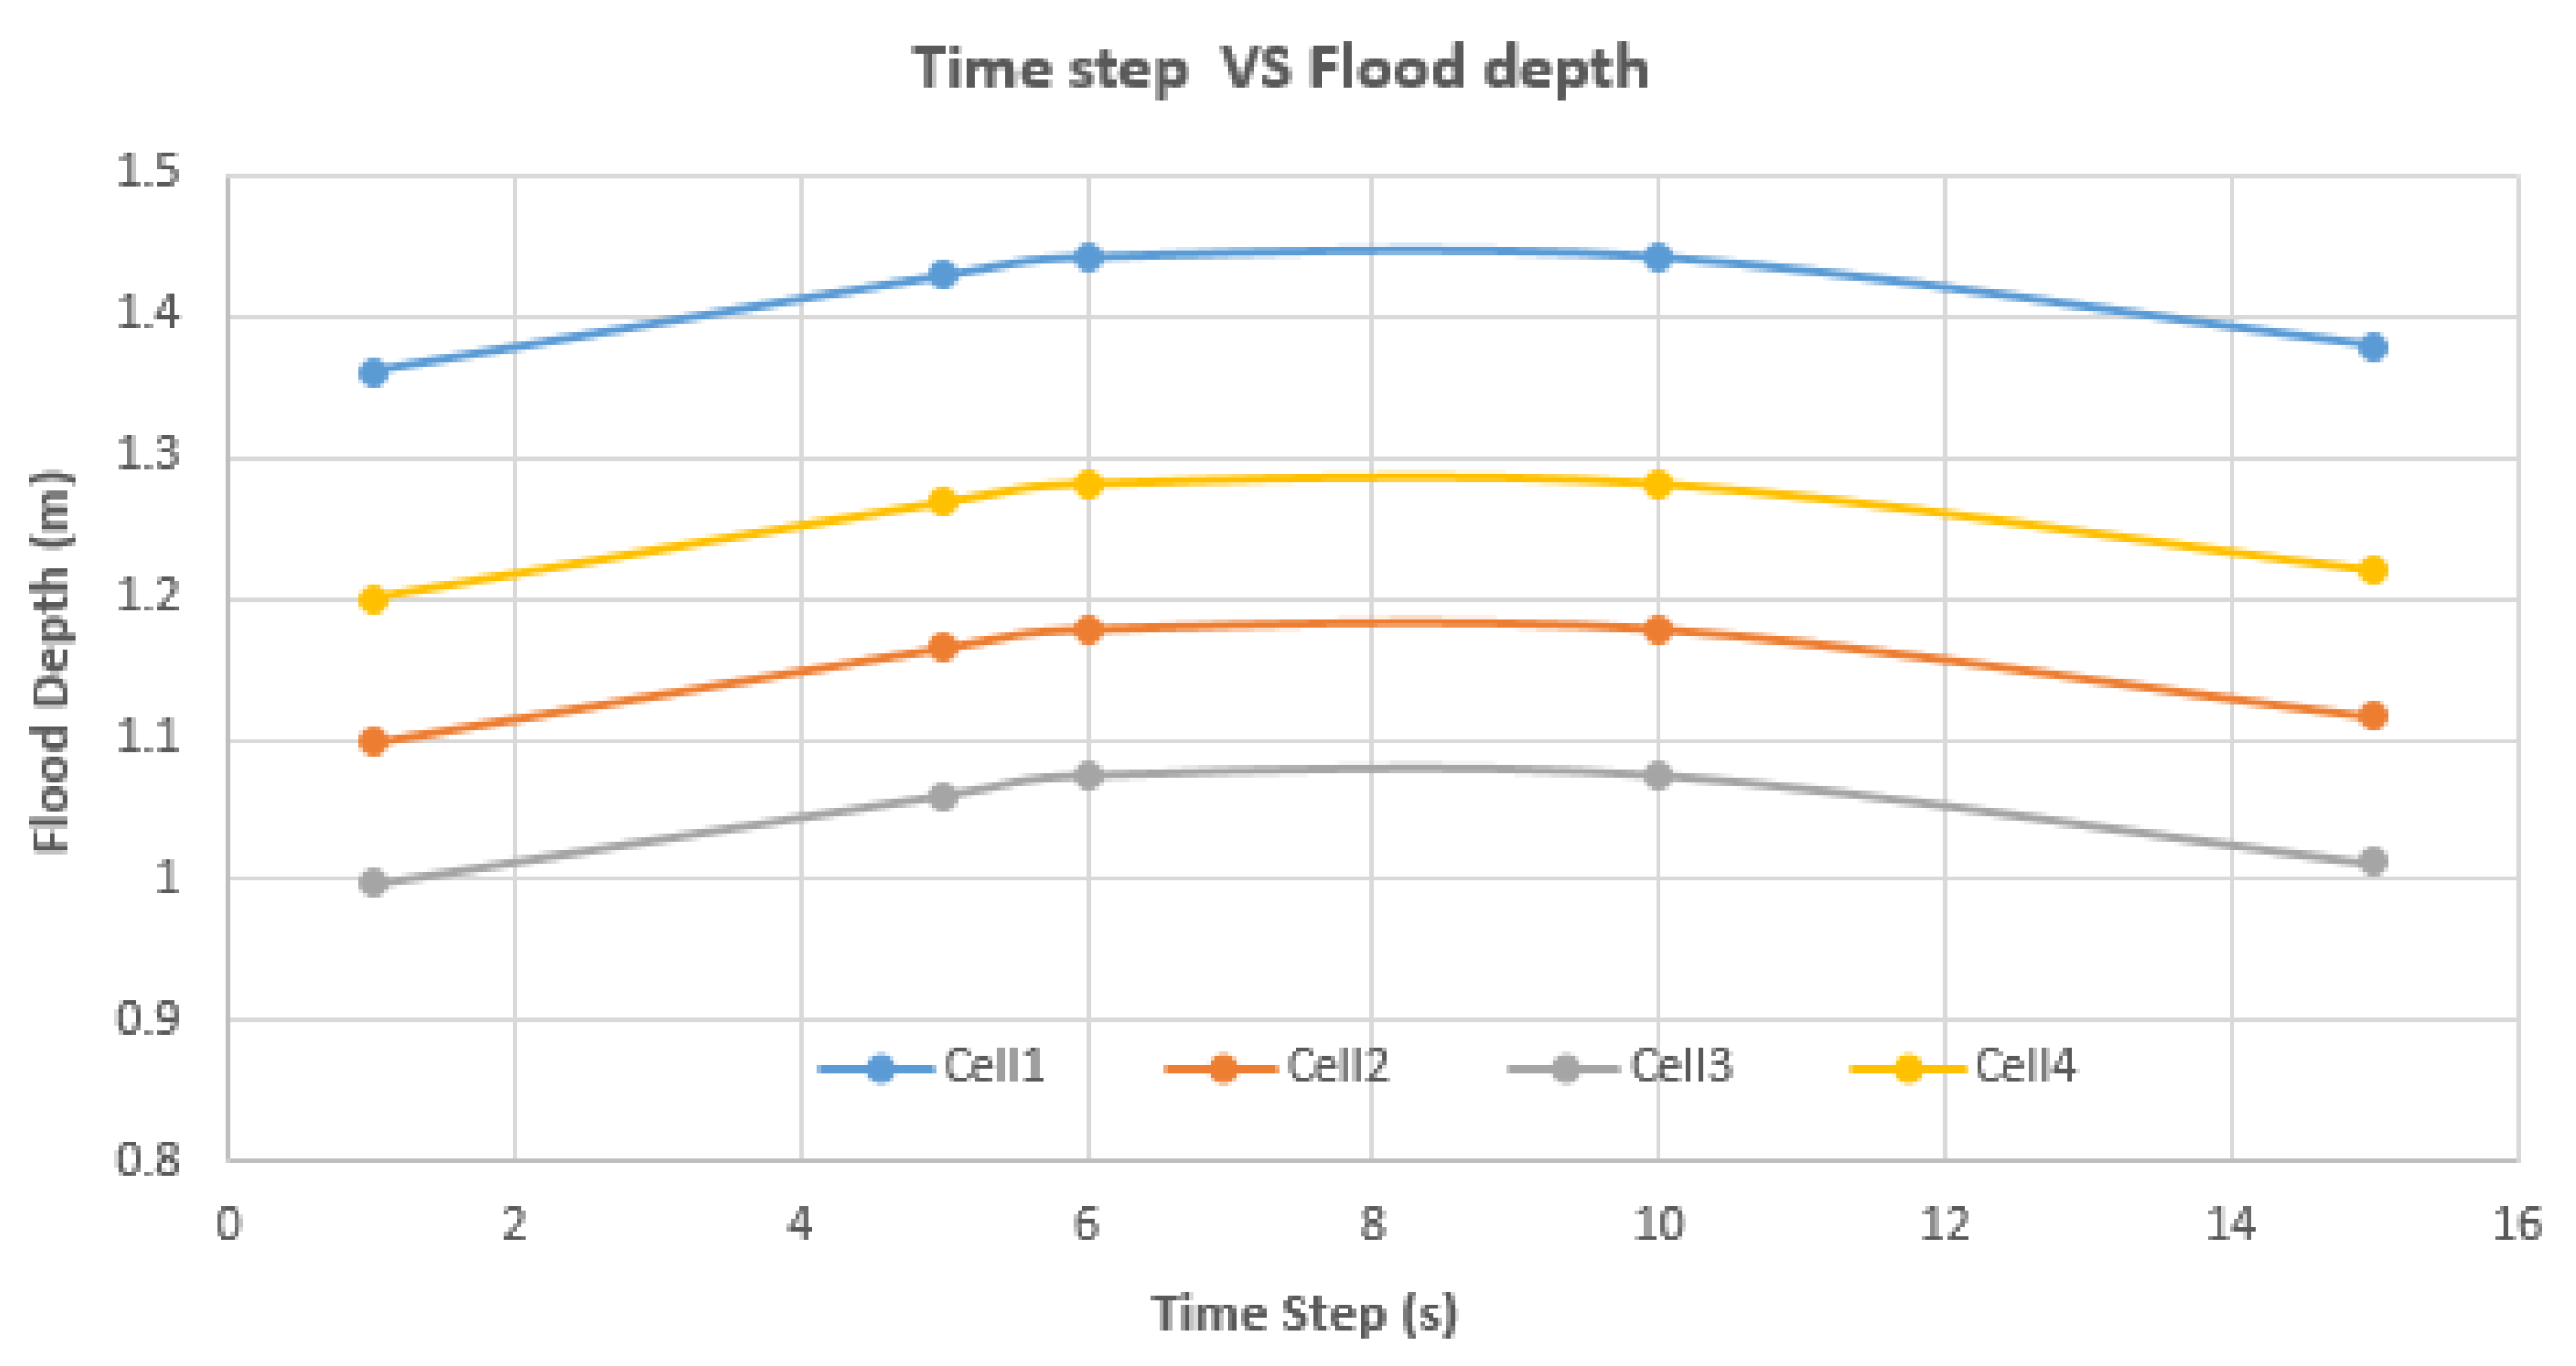
Figure 5.
Change in the maximum flood depth value (Cells 5–8) for different time steps in sub-reach K6.
Figure 5.
Change in the maximum flood depth value (Cells 5–8) for different time steps in sub-reach K6.
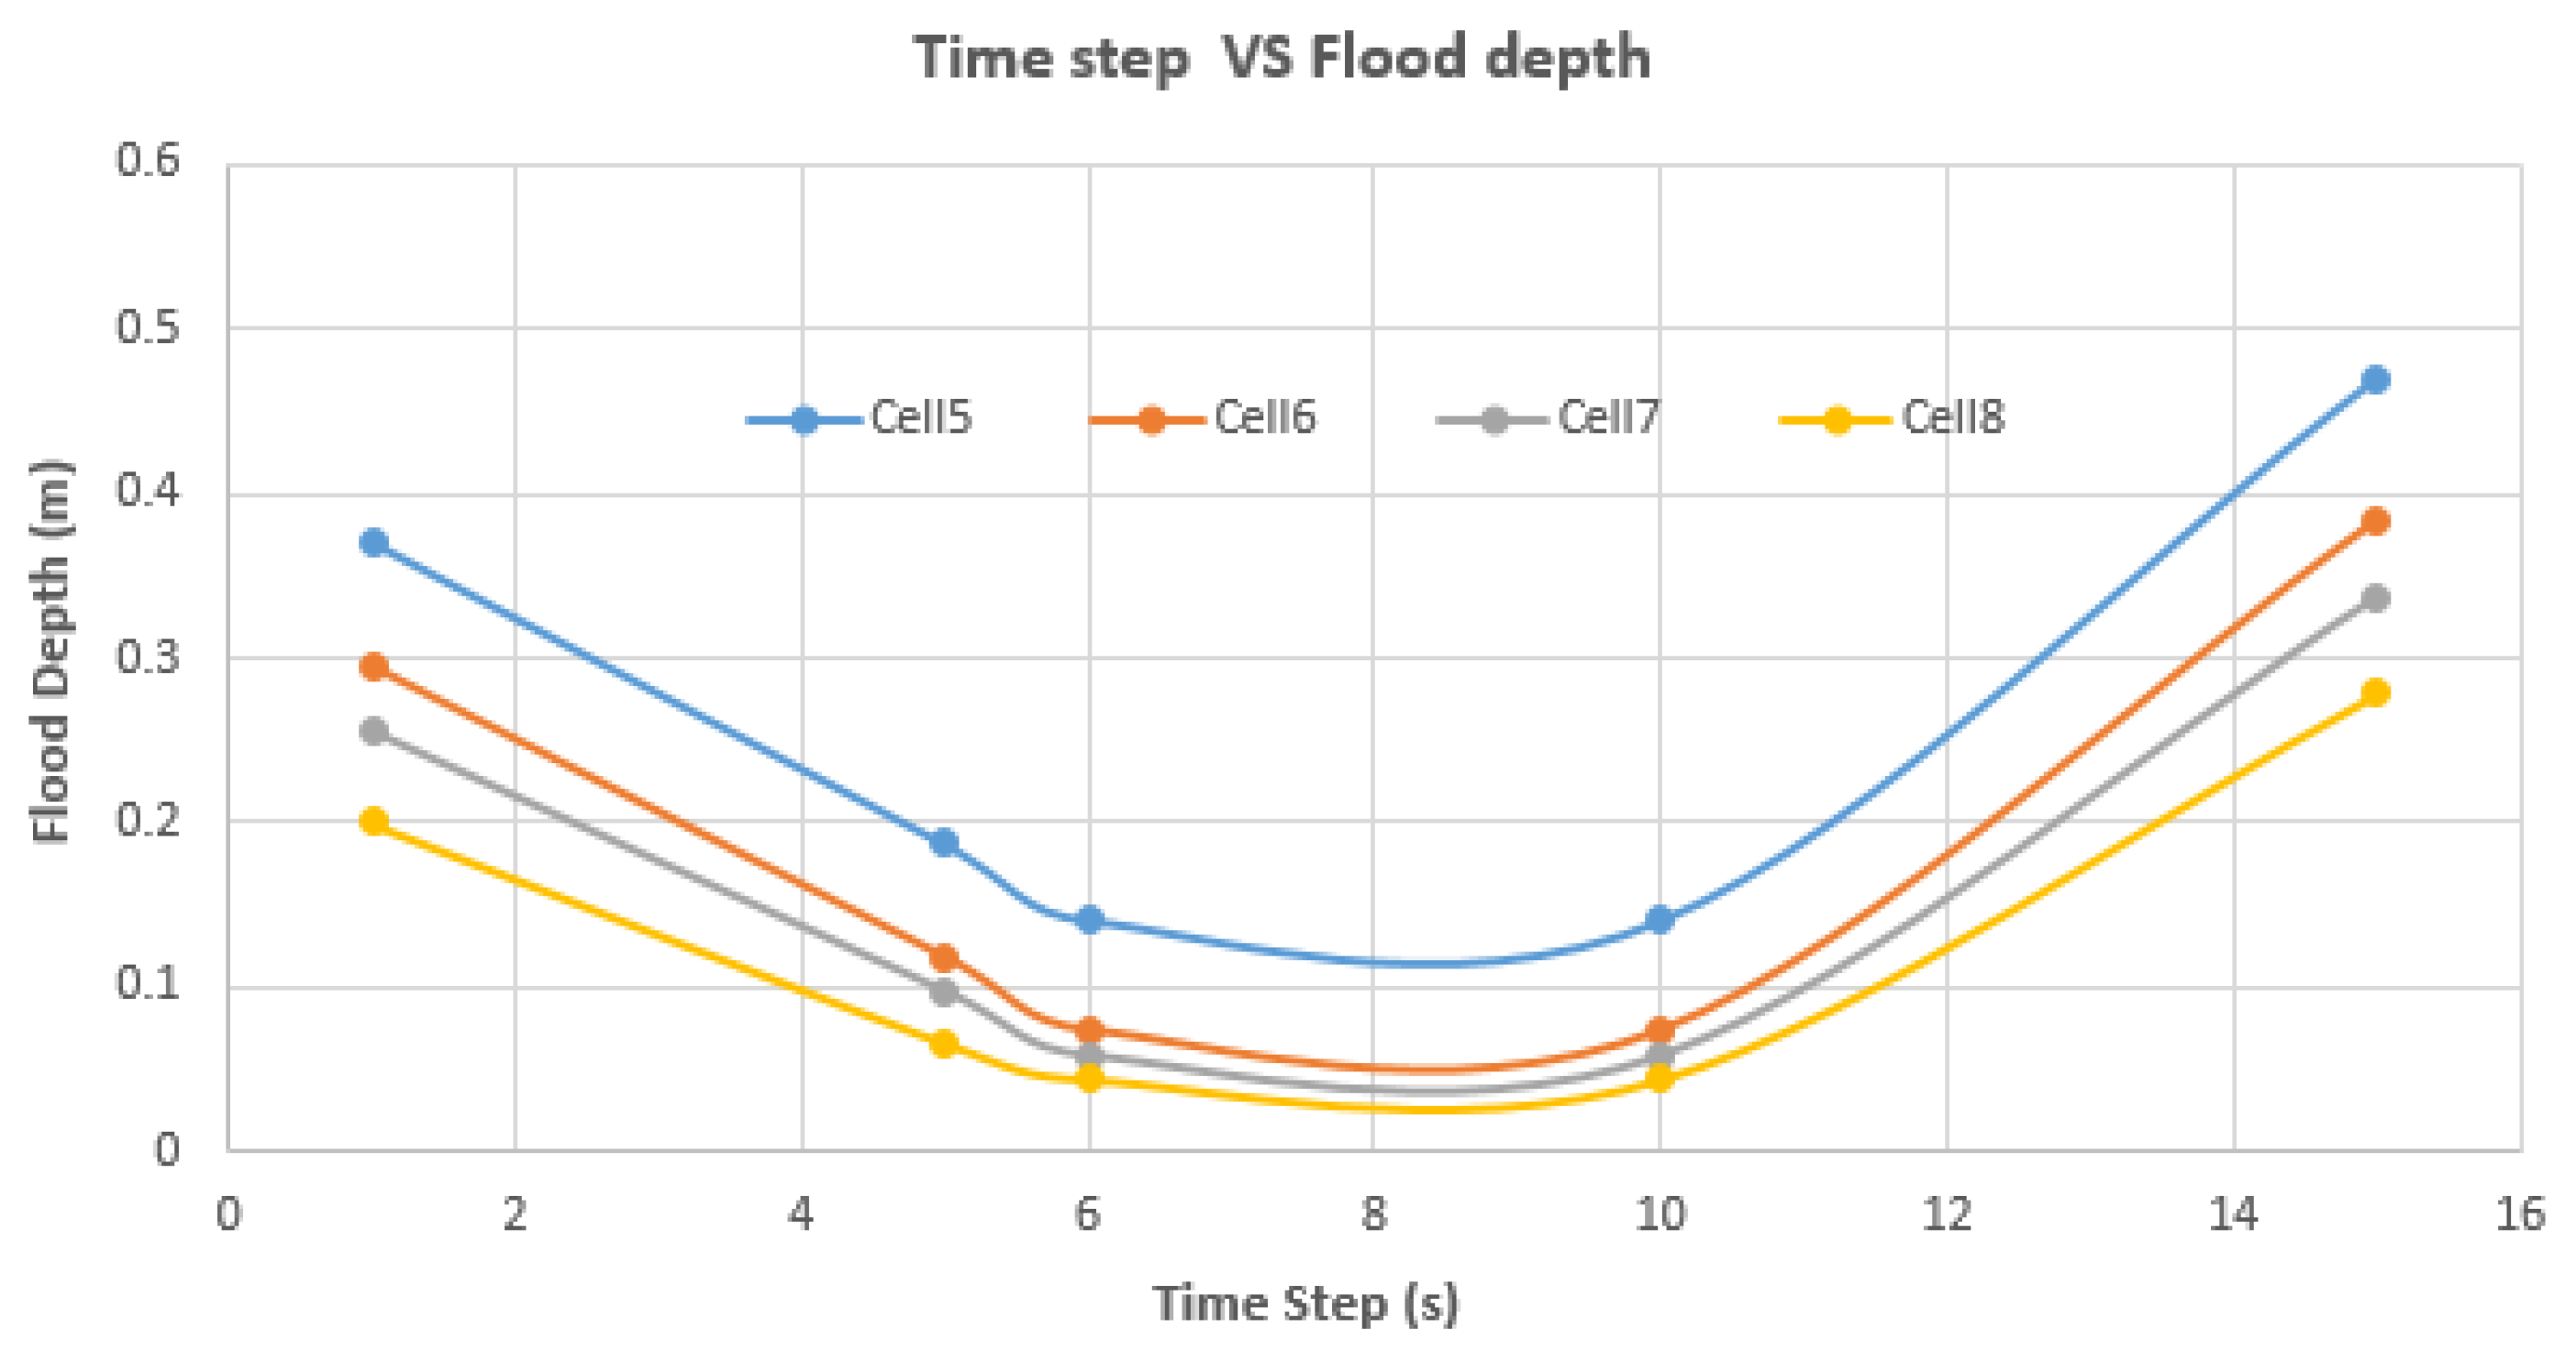
Figure 6.
Change in the maximum flood depth value (Cells 1–4) for different cross-sectional distances in sub-reach K6.
Figure 6.
Change in the maximum flood depth value (Cells 1–4) for different cross-sectional distances in sub-reach K6.
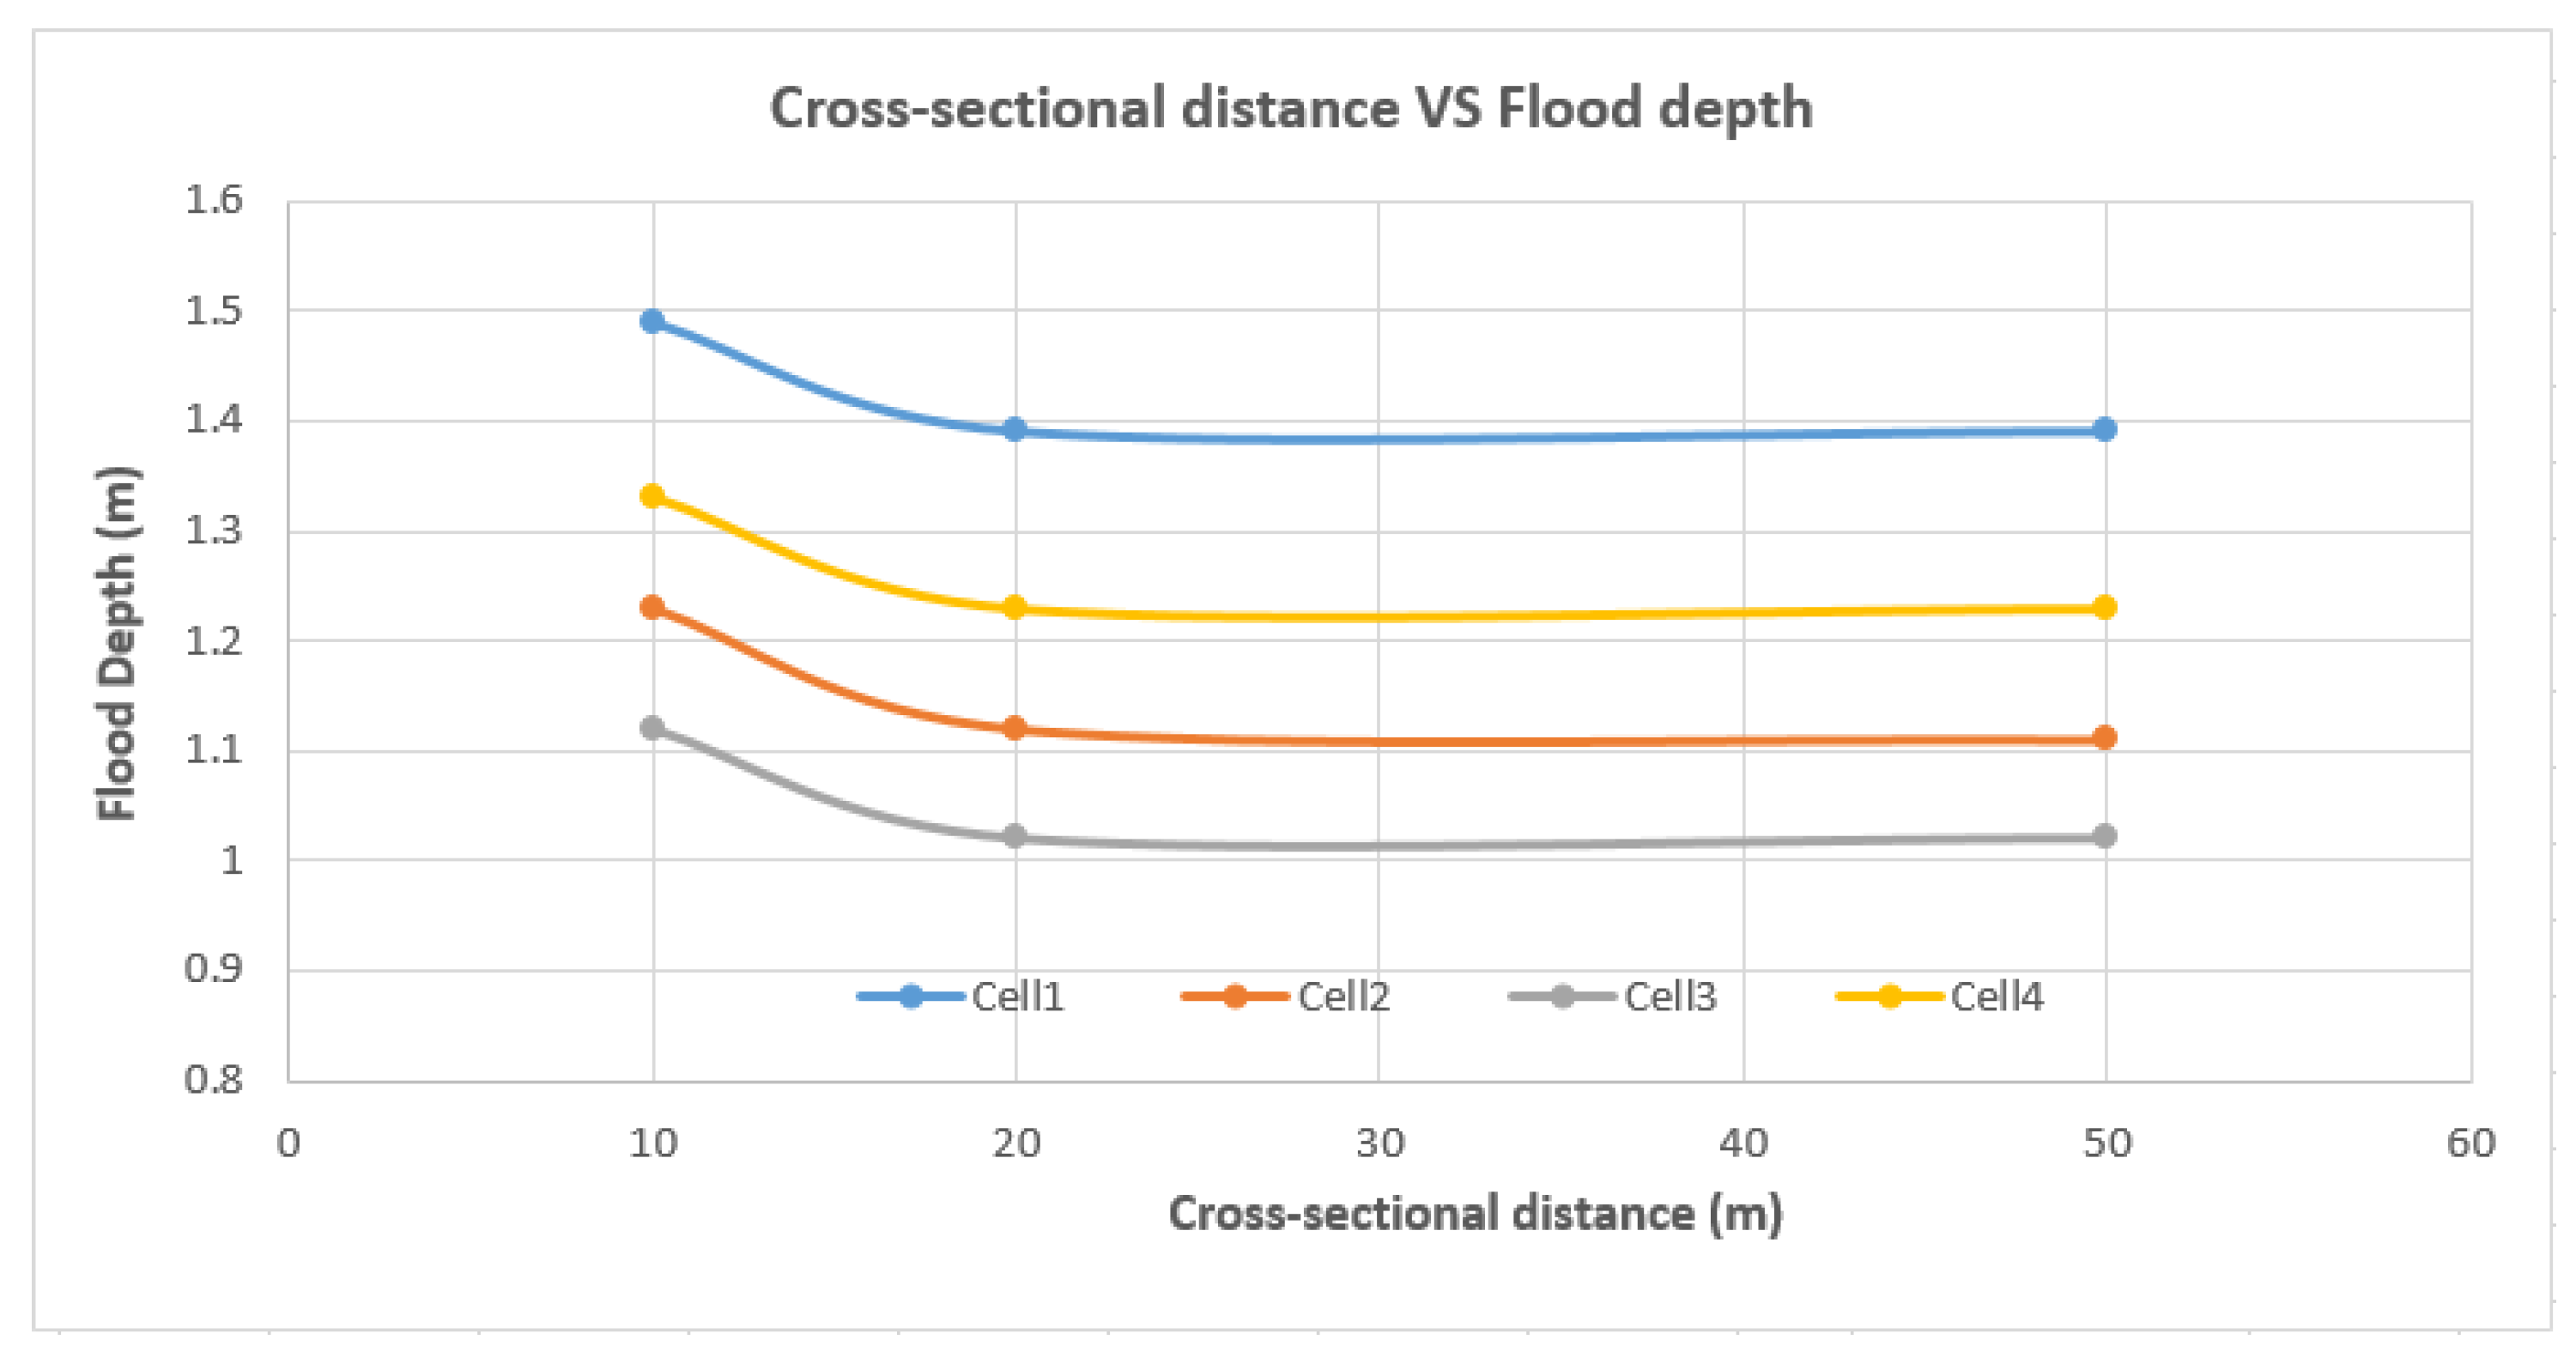
Figure 7.
Change in the maximum flood depth value (Cells 5–8) for different cross-sectional distances in sub-reach K6.
Figure 7.
Change in the maximum flood depth value (Cells 5–8) for different cross-sectional distances in sub-reach K6.

Figure 8.
Change in the maximum flood depth (Cells 1–4) value for different Manning’s n in sub-reach K6.
Figure 8.
Change in the maximum flood depth (Cells 1–4) value for different Manning’s n in sub-reach K6.
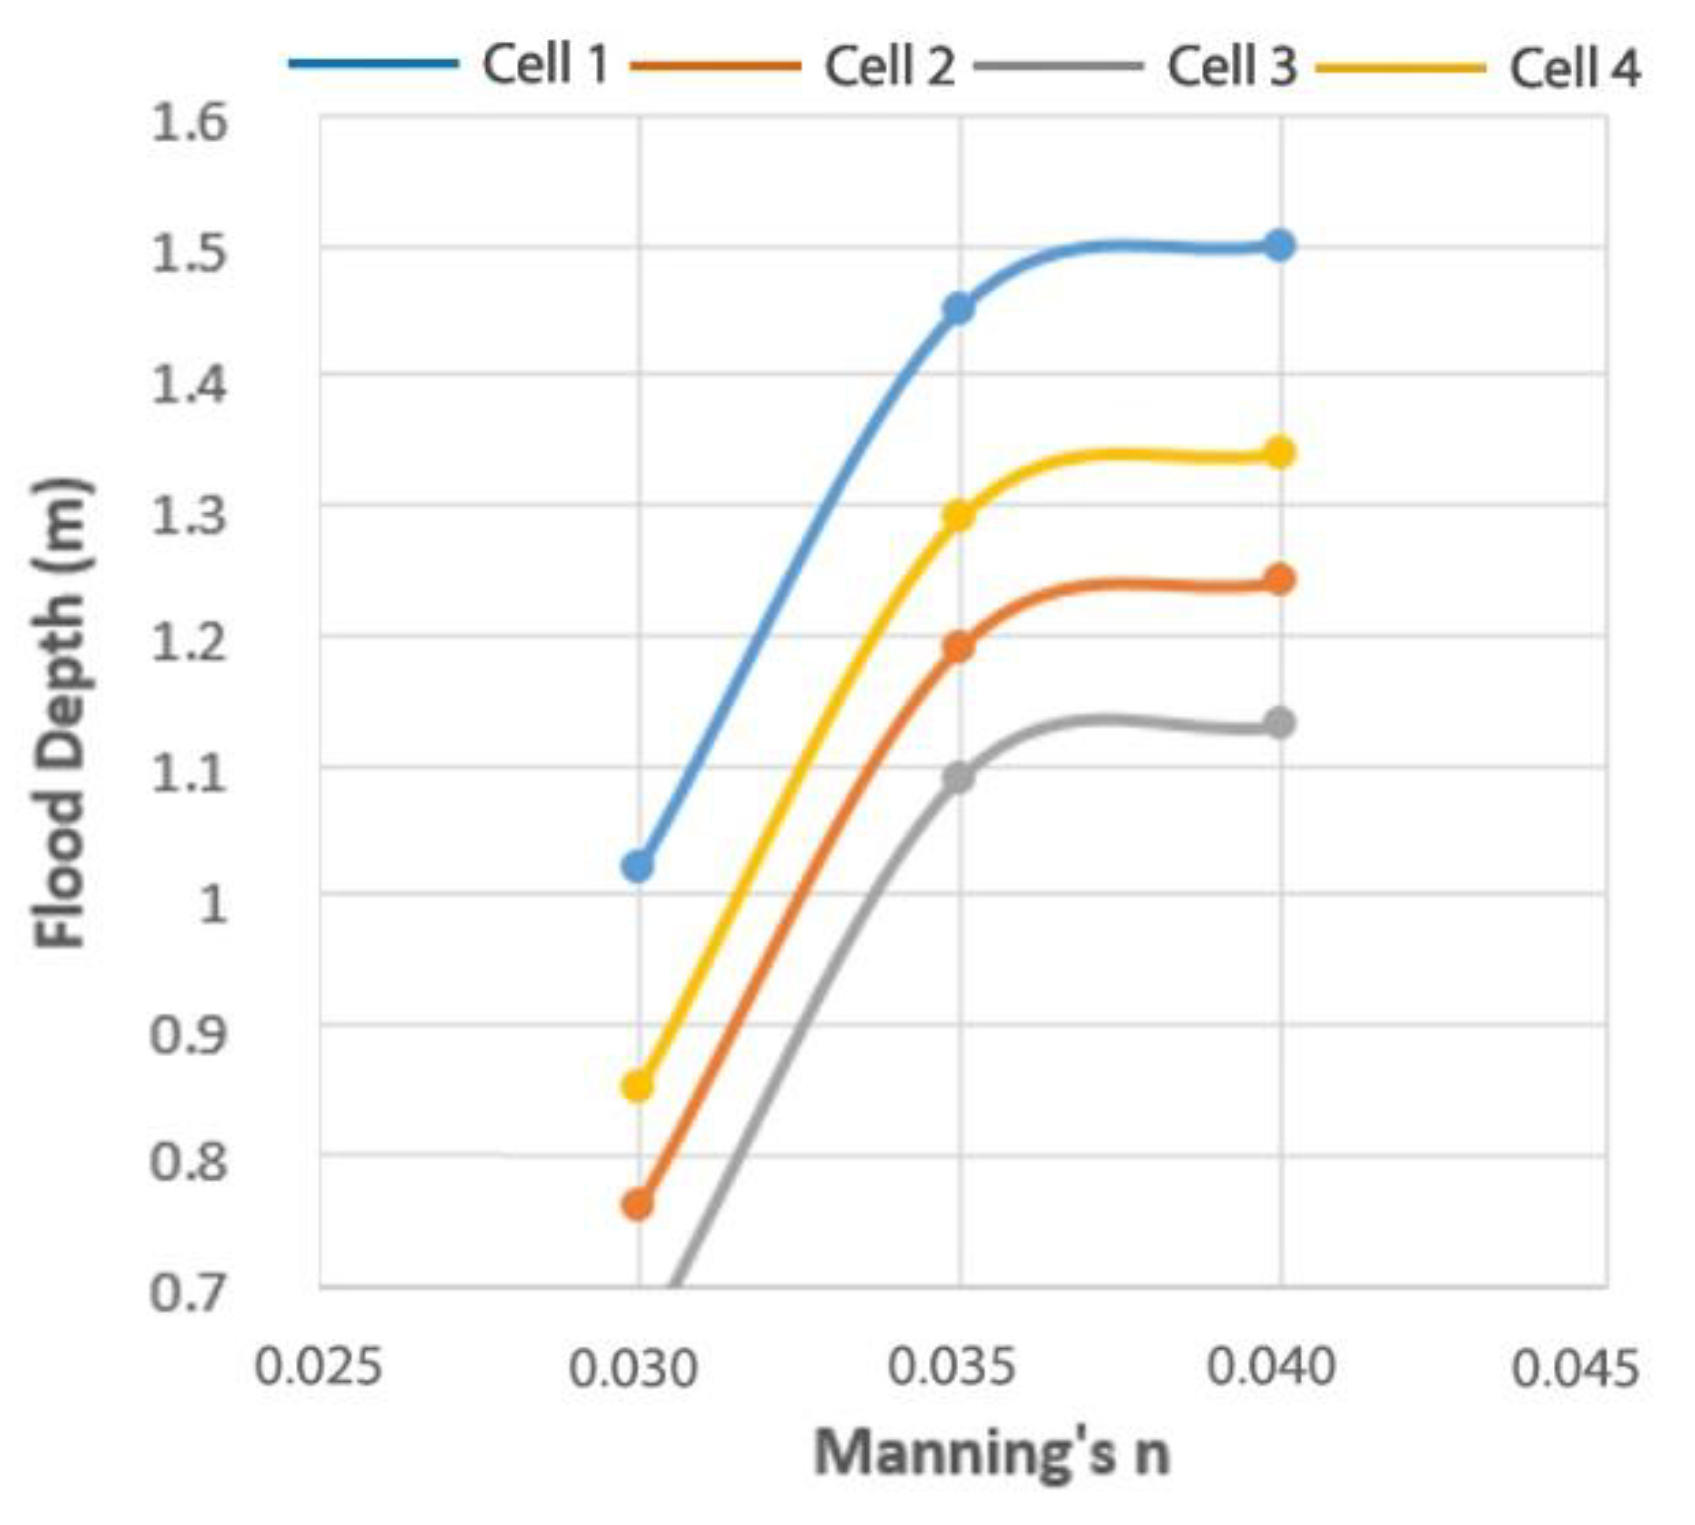
Figure 9.
Change in the maximum flood depth (Cells 5–8) value for different Manning’s n in sub-reach K6.
Figure 9.
Change in the maximum flood depth (Cells 5–8) value for different Manning’s n in sub-reach K6.

Table 1.
Lateral weir coefficients.
| What Is Being Modeled with the Lateral Structure | Description | Range of Weir Coefficients |
|---|---|---|
| Levee/Roadway—3ft or higher above natural ground | Broad crested weir shape, flow over Levee/road acts like weir flow | 1.5 to 2.6 (2.0 default) SI Units: 0.83 to 1.43 |
| Levee/Roadway—1 to 3 ft elevated above ground | Broad Crested weir shape, flow over levee/road acts like weir flow, but becomes submerged easily. | 1.0 to 2.0 SI Units: 0.55 to 1.1 |
| Natural high ground barrier—1 to 3 ft high | Does not really act like a weir, but water must flow over high ground to get into 2D area. | 0.5 to 1.0 SI Units: 0.28 to 0.55 |
| Non elevated overbank terrain. Lat Structure not elevated above ground | Overland flow escaping the main river. | 0.2 to 0.5 SI Units: 0.06 to 0.28 |
Table 2.
Maximum flood depth values in different cells for certain time steps in sub-reach K6.
| Time Step (s) | Cell 1 | Cell 2 | Cell 3 | Cell 4 | Cell 5 | Cell 6 | Cell 7 | Cell 8 |
|---|---|---|---|---|---|---|---|---|
| Flood Depth (m) | ||||||||
| 1 | 1.36 | 1.10 | 1.00 | 1.20 | 0.37 | 0.30 | 0.26 | 0.20 |
| 5 | 1.43 | 1.17 | 1.06 | 1.27 | 0.19 | 0.12 | 0.1 | 0.07 |
| 6 | 1.44 | 1.18 | 1.07 | 1.28 | 0.14 | 0.08 | 0.06 | 0.05 |
| 10 | 1.44 | 1.18 | 1.07 | 1.28 | 0.14 | 0.08 | 0.06 | 0.05 |
| 15 | 1.38 | 1.12 | 1.01 | 1.22 | 0.47 | 0.38 | 0.34 | 0.28 |
Table 3.
Maximum flood depth values in different cells for certain cross sections in sub-reach K6.
| Cross Sections | Cell 1 | Cell 2 | Cell 3 | Cell 4 | Cell 5 | Cell 6 | Cell 7 | Cell 8 |
|---|---|---|---|---|---|---|---|---|
| Flood Depth (m) | ||||||||
| 10 | 1.49 | 1.23 | 1.12 | 1.33 | 0.21 | 0.25 | 0.28 | 0.24 |
| 20 | 1.39 | 1.12 | 1.02 | 1.23 | 0.48 | 0.40 | 0.35 | 0.29 |
| 50 | 1.39 | 1.11 | 1.02 | 1.23 | 0.79 | 0.72 | 0.06 | 0.68 |
Table 4.
Maximum flood depth values in different cells for certain cross sections in sub-reach K6 (varying Manning’s n value).
Table 4.
Maximum flood depth values in different cells for certain cross sections in sub-reach K6 (varying Manning’s n value).
| Manning’s n | Cell 1 | Cell 2 | Cell 3 | Cell 4 | Cell 5 | Cell 6 | Cell 7 | Cell 8 |
|---|---|---|---|---|---|---|---|---|
| Flood Depth (m) | ||||||||
| 0.030 | 1.02 | 0.76 | 0.65 | 0.85 | 0 | |||
| 0.035 | 1.45 | 1.19 | 1.09 | 1.29 | 0.44 | 0.36 | 0.31 | 0.25 |
| 0.040 | 1.50 | 1.24 | 1.13 | 1.34 | 1.32 | 1.25 | 1.21 | 1.15 |
Table 5.
Details of dredging and dike construction along the river Spree.
| River Station | Reach Length (m) | Cross Section Number | Dredging (0.3 m–0.7 m) | Dike (1 m–3 m) |
|---|---|---|---|---|
| 1–3.4615 | 1456.772 | 1,2,3 | 0.7 | 3 |
| 7.0182–9 | 600 | 7,8,9 | 0.7 | 3 |
| 10.333–11.250 | 40 | 10,11 | 0.7 | 3 |
| 14.286–15.367 | 271.774 | 14,15 | 0.65 | 3 |
| 16.667–18 | 67.05 | 16,17,18 | 0.65 | 2.5 |
| 23.854–25.2 | 141.149 | 24 | 0.6 | 2.5 |
| 26–26.396 | 215.706 | 26 | 0.35 | 2 |
| 35.818–36.143 | 37.589 | 36 | 0.35 | 2 |
| 37.415–39 | 279.575 | 38 | 0.35 | 2 |
| 42–42.086 | 35.179 | 42 | 0.3 | 1 |
| 47.705–49.667 | 322.777 | 48,49 | 0.3 | 1 |
| 50.25–51.4 | 155.6 | 50 | 0.3 | 1 |
Table 6.
Comparison of water stage between the base scenario and after-dredging scenario for different cross sections. The locations of the cross sections can be found in Figure 1.
Table 6.
Comparison of water stage between the base scenario and after-dredging scenario for different cross sections. The locations of the cross sections can be found in Figure 1.
| Cross Section no. | Scenario 1 (after Dredging) | Base Scenario |
|---|---|---|
| 1 | 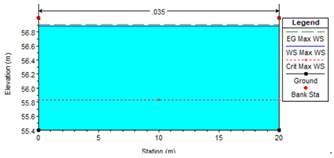 |  |
| 2 | 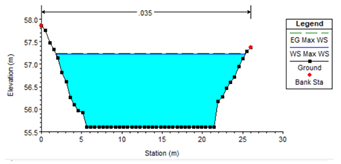 |  |
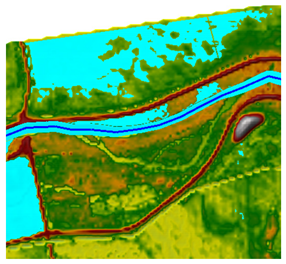
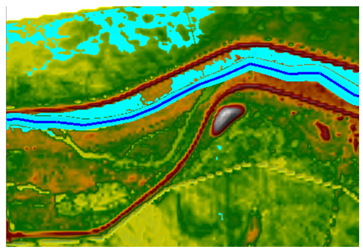
Table 7.
Comparison of floodplain inundation between the base scenario and after-dredging scenario for sub-reach K6.
Table 7.
Comparison of floodplain inundation between the base scenario and after-dredging scenario for sub-reach K6.
| Base Scenario | Scenario 1 (after Dredging) |
|---|---|
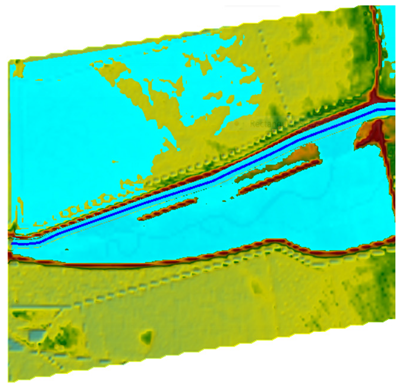 |  |
Table 8.
Comparison of water stage between the base scenario and after-dike-construction scenario for different cross sections.
Table 8.
Comparison of water stage between the base scenario and after-dike-construction scenario for different cross sections.
| Cross Section no. | Scenario 2 (after Dike Construction) | Base Scenario |
|---|---|---|
| 1 | 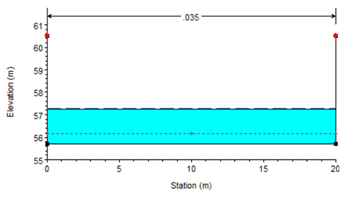 | 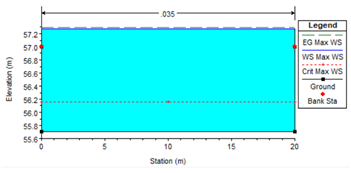 |
| 2 | 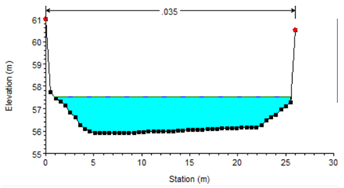 | 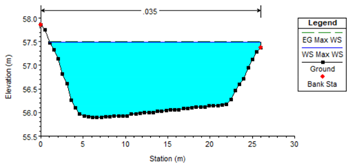 |
Table 9.
Comparison of floodplain inundation between the base scenario and after-dike-construction scenario for sub-reach K5.
Table 9.
Comparison of floodplain inundation between the base scenario and after-dike-construction scenario for sub-reach K5.
| Base Scenario | Scenario 2 (after Dike Construction) |
 |  |
Publisher’s Note: MDPI stays neutral with regard to jurisdictional claims in published maps and institutional affiliations. |
© 2022 by the authors. Licensee MDPI, Basel, Switzerland. This article is an open access article distributed under the terms and conditions of the Creative Commons Attribution (CC BY) license (https://creativecommons.org/licenses/by/4.0/).
Share and Cite
MDPI and ACS Style
Yazdan, M.M.S.; Ahad, M.T.; Kumar, R.; Mehedi, M.A.A. Estimating Flooding at River Spree Floodplain Using HEC-RAS Simulation. J 2022, 5, 410-426. https://doi.org/10.3390/j5040028
AMA Style
Yazdan MMS, Ahad MT, Kumar R, Mehedi MAA. Estimating Flooding at River Spree Floodplain Using HEC-RAS Simulation. J. 2022; 5(4):410-426. https://doi.org/10.3390/j5040028
Chicago/Turabian StyleYazdan, Munshi Md Shafwat, Md Tanvir Ahad, Raaghul Kumar, and Md Abdullah Al Mehedi. 2022. "Estimating Flooding at River Spree Floodplain Using HEC-RAS Simulation" J 5, no. 4: 410-426. https://doi.org/10.3390/j5040028