Article

Status of Water Quality for Human Consumption in High-Andean Rural Communities: Discrepancies between Techniques for Identifying Trace Metals

by
Alejandro Quispe-Coica
1,*,
Sonia Fernández
2,*,
Luz Acharte Lume
3 and
Agustí Pérez-Foguet
1
1
Department of Civil and Environmental Engineering (DECA), Engineering Sciences and Global Development (EScGD), Barcelona School of Civil Engineering, Universitat Politècnica de Catalunya BarcelonaTech, Jordi Girona, 1-3, 08034 Barcelona, Spain
2
Engineering Sciences and Global Development (EScGD), Universitat Politècnica de Catalunya BarcelonaTech, Jordi Girona, 1-3, 08034 Barcelona, Spain
3
Department of Engineering of Mines Civil Environmental, Universidad Nacional de Huancavelica (UNH), Lircay 09405, Huancavelica, Peru
*
Authors to whom correspondence should be addressed.
J 2020, 3(2), 162-180; https://doi.org/10.3390/j3020014
Submission received: 13 February 2020 / Revised: 23 April 2020 / Accepted: 26 April 2020 / Published: 27 April 2020

Abstract

:
Access to safe water is essential for people’s lives and health. However, little information is available about the quality of water consumed in rural communities in the Andes of Peru. The difficulties of accessing communities, and the lack of nearby laboratories, raise the question of which techniques are being used or could be used to monitor water quality (and specifically, for trace metal content determination), as discrepancies between different techniques have been reported. This work focuses on water characterization of (i) physicochemical, microbiological, and parasitological parameters; and (ii) the presence of trace metals in a specific Andean region involving five communities, determined by two different techniques: inductively coupled plasma mass spectrometry (ICP-MS) and atomic absorption spectrometry (AAS). AAS was performed at local laboratories in the province capital located within a 4-h travel distance from sampling points, and ICP-MS was performed in a certified lab in Lima at a 24-h bus travel distance (on average) from sampling points. The physicochemical characterization shows non-compliance with regulations of 16.4% of reservoirs and 23.1% of households. Further, standards for microbiological and parasitological parameters were not met by 14.5% of spring water points, 18.8% of water reservoirs, and 14.3% of households. These results are in agreement with the Peruvian government´s general figures regarding water quality in rural areas. While ICP-MS and AAS gave equivalent results for most pairs of sample metals tested, differences were found for Mo, Mn, Al, Zn, Cd, and Cu concentrations (with larger differences for Mo, Cd, and Cu). Differences in Al and Mo affect the comparison with water quality standards and generate uncertainty in terms of acceptability for human consumption.

1. Introduction

A population’s access to drinking water for human consumption is essential for people’s health and well-being. Many of the diseases and deaths in low and middle-income countries are attributed to unsafe water [1]. In 2016, diarrhea was responsible for more than 1.6 million deaths in people of all ages [2]; in Andean Latin America, diarrhea caused 1898 deaths [3]. The main risk factors associated with diarrhea in children under five years are unsafe water, unsafe sanitation, and childhood wasting (low weight-for-height score) [3].
The World Health Organization (WHO) and the United Nations Children’s Fund (UNICEF) have carried out the Joint Monitoring Program (JMP) of the population that accesses different levels of water, sanitation, and hygiene services since 1990 [4]. Monitoring has evolved from the Millennium Development Goals (MDGs) to the Sustainable Development Goals (SDGs), and expanded from four to five categories (also called water and sanitation ladders). To access water services, the “safely managed” category measures the progress of the urban and rural populations that access an improved source located in the facilities that is available when necessary and free of contamination. As safe management is a new category of monitoring, many countries lack information, and especially for those categories related to water quality.
In Peru, JMP estimates from 2017 showed that 59% of the urban population and 21% of the rural population have access to safely managed drinking water services [5]. These values were estimated based on specific data on water quality in 2010 [6], underscoring the lack of information in the country. Notably, the inequalities that exist between the urban and rural sectors are similar to the worldwide situation reported in the literature [7,8].
The government of Peru has established regulations for the different parameters of water quality. Category 1 and subcategory A1 of Supreme Decree (DS) N°. 004-2017-Ministerio del Ambiente (MINAM) [9] establish the limits of the physicochemical, inorganic, organic, microbiological, and parasitological parameters for the quality of surface waters that can be treated with disinfection, and DS N° 031-2010-SA establishes the limits of the physicochemical, microbiological, parasitological, organic, and inorganic parameters of water for human consumption [10].
Water quality is monitored both at its sources (spring, river, well, etc.) and in water supply systems and homes. Trace metals have been detected at the water sources of the Andes near mining sectors, posing a public health risk for people who use water from these sources for any activity or consumption [11,12,13,14]. In water supply systems and household, studies conducted on the coast [15,16] or in the mountains [17] or jungle [18] reveal issues dealing mainly with microbiological parameters (total coliforms, fecal coliforms, Escherichia coli), free residual chlorine, and some physicochemical parameters. However, a lack of information makes it difficult to know the situation of the quality of the water consumed by the rural population of the Andes. Further, there are no clear studies on the monitoring of water quality of all parameters established by Peruvian regulations.
A report of the Diagnostic System for Rural Sanitation (Sistema de Diagnóstico del Saneamiento Rural en el Peru—DATASS) [19] revealed that, of the administrators of water and rural sanitation services, 71% (20,507/28,874) of rural providers are in the mountains, 18.9% (5450/28,874) are in the jungle, and 10.1% (2917/28,874) are on the coast. In our study area of the mountains, 18,204 of the 20,507 administrators correspond to the Sanitation Services Administrative Committees (Juntas Administradoras de Servicios de Saneamiento—JASS), and the remaining 2303 correspond to administrators, such as municipalities, specialized operators, private providers, or other management alternatives. Although this administrative structure is responsible for providing the population with safe water as well as a legal compliance framework, the reality is that there is no clear evidence that water quality monitoring is carried out in the rural sector as established by the normative. The study by Miranda et al. [20] that evaluated the situation of water quality for consumption in homes of children under five years old from 2007–2010 only analyzed total coliforms, Escherichia coli, and residual chlorine. No other control parameters were observed by other monitoring activities. However, it is very common to find residual chlorine parameter as an indicator of water quality [21,22]. Reasons for the lack of monitoring of the control parameters could include the low socio-economic levels of rural communities, the high cost of doing the analysis that is not covered by the household family fees, and the lack of laboratories or measurement instruments at the local level for certain parameters (which makes it necessary to send water samples to the capital). This situation drastically hinders adequate monitoring of the quality of water for human consumption in the Andes.
Quality of information is also important, as it supports not only the decisions of the water manager but also is relevant for engineering: based on the obtained information, decisions are made to consider (or not) additional treatment processes. In an ideal setting, these information-based decisions would allow the characteristics of water quality at the source (spring, river, well, etc.) to influence the design and engineering of treatment systems. With respect to the methods used to obtain information, analyses are carried out mainly by laboratory tests and may be similar or distinct from others analyses, depending on the techniques used.
For trace metals, discrepancies between inductively coupled plasma mass spectrometry (ICP-MS) and atomic absorption spectrometry (AAS) have been widely discussed in the literature. Jajda et al. [23] compared the efficiency of both alternatives to determine iron and zinc in legumes and cereals, and concluded that ICP-MS was better but more expensive. For the analysis of elementary coffee, Jarošová et al. [24] found no significant differences between the two methods; however, analysis time was shorter using ICP-MS than AAS as it allows simultaneous analysis. Tayler et al. [25] made a more detailed comparison and concluded that no technique meets all analyses requirements, and that there will always be samples in which one technique is more appropriate than another.
To address the above, this document has two objectives: (i) to characterize physicochemical, microbiological, and parasitological parameters of drinking water, and (ii) to compare two different techniques for analyzing trace metals (ICP-MS and AAS) in water samples from springs. Developing the activities to achieve the established objectives will allow us to know the situation of the water quality in five communities of the Peruvian Andes and will reveal if either of the two different methods influence the results.

2. Materials and Methods

2.1. Description of the Area under Study

Peru is subdivided into 24 departments and a constitutional province. According to the 2017 census, approximately 32.3% of the population is concentrated in the capital of Peru (Lima), while only 1.2% of the population lives in the Huancavelica department [26]. The Department of Huancavelica is located in the Andes of Peru. The average elevation is 3676 meters above sea level (m.a.s.l.). According to the Demographic and Family Health Survey from 2018, the prevalence in Huancavelica of acute diarrheal diseases in children under five years of age is between 10%–12.8% and the prevalence of anemia in children aged 6–59 months is between 40%–49%, while the percentage of the population that has no access to sanitation services with a public network or latrine is 20.9% [27]. That said, it is likely that the high prevalence rates of diseases are a consequence of the lack of access to drinking water and sanitation services, as reported in the literature [28,29,30,31,32]. On the other hand, in rural communities, it is very common that managers and JASS do not provide information about the quality of water to their users.

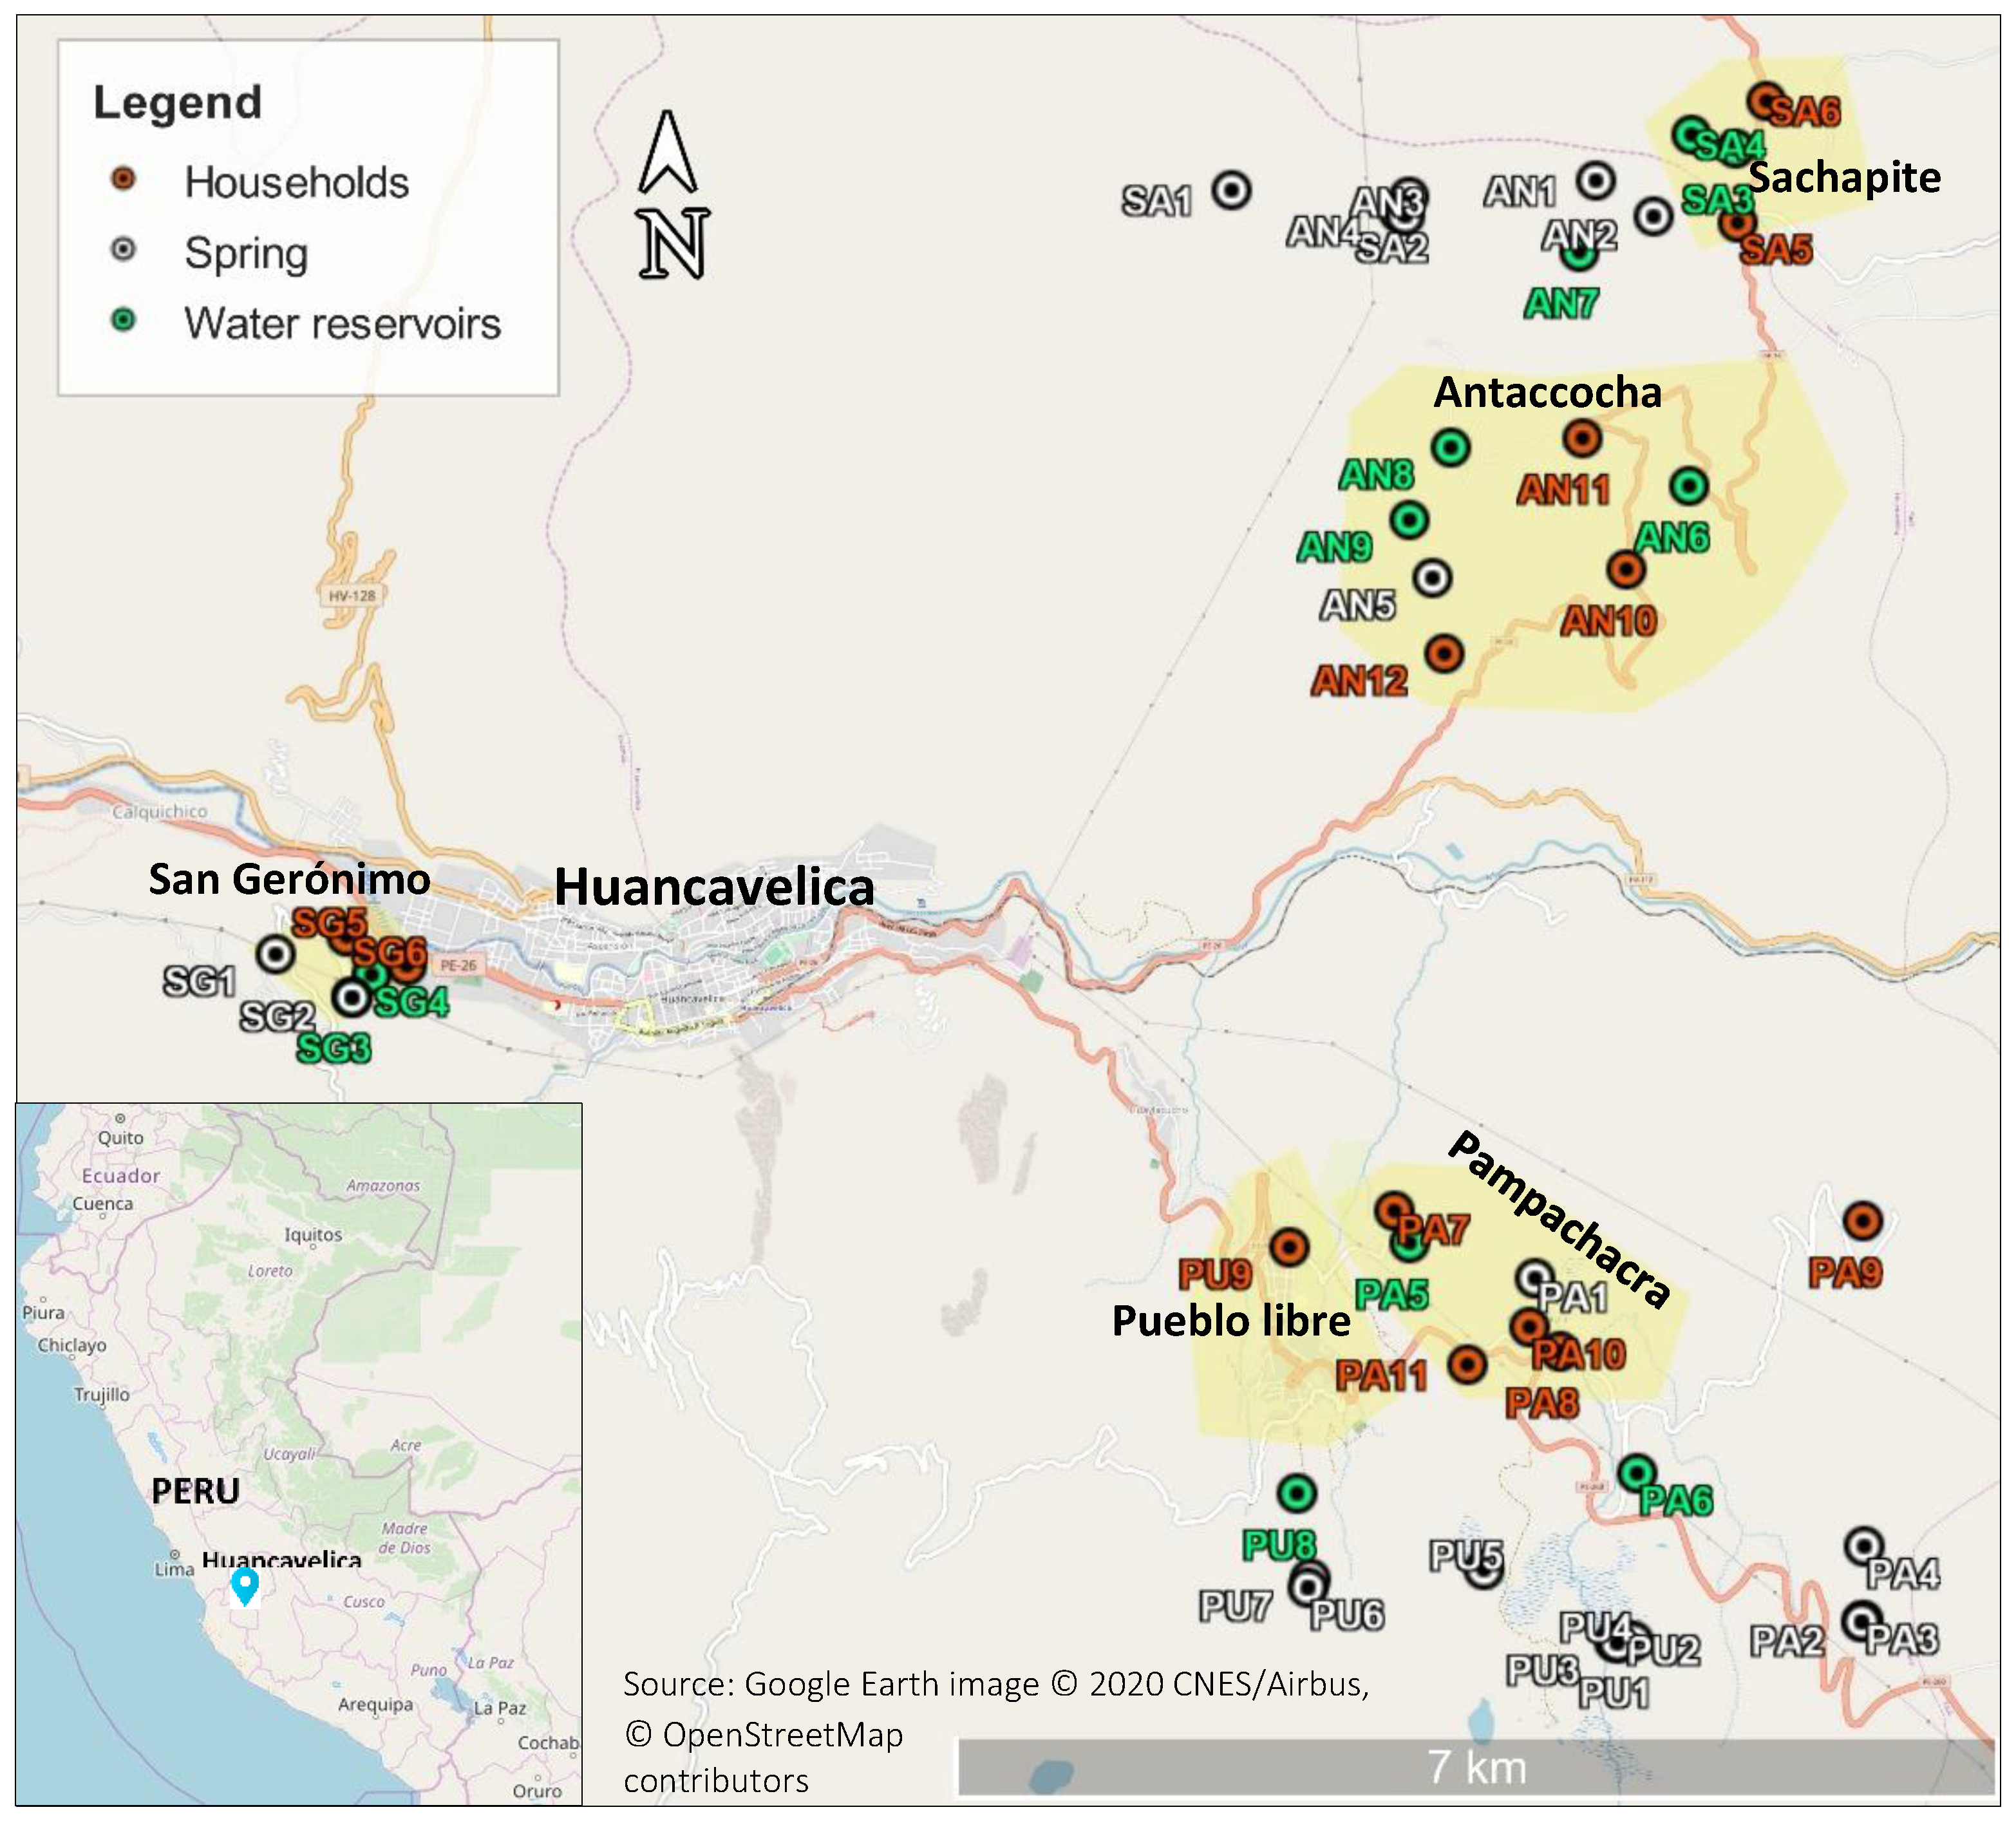
2.2. Sampling Points

The sampling of each community was carried out at springs, water reservoirs, and households, with a total number of 20, 11, and 13 sampling points, respectively (see Table 1). The identification of each sampling point can be seen in Appendix A.
WHO guidelines were followed for sampling at reservoirs and households [33,34]. Water reservoirs store water from the different springs and are where chlorination takes place; therefore, water samples were taken at the exit of reservoirs [34]. For households, water samples were taken at the furthest faucet from the chlorination system, as it is the one with the highest risk of having a low concentration of residual chlorine [33,34].
Note that the water monitoring process involves taking samples and transferring them to the local laboratories of Huancavelica as well as to Lima, and that the required travel for this varies both in distance and time depending on the community (see Figure 1). When local laboratories were used, the average time of travel was 4 h or less from sampling points; by contrast, when using laboratories in Lima (the capital of Peru), travel took on average 24 h.

2.3. Water Analysis Procedures

The study lasted six weeks (15 July to 31 August) in 2019. It was supported by the Environmental Health Unit (Executing Unit 406) Red de Salud Huancavelica, through the drinking water quality monitoring program, the Laboratory of Microbiology and Parasitology of Universidad Nacional de Huancavelica (UNH), and the Chemistry Laboratory of the Faculty of Engineering of Mines Civil Environmental of Lircay (UNH) (see Table 2).

2.3.1. Determination of Physical–Chemical Parameters

The Regional Health Office (Dirección Regional de Salud—DIRESA) of Huancavelica, through the Environmental Health Unit (Executing Unit 406), measured the parameters of turbidity, pH, conductivity, and free residual chlorine (FRC) (in situ) at the sampling points, with portable equipment whose characteristics are detailed in Table 2.
The color parameter was analyzed in the DIRESA laboratory in Huancavelica, while the parameters of total hardness, nitrates, nitrites, sulfates, and chlorides were analyzed in the CERPER laboratory in Lima, both of which are managed by the Environmental Health Unit of Huancavelica. For both laboratories, the water samples were transported from the sampling points to the laboratories in coolers filled with cold accumulators at a temperature between 1–5 °C.

2.3.2. Determination of Total and Thermotolerant Coliforms

Water samples were collected in 100 mL sterile glass bottles and transported in coolers filled with cold accumulators at a temperature between 1–5 °C. The presence of total and thermotolerant (fecal) coliforms was then analyzed by the most probable number (MPN) method using 2% BRILA (brilliant green bile lactose) broth (0.0133 g/L brilliant green, 10 g/L lactose, 20 g/L ox-bile (dried), and 10 g/L peptone). From each water sample, dilutions of 10−1, 10−2, and 10−3 were made, and 1 mL of each dilution was inoculated in tubes with BRILA broth for 24 h at 35–37 °C. Total coliforms were grown in BRILA broth at a temperature of 35 °C or 37 °C. For tubes containing total coliforms, 1 mL was inoculated in a tube with BRILA broth for 24 h at 44–45 °C to determine whether thermotolerant coliforms were present or not. For both cultures (total and thermotolerant coliforms), growth was provisionally identified by the production of acid and gas from lactose fermentation.

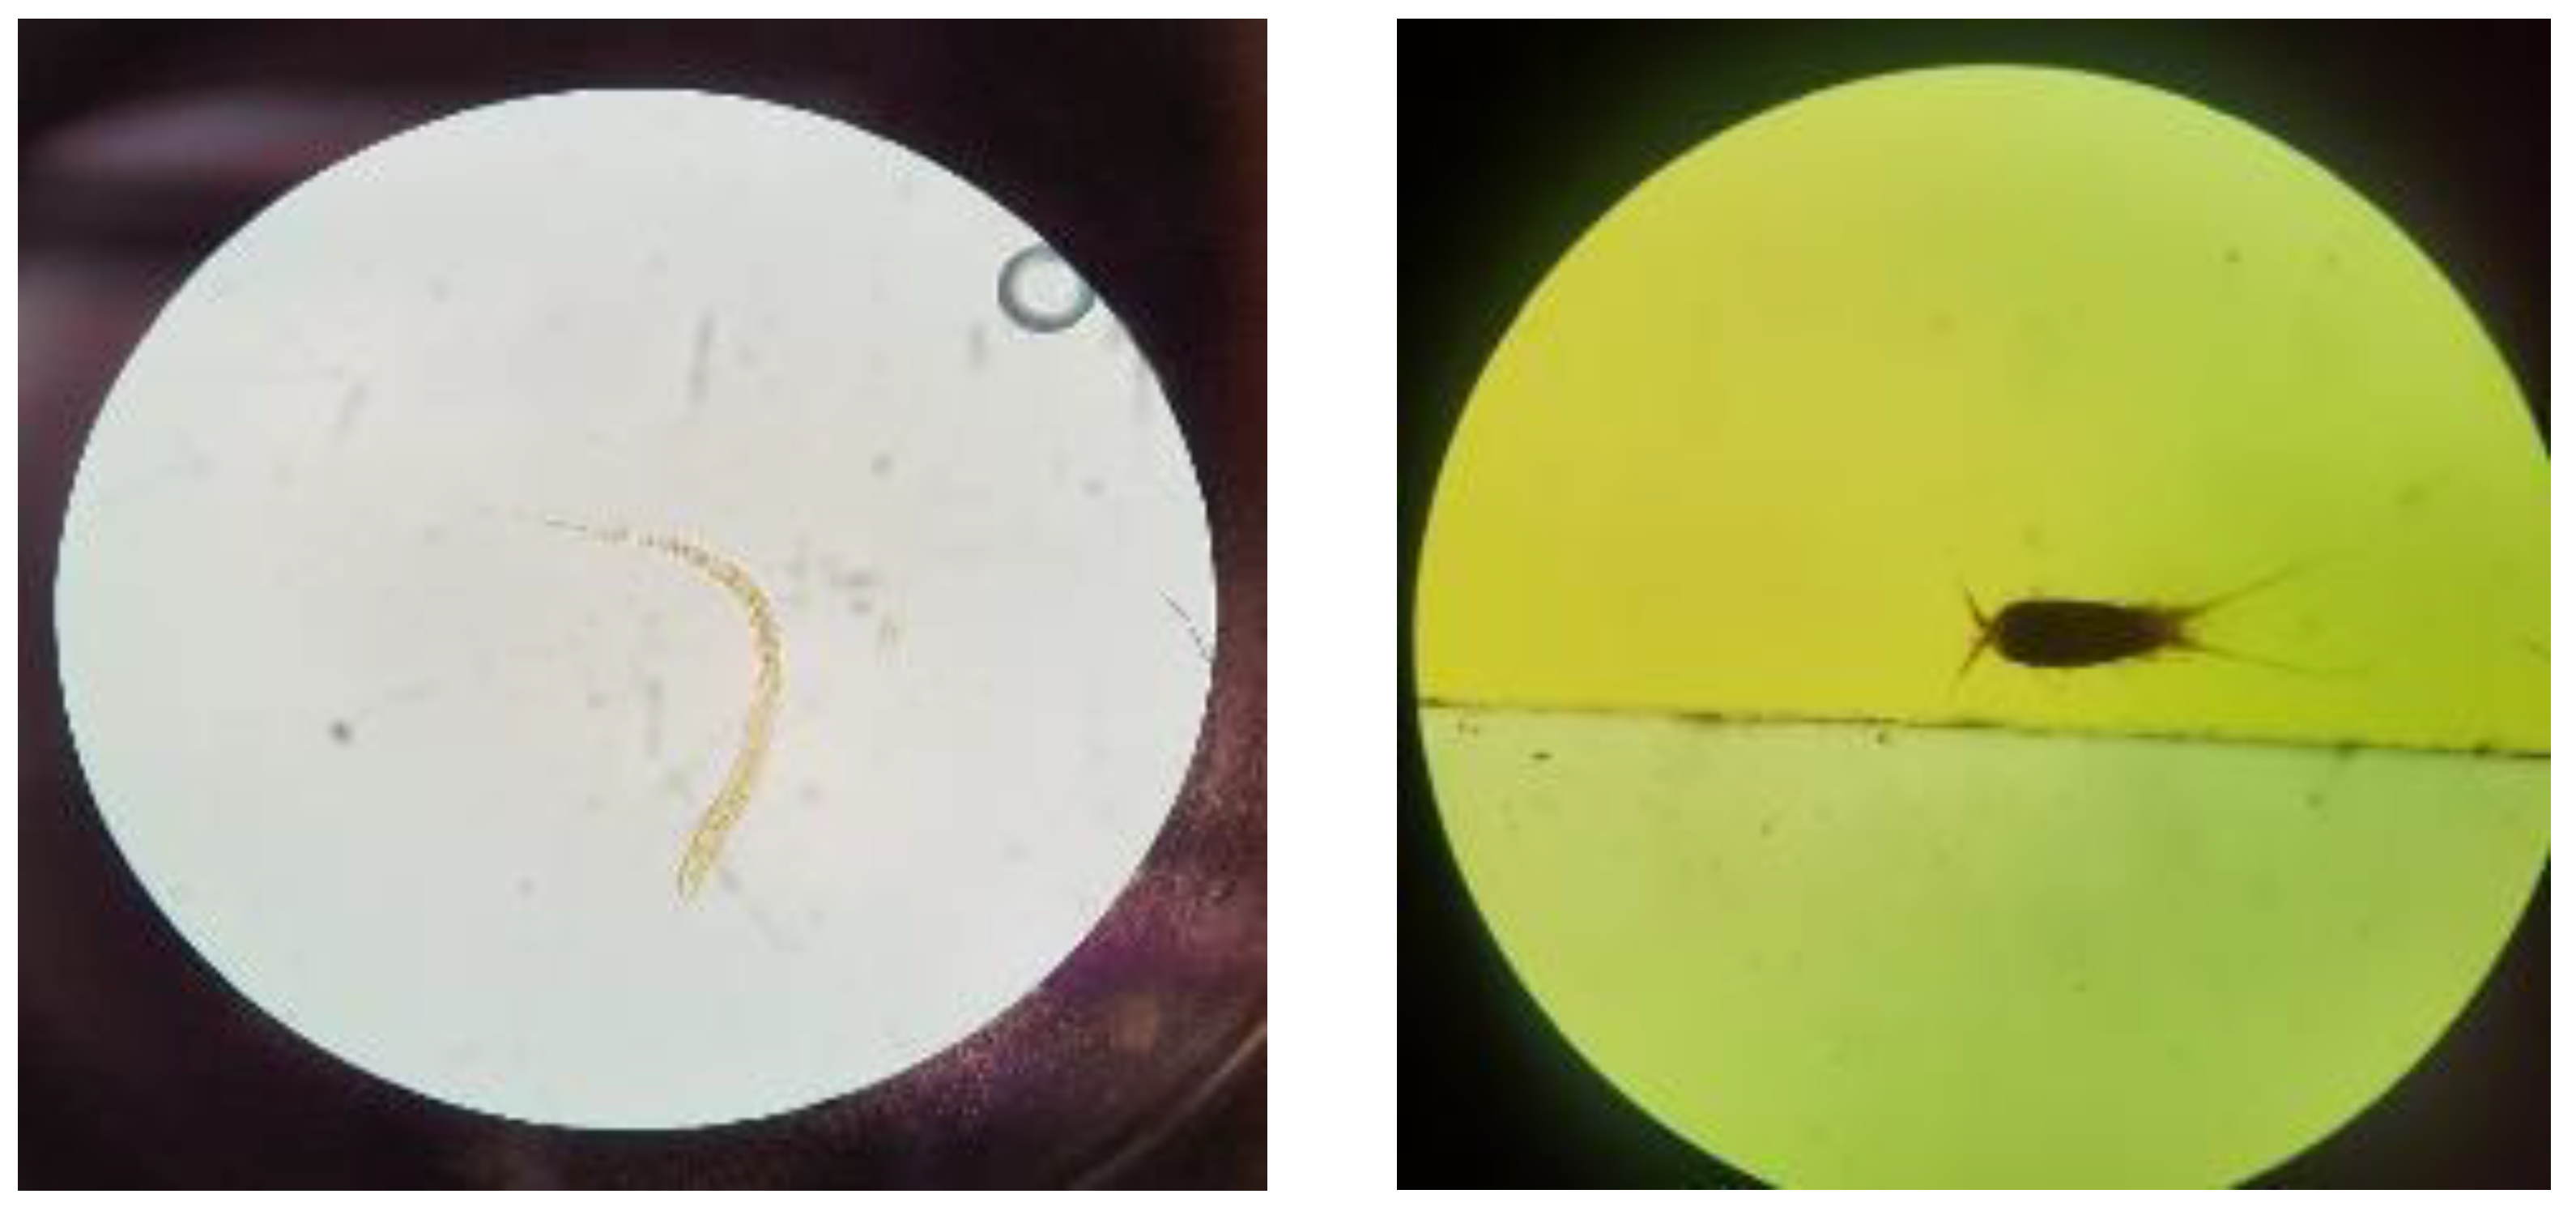
2.3.3. Determination of Parasites and Free-Living Organisms

Samples were analyzed at the DIRESA Environmental Control Laboratory in Huancavelica, in accordance with the protocol of the Environmental Control Laboratory, DIGESA-MINSA (Spanish acronym for General Directorate of Environmental Health—Ministry of Health). This test procedure is used for detecting protozoa cysts (Blastocystis hominis, Endolimax nana, Entamoeba coli, and Giardia lamblia) and helminths eggs (Ascaris lumbricoides, Trichuris trichiura, Hymenolepis diminuta, Hymenolepis nana, Taenia sp., Fasciola hepatica, Toxocara canis, Uncinarias, and Strongyloides sp.) in natural water samples. Water samples were taken in 4 L cans at springs and in 10 L cans at reservoirs and households.

2.3.4. Determination of Trace Metals

Water samples from springs were collected in 1 L polyethylene containers, and 3 mL of 50% HNO3 (1:1) was added to standardize the sample. The trace metal levels of the water were analyzed using two techniques: (i) atomic absorption spectrometry (AAS), carried out in the chemistry laboratory of the Faculty of Engineering of Mines Civil Environmental of Lircay (UNH), and (ii) inductively coupled plasma mass spectrometry (ICP-MS), carried out at the Laboratory CERPER S.A. in Lima, accredited by the National Quality Institute (Instituto Nacional de Calidad—INACAL).
The two techniques were compared by statistically applying the Student’s t-test, and the p-values were determined at a confidence level of 95%. For this, the null hypothesis (H0: XAAS = XICP-MS) was formulated so that the results of both techniques are the same, while the alternative hypothesis (H1: XAAS ≠ XICP-MS) implied that the results of the techniques are different. The decision was made based on the p-value: if p-value < 0.05 (significance level), the null hypothesis was rejected, and the alternative hypothesis was accepted.

3. Results

We first compare the results of water quality monitoring at reservoirs and households with the maximum permissible limits of the water quality parameters (physicochemical, microbiological, and parasitological), based on the parameters established by the Regulation of Water Quality for Human Consumption in Peru (Supreme Decree N° 031-2010-SA). In Section 3.2, we then analyze water quality monitoring results at springs and focus mainly on comparing results obtained by the two trace metal analysis techniques (e.g., AAS and ICP-MS). In addition to this, we evaluate whether water from springs could be treated with disinfection, as established by the Peruvian Environmental Quality Standard, ECA (Category 1 and Subcategory A1: waters that can be treated with disinfection) [9].

3.1. Water Quality in High-Andean Rural Communities

We examined the results of the monitoring carried out at springs, water reservoirs, and households (see Table 3) based on the number of sampling points, number of sampling parameters, total of parameters evaluated, number of parameters that exceed the limit established in the regulations and number of parameters that do not exceed the limit established in the regulations. Of the parameters evaluated for the springs, 1.5% (3/200) of physical–chemical parameters and 14.5% (11/76) of the microbiological and parasitological parameters did not comply with the limits established by the ECA, suggesting that the majority of water samples from these springs could be treated with simple disinfection.
The percentage of physical–chemical parameters that did not comply with the Regulation of Water Quality for Human Consumption in Peru was 16.4% (9/55) at water reservoirs and 23.1% (15/65) at households. Note that, for residual chlorine, above-limit values are necessary at some points to allow water quality to be ensured throughout all distribution networks. By contrast, for microbiological and parasitological parameters, 18.8% (6/32) of parameters at water reservoirs and 14.3% (5/35) at households did not comply with the Peruvian Regulation of Water Quality for Human Consumption.

3.1.1. Pueblo Libre

At the seven springs evaluated, the results of the physical–chemical parameters were within the limits established by the ECA (Category 1 and Subcategory A1: Waters that can be treated with disinfection). Nevertheless, the results of the microbiological and parasitological parameters showed that two parameters of the PU2 spring, and one parameter at both the PU1 and the PU5 spring, exceeded the limits established by the ECA. In spring PU2, 240 MPN/100 mL of total coliforms were detected, exceeding the ECA limit (of 50 MPN/100 mL). The protozoa Euglena sp. and Paramecium sp. were present in the PU5 spring, while algae (and specifically diatoms) were present in the PU1 and PU2 springs. Regarding the latter, the ECA establishes that the water should contain no free-living organisms, including protozoa and algae.
Monitoring at reservoirs and households showed null values of free residual chlorine (FRC = 0 mg/L). This contradicts the provisions of the Peruvian Regulation of Water Quality for Human Consumption, which established a minimum value of 0.5 mg/L, and a maximum of 5 mg/L, to guarantee the quality of water in all distribution networks. It is likely that lack of chlorination is the main cause of the presence of 21 MPN/100 mL of total coliforms in the water reservoir, which drastically exceeds the recommended maximum permissible limit (≤1.8 MPN/100 mL) for human consumption. Furthermore, free-living organisms were present both at the reservoir (Euglena sp. and Paramecium sp.) and at households (Euglena sp. and Paramecium sp.), despite regulations requiring that no free-living organisms be in water meant for human consumption [10].

3.1.2. San Gerónimo

At the two springs evaluated, the physical–chemical parameters were within the established ECA limits (Category 1 and Subcategory A1: Waters that can be treated with disinfection). For microbiological parameters, three samples did not comply with the ECA limits. Namely, at SG1, algae and parasitic nematodes were detected, including Nematodirus sp. (shown in Figure 2), Strongiloides sp., and Cooperia sp. At SG2, copepods were detected (Figure 2); here it is important to note that copepods serve as intermediate hosts for parasites that infect humans and are vectors of severe human diseases [41].
At the SG1 spring, fecal coliforms (7.3 MPN/100 mL) and parasites were found. However, as this spring is not protected or fenced off, it is easily accessible for animals and people, which facilitates its possible contamination with feces of animal or human origin.
The results of FRC at the water reservoir of Putaccapuquio was 6.5 mg/L, which exceeds the maximum permissible limit of the regulation, while FRC at households of Puquiocucho was 0.05 mg/L, which is less than the minimum permissible limits of the regulation.
Microbiological and parasitological parameter analyses revealed parasitic nematodes (such as Nematodirus sp., Strongiloides sp., and Cooperia sp.) at the Puquiocucho water reservoir, and Nematodirus sp. and Strongiloides sp. at households in Puquiocucho. Similarly, copepods and algae were detected at the water reservoir, and copepods at households, in Putaccapuquio.
As we observed parasites at springs, water reservoirs, and even households, it is very likely that the parasites originated from human or animal feces that entered springs and were subsequently transmitted by the distribution networks to the main reservoir, and then by water distribution networks to households. Therefore, protection of the spring (which is not fenced off), as well as cleaning and disinfecting water reservoirs and the entire water supply system, should be prioritized.

3.1.3. Sachapite

At the two springs evaluated, the physical–chemical parameters were within the established ECA limits (Category 1 and Subcategory A1: Waters that can be treated with disinfection). However, algae were detected at both springs. At the water reservoirs and households sampled, FRC levels were less than the minimum permissible limits established by regulation (0.5 mg/L). Further, the presence of total coliforms was 3 MPN/100 mL at the Huariccacca reservoir, and 3.6 MPN/100 mL at the Picchapuquio reservoir (with a limit according to regulation of ≤ 1.8 MPN/100 mL).

3.1.4. Pampachacra

Concerning the physical–chemical parameters, households of Barrio Villa Libertad had a turbidity value of 7.8 nephelometric turbidity units (NTU), which is higher than the 5 NTU limit established by regulation. Nitrate levels at the PA3 spring were also too high (117.7 mg/L, compared to the set limit of 50 mg/L). Furthermore, FRC levels were less than the minimum permissible limits. Finally, algae and copepods were detected at the PA1 spring, and algae and Euglena sp. at the PA2 spring.

3.1.5. Antacoccha

At the AN3 and AN5 springs, as well as at households of sector 1, the turbidity levels were above the established limits. Further, only the reservoir of sector 1 presented levels of FRC within the range established by the regulation, while the remaining reservoirs and households of the community had FRC levels less than 0.5 mg/L. Regarding the microbiological and parasitological parameters, total coliform levels were 21 MPN/100 mL at households of sector 1, and 9 MPN/100 mL at households of sector 4, both of which are well above the ≤1.8 MPN/100 mL limit established in the regulation [10].

3.2. Comparison of Two Different Techniques to Identify Trace Levels of Metals in Water

The ten trace metals that were examined in the spring samples using the two techniques (ICP-MS and AAS) were Mo, Mn, Cd, As, Cu, Cr, Pb, Zn, Sb, and Al. The results were compared with the maximum permissible limits established in the ECA (Category 1 and Subcategory A1: Waters that can be treated with disinfection) and with the WHO reference values.
The results of the two analytic techniques are shown in Table 4 and Table 5. For Pb, the results were below the detection limits of both techniques: AAS gave results of <0.021 mg/L, and ICP-MS, results of <0.0002 mg/L (the maximum limit established the ECA and WHO is 0.01 mg/L). Likewise, the results for Sb were below the detection limits of both techniques as well: AAS gave <0.069 mg/L, and ICP-MS, <0.0002 mg/L (the maximum limit established by ECA and WHO is 0.02 mg/L).
By contrast, detection limits of the AAS technique for the parameters As, Pb, and Sb were above the maximum permissible limits. Thus, using the AAS technique to detect As, Pb, or Sb is not informative about whether the results comply with the regulations or not, or whether these water sources require additional treatment to obtain water suitable for human consumption. The same is true for the ICP-MS technique, as all parameters have detection limits below the maximum permissible limits in the regulations.
According to the fourth edition of the WHO Guidelines for drinking water quality, there are no established guideline values for Mo, Mn, or Zn levels [33]. The reason why there is no set reference value for Mo is because it is considered to occur in drinking water at concentrations well below those of health concern [33]. Peruvian norms regulate this parameter at 0.07 mg/L as the maximum permissible limit, both at springs [11] and for quality of water for human consumption [10]. As shown in Table 4, the results of the AAS method at the AN1, AN2, and AN4 springs of the Antaccocha community exceeded the maximum permissible limits for Mo established by the regulation. However, analysis results with the ICP-MS method at the same sampling points showed levels of Mo that are well below the regulation maximum limit (or of its own detection limit) (Mo < 0.0002 mg/L).
Regarding Cd, all samples of the Pueblo Libre and San Gerónimo communities presented values from AAS that are above the maximum limit established by the ECA and WHO, which is 0.003 mg/L (see Table 4). Nevertheless, the same sampling points by ICP-MS presented values lower than the established maximum limits of ECA and WHO.
High concentrations of Al can color the water, which could cause acceptability problems for users [33]. Importantly, studies have also linked consumption of water with Al to Alzheimer’s disease [42,43,44,45,46]. Although these studies could not confirm the association of Al with Alzheimer’s, a toxic role of Al on health has not been ruled out [47,48,49]. The differences and consistencies in the results with the two techniques in the analyzed communities are shown in Table 5. At AN5 in the Antaccocha community, analysis by AAS showed a level of Al of 3.47 mg/L, which is higher than the maximum permissible limits set both by ECA (0.9 mg/L) and by WHO (0.1 mg/L). By contrast, analysis by ICP-MS gave an Al level of 0.6782 mg/L, which is lower than the maximum limit allowed by ECA but is still higher than the maximum limit established by WHO. The Al levels at the AN4 sampling point were similar for both methods (0.212 and 0.266 mg/L by AAS and ICP-MS, respectively) and are likewise acceptable according to ECA but higher than the WHO limits. Finally, at PA4 in the Pampachacra community, the Al levels determined by the AAS method (<0.3 mg/L) were lower than those by the ICP-MS method (0.4514 mg/L).
Results shown in Table 6 and Table 7 extend the comparative study of both analytic methods (AAS and ICP-MS), regardless of whether the results complied with the regulations or not. The means of the results of the two techniques are compared using a hypothesis test; if the value of p < 0.05, it is accepted that both techniques give different results. For the Cd, Cu, and Mo levels, the p-values were below 0.05 for all analyzed springs; therefore, both analysis techniques systematically give different results. For the Mn (at PU5, AN5, and PA4), Al (at AN5 and PA4), and Zn (at AN1, AN3, AN5, PU3, PU4, PA1, PA2, PA3, SG2, SA1, and SA2) levels, the p-values were less than 0.05 only at some springs. This means that the two techniques gave different average values for these parameters at only some sampling points.
By contrast, for the levels of Mn (at PU2, PU3, PU7, PA1, and SA1), Al (at AN3 and AN4), and Zn (at AN2, AN4, PU2, PU5, PU6, PU7, PA4, and SG1), the p-values were greater than 0.05 (see Table 6 and Table 7); therefore, the null hypothesis is accepted. This means that the average values of the results from AAS closely resemble those obtained from ICP-MS.
The cases presented here exemplify that using different techniques can give significantly different results. This generates uncertainty among water managers and people responsible for engineering the water treatment systems, as there is no clarity in whether implementation of additional processes to correct parameters that exceed the standards are necessary or not. The explanation of why these differences occur is possibly more complicated than expected. However, it should be taken into account that analyses of the methods were performed in different laboratories and that ICP-MS was performed in laboratories in Lima, while AAS was performed in the laboratories of the National University of Huancavelica. Additionally, the analysis of each method follows a different procedure, likewise leading to potential variations.

4. Discussion

Our results highlight widespread quality problems that should be addressed before water can be considered safe for human consumption. Of the five communities evaluated, those in Antaccocha, Pueblo libre, and Sachapite had low levels of chlorine or no chlorination at water reservoirs and households; not unexpectedly, these places had the main bacterial contaminations. By contrast, San Gerónimo had sufficient chlorination at water reservoirs, and no presence of microbiological contamination was detected. Nonetheless, in San Gerónimo, the presence of parasites and free-living organisms (such as copepods and algae) were detected. In Pampachacra, the levels of FRD at reservoirs were too low, but no bacterial or parasitic contaminants were present. Gonzalez et al. [50] indicated that there is a relationship between the presence of parasites and the prevalence of anemia in the urban area of Huancavelica, with anemia with concurrent parasitosis occurring most frequently. Therefore, it is likely that the population in the San Gerónimo community that consumes unsafe water has more risk of having anemia than the other communities in which no parasites were found in the water supplies. Overall, we conclude that bacterial contamination can be attributed to the low or absent chlorination of water.
We believe that this specifically reflects the rural communities in Peru, as similar studies [19] report that only 37.6% (9413/25,020) of water supply systems carry out chlorination. It is also very likely that, in the remaining communities of the country, the bacteriological parameters are above the maximum permissible limits of the regulations to be considered for human consumption. The main consequences of the consumption of non-potable water are linked to public health, such as diarrhea and other diseases [51].
Springs in 4/5 (80%) of the communities contained free-living organisms, mainly diatoms, copepod, and algae. This high percentage is due to the lack of protection of the spring infrastructures, such as fences, and the lack of maintenance.
Overall, we believe that establishing effective chlorination protocols and sanitary surveillance of springs and water supply systems can contribute to improving the provision of safe water services [52].
Regarding the measurement of trace metals in water samples from the springs, our comparison of the two analysis techniques (ICP-MS and AAS) revealed that ICP-MS has lower detection limits than AAS for all trace metals, which allows its results to be compared with the maximum permissible limits established by ECA (Category 1 and Subcategory A1). This does not necessarily occur when using the AAS method.
The levels of Mn, As, Cu, Cr, Pb, Zn, and Sb complied with the ECA and Regulation of Water Quality for Human Consumption; besides, these values are lower than those from water sources near mining extraction sectors [12]. However, the levels of Cd, Al, and Mo at some monitored springs did not completely comply with the ECA limitations: the AAS results exceeded the limits established at some sampling points, while the ICP-MS results for the same water sample provided values below the ECA. The statistical tests evaluated in Table 6 and Table 7 reinforce the hypothesis that they give different values for the same water sample.
Discrepancies in results could have an impact on the decisions of local water managers. For example, if only the AAS results are available, it would be necessary to implement new treatment processes to remove these trace metals identified as too high, which would be unsustainable in these communities due to their low payment capacity. These results also show that accrediting laboratories and analytical methods in institutions in high Andean areas is both important and necessary. Therefore, it is recommended that, for engineering studies or others that require high precision and confidence in the results, laboratories with an accredited analysis procedure be used.
Finally, despite some discrepancies between the two analytical methods (AAS and ICP-MS), having information is already useful for local water managers, especially if it is about water quality parameters for which there was no previous discussion. Nevertheless, it should be noted that traditional (laboratory) analysis methods have disadvantages to being constantly used in rural Andean contexts. The main disadvantage is the high cost of sending a water sample from a monitoring point to the main cities of Peru, as finding laboratories that analyze these parameters near rural communities is unlikely. Another problem is related to the time needed to obtain results, which, depending on the logistics and the location of the rural community, could take several months. Therefore, the information that is obtained is only for diagnostic purposes and not for immediate action. For the latter, low-cost remote options may be better alternatives to the usual techniques [53,54]; in this case, although the precision of a laboratory with standardized procedures cannot be expected, it would be extremely helpful to have results that provide timely information about the quality of water provided to users.

Supplementary Materials

The following are available online at https://www.mdpi.com/2571-8800/3/2/14/s1, Table S1: Results of laboratory analysis of water samples (physicochemical, microbiological, parasitological and inorganic parameters).

Author Contributions

Conceptualization, A.P.-F., S.F., and A.Q.-C.; methodology, S.F. and L.A.L.; validation, A.Q.-C., S.F., L.A.L., and A.P.-F.; writing—original draft preparation, A.Q.-C., S.F., and A.P.-F.; writing—review and editing, A.P.-F.; supervision, A.P.-F.; All authors have read and agreed to the published version of the manuscript.

Funding

This research was funded by CCD-UPC 2019, grant number 2019-B012.

Acknowledgments

The authors appreciate the participation in the field work and lab analysis of Claudia Álvarez Pujol, Laura Vinardell Magre, Víctor Sánchez Araujo, Joel Mulato Sánchez, Darwin Raúl Vela Silva, Luis Miguel Farro Zapata, Jershon Andy López Cunya, Cristian Yauri Olarte, Madeleyne Eday García Inga, and Anthony Mollehuara Rivera, as well as from students of the Universitat Politècnica de Catalunya, technical staff from UNH, and of the Unidad de Salud Ambiental de la Red de Salud Huancavelica. Economic support from the Colección Española de Cultivos Tipo (CECT)—Universitat de València is also acknowledged.

Conflicts of Interest

The authors declare no conflict of interest.

Appendix A. Sampling Points

Table A1. Description of sampling points (springs, water reservoirs, and households).
CommunityDescriptionLabelElevation (m.a.s.l.)
Pueblo libreSpring 1PU14188
Pueblo libreSpring 2PU24181
Pueblo libreSpring 3PU34184
Pueblo libreSpring 4PU44179
Pueblo libreSpring 6PU54175
Pueblo libreSpring 8PU64170
Pueblo libreSpring 9PU74154
Pueblo libreWater reservoirPU84072
Pueblo libreHouseholdPU93899
San GerónimoSpring Puquiocucho 1SG13893
San GerónimoSpring PutaccapuquioSG23822
San GerónimoPuquiocucho water reservoirSG33821
San GerónimoPutaccapuquio water reservoirSG43757
San GerónimoPuquiocucho householdSG53771
San GerónimoPutaccapuquio householdSG63720
SachapiteSpring HuariccaccaSA14328
SachapiteSpring PicchapuquioSA24273
SachapiteHuariccacca water reservoirSA34191
SachapitePicchapuquio water reservoirSA44206
SachapiteHuariccacca householdSA54121
SachapitePicchapuquio householdSA64162
PampachacraSpring Barrio Villa LibertadPA13957
PampachacraSpring Barrio Imperial (Asto1)PA24258
PampachacraSpring Barrio Imperial (Asto2)PA34279
PampachacraSpring 1 Barrio CondorsencaPA44296
PampachacraBarrio Villa Libertad water reservoirPA53925
PampachacraBarrio Imperial water reservoirPA64101
PampachacraBarrio Villa Libertad householdPA73888
PampachacraBarrio Imperial householdPA84037
PampachacraBarrio Condorsenca householdPA94055
PampachacraBarrio Centro householdPA104000
PampachacraBarrio Miraflores householdPA114027
AntaccochaSpring sector 1AN14176
AntaccochaSpring sector 2AN24176
AntaccochaSpring sector 3 and 5AN34246
AntaccochaSpring sector 4AN44259
AntaccochaSpring MulaccaranaAN53893
AntaccochaSector 1 water reservoirAN63979
AntaccochaSector 2 water reservoirAN74108
AntaccochaSector 3 and 5 water reservoirAN84005
AntaccochaSector 4 water reservoirAN93991
AntaccochaSector 1 householdAN103839
AntaccochaSector 2 householdAN113911
AntaccochaSector 4 householdAN123780

References

  1. Prüss-Ustün, A.; Bartram, J.; Clasen, T.; Colford, J.M.; Cumming, O.; Curtis, V.; Bonjour, S.; Dangour, A.D.; De France, J.; Fewtrell, L.; et al. Burden of disease from inadequate water, sanitation and hygiene in low- and middle-income settings: A retrospective analysis of data from 145 countries. Trop. Med. Int. Health 2014, 19, 894–905. [Google Scholar] [CrossRef] [Green Version]
  2. Naghavi, M.; Abajobir, A.A.; Abbafati, C.; Abbas, K.M.; Abd-Allah, F.; Abera, S.F.; Aboyans, V.; Adetokunboh, O.; Ärnlöv, J.; Afshin, A.; et al. Global, regional, and national age-sex specifc mortality for 264 causes of death, 1980-2016: A systematic analysis for the Global Burden of Disease Study 2016. Lancet 2017, 390, 1151–1210. [Google Scholar] [CrossRef] [Green Version]
  3. Troeger, C.; Blacker, B.F.; Khalil, I.A.; Rao, P.C.; Cao, S.; Zimsen, S.R.; Albertson, S.B.; Stanaway, J.D.; Deshpande, A.; Abebe, Z.; et al. Estimates of the global, regional, and national morbidity, mortality, and aetiologies of diarrhoea in 195 countries: A systematic analysis for the Global Burden of Disease Study 2016. Lancet Infect. Dis. 2018, 18, 1211–1228. [Google Scholar] [CrossRef] [Green Version]
  4. Bartram, J.; Brocklehurst, C.; Fisher, M.; Luyendijk, R.; Hossain, R.; Wardlaw, T.; Gordon, B. Global Monitoring of Water Supply and Sanitation: History, Methods and Future Challenges. Int. J. Environ. Res. Public Health 2014, 11, 8137–8165. [Google Scholar] [CrossRef] [Green Version]
  5. UNICEF/WHO. Progress on Household Drinking Water, Sanitation and Hygiene 2000-2017: Special Focus on Inequalities; United Nations Children’s Fund (UNICEF) and World Health Organization: New York, NY, USA, 2019; ISBN 978-92-415-1623-5. [Google Scholar]
  6. WHO/UNICEF Joint Monitoring Programme for Water Supply, Sanitation, and Hygiene: Estimates on the Use of Water, Sanitation and Hygiene in Peru. Available online: https://washdata.org/data (accessed on 12 November 2019).
  7. Bain, R.E.S.; Wright, J.A.; Christenson, E.; Bartram, J.K. Rural:urban inequalities in post 2015 targets and indicators for drinking-water. Sci. Total Environ. 2014, 490, 509–513. [Google Scholar] [CrossRef] [PubMed]
  8. Chitonge, H.; Mokoena, A.; Kongo, M. Water and Sanitation Inequality in Africa: Challenges for SDG 6. In Africa and the Sustainable Development Goals; Ramutsindela, M., Mickler, D., Eds.; Springer: Cham, Switzerland, 2020; pp. 207–218. [Google Scholar]
  9. D.S. N° 004-2017-MINAM Aprueban Estándares de Calidad Ambiental (ECA) Para Agua y Establecen Disposiciones Complementarias. Available online: https://sinia.minam.gob.pe/normas/aprueban-estandares-calidad-ambiental-eca-agua-establecen-disposiciones (accessed on 26 January 2020).
  10. DIGESA-MINSA Reglamento de la Calidad del Agua Para Consumo Humano: D.S. No 031-2010-SA/Regulation of Water Quality for Human Consumption: DS No 031-2010-SA. Available online: http://bvs.minsa.gob.pe/local/MINSA/1590.pdf (accessed on 21 August 2019).
  11. George, C.M.; Sima, L.; Arias, M.H.J.; Mihalic, J.; Cabrera, L.Z.; Danz, D.; Checkley, W.; Gilman, R.H. Arsenic exposure in drinking water: An unrecognized health threat in Peru. Bull. World Health Organ. 2014, 92, 565–572. [Google Scholar] [CrossRef]
  12. Yacoub, C.; Blazquez, N.; Pérez-Foguet, A.; Miralles, N. Spatial and temporal trace metal distribution of a Peruvian basin: Recognizing trace metal sources and assessing the potential risk. Environ. Monit. Assess. 2013, 185, 7961–7978. [Google Scholar] [CrossRef]
  13. Yacoub, C.; Pérez-Foguet, A.; Valderrama, C.; Miralles, N. Impacts on effluent contaminants from mine sites: Risk assessment, fate, and distribution of pollution at basin scale. Environ. Sci. Pollut. Res. 2014, 21, 5960–5971. [Google Scholar] [CrossRef] [Green Version]
  14. Yacoub, C.; Pérez-Foguet, A.; Miralles, N. Trace Metal Content of Sediments Close to Mine Sites in the Andean Region. Sci. World J. 2012, 2012, 732519. [Google Scholar] [CrossRef]
  15. Boehnke, K.F.; Brewster, R.K.; Sánchez, B.N.; Valdivieso, M.; Bussalleu, A.; Guevara, M.; Saenz, C.G.; Alva, S.O.; Gil, E.; Xi, C. An assessment of drinking water contamination with Helicobacter pylori in Lima, Peru. Helicobacter 2018, 23, e12462. [Google Scholar] [CrossRef]
  16. Quick, R.E.; Montano, S.M.; Mock, C.N.; Tilley, D.H.; Carrasco, A.J.; Cabrera, R.M.; Heitzinger, K.; Rocha, C.A.; Hawes, S.E. “Improved” But Not Necessarily Safe: An Assessment of Fecal Contamination of Household Drinking Water in Rural Peru. Am. J. Trop. Med. Hyg. 2015, 93, 501–508. [Google Scholar] [CrossRef] [Green Version]
  17. Gil, A.I.; Lanata, C.F.; Hartinger, S.M.; Mäusezahl, D.; Padilla, B.; Ochoa, T.J.; Lozada, M.; Pineda, I.; Verastegui, H. Fecal contamination of food, water, hands, and kitchen utensils at the household level in rural areas of Peru. J. Environ. Health 2014, 76, 102–106. [Google Scholar] [PubMed]
  18. Faldetta, K.F.; Reighard, D.A.; Dickinson, K.L.; Wang, C.Q.; George, D.R.; Rodriguez Benavides, L.; Strosnider, W.H.J. Assessing domestic water quality in Belén municipality, Iquitos, Peru. J. Water, Sanit. Hyg. Dev. 2014, 4, 391–399. [Google Scholar] [CrossRef]
  19. Ministerio de Vivienda Construcción y Saneamiento (MVCS). DATASS: Modelo Para la Toma de Decisiones en Saneamiento. Sistema de Diagnóstico sobre Abastecimiento de Agua y Saneamiento en el Ámbito Rural; Biblioteca Nacional del Perú N° 2018-15064: Lima, Peru, 2018. [Google Scholar]
  20. Miranda, M.; Aramburú, A.; Junco, J.; Campos, M. State of the quality of drinking water in households in children under five years in Peru, 2007-2010. Rev. Peru. Med. Exp. Salud Publica 2010, 27, 506–511. [Google Scholar] [CrossRef] [Green Version]
  21. Villena Chávez, J.A. Calidad del agua y desarrollo sostenible. Rev. Peru. Med. Exp. Salud Publica 2018, 35, 304. [Google Scholar] [CrossRef]
  22. Instituto Nacional de Estadístjica e Informática Perú: Formas de Acceso al Agua y Saneamiento Básico. Available online: https://www.inei.gob.pe/media/MenuRecursivo/boletines/boletin_agua_nov2019.pdf (accessed on 10 March 2020).
  23. Jajda, H.M.; Patel, K.G.N.G.N.; Patel, S.R.; Solanki, V.H.; Patel, K.G.N.G.N.; Singh, S. Comparative efficacy of two standard methods for determination of iron and zinc in fruits, pulses and cereals. J. Food Sci. Technol. 2013, 52, 1096–1102. [Google Scholar] [CrossRef] [Green Version]
  24. Jarošová, M.; Milde, D.; Kuba, M. Elemental analysis of coffee: A comparison of ICP-MS and AAS methods. Czech J. Food Sci. 2014, 32, 354–359. [Google Scholar] [CrossRef] [Green Version]
  25. Tyler, G.; Yvon, J. ICP-OES, ICP-MS and AAS Techniques Compared. ICP Opt. Spectrosc. Tech. Note 1995, 1–11. [Google Scholar]
  26. Instituto Nacional de Estadística e Informática Perú: Perfil Sociodemográfico. Informe Nacional. Censos Nacionales 2017: XII de Población, VII de Vivienda y III de Comunidades Indígenas. Available online: https://www.inei.gob.pe/media/MenuRecursivo/publicaciones_digitales/Est/Lib1539/libro.pdf (accessed on 9 February 2020).
  27. Instituto Nacional de Estadística e Informática Perú: Encuesta Demográfica y de Salud Familiar 2018—Nacional y Departamental. Available online: https://www.inei.gob.pe/media/MenuRecursivo/publicaciones_digitales/Est/Lib1656/index1.html (accessed on 13 January 2020).
  28. Accinelli, R.A.; Leon-Abarca, J.A. Age and altitude of residence determine anemia prevalence in Peruvian 6 to 35 months old children. PLoS ONE 2020, 15, e0226846. [Google Scholar] [CrossRef]
  29. Huicho, L.; Tavera, M.; Huayanay-Espinoza, C.A.; Béjar-Díaz, M.; Rivera-Ch, M.; Tam, Y.; Walker, N.; Black, R.E. Drivers of the progress achieved by Peru in reducing childhood diarrhoea mortality: A country case study. J. Glob. Health 2019, 9. [Google Scholar] [CrossRef]
  30. Kothari, M.T.; Coile, A.; Huestis, A.; Pullum, T.; Garrett, D.; Engmann, C. Exploring associations between water, sanitation, and anemia through 47 nationally representative demographic and health surveys. Ann. N. Y. Acad. Sci. 2019, 1450, 249. [Google Scholar] [CrossRef] [PubMed]
  31. Larsen, D.A.; Grisham, T.; Slawsky, E.; Narine, L. An individual-level meta-analysis assessing the impact of community-level sanitation access on child stunting, anemia, and diarrhea: Evidence from DHS and MICS surveys. PLoS Negl. Trop. Dis. 2017, 11. [Google Scholar] [CrossRef] [PubMed] [Green Version]
  32. Cairncross, S.; Hunt, C.; Boisson, S.; Bostoen, K.; Curtis, V.; Fung, I.C.C.H.; Schmidt, W.-P. Water, sanitation and hygiene for the prevention of diarrhoea. Int. J. Epidemiol. 2010, 39, i193–i205. [Google Scholar] [CrossRef] [PubMed] [Green Version]
  33. WHO. Guidelines for Drinking-Water Quality: Fourth Edition Incorporating the First Addendum, 4th ed.; WHO: Geneva, Switzerland, 2017; ISBN 978-92-4-154995-0. [Google Scholar]
  34. Reed, B.; Shaw, R.; Chatterton, K. Technical Notes on Drinking-Water, Sanitation and Hygiene in Emergencies; World Health Organization (WHO); Water, Engineering and Development Centre (WEDC): Loughborough, UK, 2013; pp. 45–48. [Google Scholar]
  35. Edgell, K.W.; Longbottom, J.E.; Pfaff, J.D. Determination of inorganic anions in water by ion chromatography: A collaborative study. J. AOAC Int. 1994, 77, 1253–1263. [Google Scholar] [CrossRef] [PubMed]
  36. Oblinger, J.L.; Koburguer, J.A. Understanding and Teaching the Most Probable Number Technique1. J. Milk Food Technol. 1975, 38, 540–545. [Google Scholar] [CrossRef]
  37. Ayres, R.M.; Mara, D.D. Analysis of Wastewater for Use in Agriculture: A Laboratory Manual of Parasitological and Bacteriological Techniques; World Health Organization: Geneva, Switzerland, 1996; ISBN 9241544848. [Google Scholar]
  38. Federation, W.E.; American Public Health Association. Standard Methods for the Examination of Water and Wastewater, 21st ed.; American Public Health Association: Washington, DC, USA, 2005; ISBN 0875530478 9780875530475. [Google Scholar]
  39. ISO—ISO 17294-2:2016—Water Quality—Application of Inductively Coupled Plasma Mass Spectrometry (ICP-MS)—Part 2: Determination of Selected Elements Including Uranium Isotopes. Available online: https://www.iso.org/standard/62962.html (accessed on 10 March 2020).
  40. Rice, E.W.; Baird, R.B.; Eaton, A.D.; Clesceri, L.S. 3111 Metals by flame atomic absorption spectometry. In Standard Methods for the Examination of Water and Wastewater; American Public Health Association: Washington, DC, USA; American Waterworks Association: Denver, CO, USA; Water Environment Federation: Alexandria, VA, USA, 2012; p. 10. [Google Scholar]
  41. Piasecki, W.; Goodwin, A.E.; Eiras, J.C.; Nowak, B.F. Importance of copepoda in freshwater aquaculture. Zool. Stud. 2004, 43, 193–205. [Google Scholar]
  42. Meshitsuka, S.; Aremu, D.A.; Nose, T. A Risk of Alzheimer’s Disease and Aluminum in Drinking Water. Psychogeriatrics 2002, 2, 263–268. [Google Scholar] [CrossRef]
  43. Wood, D.J.; Cooper, C.; Stevens, J.; Edwardson, J. Bone mass and dementia in hip fracture patients from areas with different aluminium concentrations in water supplies. Age Ageing 1988, 17, 415–418. [Google Scholar] [CrossRef]
  44. Gauthier, E.; Fortier, I.; Courchesne, F.; Pepin, P.; Mortimer, J.; Gauvreau, D. Aluminum Forms in Drinking Water and Risk of Alzheimer’s Disease. Environ. Res. 2000, 84, 234–246. [Google Scholar] [CrossRef] [Green Version]
  45. McLachlan, D.R.C.; Bergeron, C.; Smith, J.E.; Boomer, D.; Rifat, S.L. Risk for neuropathologically confirmed Alzheimer’s disease and residual aluminum in municipal drinking water employing weighted residential histories. Neurology 1996, 46, 401–405. [Google Scholar] [CrossRef]
  46. Rondeau, V.; Commenges, D.; Jacqmin-Gadda, H.; Dartigues, J.F. Relation between aluminum concentrations in drinking water and Alzheimer’s disease: An 8-year follow-up study. Am. J. Epidemiol. 2000, 152, 59–66. [Google Scholar] [CrossRef] [PubMed] [Green Version]
  47. Suay Llopis, L.; Ballester Díez, F. Revisión de los estudios sobre exposición al aluminio y enfermedad de Alzheimer. Rev. Esp. Salud Publica 2002, 76, 645–658. [Google Scholar] [CrossRef] [PubMed] [Green Version]
  48. WHO. International Programme on Chemical Safety Aluminnium. Environ. Heal. Criteria 1997, 194. [Google Scholar]
  49. Nieboer, E.; Gibson, B.L.; Oxman, A.D.; Kramer, J.R. Health effects of aluminum: A critical review with emphasis on aluminum in drinking water. Environ. Rev. 1995, 3, 29–81. [Google Scholar] [CrossRef]
  50. Gonzales, E.; Huamán-Espino, L.; Gutiérrez Villafuerte, C.; Aparco Balboa, J.; Pillaca, J. Characterization of anemia in children under five years of age from urban areas of Huancavelica and Ucayali, Peru. Rev. Peru. Med. Exp. Salud Publica 2015, 32, 431–439. [Google Scholar] [CrossRef]
  51. Hunter, P.R.; MacDonald, A.M.; Carter, R.C. Water Supply and Health. PLoS Med. 2010, 7, e1000361. [Google Scholar] [CrossRef] [Green Version]
  52. Kelly, E.R.; Cronk, R.; Kumpel, E.; Howard, G.; Bartram, J. How we assess water safety: A critical review of sanitary inspection and water quality analysis. Sci. Total Environ. 2020, 718, 137237. [Google Scholar] [CrossRef]
  53. Andres, L.; Boateng, K.; Borja-Vega, C.; Thomas, E.; Andres, L.; Boateng, K.; Borja-Vega, C.; Thomas, E. A Review of In-Situ and Remote Sensing Technologies to Monitor Water and Sanitation Interventions. Water 2018, 10, 756. [Google Scholar] [CrossRef] [Green Version]
  54. Grossi, M.; Lazzarini, R.; Lanzoni, M.; Pompei, A.; Matteuzzi, D.; Ricco, B. A portable sensor with disposable electrodes for water bacterial quality assessment. IEEE Sens. J. 2013, 13, 1775–1782. [Google Scholar] [CrossRef]
Figure 1. Geographical location of sampling points in communities.
J 03 00014 g001
Figure 2. (Left) parasitic nematodes (Nematodirus sp.) at SG1 examined under a microscope using 10× magnification; (right) copepod at SG2 examined under a microscope using 10× magnification.
J 03 00014 g002
Table 1. Number of sampling points per community.
CommunitySpringsWater ReservoirsHouseholds
Pueblo Libre711
San Gerónimo222
Sachapite222
Antaccocha 543
Pampachacra425
Table 2. Analysis of water quality parameters in rural communities.
ParameterAnalysis MethodSampling Points
Physicochemical Parameters
TurbidityHI93703 Portable Turbidity Meter (Hanna Instruments, USA) (Environmental Health Unit of the Huancavelica Health Network).
Range of detection: 0–1000 NTU
Springs, water reservoirs, and households
pH, conductivityPortable meter HQ40d (Hach, USA) (Environmental Health Unit of the Huancavelica Health Network)
Range of detection: pH (0–14), conductivity (0.01 µS/cm–200.0 mS/cm)
Free residual chlorine (FRC)HI96734 Portable photometer for free and total chlorine (Hanna Instruments, USA) (Environmental Health Unit of the Huancavelica Health Network).
Range of detection: 0–10 mg/L
ColorSpectrophotometry (Environmental Health Unit of the Huancavelica Health Network)
Total hardnessSMEWW-APHA-AWWA-WEF Part 2340 C, 23rd Ed.2017. Hardness. EDTA Titrimetric Method. Laboratory CERPER S.A. (Spanish acronym of the laboratory Certifications of Peru S.A.), Lima.
(Environmental Health Unit of the Huancavelica Health Network.)
Springs
ChloridesEPA Method 300.0. 1993 Determination of inorganic anions by ion chromatography [35]. Laboratory CERPER S.A., Lima.
(Environmental Health Unit of the Huancavelica Health Network.)
Nitrates
Nitrites
Sulfates
Microbiological and Parasitological Parameters
Total and thermotolerant (fecal) coliformsMost probable number (MPN) method [36]
(Laboratory of Microbiology and Parasitology—UNH)
Springs, water reservoirs and households
Parasites and free-living organismsProtocol to detect protozoa and parasitic helminths in natural water using a Sedgewick Rafter Counting Chambers [37,38]
(Environmental Health Unit of the Huancavelica Health Network)
Inorganic Parameters
Molybdenum (Mo), manganese (Mn), cadmium (Cd), arsenic (As), copper (Cu), chromium (Cr), lead (Pb), zinc (Zn), antimony (Sb), aluminum (Al).ISO 17294-2. 2016. Water quality—application of inductively coupled plasma mass spectrometry (ICP-MS) [39]
Laboratory CERPER S.A., Lima.
The limits of detection (mg/L) of the ICP-MS method were: Mo: 0.0002; Mn: 0.00025; Cd: 0.00005; As: 0.0005; Cu: 0.0003; Cr: 0.0005; Zn: 0.0005; Al: 0.0025; Pb: 0.0002; and Sb: 0.0002.
(Environmental Health Unit of the Huancavelica Health Network)
Springs
Atomic absorption spectroscopy (AAS)—3111 metals by flame atomic absorption spectrometry [40].
The limits of detection (mg/L) of the AAS method were: Mo: 0.03; Mn: 0.006; Cd: 0.0039; As: 0.12; Cu: 0.0099; Cr: 0.015; Zn: 0.003; Al: 0.09; Pb: 0.021; and Sb: 0.069.(Chemistry Laboratory—UNH)
Table 3. Water quality at different monitoring points.
CommunitySpringsWater ReservoirsHouseholds
PNTNC%NCCPNTNC%NCCPNTNC%NCC
Physicochemical parameters
Pueblo Libre7107000.0%70155120.0%4155120.0%4
San Gerónimo2102000.0%202510110.0%92510220.0%8
Sachapite2102000.0%202510220.0%82510220.0%8
Antaccocha5105024.0%484520315.0%173515426.7%11
Pampachacra4104012.5%392510220.0%85525624.0%19
Total20031.5%197 55916.4%46 651523.1%50
Microbiological and parasitological parameters
Pueblo Libre7428414.3%24144250.0%2144125.0%3
San Gerónimo248337.5%5248225.0%6248225.0%6
Sachapite248225.0%6248225.0%624800.0%8
Antaccocha5-1600.0%1642800.0%83-5240.0%3
Pampachacra4416212.5%1422400.0%4521000.0%10
Total761114.5%65 32618.8%26 35514.3%30
P: number of sampling points; N: number of sampling parameters; T: the total of parameters evaluated; NC: number of parameters that exceed the limit established in the regulations; C: number of parameters that do not exceed the limit established in the regulations; “-”: number of variable parameters according to the monitoring location (see Table S1).
Table 4. Results of the analysis of Mo, Mn, Cd, and As using two different techniques (AAS and ICP-MS).
SpringsMo (mg/L)Mn (mg/L)Cd (mg/L)As (mg/L)
AASICP-MSAASICP-MSAASICP-MSAASICP-MS
AN10.11<0.0002<0.0060.00092<0.0039<0.00005<0.12<0.0005
AN20.10<0.0002<0.0060.00063<0.0039<0.00005<0.12<0.0005
AN30.06<0.0002<0.0060.00431<0.0039<0.00005<0.12<0.0005
AN40.12<0.0002<0.0060.00578<0.0039<0.00005<0.12<0.0005
AN50.06<0.00020.050.02029<0.0039<0.00005<0.12<0.0005
PU10.0599<0.0002<0.0060.001870.0042<0.00005<0.12<0.0005
PU20.0661<0.00020.04560.044460.0083<0.00005<0.12<0.0005
PU30.0743<0.0002<0.0060.00760.0111<0.00005<0.12<0.0005
PU40.0728<0.0002<0.0060.001970.0109<0.00005<0.12<0.0005
PU50.0712<0.0002<0.0060.081410.0108<0.00005<0.12<0.0005
PU60.0711<0.0002<0.0060.004840.0113<0.00005<0.12<0.0005
PU70.0726<0.0002<0.0060.007820.0108<0.00005<0.12<0.0005
PA1<0.03<0.0002<0.0060.00743<0.0039<0.00005<0.12<0.0005
PA2<0.03<0.0002<0.0060.00082<0.0039<0.00005<0.120.00755
PA3<0.03<0.0002<0.0060.00282<0.0039<0.00005<0.120.00225
PA4<0.03<0.0002<0.0060.01908<0.0039<0.00005<0.120.00241
SG1<0.03<0.0002<0.0060.0010.0104<0.00005<0.12<0.0005
SG2<0.030.00146<0.006<0.000250.0103<0.00005<0.120.00326
SA1<0.03<0.0002<0.0060.00835<0.0039<0.00005<0.12<0.0005
SA2<0.03<0.0002<0.006<0.00025<0.0039<0.00005<0.12<0.0005
LOD0.030.00020.0060.000250.00390.000050.120.0005
ECA 10.070.40.0030.01
WHO 2--0.0030.01
Values that exceed the limits set by regulation are shown in bold. LOD: limit of detection; 1 ECA (Peruvian Environmental Quality Standard), Category 1, Subcategory A1; 2 WHO guideline values.
Table 5. Results of the analysis of Cu, Cr, Zn, and Al using two different techniques (AAS and ICP-MS).
SpringsCu (mg/L)Cr (mg/L)Zn (mg/L)Al (mg/L)
AASICP-MSAASICP-MSAASICP-MSAASICP-MS
AN1<0.0099<0.0003<0.015<0.00050.007410.0021<0.090.01629
AN20.015<0.0003<0.015<0.00050.006930.0064<0.090.01829
AN30.012<0.0003<0.015<0.00050.006740.00370.122750.187
AN40.016<0.0003<0.015<0.00050.005960.0040.212180.2662
AN5<0.00990.00231<0.0150.003060.008630.01983.474930.6782
PU10.0156<0.0003<0.015<0.0005<0.0030.003<0.090.00843
PU20.0216<0.0003<0.015<0.0005<0.0030.0043<0.090.0079
PU30.0230<0.0003<0.015<0.00050.003710.0086<0.090.02019
PU40.0257<0.0003<0.015<0.00050.004010.0073<0.090.03098
PU50.0275<0.0003<0.015<0.00050.003590.0029<0.090.03898
PU60.0275<0.0003<0.015<0.00050.006840.0055<0.090.08187
PU70.0309<0.0003<0.015<0.00050.005450.0046<0.090.02383
PA1<0.0099<0.0003<0.015<0.00050.01327<0.0005<0.090.01492
PA2<0.0099<0.0003<0.015<0.00050.00914<0.0005<0.090.02241
PA30.010<0.0003<0.015<0.00050.007450.0024<0.090.0739
PA40.011<0.0003<0.015<0.00050.011580.0129<0.090.4514
SG10.0365<0.0003<0.015<0.00050.003920.0031<0.090.01511
SG20.0356<0.0003<0.015<0.00050.004050.009<0.090.01369
SA1<0.0099<0.0003<0.015<0.00050.014420.004<0.090.05489
SA20.013<0.0003<0.015<0.00050.013310.0019<0.090.02583
LOD0.00990.00030.0150.00050.0030.00050.090.0025
ECA 120.0530.9
WHO 220.05-0.1
Values that exceed the limits set by regulation are shown in bold. LOD: limit of detection. 1 ECA, Category 1, Subcategory A1; 2 WHO guideline values.
Table 6. Comparison of different analysis techniques for Cu, Mo, and Mn.
ParametersCommunityMethodTest
AAS 1ICP-MS 2(p-Value)
Cu (mg/L)AN20.0154 ± 0.0033 (*)<0.00030.0078 **
AN30.0115 ± 0.0033 (*)<0.00030.0139 *
AN40.0158 ± 0.0033 (*)<0.00030.0074 **
PU10.0156 ± 0.0043<0.00030.0125 *
PU20.0216 ± 0.0021<0.00030.0016 ***
PU30.023 ± 0.0009<0.00030.0002 ***
PU40.0257 ± 0.0013<0.00030.0004 ***
PU50.0275 ± 0.0042<0.00030.004 ***
PU60.0275 ± 0.0011<0.00030.0003 ***
PU70.0309 ± 0.0007<0.00030.0001 ***
PA30.0104 ± 0.0033 (*)<0.00030.0169 *
PA40.0113 ± 0.0033 (*)<0.00030.0144 *
SG10.0365 ± 0.0074<0.00030.0068 **
SG20.0356 ± 0.0014<0.00030.0003 ***
SA20.0129 ± 0.0033 (*)<0.00030.0111 *
Mo (mg/L)AN10.1074 ± 0.0107 (*)<0.00020.0017 ***
AN20.0964 ± 0.01 (*)<0.00020.0018 ***
AN30.0632 ± 0.01 (*)<0.00020.0041 ***
AN40.1245 ± 0.0125 (*)<0.00020.0017 ***
AN50.0618 ± 0.01 (*)<0.00020.0043 ***
PU10.0599 ± 0.0057<0.00020.0015 ***
PU20.0661 ± 0.0023<0.00020.0002 ***
PU30.0743 ± 0.0092<0.00020.0025 ***
PU40.0728 ± 0.005<0.00020.0008 ***
PU50.0712 ± 0.0038<0.00020.0005 ***
PU60.0711 ± 0.0025<0.00020.0002 ***
PU70.0726 ± 0.003<0.00020.0003 ***
Mn (mg/L)AN50.0549 ± 0.0055 (*)0.02029 ± 0.00040.0083 **
PU20.0456 ± 0.00170.04446 ± 0.00090.4357
PU3<0.0060.0076 ± 0.00070.0936
PU5<0.0060.08141 ± 0.00170.0051 **
PU7<0.0060.00782 ± 0.00070.0828
PA1<0.0060.00743 ± 0.00070.104
PA4<0.0060.01908 ± 0.00060.0111*
SA1<0.0060.00835 ± 0.00070.0642
1 Average of three determinations ± standard deviation (SD); 2 Average of two determinations ± SD. (*): upper bound of SD, based on the SD that characterizes the limit of quantification. Significance levels: *: < 0.05; **: < 0.01; ***: < 0.005. To compare the methods, values below the detection limit are replaced by the limit value (e.g., Cu with LD < 0.0003 is replaced by Cu = 0.0003).
Table 7. Comparison of different analysis techniques for Al, Cd, and Zn.
ParametersCommunityMethodTest
AAS 1ICP-MS 2(p-Value)
Al (mg/L)AN30.1227 ± 0.030 (*)0.187 ± 0.02950.1411
AN40.2122 ± 0.030 (*)0.2662 ± 0.0420.3609
AN53.4749 ± 0.3475 (*)0.6782 ± 0.1070.0058 **
PA4<0.090.4514 ± 0.07120.0441 *
Cd (mg/L)PU10.0042 ± 0.0014<0.000050.0173 *
PU20.0083 ± 0.0014<0.000050.0051 **
PU30.0111 ± 0.0003<0.000050.0001 ***
PU40.0109 ± 0.0007<0.000050.0007 ***
PU50.0108 ± 0.0003<0.000050.0001 ***
PU60.0113 ± 0.0011<0.000050.0017 *
PU70.0108 ± 0.0002<0.000050.0001 ***
SG10.0104 ± 0.0003<0.000050.0002 ***
SG20.0103 ± 0.0004<0.000050.0002 ***
Zn (mg/L)AN10.0074 ± 0.001 (*)0.0021 ± 0.00060.0178 *
AN20.0069 ± 0.001 (*)0.0064 ± 0.00060.5472
AN30.0067 ± 0.001 (*)0.0037 ± 0.00060.0499 *
AN40.006 ± 0.001 (*)0.004 ± 0.00060.1028
AN50.0086 ± 0.001 (*)0.0198 ± 0.00070.0046 ***
PU2<0.0030.0043 ± 0.00060.0925
PU30.0037 ± 0.001 (*)0.0086 ± 0.00060.0196 *
PU40.004 ± 0.001 (*)0.0073 ± 0.00060.0417 *
PU50.0036 ± 0.001 (*)0.0029 ± 0.00060.4205
PU60.0068 ± 0.001 (*)0.0055 ± 0.00060.2028
PU70.0055 ± 0.001 (*)0.0046 ± 0.00060.3253
PA10.0133 ± 0.0013 (*)<0.00050.0018 ***
PA20.0091 ± 0.001 (*)<0.00050.0022 ***
PA30.0074 ± 0.001 (*)0.0024 ± 0.00060.0188 *
PA40.0116 ± 0.0012 (*)0.0129 ± 0.00060.2427
SG10.0039 ± 0.001 (*)0.0031 ± 0.00060.3693
SG20.0040 ± 0.001 (*)0.009 ± 0.00060.0188 *
SA10.0144 ± 0.0014 (*)0.004 ± 0.00060.0077 **
SA20.0133 ± 0.0013 (*)0.0019 ± 0.00060.0059 **
1 Average of three determinations ± SD; 2 Average of two determinations ± SD. (*): upper bound of SD, based on the SD that characterizes the limit of quantification. Significance levels: *: < 0.05; **: < 0.01; ***: < 0.005. To compare the methods, values below the detection limit are replaced by the limit value (e.g., Cd with LD < 0.00005 is replaced by Cd = 0.00005).

