
Investigation of Electrical and Thermal Performance of a Commercial PEM Electrolyzer under Dynamic Solicitations


1
Laboratoire d’Etude et de Recherche sur le Matériau Bois (LERMAB), Université de Lorraine, 54000 Nancy, France
2
Groupe de Recherche en Énergie Électrique de Nancy (GREEN), Université de Lorraine, 54000 Nancy, France
*
Author to whom correspondence should be addressed.
Clean Technol. 2022, 4(4), 931-941; https://doi.org/10.3390/cleantechnol4040057
Submission received: 11 July 2022
/
Revised: 21 August 2022
/
Accepted: 21 September 2022
/
Published: 26 September 2022
(This article belongs to the Special Issue Green Hydrogen Production for Achieving Zero Net Emissions by 2050)
Abstract
:Hydrogen generation through electrolyzers has gained a growing interest from researchers and industries to decarbonize transportation and electricity production. The performance of electrolyzers is strongly dependent on their operating conditions, such as the supply current, temperature, and pressure. To meet near-zero emissions, the electrolyzer must be supplied by low-carbon energy sources. Therefore, renewable energy sources must be considered. However, these sources are strongly linked with the weather conditions, so they have a high dynamic behavior. Therefore, this article is focused on the investigation of the effects of these dynamic solicitations on the electrical and thermal performance of electrolyzers. In this study, a proton exchange membrane (PEM) has been chosen to carry out this investigation. Experimental tests have been performed, emphasizing the relationship between the electrical and thermal performance of the PEM electrolyzer. The purpose of this work is to provide an optimal scenario of the operation of the electrolyzer under dynamic solicitations and consequently, to decrease the degradation of the electrolyzer.
1. Introduction
The last published report by the IPCC (intergovernmental panel on climate change), “Climate Change 2022: Impacts, Adaptation and Vulnerability” revealed the consequences of current climate change on ecosystems, biodiversity, and human communities at the global and country level [1]. These consequences are the increase in temperatures and water levels, health problems, and a decrease in the availability of food and water resources. Climate change is the consequence of the development of the human activities in which energy (i.e., electricity, heat, transportation) represents three-quarters of the total global emissions. To prevent climate change and reduce the global temperature (limited to 1.5 °C), one of the proposed solutions is to use hydrogen as an energy carrier to decarbonize energy generation and use [1].
Hydrogen can be generated in different ways, including thermochemical methods, i.e., natural gas reforming and coal gasification that can be coupled with CCUS (carbon capture, utilization, and storage), water electrolysis, direct solar water splitting, and biological methods, i.e., using microbes such as bacteria and microalgae [2]. Although chemical processes are mainly employed to produce hydrogen without CCUS, the water electrolysis pathways (where low-carbon electricity is used to break pure water into hydrogen and oxygen) are currently being disseminated in order to reach hydrogen cost targets (USD 2/kg by 2025 and USD 1/kg by 2030) and to drastically reduce the global carbon footprint [3]. The water electrolysis process is performed by an electrolyzer that must be employed for carbon-free hydrogen production from renewable and nuclear resources.
Four main electrolyzer technologies have been reported in the literature, depending on the required electrolyte material and the ionic species they diffuse: alkaline, proton exchange membrane (PEM), solid oxide (SO), and anion exchange membrane (AEM) technologies [4]. The AEM electrolyzer has recently been introduced in the literature, taking advantage of the benefits offered by alkaline and PEM electrolyzers. Indeed, low-cost catalyst materials are employed, as in alkaline electrolyzers, along with a solid polymer electrolyte (SPE), as in PEM electrolyzers (consequently reducing the maintenance of AEM) [5]. Among these four technologies, only alkaline and PEM technologies are now available on the market, while AEM and SO are still under research and development [6]. In this work, a commercial PEM electrolyzer has been chosen for investigation purposes.
For green hydrogen production, renewable energy sources (RES) are highly recommended to supply the electrolyzer. When considering RES, the generating power may fluctuate due to sudden changes in weather conditions [7]. Hence, it is crucial to improve the understanding and prediction of the electrical and thermal performance of the electrolyzer under dynamic operating modes [8]. Therefore, the aim is to limit cell and stack degradation while optimizing the energy efficiency for converting electricity into hydrogen, whatever the operating conditions [9].
Relying on the current literature, it is observed that most of the reported works focused on the electrical domain modeling, considering the temperature evolution to predict the performance of the electrolyzer, as well as thermal domain modeling [8,10,11,12,13,14,15,16,17,18,19]. Electrical modeling is validated by static voltage–current curves at different temperatures, but thermal modeling is generally not considered for validation. However, a recent study has highlighted a thermal model which complies with the thermal behaviour of the alkaline electrolyzer [13]. Indeed, Adibi et al. [13] developed a model on a mathematical basis, taking into consideration various parameters, such as cell voltage, electric current, pressure, and temperature. This work has been validated by the literature, showing good agreement with the results of previous studies. However, to simulate the variation of the incoming current, a regular sinosoidal pulse has been imposed. Despite the very detailed developed model of this survey, the imposed scenarios were not in line with the dynamic weather conditions.
Other published papers have focused mainly on combined hydrogen production and renewable energy sources [14,15,16,17,18,19]. This work has allowed for the development of predictive models, including an optimization strategy [14].
In light of these relevant works, this paper takes into consideration the dynamic operating modes of the RES to investigate the electrical and thermal behavior of a commercial PEM electrolyzer, along with the interactions of these behaviors, while most previous works consider alkaline electrolyzers [12,13]. Through this thorough investigation, the performance of the electrolyzer can be assessed and significant outcomes regarding the modeling of electrolyzer behaviors are provided.
This paper is organized as follows: after pointing out the current state of the art and the aim of this work in the introduction, the Section 2 presents the realized experimental test bench and describes the measurement protocol. Then, in Section 3, the material, geometry, and electrical and thermal properties of the investigated PEM electrolyzer are summarized. Afterwards, in Section 4, the obtained experimental results are provided and discussed in detail. Finally, in the Section 5, conclusions are drawn to sum up the main contributions of this work, while providing research perspectives.
2. Experimental Test Bench and Measurement Protocol
As mentioned above, the following two sub-sections aim to present the realized experimental test bench and the description of the measurement protocol used for this study.
2.1. Presentation of the Realized Experimental Test Bench
The experimental test bench realized for this study are shown in Figure 1. The experiment is composed of the following equipment:
- dSPACE control desk software;
- DS1104 controller board;
- temperature data logger;
- isolated transformer;
- PEM electrolyzer;
- voltage probe;
- current probe;
- DC power supply;
- 4-channel oscilloscope.
The DC power supply EL 9160-100 from Elektro Automatick (EA) Company (Viersen, Germany) allows for feeding a commercial single-cell PEM electrolyzer QL-300 from Shandong Saikesaisi Hydrogen Energy Co., Ltd. (Jinan, China), with a pure DC current; the technical specifications are summarized in Table 1. This power supply is controlled through the dSPACE control desk software, in which different operating scenarios can be implemented (dynamic power profile). For the acquisition of the electrolyzer current and voltage, a current clamp E3N from Chauvin Arnoux Company (Asnières-sur-Seine, France) and a voltage probe MTX-1032C from Metrix Company (Dubuque, IA, USA) are used, respectively. To avoid any disturbance from the power grid for measurement purposes, an isolated transformer is employed. Both measurements are transferred to the DS1104 controller board from dSPACE Company (Paderborn, Germany) and the 4-channel oscilloscope MDO34-1000 from Tektronix Company (Portland, OR, USA) to record the acquired data. Finally, the temperature of the PEM electrolyzer is obtained using a temperature data logger DAS220 from Sefram Company (Saint-Etienne, France).
Figure 1.
Realized experimental test bench.

The static curve of the single-cell PEM electrolyzer is shown in Figure 2. This curve emphasizes the reversible voltage (equal to 1.4 V), the activation region (significant up to 1 A) modeling both electrodes, and the ohmic region (preponderant from 1 A to 45 A). The ohmic overvoltage is affected by several variables, including materials, thermal and electrical conductivity, geometry, temperature, and bubble covering [13,20]. In addition, the reversible voltage and activation overvoltage for both electrodes are strongly dependent on the temperature.
2.2. Description of the Measurment Protocol
As highlighted above, different operating scenarios have been implemented through the control desk software so that the DC power supply can emulate a dynamic power source. The operating scenarios used to carry out these experiments are reported in Table 2.
Given that the rated current of the PEM electrolyzer cell used is equal to 45 A, the twelve scenarios above reported vary from four specific thresholds (0, 15, 30, and 45 A). The step currents can either rise or fall to meet the dynamic nature of the renewable power source.
Figure 3 depicts the measurement connections on the PEM electrolyzer cell for cell voltage and temperature acquisitions. Two k-type thermocouples are positioned on the anode and cathode sides, respectively. The cell voltage measurement is performed between the anode (+) and cathode (−) potentials.
The sampling time for the temperature measurement is 500 ms, while for the current and cell voltage, the sampling time is 100 ms. The thermal properties and the geometry of the PEM electrolyzer are described in the Section 3. The global duration of each scenario has been set at 4000 s. The choice of this global duration is motivated by the fact that the cell voltage and temperature require a long time to converge towards steady-state operation (beginning at 2000 s, as observed during experiments). It is important to mention that this duration is only effective with the selected electrolyzer; it can indeed vary depending on the type of electrolyzer and the production technology.
3. Materials, Geometry, and Electrical and Thermal Properties of the Investigated PEM Electrolyzer
The commercial PEM electrolyzer chosen for these experiments is composed of a platinum cathode, an iridium anode, and an SPE. Figure 4 highlights both the top and side views of the PEM electrolyzer cell, while Table 3 reports the thermal and electrical characteristics of all materials composing the PEM electrolyzer cell used. As already mentioned in the Section 2, for thermal acquisition, two k-type thermocouple probes were used; they are positioned on the surface of both electrodes (see Figure 4b).
As summarized in Table 3, both electrode materials feature different thermal and electrical conductivity. The anode and cathode are based on iridium and platinum, respectively, which present a high thermal conductivity range; however, the anode has a higher thermal and electrical conductivity than the cathode. Therefore, their thermal behaviors differ. Despite having the same thickness (the value is not known and has not been reported in Table 3), they have a different thermal resistance, as depicted in Figure 5, representing the model assumption for the determination of the thermal resistance of the used PEM electrolyzer.
4. Experimental Results and Discussion
4.1. Obtained Experimental Results
Relying on the different scenarios provided in Table 2, experiments have been conducted to observe the cell voltage and temperature behavior of the PEM electrolyzer cell. The obtained results are reported in Figure 6, Figure 7, Figure 8, Figure 9, Figure 10 and Figure 11. For each figure, the results of two scenarios are presented, including a rising (min, max) and falling (max, min) step current.
4.2. Analysis
From Figure 6, Figure 7, Figure 8, Figure 9, Figure 10 and Figure 11, it can be noticed that during the rising current step scenarios, cell voltage responses differ, while the temperature behaviors are quite similar. In comparison, during the falling current step scenarios, the cell voltage responses also vary, while the temperature evolutions are equivalent. During all imposed scenarios, the temperatures increased or decreased with the rising and falling down step currents, respectively. For the cell voltage responses, according to the operating scenario (rising or falling current step, operating points), the behaviors strongly diverge. However, for some operating scenarios, the same behavior can be noted. For instance, during rising step currents, the behaviors in SC1 (Figure 6a) and SC5 (Figure 8a), and SC7 (Figure 9a), SC9 (Figure 10a), and SC11 (Figure 11a) are close. Only the scenario SC3 exhibited a differing behavior between 0.1 and 1 ms, with a large voltage variation (around 0.5 V). On the other hand, during falling step currents, the behaviors in scenarios SC2 (Figure 6b) and SC6 (Figure 8b), and SC8 (Figure 9b) and SC10 (Figure 10b) presented differing behaviors. Moreover, in this case, SC2 and SC12 present a specific behavior, particularly significant between 0.4 and 1.5 ms. Additionally, it is important to note that the cell voltage responses include the first dynamic operation, and then a steady-state operation. The length of the dynamic operation also depends strongly on the conducted scenario. For some scenarios, particularly those during falling current steps, the cell voltage has not reached its steady-state value, since the cell voltage continues to vary due to the continuous evolution of the temperature.
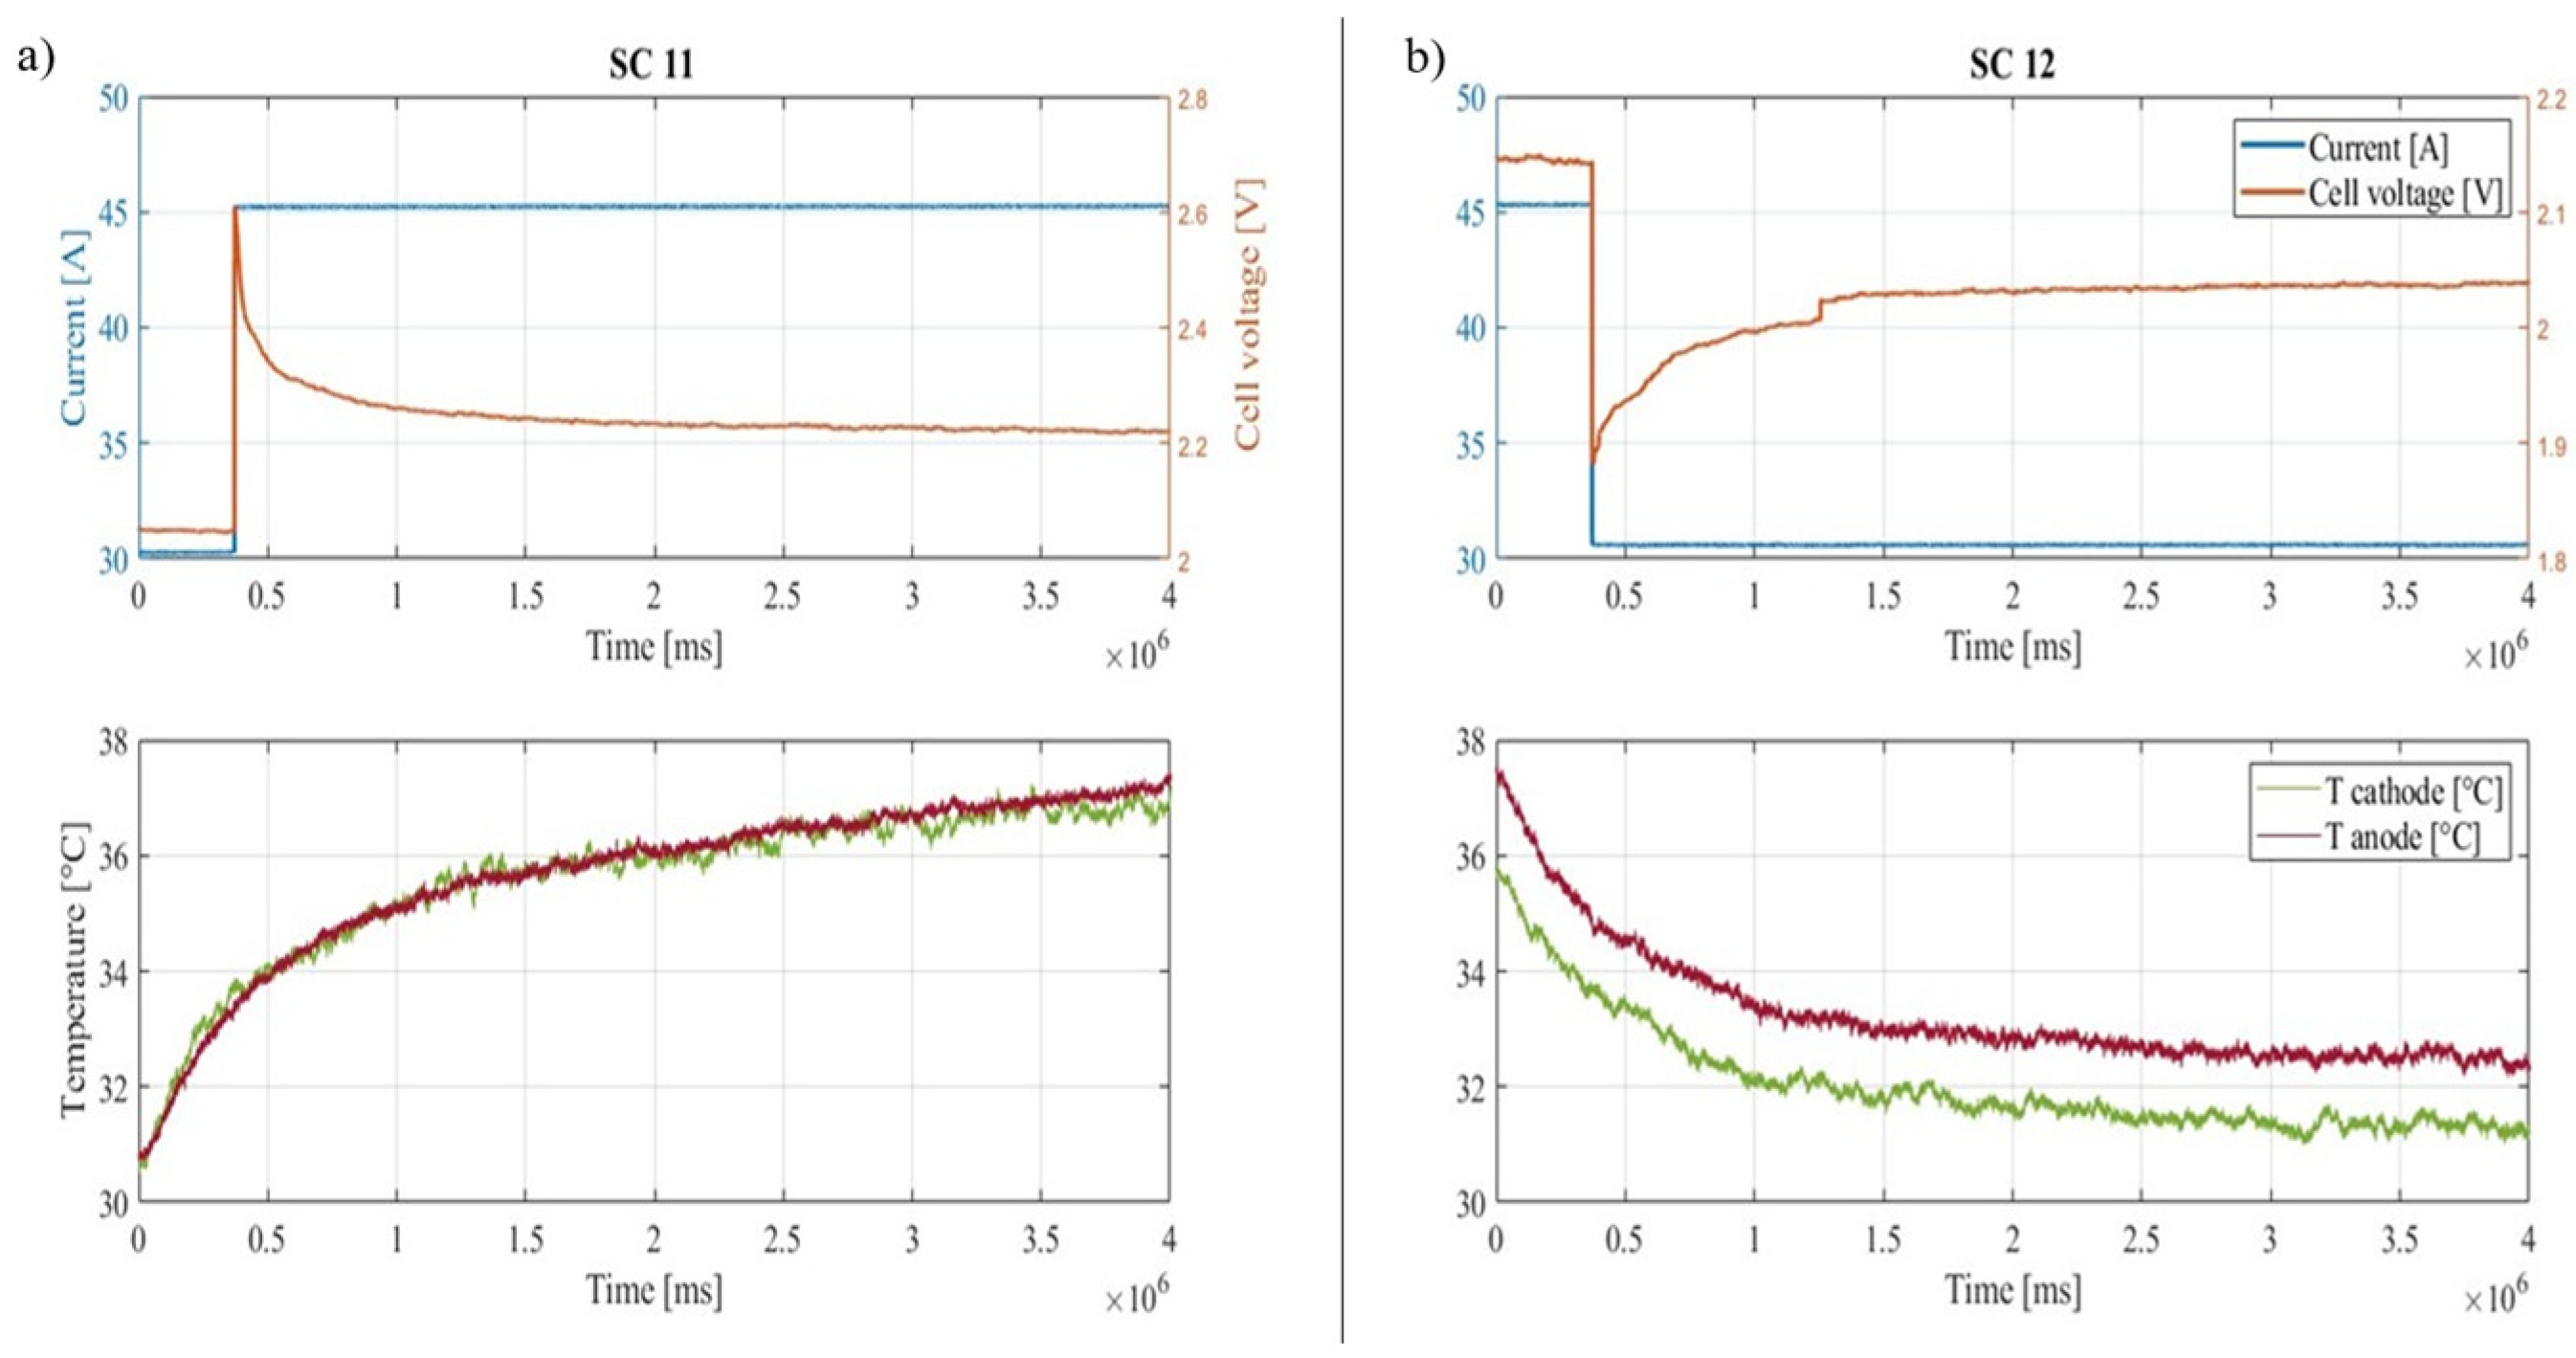
The increase in electrode temperature leads to the decrease in the PEM cell voltage, particularly noticeable on the SC11 (Figure 11a). On the other hand, the decrease in electrode temperature supports the increase in the cell voltage, specifically for SC12 (Figure 11b). Among the falling step current scenarios, SC8 (Figure 9b), SC10 (Figure 10b), and SC12 (Figure 11b) show the increase in cell voltage, while the temperature decreases. Nevertheless, it appears that for SC2 (Figure 6b), SC4 (Figure 7b), and SC6 (Figure 8b), the cell voltage decreases, despite the decrease in the temperature. This means that the change in temperature has no impact on the cell voltage response.
Concerning the temperature evolution, it is important to highlight that the delay in increasing electrode temperature depends on the supplied current. Indeed, this delay relies on the amount of energy supplying the PEM electrolyzer. For instance, at high current, this delay is drastically reduced (e.g., SC5 as shown in Figure 8a). Furthermore, the anode temperature is higher than the cathode temperature for any imposed scenario because of the thermal conductivity of iridium (See Table 3), which is greater than that of platinum. Thus, both electrodes have different thermal resistance and thus, their heat diffusion differs.
To summarize the obtained results according to the scenarios, Table 4 shows the cell voltages and minimum/maximum temperature ranges. From Table 4, the minimum cell voltage range is obtained for SC1 (Figure 6a), whereas the highest cell voltage range is obtained for SC6 (Figure 7b). The highest measured temperature is reached with a current equal to 45 A.
4.3. Discussion
As emphasized in the analysis, the highest cell voltage range is obtained for SC6, whereas for SC2 and SC4, a significant cell voltage range is also reported compared to the other conducted scenario. This large voltage range is observed mainly for scenarios relying on falling step currents, where the final value is equal to 0 A. As demonstrated in a previous paper [21], for this specific operating condition at 0 A, the cell voltage converges to 0 V due to the decrease in the open-circuit cell voltage. During the experiments, the variation in the temperature leads to a change in the cell voltage of the PEM electrolyzer, which gathers the reversible voltage, activation, and ohmic overvoltage [22]. Indeed, the increase in temperature induced the decrease in the cell voltage (for any scenario including rising step currents), while the decrease in temperature resulted in the increase in cell voltage (SC8, SC10 and SC12).
For the remaining scenarios (SC2, SC4, and SC6) where the final current value is zero, the cell voltage converges to zero, as mentioned above. Furthermore, the obtained cell voltage responses during rising and falling current steps show different behaviors. For example, as stressed in the analysis, the scenarios (SC7, SC9, and SC11) present the cell voltage with the same behavior. For these scenarios, the cell voltage shows an overshoot, especially meaningful for SC9, with a max cell voltage equal to 2.8 V. This high observed cell voltage can be explained due to a large current step (around 30 A). This critical operating condition may lead to degradation of the electrolyzer, according to relevant results reported in [23].
Hence, according to the current step (i.e., rising or falling), the cell voltage responses cannot be modeled in the same way. It also appears that these behaviors cannot be reproduced by using existing equivalent electrical circuits and models, since they are not suitable [22]. Thus, the development of new electrical circuits and models is required to accurately reproduce these behaviors according to the operating condition.
The final temperature for the same scenarios is around 24 °C; this is due to the length of the operation, where the PEM cell electrolyzer has reached the equilibrium temperature. The higher the energy brought to the PEM electrolyzer cell, the higher the equilibrium temperature. The energy balance of the PEM cell electrolyzer is composed of the input energy, the energy required to convert electricity into hydrogen, and energy losses under the heat form. The heat is mainly caused by the ohmic losses, considering anode, cathode, membrane, end-plates, and interconnection resistances that directly affect cell performance. These losses depend on several factors, among them being the materials used and particularly, the amount of the supplied current.
Finally, regarding the hydrogen flow rate and energy efficiency of the electrolyzer, dynamic operating conditions play a crucial role. First, the hydrogen flow rate depends on two important parameters, namely supplied current and Faraday’s efficiency. The higher the supplied current, the higher the hydrogen flow rate. Furthermore, Faraday’s efficiency represents the diffusion losses due to the gas crossover through the membrane. As stressed in the literature [24], Faraday’s efficiency is affected by the increase of temperature, which leads up to the decrease in membrane resistance. In this case, the membrane is subjected to an increase in diffusion losses; therefore, the hydrogen flow rate is reduced. To maximize the hydrogen flow rate at high temperatures, the electrolyzer must operate at high current, at which the diffusion losses are lower. Second, the energy efficiency of the electrolyzer is mainly dependent on Faraday’s efficiency and the electrolyzer voltage. As shown in the reported experimental results, the increase in temperature leads to a lower electrolyzer voltage. Hence, the lower the voltage, the higher the energy efficiency.
5. Conclusions
This article is focused on the electrical and thermal performance of a commercial PEM electrolyzer under dynamic solicitations. This work is mainly based on experiments conducted with different operating scenarios (rising and falling current steps) to simulate a dynamic power source. The obtained experimental results have allowed for pointing out the cell voltage response and thermal behavior of the PEM electrolyzer cell during dynamic operating conditions, which are generally not considered in the literature. Despite the fact that the temperature variation impacts the cell performance due to the ohmic losses, the modeling of the cell behavior is challenging, since it varies greatly according to the operating conditions. Hence, the existing models proposed in the literature are not fit to model these different behaviors. Thus, further research is required to accurately replicate the cell voltage response and thermal behavior.
Author Contributions
Conceptualization, F.M., D.G. and M.E.-G.; methodology, F.M. and D.G.; validation, F.M. and D.G.; investigation, F.M. and D.G.; writing—original draft preparation, F.M. and D.G.; writing—review and editing, F.M. and D.G. All authors have read and agreed to the published version of the manuscript.
Funding
This research received no external funding.
Institutional Review Board Statement
Not applicable.
Informed Consent Statement
Not applicable.
Data Availability Statement
The data employed in this work are available on request from the corresponding author. The data are not publicly available due to their current use for future works involving the authors of this paper.
Acknowledgments
The authors are very grateful to the IUT of Longwy, and the LERMAB and GREEN research laboratories for their constant support in developing fruitful cooperation between the LERMAB and GREEN research teams from the IUT de Longwy campus.
Conflicts of Interest
The authors declare no conflict of interest.
References
- Ipcc.ch. Climate Change 2022: Impacts, Adaptation and Vulnerability. 2022. Available online: https://www.ipcc.ch/report/ar6/wg2/ (accessed on 23 June 2022).
- Maestre, V.; Ortiz, A.; Ortiz, I. Challenges and prospects of renewable hydrogen-based strategies for full decarbonization of stationary power applications. Renew. Sustain. Energy Rev. 2021, 152, 111628. [Google Scholar] [CrossRef]
- Yue, M.; Lambert, H.; Pahon, E.; Roche, R.; Jemei, S.; Hissel, D. Hydrogen energy systems: A critical review of technologies, applications, trends and challenges. Renew. Sustain. Energy Rev. 2021, 146, 111180. [Google Scholar] [CrossRef]
- Vincent, I.; Bessarabov, D. Low cost hydrogen production by anion exchange membrane electrolysis: A review. Renew. Sustain. Energy Rev. 2018, 81, 1690–1704. [Google Scholar] [CrossRef]
- Vincent, I.; Lee, E.; Kim, H. Comprehensive impedance investigation of low-cost anion exchange membrane electrolysis for large-scale hydrogen production. Sci. Rep. 2021, 11, 293. [Google Scholar] [CrossRef] [PubMed]
- Sebbahi, S.; Nabil, N.; Alaoui-Belghiti, A.; Laasri, S.; Rachidi, S.; Hajjaji, A. Assessment of the three most developed water electrolysis technologies: Alkaline Water Electrolysis, Proton Exchange Membrane and Solid-Oxide Electrolysis. Mater. Today Proc. 2022, 66, 140–145. [Google Scholar] [CrossRef]
- Faye, O.; Szpunar, J.; Eduok, U. A critical review on the current technologies for the generation, storage, and transportation of hydrogen. Int. J. Hydrogen Energy 2022, 47, 13771–13802. [Google Scholar] [CrossRef]
- Moradi Nafchi, F.; Afshari, E.; Baniasadi, E. Thermal and electrochemical analyses of a polymer electrolyte membrane electrolyzer. Int. J. Hydrogen Energy 2022. [Google Scholar] [CrossRef]
- Energy.gov. Hydrogen Production: Electrolysis. 2022. Available online: https://www.energy.gov/eere/fuelcells/hydrogen-production-electrolysis (accessed on 23 June 2022).
- Liso, V.; Savoia, G.; Araya, S.S.; Cinti, G.; Kær, S.K. Modelling and Experimental Analysis of a Polymer Electrolyte Membrane Water Electrolysis Cell at Different Operating Temperatures. Energies 2018, 11, 3273. [Google Scholar] [CrossRef]
- Toghyani, S.; Afshari, E.; Baniasadi, E.; Atyabi, S.; Naterer, G. Thermal and electrochemical performance assessment of a high temperature PEM electrolyzer. Energy 2018, 152, 237–246. [Google Scholar] [CrossRef]
- Sakas, G.; Ibáñez-Rioja, A.; Ruuskanen, V.; Kosonen, A.; Ahola, J.; Bergmann, O. Dynamic energy and mass balance model for an industrial alkaline water electrolyzer plant process. Int. J. Hydrogen Energy 2022, 47, 4328–4345. [Google Scholar] [CrossRef]
- Adibi, T.; Sojoudi, A.; Saha, S. Modeling of thermal performance of a commercial alkaline electrolyzer supplied with various electrical currents. Int. J. Thermofluids 2022, 13, 100126. [Google Scholar] [CrossRef]
- Khelfaoui, N.; Djafour, A.; Ghenai, C.; Laib, I.; Danoune, M.; Gougui, A. Experimental investigation of solar hydrogen production PV/PEM electrolyser performance in the Algerian Sahara regions. Int. J. Hydrogen Energy 2021, 46, 30524–30538. [Google Scholar] [CrossRef]
- Maclay, J.; Brouwer, J.; Samuelsen, G. Dynamic modeling of hybrid energy storage systems coupled to photovoltaic generation in residential applications. J. Power Sources 2007, 163, 916–925. [Google Scholar] [CrossRef]
- Aouali, F.; Becherif, M.; Ramadan, H.; Emziane, M.; Khellaf, A.; Mohammedi, K. Analytical modelling and experimental validation of proton exchange membrane electrolyser for hydrogen production. Int. J. Hydrogen Energy 2017, 42, 1366–1374. [Google Scholar] [CrossRef]
- Clarke, D.; Al-Abdeli, Y.; Kothapalli, G. The impact of renewable energy intermittency on the operational characteristics of a stand-alone hydrogen generation system with on-site water production. Int. J. Hydrogen Energy 2013, 38, 12253–12265. [Google Scholar] [CrossRef]
- Gougui, A.; Djafour, A.; Danoune, M.; Khelfaoui, N. Field experience study and evaluation for hydrogen production through a photovoltaic system in Ouargla region, Algeria. Int. J. Hydrogen Energy 2020, 45, 2593–2606. [Google Scholar] [CrossRef]
- Dieguez, P.; Ursua, A.; Sanchis, P.; Sopena, C.; Guelbenzu, E.; Gandia, L. Thermal performance of a commercial alkaline water electrolyzer: Experimental study and mathematical modeling. Int. J. Hydrogen Energy 2008, 33, 7338–7354. [Google Scholar] [CrossRef]
- Su, X.; Xu, L.; Hu, B. Simulation of proton exchange membrane electrolyzer: Influence of bubble covering. Int. J. Hydrogen Energy 2022, 47, 20027–20039. [Google Scholar] [CrossRef]
- Hernández-Gómez, Á.; Ramirez, V.; Guilbert, D.; Saldivar, B. Self-Discharge of a Proton Exchange Membrane Electrolyzer: Investigation for Modeling Purposes. Membranes 2021, 11, 379. [Google Scholar] [CrossRef]
- Falcão, D.; Pinto, A. A review on PEM electrolyzer modelling: Guidelines for beginners. J. Clean. Prod. 2020, 261, 121184. [Google Scholar] [CrossRef]
- Papakonstantinou, G.; Algara-Siller, G.; Teschner, D.; Vidaković-Koch, T.; Schlögl, R.; Sundmacher, K. Degradation study of a proton exchange membrane water electrolyzer under dynamic operation conditions. Appl. Energy 2020, 280, 115911. [Google Scholar] [CrossRef]
- Ulleberg, O. Modeling of advanced alkaline electrolyzers: A system simulation approach. Int. J. Hydrogen Energy 2003, 28, 21–33. [Google Scholar] [CrossRef]
Figure 2.
Static curve of the single-cell PEM electrolyzer used.

Figure 3.
PEM electrolyzer cell with the measurement connections.
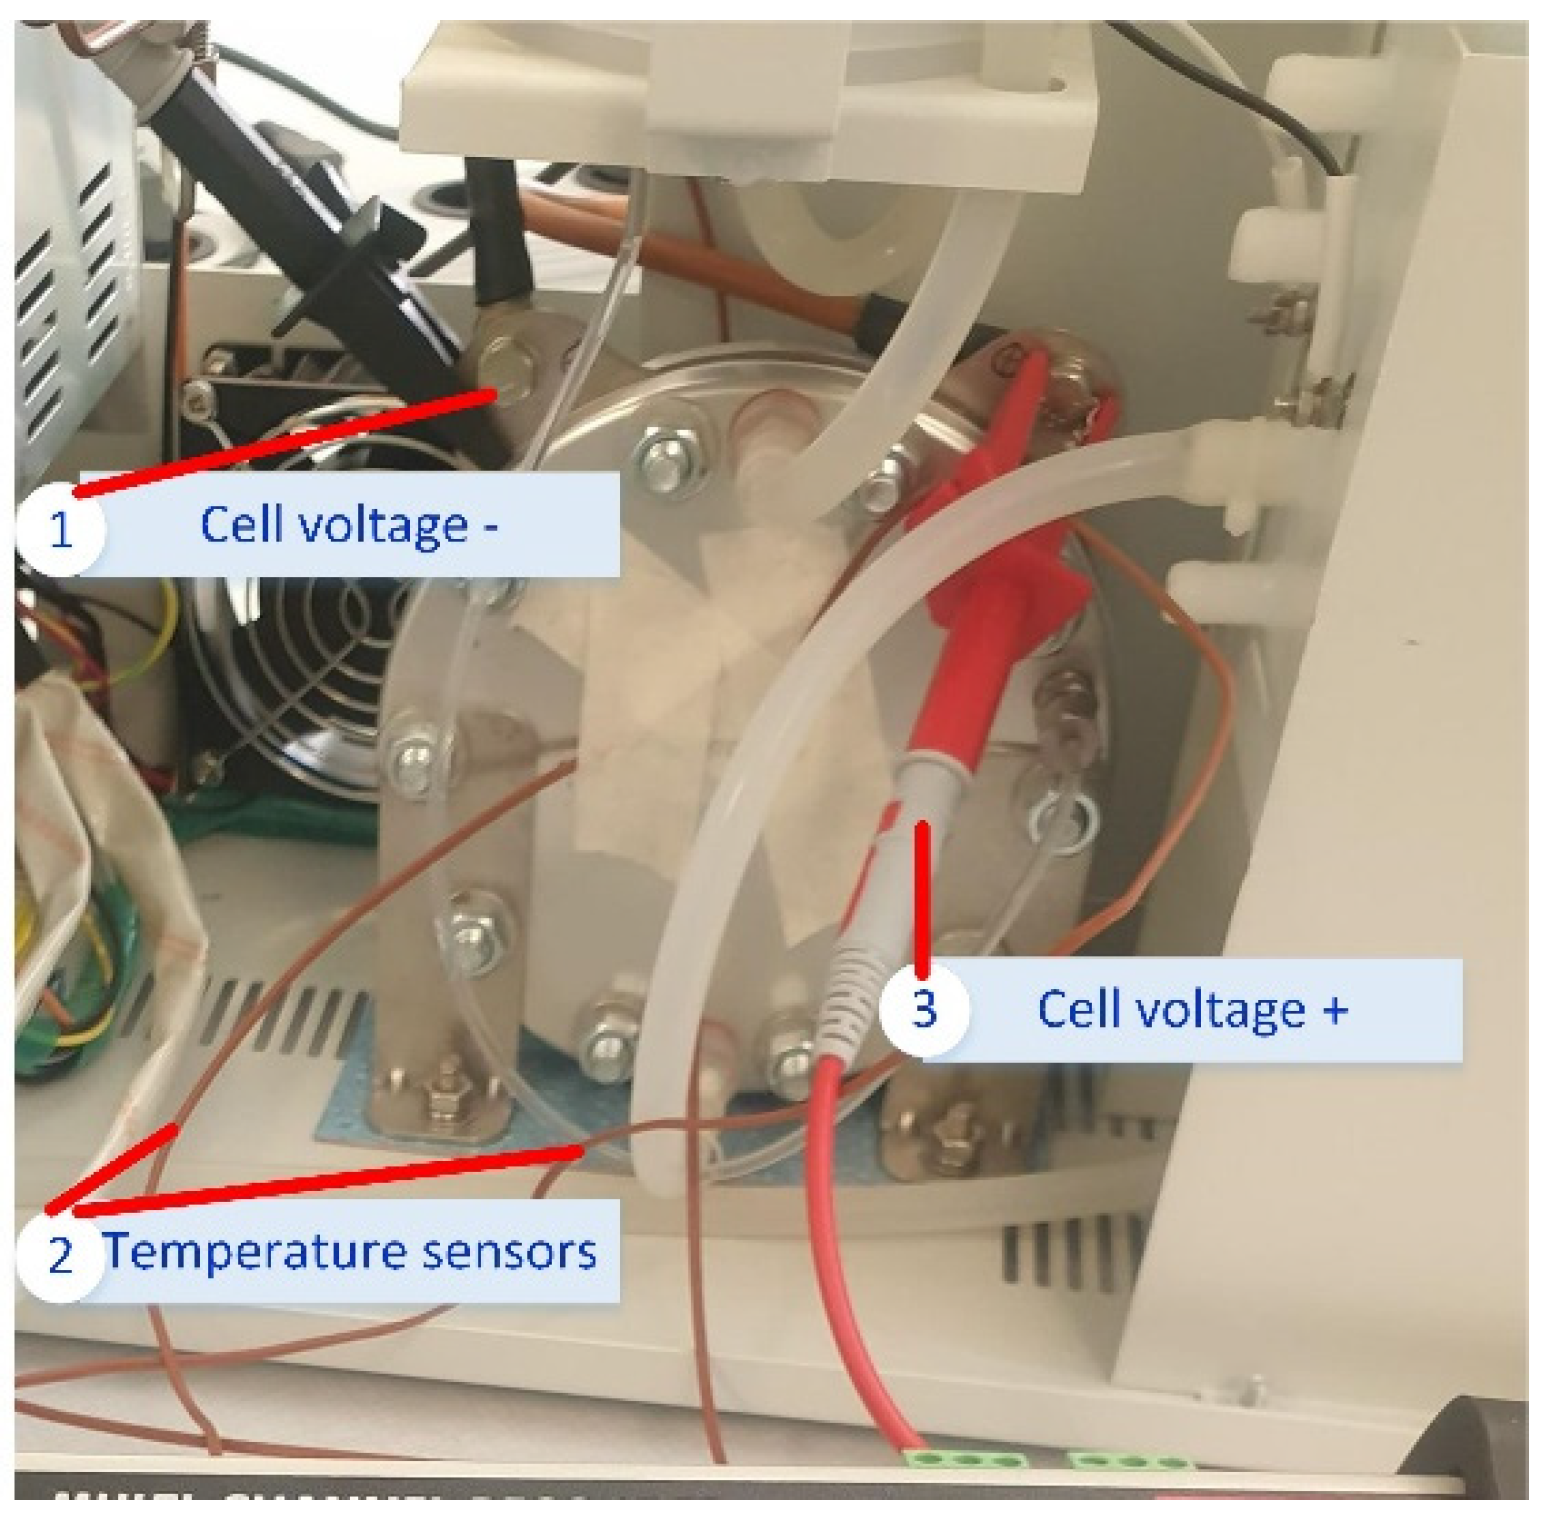
Figure 4.
Views of the PEM electrolyzer cell to point out its geometry: (a) top view; (b) side view.
Figure 4.
Views of the PEM electrolyzer cell to point out its geometry: (a) top view; (b) side view.
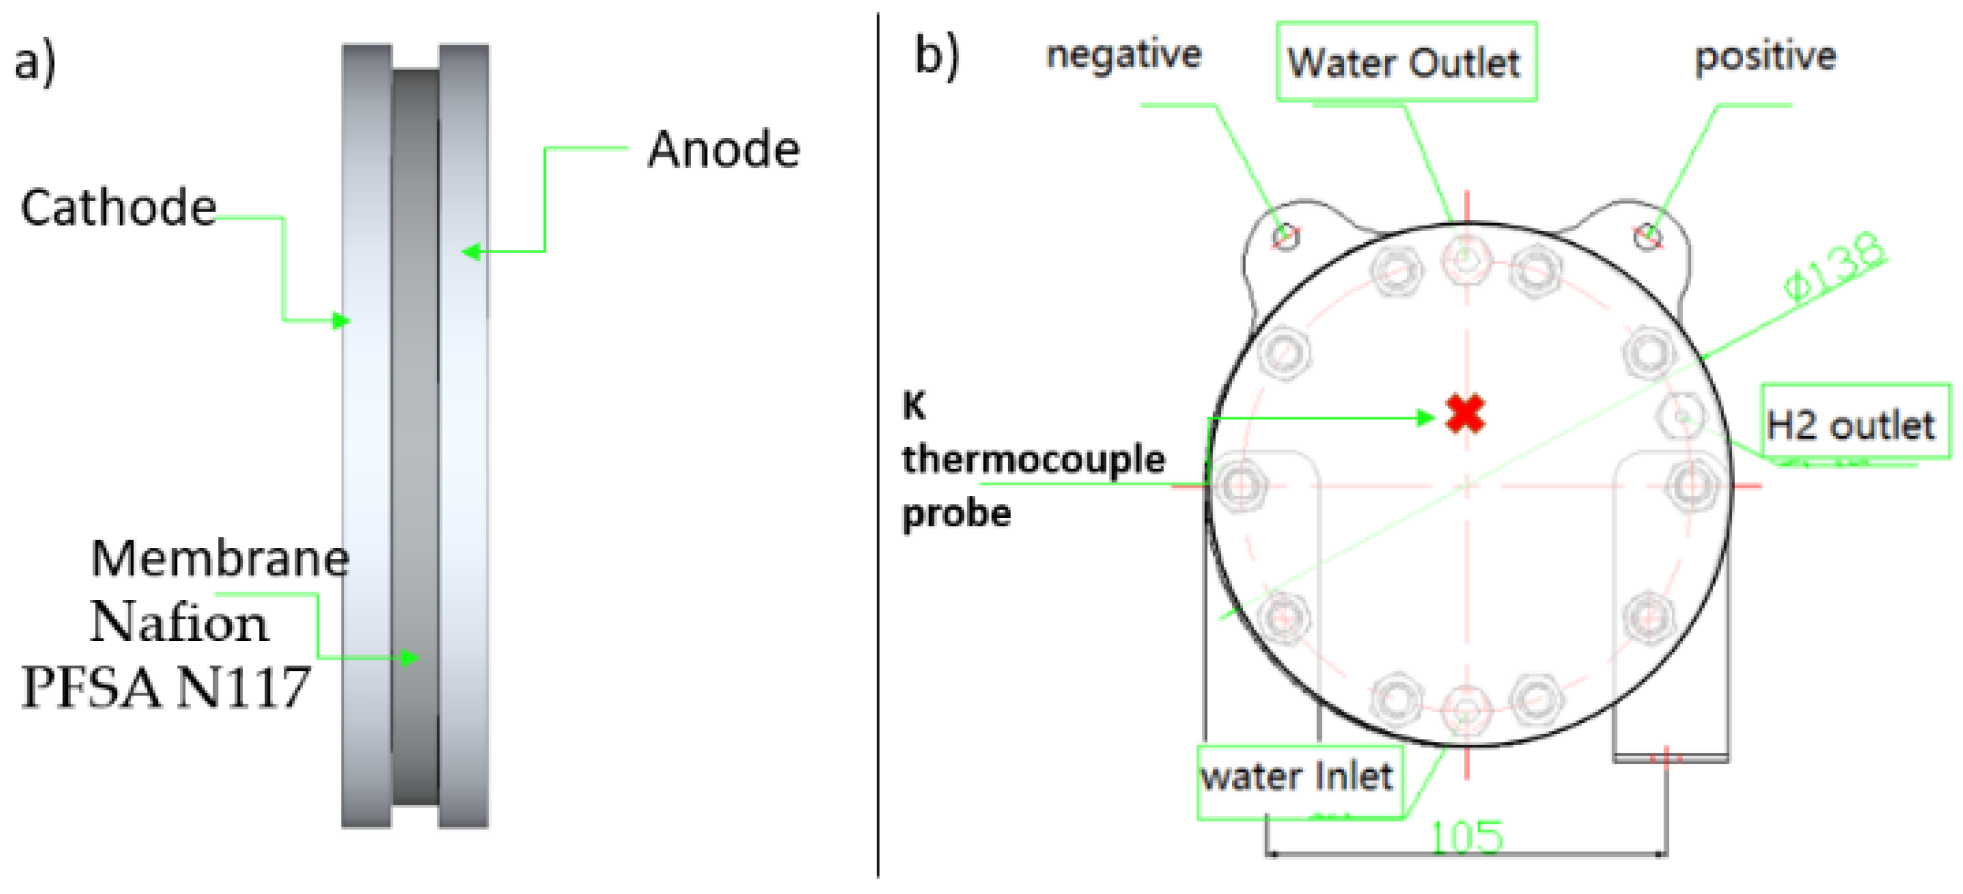
Figure 5.
Model assumption for the determination of thermal resistance of the PEM electrolyzer.

Figure 6.
Obtained experimental results: (a) SC1 (0–15 A), and (b) SC2 (15–0 A).

Figure 7.
Obtained experimental results: (a) SC3 (0–30 A), and (b) SC4 (30–0 A).

Figure 8.
Obtained experimental results: (a) SC5 (0–45 A), and (b) SC6 (45–0 A).

Figure 9.
Obtained experimental results: (a) SC7 (15–30 A), and (b) SC8 (30–15 A).

Figure 10.
Obtained experimental results: (a) SC9 (15–45 A), and (b) SC10 (45–15 A).

Figure 11.
Obtained experimental results: (a) SC11 (30–45 A), and (b) SC12 (45–30 A).

Table 1.
Technical specifications of the PEM electrolyzer.
| Parameters | Value | Unit |
|---|---|---|
| Rated electrical power | 150 | W |
| Operating voltage range | 1.4–2.3 | V |
| Current range | 0–45 | A |
| Delivery output hydrogen pressure | 0.1–10.5 | bar |
| Hydrogen purity | 99.999 | % |
| Cell number | 1 | - |
| Hydrogen volume range | 0–310 | mL.min−1 |
| SPE | 183 | µm |
| Cell active area | 150 | cm2 |
Table 2.
Summary of the operating scenarios used to perform the experiments.
| Scenario | Value | Unit |
|---|---|---|
| SC 1 | 0–15 | A |
| SC 2 | 15–0 | |
| SC 3 | 0–30 | |
| SC 4 | 30–0 | |
| SC 5 | 0–45 | |
| SC 6 | 45–0 | |
| SC 7 | 15–30 | |
| SC 8 | 30–15 | |
| SC 9 | 15–45 | |
| SC 10 | 45–15 | |
| SC 11 | 30–45 | |
| SC 12 | 45–30 |
Table 3.
Synthesis of materials, geometry, and electrical and thermal properties of the PEM electrolyzer cell.
Table 3.
Synthesis of materials, geometry, and electrical and thermal properties of the PEM electrolyzer cell.
| Component | Material | Thermal Conductivity [W/m.K] | Electrical Conductivity [S/m] | Thickness [cm] |
|---|---|---|---|---|
| Anode | Iridium | 150 | 2.1 × 10⁷ | - |
| Cathode | Platinum | 69.1 | 9.43 × 10⁶ | - |
| Membrane | Nafion PFSA N117 | 0.25 | 10−3 | 183 × 10−4 |
Table 4.
Analysis of the obtained results according to the scenarios.
| Scenario | Cell Voltage Range ΔV [V] | Minimum/Maximum Temperature Range [°C] |
|---|---|---|
| SC 1 | 0.04 | 23/30 |
| SC 2 | 1.56 | 24/28 |
| SC 3 | 0.52 | 17/28 |
| SC 4 | 1.91 | 23/29 |
| SC 5 | 0.60 | 18/34 |
| SC 6 | 2.05 | 24/35 |
| SC 7 | 0.67 | 23/29 |
| SC 8 | 0.28 | 25/29 |
| SC 9 | 0.70 | 25/37 |
| SC 10 | 0.49 | 29/37 |
| SC 11 | 0.38 | 30/39 |
| SC 12 | 0.11 | 32/37 |
Publisher’s Note: MDPI stays neutral with regard to jurisdictional claims in published maps and institutional affiliations. |
© 2022 by the authors. Licensee MDPI, Basel, Switzerland. This article is an open access article distributed under the terms and conditions of the Creative Commons Attribution (CC BY) license (https://creativecommons.org/licenses/by/4.0/).
Share and Cite
MDPI and ACS Style
Mustapha, F.; Guilbert, D.; El-Ganaoui, M. Investigation of Electrical and Thermal Performance of a Commercial PEM Electrolyzer under Dynamic Solicitations. Clean Technol. 2022, 4, 931-941. https://doi.org/10.3390/cleantechnol4040057
AMA Style
Mustapha F, Guilbert D, El-Ganaoui M. Investigation of Electrical and Thermal Performance of a Commercial PEM Electrolyzer under Dynamic Solicitations. Clean Technologies. 2022; 4(4):931-941. https://doi.org/10.3390/cleantechnol4040057
Chicago/Turabian StyleMustapha, Feriel, Damien Guilbert, and Mohammed El-Ganaoui. 2022. "Investigation of Electrical and Thermal Performance of a Commercial PEM Electrolyzer under Dynamic Solicitations" Clean Technologies 4, no. 4: 931-941. https://doi.org/10.3390/cleantechnol4040057