Article

Optimal Operation of Solar Powered Electric Vehicle Parking Lots Considering Different Photovoltaic Technologies

by
Mahsa Z. Farahmand
1,
Sara Javadi
2,
Sayyed Muhammad Bagher Sadati
3,
Hannu Laaksonen
2 and
Miadreza Shafie-khah
2,*
1
Department of Electrical Engineering, K. N. Toosi University of Technology, Tehran 19697-64499, Iran
2
School of Technology and Innovations, University of Vaasa, FI-65200 Vaasa, Finland
3
National Iranian Oil Company (NIOC), Iranian Central Oil Fields Company (ICOFC), West Oil and Gas Production Company (WOGPC), Kermanshah 67146-77745, Iran
*
Author to whom correspondence should be addressed.
Clean Technol. 2021, 3(2), 503-518; https://doi.org/10.3390/cleantechnol3020030
Submission received: 26 March 2021 / Revised: 14 May 2021 / Accepted: 1 June 2021 / Published: 16 June 2021
(This article belongs to the Special Issue Integration and Control of Distributed Renewable Energy Resources)

Abstract

:
The performance of electric vehicles and their abilities to reduce fossil fuel consumption and air pollution on one hand and the use of photovoltaic (PV) panels in energy production, on the other hand, has encouraged parking lot operators (PLO) to participate in the energy market to gain more profit. However, there are several challenges such as different technologies of photovoltaic panels that make the problem complex in terms of installation cost, efficiency, available output power and dependency on environmental temperature. Therefore, the aim of this study is to maximize the PLO’s operational profit under the time of use energy pricing scheme by investigating the effects of different PV panel technologies on energy production and finding the best strategy for optimal operation of PVs and electric vehicle (EV) parking lots which is achieved by means of market and EV owners’ interaction. For the accurate investigation, four different PV panel technologies are considered in different seasons, with significant differences in daylight times, in Helsinki, Finland.

Graphical Abstract

1. Introduction

In the last few years using renewable energy resources and the new generation of transportation systems has increased enormously due to the issues like lack of fossil fuel resources, carbon emission and environmental issues in a way that their role in the future of power systems is very important and undeniable. Thus progression pace and finding potentials in resources are crucial points for the energy issue. Among all other renewable resources, solar energy is the most plentiful resource on the planet earth and there is a high possibility to utilize its sources by means of photovoltaic panels. On the other hand, the arrival of electric vehicles in the transportation system has made the market of this product very competitive due to the many environmental advantages they have and their role in transportation in the near future. However, using these sources all together brings forth the necessity of facing challenges like stability and reliability of the grid, which requires fundamental preparations such as control managements, cooperation agencies, etc. On the other hand, using PV and EV simultaneously can be very useful and beneficial for the grid in the field of energy supplement and economic opportunities and this exploitation can be taken into action through electric vehicles parking lots. Since electric vehicles are mostly parked in the parking lots during the day, employing rooftop photovoltaic for the parking lots makes great sense. However, there are several challenges such as different technologies of photovoltaic panels that make the problem complex in terms of installation cost, efficiency, available output power and dependency on environmental temperature.
Since changing weather conditions can affect the output current and voltage, the response of the PV system to these changes needs to be characterized [1,2]. In order to estimate the amount of energy a solar panel can generate in a lifetime, weather data and solar irradiation information are utilized. Most solar panels do not operate in an ideal condition, because the weather is always changing. By knowing the reaction of solar panels to different weather conditions, it is possible to improve their efficiency in non-optimal conditions [3]. In some situations, for example, in hot climates, a cooling system is needed to keep the panels in certain temperatures. In addition to the temperature situation, the PV panel material is also important to predict the output power, because the efficiency of different materials has different levels of dependency on temperature. The temperature coefficient describes the material temperature dependency [4].
Due to the fact that EV parking lots are magnificently useful for EVs, they can be combined with PV as a source of independent energy supply that can eventually decrease environmental damage such as greenhouse gas emission and even bring more benefit to suppliers and consumers. Besides, this breeds a condition in which there are financial and technical advantages in EV parked time and also makes it easier to interact with the supply and demand market.
According to the mentioned points, the goal of this study is to maximize the benefit for the parking lot operators by finding the best strategy for the optimal operation of PVs and EV parking lots which is achieved by means of market and EV owner interaction, considering the fact that the distribution network, uncertain behavior of different PV technologies and EV owners can have an impact on the behavior of PEV parking lots.

1.1. Literature Review

EVs reaching the number of 5 million in 2018 is a clear fact indicating that the future of the automobile industry belongs to EVs. It is also expected that this number will reach 250 million by 2030. According to the EV 30@30 scenario, 44 million EVs will be sold each year [5]. The enormous growth in EV production logically brings forth the need of building charging stations (CS) and parking lots (PLs). According to [5], as of 2018, 5.2 million charging stations are available and almost all of them (about 90%) are private.
Seeking the highest economic efficiency, PL operators (PLO) must try to satisfy EV owners (EVO) through some strategies. EVs parked time is the key to the goal, and it brings the opportunity for EVOs to cooperate with parking lot operators to sell their EV’s discharging power to distribution network operators or even other parking lot operators. To satisfy EVO’s, parking lot operators should dedicate a reasonable percentage of the benefit to them by means of a written contract so that they are motivated to sell even more of this discharging energy to parking lot operators. This however brings out the necessity of a smart energy management system (EMS) in the PL so that maximum profit is gained by an optimized charge/discharge program. Additionally, using renewable energy resources is a way to increase profit. According to distribution system operator’s (DSO) tariff, some of the studies on EV charge/discharge programs in solar-powered and non-solar-powered EVPL’s will be reviewed accordingly.
In Ref. [6], a mathematical model for estimating the electricity capacity of a PV parking lot is described, and new formulas are proposed to investigate the effect of batteries and inverters on the power demand during battery charging and discharging. The results show that the use of PV panels in the parking lot can reduce the load of the distribution grid by reducing the effective load during peak charging.
In Ref. [7], to reach the highest profit for an EVPL using solar panels and distributed generators a self-scheduling model considering spinning reserve is investigated. Ref. [8] works on large-scale wind integration and operational flexibility of parking lots by introducing a two-stage stochastic model. Due to the lack of enough flexible resources, a lot of wind energy is wasted. The use of parking lots, not only reduces the cost of operation but also using the potential flexibility and participating in the energy and reserve markets can reduce wind spillage. Ref. [9] tries to reduce EV charging costs to the lowest level by producing a Convexfiel model (the model is obtained from the conventional model by using convex relaxation techniques) in which EVs uncertainty and V2G ability are considered. In Ref. [10], to reduce the daily cost in an EVPL that uses solar energy to the lowest level, for EV charging, mixed-integer linear programming (MILP) is proposed.
Ref. [11] worked on the potential of solar energy for charging EVs and reducing the payback time. Hence, a Genetic algorithm is used to increase the production of solar energy, energy storage and smart charging is utilized to investigate different charging methods. By applying the proposed model, the payback time is reduced from 14 years to 7 years. Ref. [12] is about EVPL operational scheduling in the energy and reserve market. In this study, a bi-level model is estimated in which the upper level’s goal is to bring down the operation cost to the lowest amount and the lower level’s goal is to lessen PL cost. Ref. [13] considers maximizing parking lot operators’ profit by controlling EV charging and offers a dynamic charging program in order to achieve the goal.
Ref. [14] worked on a solar-powered charging station using a fixed battery, providing an algorithm consisting of four stages to minimize operation cost on EV charge/discharge by most optimization and customer satisfaction. In [15], as in [16], a multi-objective model is proposed with the aim of EVPL cost minimization considering climate effects. This model shows that an appropriate charge/discharge program for EVs can result in less total emission and operation costs. In Ref. [17] the goal is to decrease electricity tariff through optimized EV power charge/discharge in a solar electric vehicle parking lot (EVPL) (in an EVPL using SE). In [18], an EV charge model based on EVO satisfaction, cost minimization in an integrated EVPL using solar energy and an energy storage system is proposed.
In Ref. [19], considering environmental and economic targets, a model giving a schedule for EV charge/discharge is proposed with two main objects consisting of emission reduction and cost operation minimization. In Ref. [20] an energy management strategy is suggested for a solar energy EVPL to analyze its effects on loss reduction and power consumption of distribution network. In Ref. [21], regarding the reduction of charging costs optimized with a photovoltaic system in an EVPL, two-stage stochastic mixed-integer linear programming (MILP) is proposed. A stochastic optimized energy management program considering both parking lots’ operators and EVO’s benefits is offered in Ref. [22]. In order to lower the cost for various grid purposes and regarding EV’s uncertainty, an optimized program for EVs is designed in Ref. [23]. In Ref. [24] two cases are studied. The first one refers to a risk-based model that analyzes the efficiency of EVPLs using hydrogen storage systems, solar energy, etc. The second is dedicated to the charge/discharge program for EVs in risk-averse and risk-neutral performance. Ref. [25] refers to charge/discharge energy trading with DSO and also cooperation between parking lot operators and EVOs to offer a program to EV aggregators considering the highest benefit for both sides.
Ref. [26] studied the relationship between the amount of output energy and variation of temperature. In order to show the influence of temperature on photovoltaic systems, two models were used. Model A ignored temperature and Model B considered it. These two models were carried out for 236 cities in America. In the Northeast and the Midwest regions, Model B power outputs were higher in comparison with Model A (16–20%), from November to February, whereas there was a reduction from May to August (−4%). Instead, in the South and Southwest of America, power outputs reduced significantly from May to August (−12–15%), whereas there was a slight increase from December to February (5%). In Ref. [7], the effect of temperature on the performance of different photovoltaic technologies was evaluated in Amman, Jordan. Three photovoltaic systems (Poly-crystalline, Mono-crystalline and Thin-film) with the same design parameters were chosen. It was shown that the temperature has less effect on the thin-film solar cells. Ref. [27] evaluated the temperature coefficient for some different types of commercially accessible solar panels. The tests were done at the PV test facility of the Solar Energy Centre, New Delhi, India. The panels were chosen randomly from different manufactures. The study showed that the temperature coefficient for the monocrystalline silicon module is higher than the other types.

1.2. Contributions

According to the literature, several studies have been conducted on energy exchange between PL and DS and the performance of different PV technologies has been studied separately in which the effect of different PV technologies and their performance on the possibility of energy exchange and profit of the parking lot operators are not taken into account.
The goal of this study is to maximize the benefit to parking lot operators in the energy market between DSO and EVOs in the rooftop PV parking lot with different PV technologies. To meet this goal, different scenarios are considered in detail to evaluate and analyze operations under various circumstances. Also, the model considers all the impacts of the behavior of different PV technologies.
To the best of the authors’ knowledge, the impact of the PV technologies on the optimal operation of rooftop PV parking lots has not been reported in the literature, which is the main contribution of the paper. In order to investigate the impact of PV technologies and their level of sensitivity to temperature and solar radiation, different PV technologies such as Monocrystalline silicon, Polycrystalline silicon, Amorphous silicon and Cadmium Telluride based solar modules were considered in four different months. Another applicable contribution of the paper is that due to very different daylight times in Finland in different months of a year, there are huge changes on the operation of rooftop PV parking lots.
In Section 2, the mathematical model of a PEV parking lot is formulated. The case study is described in Section 3. In Section 4, the results of the study are analyzed. The conclusion is presented in Section 5.

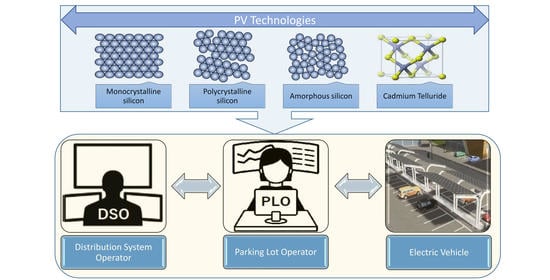
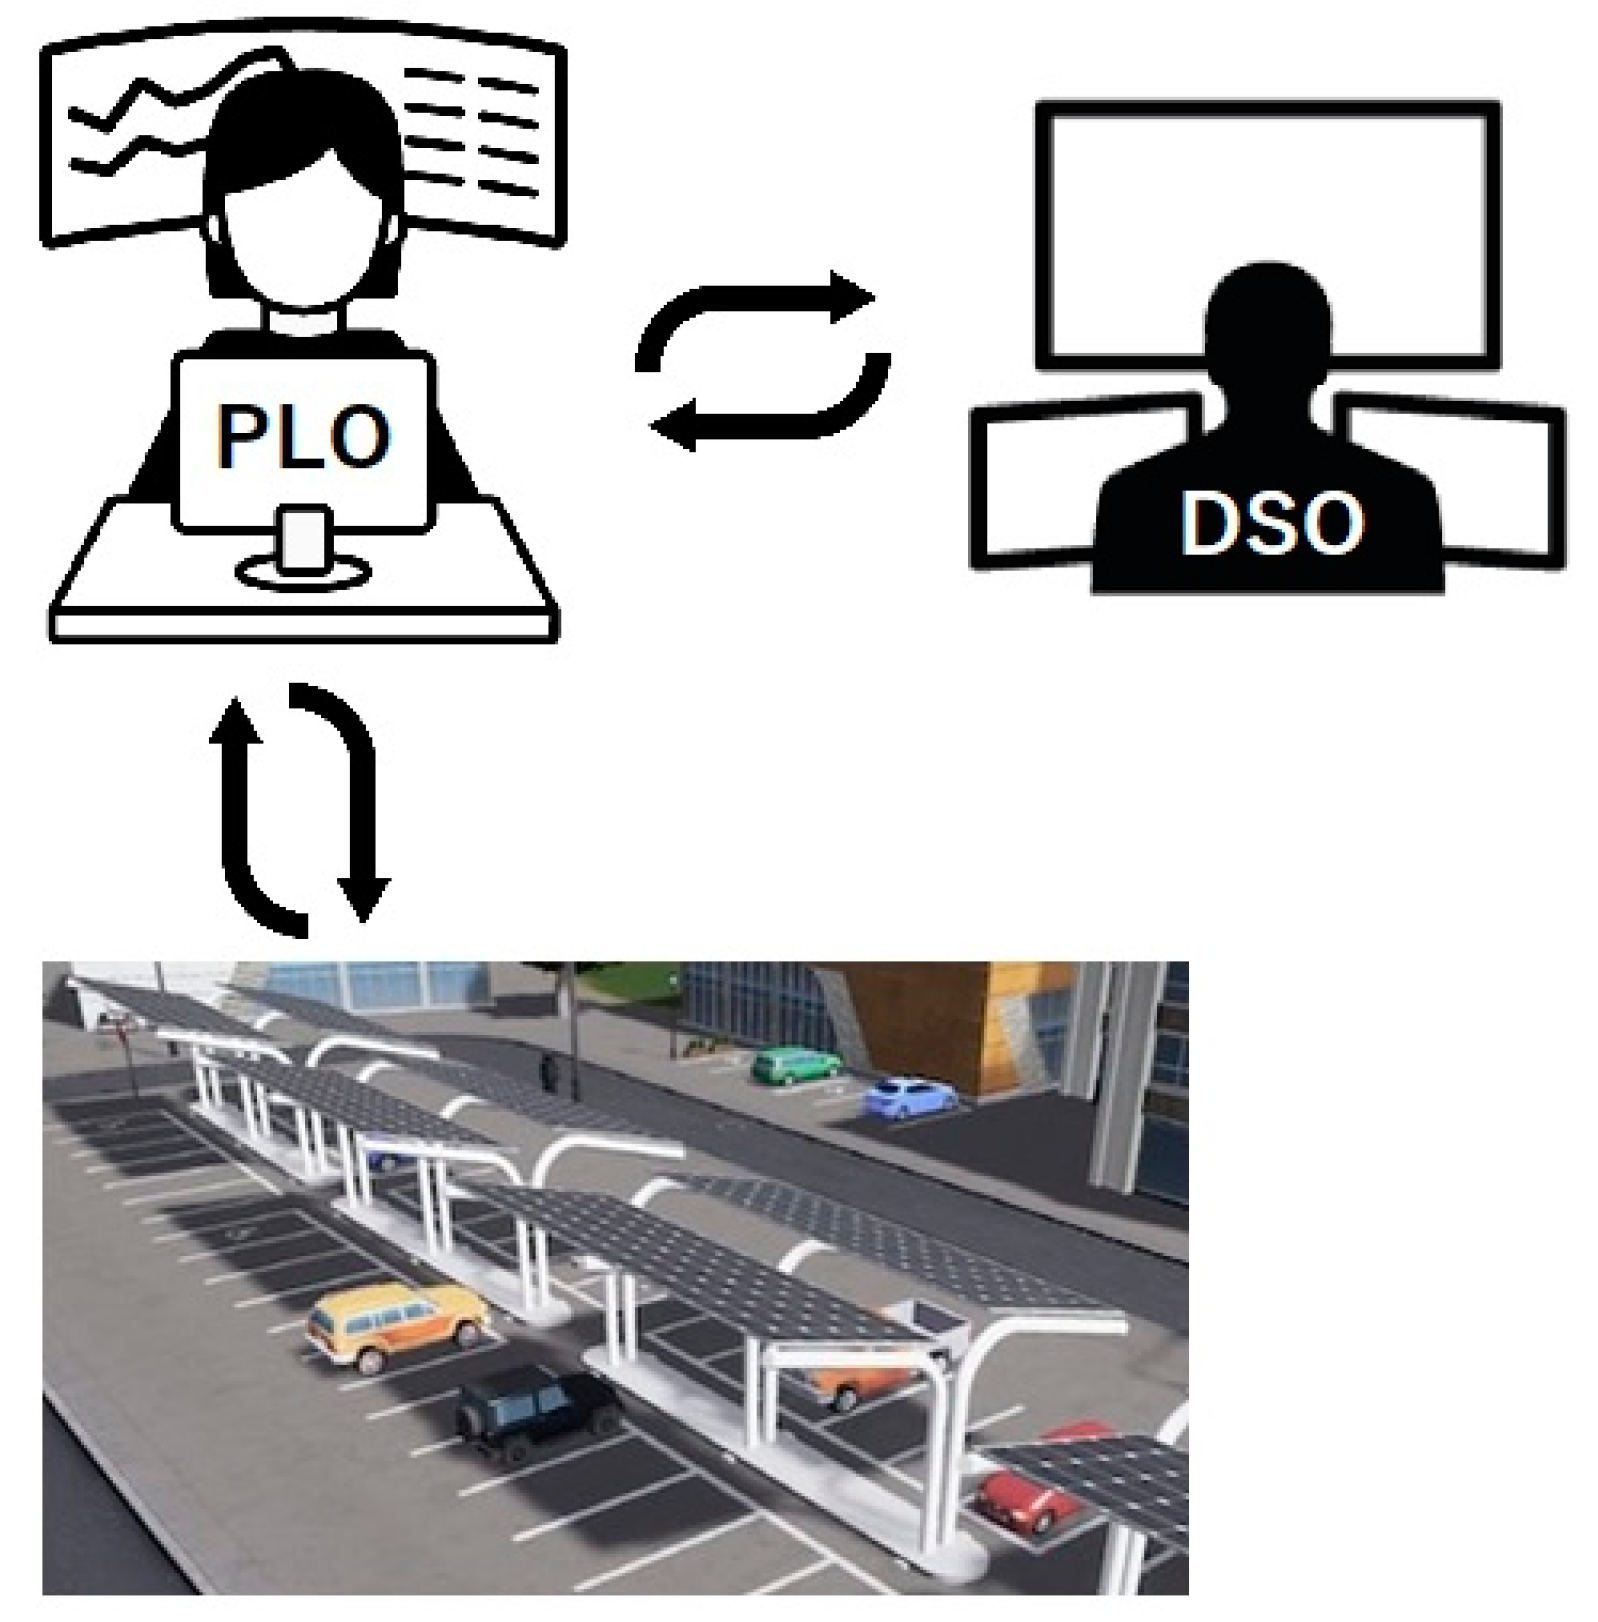
2. Problem Formulation

The objective function of this study is to maximize the profit for parking lot operators by using four different PV technologies including Monocrystalline silicon, Polycrystalline silicon, Amorphous silicon and Cadmium Telluride to evaluate which one is the best. Considering that the uncertain behaviors of solar irradiation and EVO have a direct effect on the profit of the parking lot operators, the influence of these factors was investigated in order to get the optimum result. Hence, by using the Beta function, the uncertainty of solar radiation was modeled and the truncated Gaussian distribution, that is, Normal PDF was applied for the other uncertainties that all the required equations were taken from [23]. Also, the complexity of the calculations caused a reduction in the scenarios. Therefore, in this study, by using a scenario reduction method, similar scenarios were deleted.

2.1. Objective Function

The objective function, presented in (1), represents different income terms that maximize the profit from the parking lot operator’s point of view. These terms show cooperation between the DSO, EVOs and parking lot operators. Therefore, the objective function of parking lot operators includes the revenue such as selling the power generated by PV rooftops to EVOs and DSO and selling EVs discharging energy to DSO. Also, purchasing energy from DSO and depreciation of the battery because of selling energy to DSO are the cost terms of the objective function. To encourage EVOs, some money is given to them for several discharges in one day and they can also receive a portion of the revenue gained from the sale of energy to the DSO. Also, based on the energy price, parking lot operators can sell the power generated by PV to DSO and EVOs.
Profit P L = n h ( ( P n , h c h S o l a r Pr h c h ) + ( P h S o l a r Pr h d c h ) ) Δ h + w ρ w n h ( ( P n , h , w c h G r i d Pr h c h ) + ( ( 1 α ) P n , h , w d c h G r i d Pr h d c h ) ( P n , h , w c h G r i d Pr h G r i d ) ( P n , h , w d c h G r i d C c d ) ) Δ h
In (1), Pch-Solar is Charging power of each EV from solar energy’s output, PSolar is Solar energy’s output of PL to DSO, Pch-Grid is Charging power of each EV from DSO and Pdch-Grid is Discharging power of PL to DSO.

2.2. Constraints

Arrival/departure times of EVs to/from the PL and their duration of presence in PL are presented in (2) to (4).
S O E n , h , w = S O E n , h a r v , w arv ( P n , h , w d c h η d c h ) + ( P n , h , w c h ) η c h : P L , v , h = h a r v , w
S O E n , h , w = S O E n , h - 1 , w ( P n , h , w d c h η d c h ) + ( P n , h , w c h ) η c h : P L , v , h h a r v , w
S O E n , h , w S O E n , h d e p dep : n , h = h d e p , w
It is impossible for a battery to charge and discharge, simultaneously:
X n , h , w c h + X n , h , w d c h   1 ;   n , h , w
According to the rate of charge and discharge of EV batteries, the value of SOE is shown in (6).
S O E n , h , w min S O E n , h , w S O E n , h , w max :   n , h , w  
EVs can purchase their required energy at the mid-peak and off-peak periods from DSO and the rate of charging/discharging is restricted between zero and nominal rate. Also, the EV charging/discharging time is not the same. The mentioned constraints are shown in (7) and (8).
0 P P L , v , h , w c h = P n , h , w c h G r i d + P n , h c h S o l a r X n , h , w c h × R c h , max : n , h , w
0 P n , h , w d c h = P n , h , w d c h G r i d X n , h , w d c h × R d c h , max : n , h , w
Based on (9), the parking lot operator sells energy to DSO after 24-h periods. Equation (10) also guarantees that the amount of EV charging through PV generation and the amount of PV generation sold to the DSO is equal to the output of the PV panel in PL. Each EV’s charging and discharging power is restricted to four times the nominal rate and is shown in (11) and (12).
0 P h S o l a r P s o l a r , h : s o l a r , h
P h S o l a r + n = 1 100 P n , h c h S o l a r = P s o l a r , h : s o l a r , h
h = 1 24 P n , h , w c h G r i d 4 × R c h , max : n , w
h = 1 24 P n , h , w d c h G r i d 4 × R d c h , max : n , w

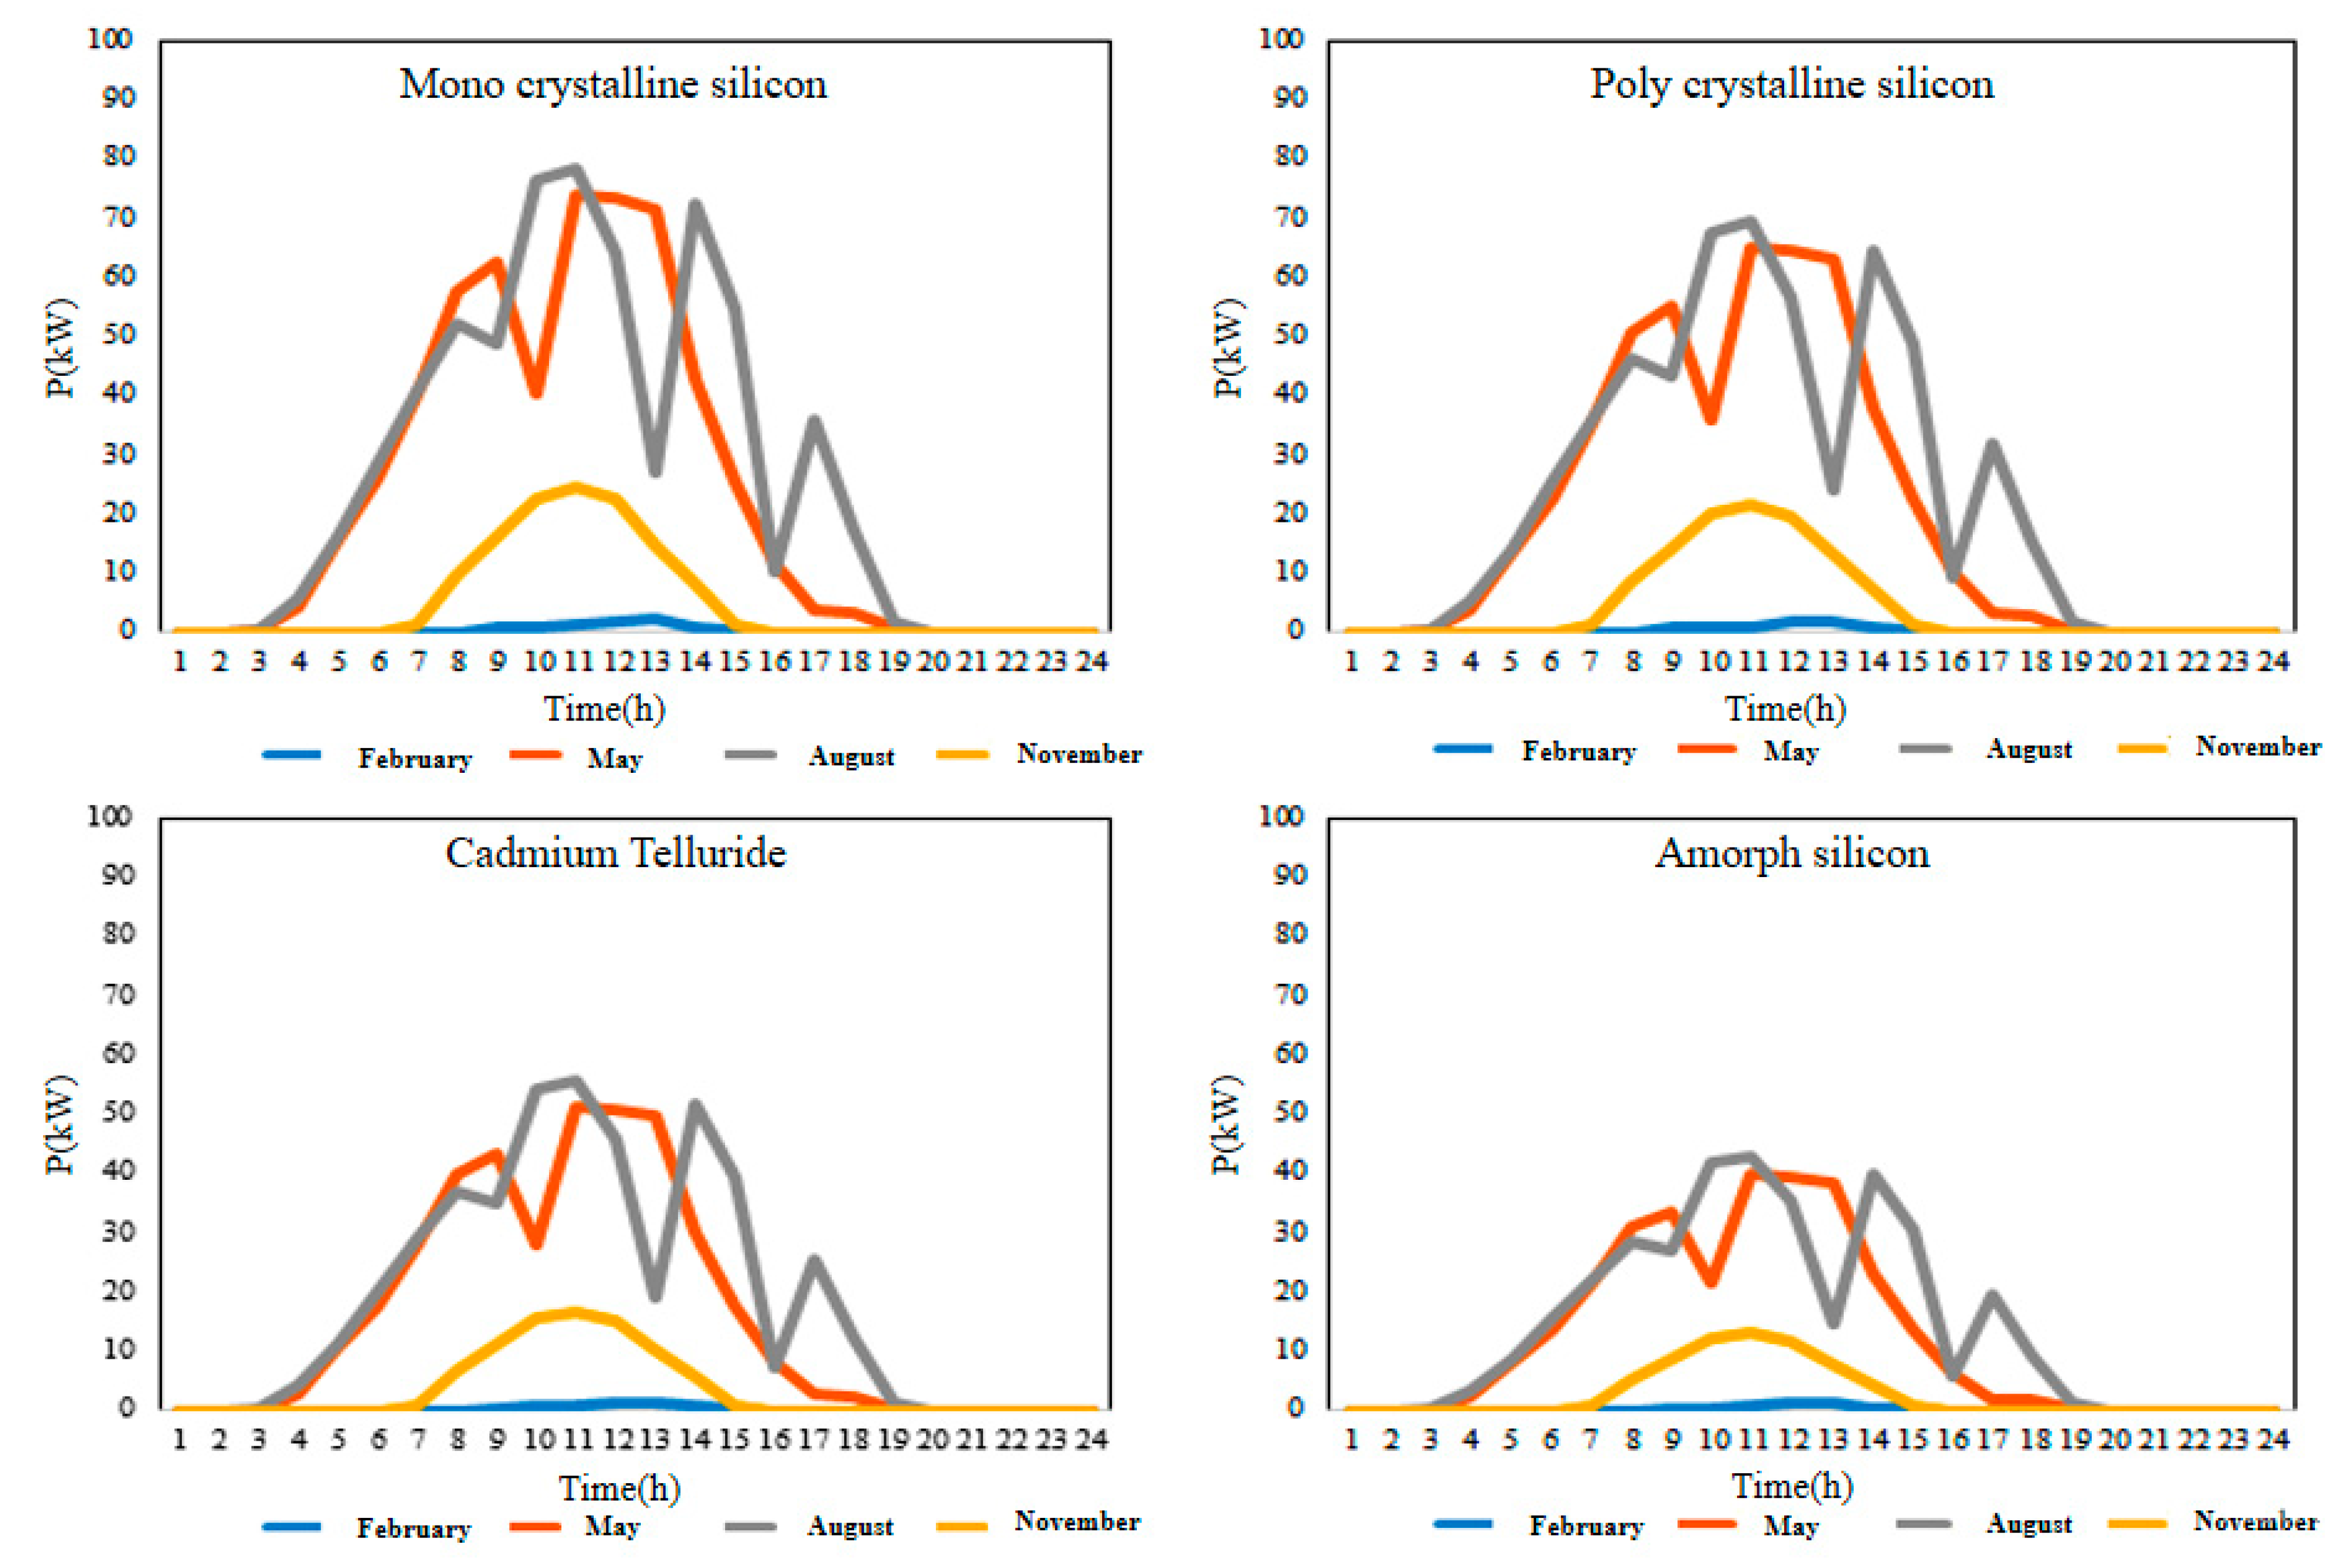
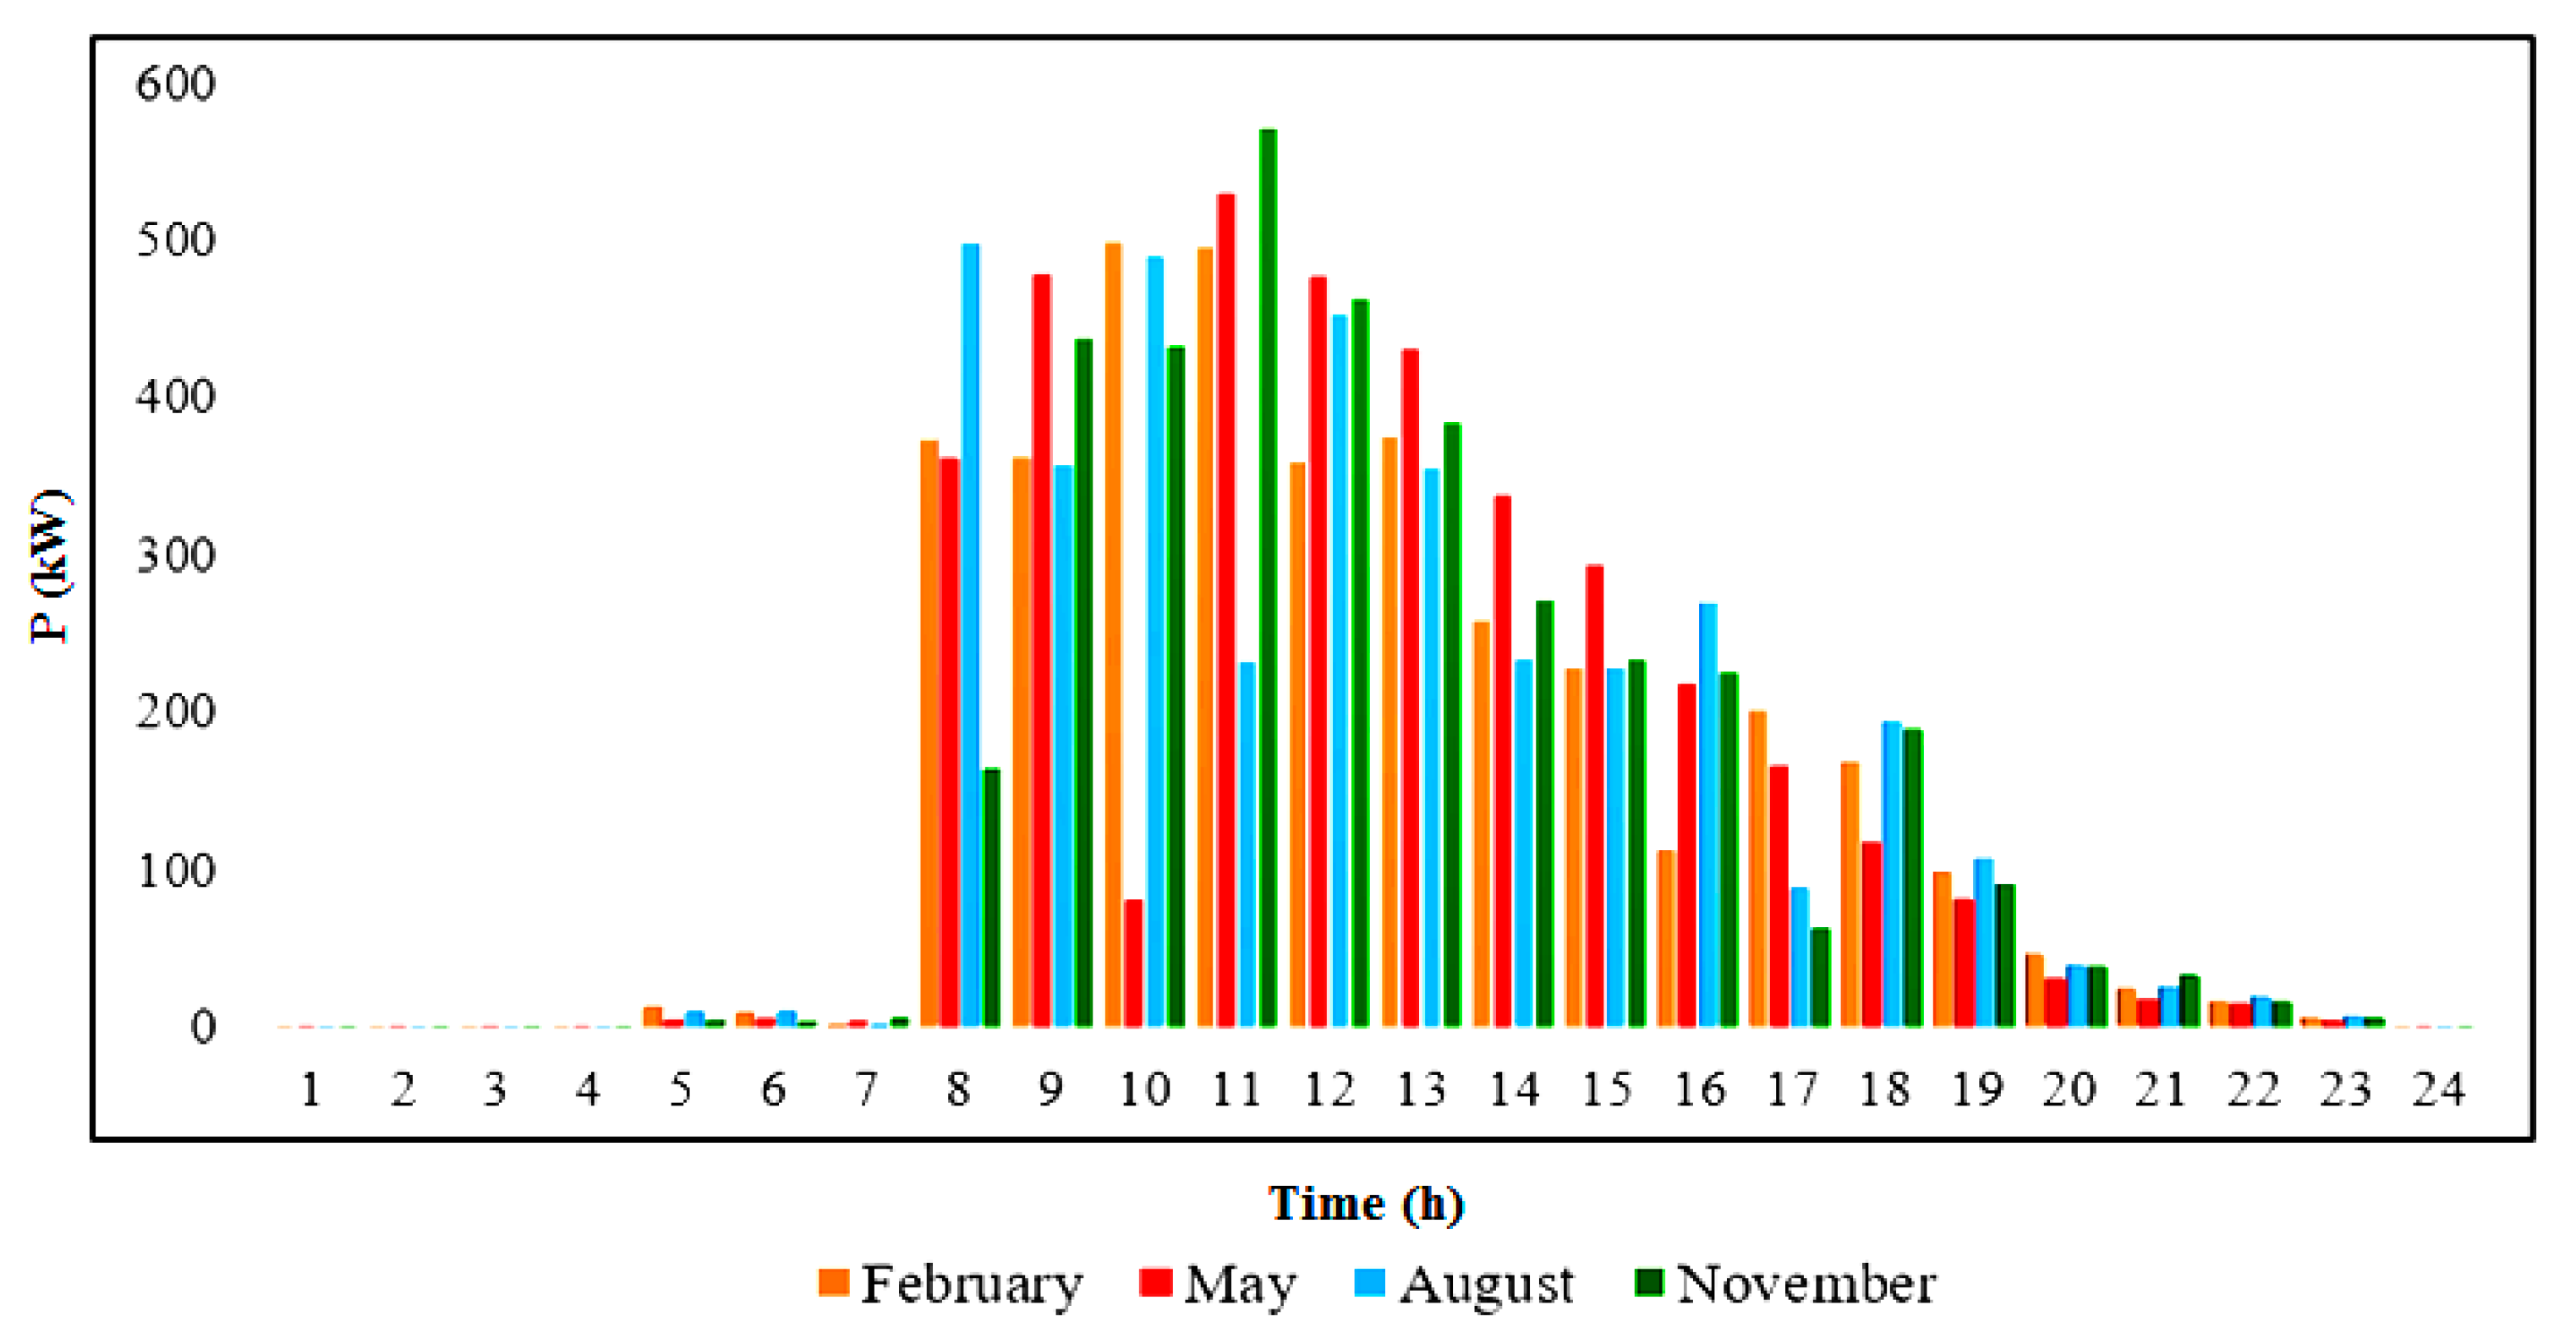
2.3. Equations for PV Generation
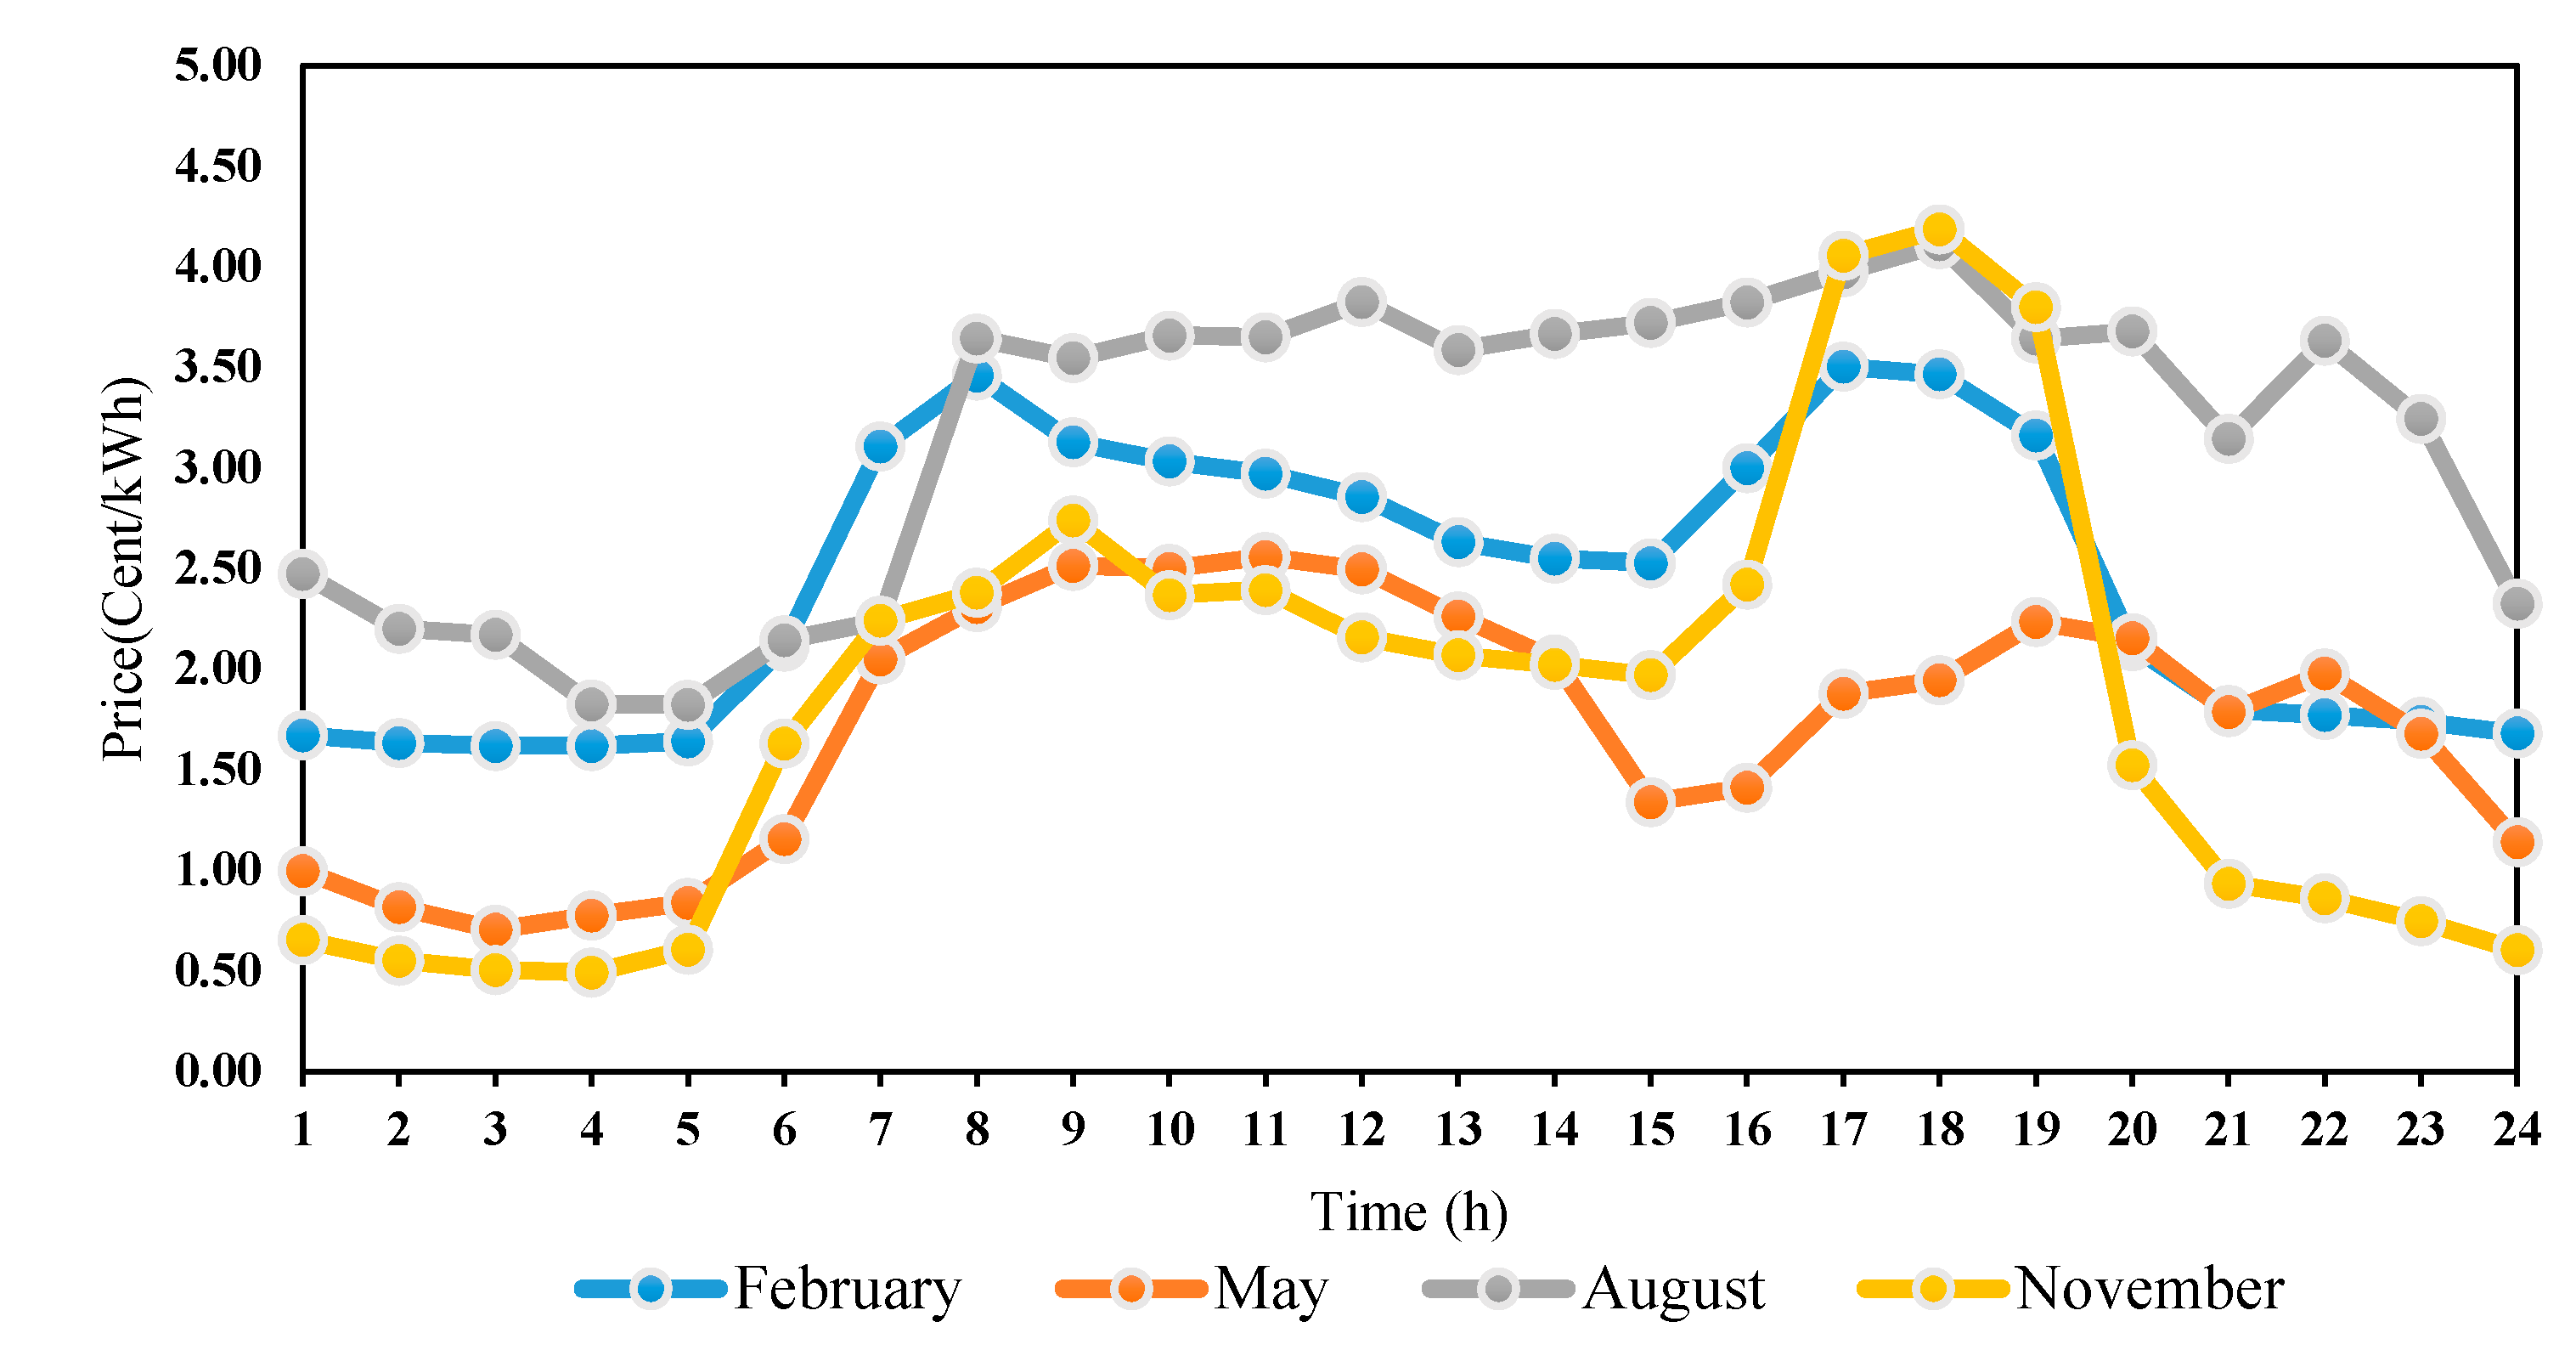
Considering the change of solar radiation and temperature under outdoor conditions, the short-circuit current (ISC) and open-circuit voltage (VOC) of silicon-based solar cells are expressed as follows [28]:
I S C = ( G G S T C ) I S C _ S T C [ 1 + a ( T C T S T C ) ]
V O C = V O C _ S T C [ 1 + β ( G S T C ) ( T C T S T C ) ] [ 1 + δ ( T ) ln ( G G S T C ) ]
where G is the solar radiation of PV solar cell under operating conditions ( W m 2 ); G S T C is the solar radiation under standard test conditions (( W m 2 ) and G S T C = 1000 W m 2 ); T S T C is the temperature under standard conditions ( T S T C = 25 °C); a is the temperature coefficient of short-circuit current, usually provided by the manufacturer; I S C _ S T C is the short-circuit current of solar cell under standard test conditions; V O C _ S T C is the open-circuit voltage of solar cell under the standard test conditions; β is the temperature coefficient of open-circuit voltage; and δ is the correction factor of solar radiation. As a result, as the temperature increases, the open-circuit voltage becomes smaller and the short-circuit current becomes larger, which leads to a decrease in efficiency. The specific relationship can be expressed as follows:
η = η r e f [ 1 β r e f ( T C T S T C ) ] + γ log 10 G
where η r e f is the power generation efficiency of solar cells under standard test conditions; γ is the solar radiation coefficient; and β r e f is the temperature coefficient (K−1) at reference conditions. In engineering applications, the relationship between the output power of PV and the temperature can be described as follows [29]:
P T C = η r e f [ 1 β r e f ( T C T S T C ) ] G A
where, A is the surface area of the PV module.

3. Case Study

In order to evaluate the different PV technologies a PEV parking lot with a capacity of 80 EVs was considered. Figure 1 illustrates the interaction between all three components which result from energy exchange and individual contracts with EVOs. In this evaluation, three different scenarios were studied. Scenario I represents the base case with no PV panels in four different months including February, May, August and November. In scenario II, the PV rooftop (area of panels is approximately 558 m2) with four different PV technologies including Monocrystalline silicon, Polycrystalline silicon, Amorphous silicon and Cadmium Telluride was analyzed in two cold periods (February and November). Similarly, in scenario III, a PV rooftop with four different PV technologies was investigated in two warm periods (May and August).
Since the uncertainties of solar radiation have a direct effect on PV power generation, 10 scenarios were considered for different months and seasons (February, May, August and November). To calculate the output power of PV, the real solar radiation data of Helsinki, Finland was used [30]. Figure 2 shows the expected value of PV generation for each technology in each month.
The main specifications of each technology are represented in Table 1.
It is worth mentioning that the efficiency considered in the calculation for Monocrystalline silicon, Polycrystalline silicon, Amorphous silicon and Cadmium Telluride is 18%, 16%, 10% and 13% respectively. Also, the EVs’ probability distribution and their specification are presented in Table 2 and Table 3 respectively. The rate of charge and discharge of each EV is up to 40 kWh, and they were charged and discharged four times with maximum rates (10 kWh).
The price of energy data was drawn from the Finnish electricity market [32,33]. The price of energy exchange is presented in Table 4. Also, the price of selling energy to DSO is shown in Figure 3.

4. Results and Discussion

4.1. PLO’s Profit without PV Generation

In this scenario, the energy exchange is between DSO and EVOs and each EV makes revenue for the PV parking lot operators by selling energy to DSO. On the other hand, based on the EVO’s contract, each EV can gain benefit from battery depreciation cost and half of the selling energies’ revenue to DSO. Figure 4 shows the required energy for charging EVs every hour of each month. Based on Figure 4, the entrance time of EVs to PL starts at 8:00 approximately. Between 8:00 and 20:00 more EVs enter the PL which increases the energy exchange between PL and DSO.
The charging/discharging energy of all EVs in four months and the profit of the parking lot operator are presented in Table 5. According to Table 5, in August, the energy interaction between the parking lot operator and DSO is more than that in the other months which brings more profit to the parking lot operator.

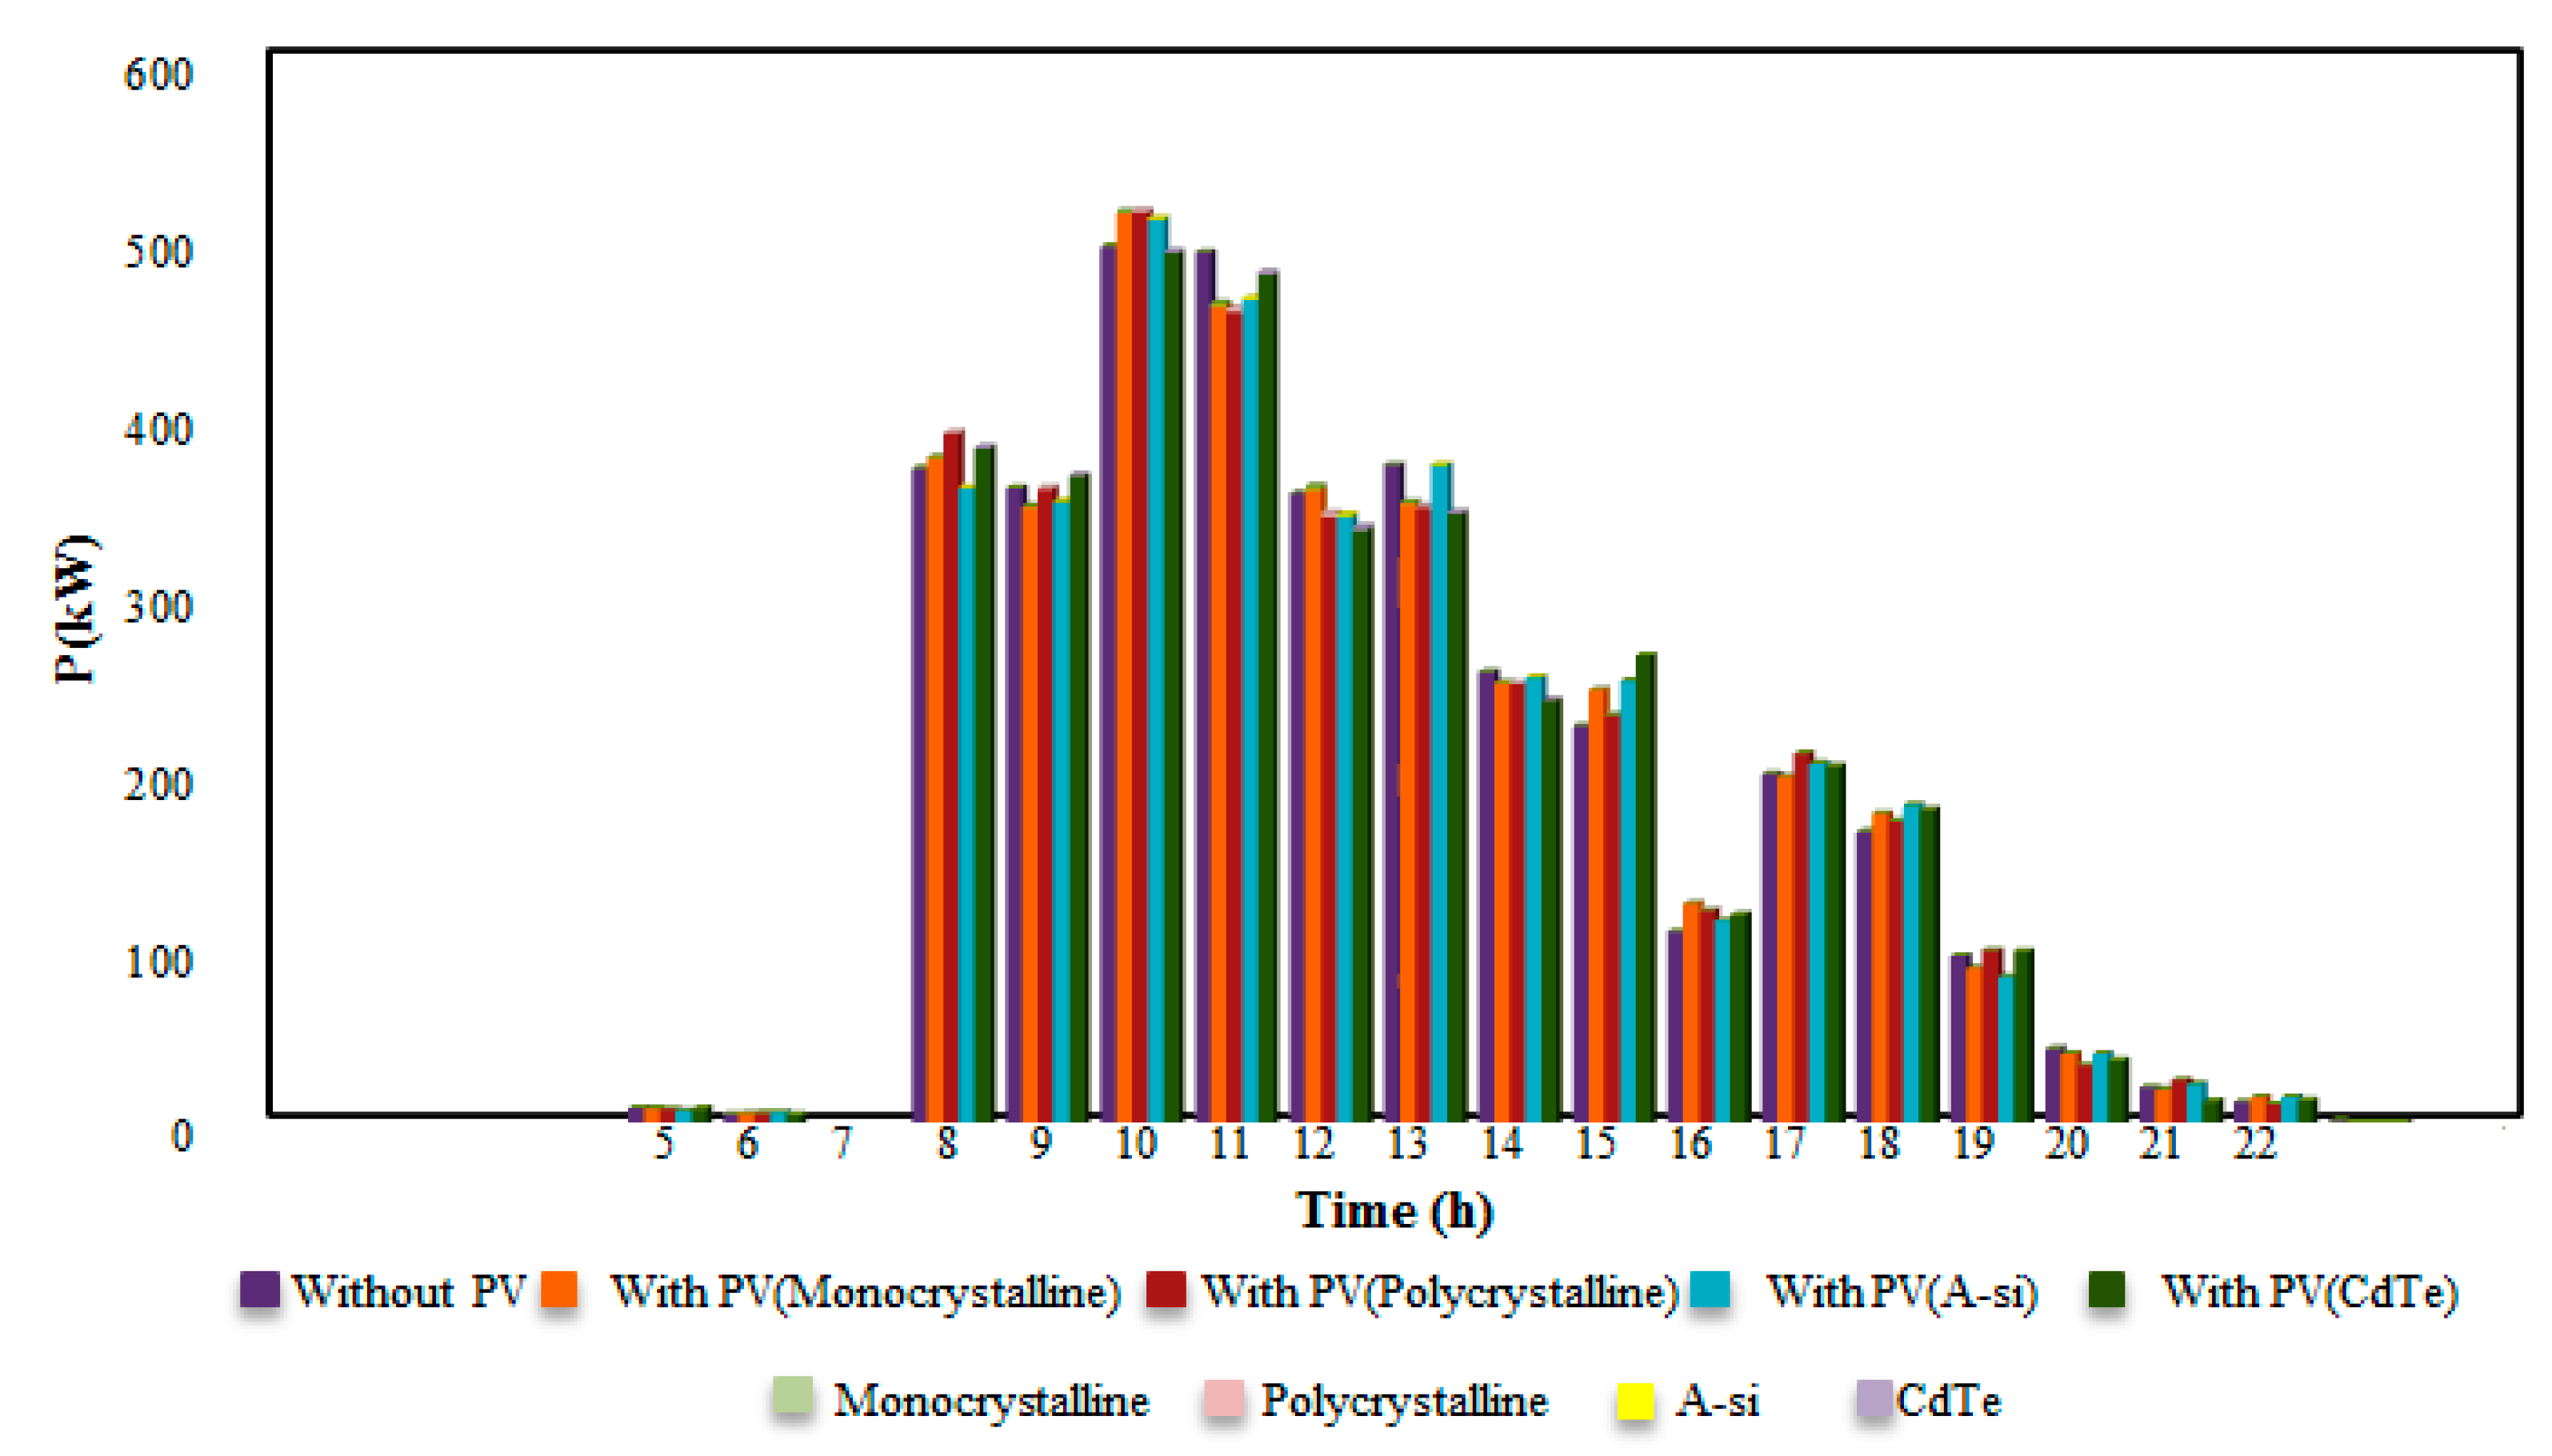
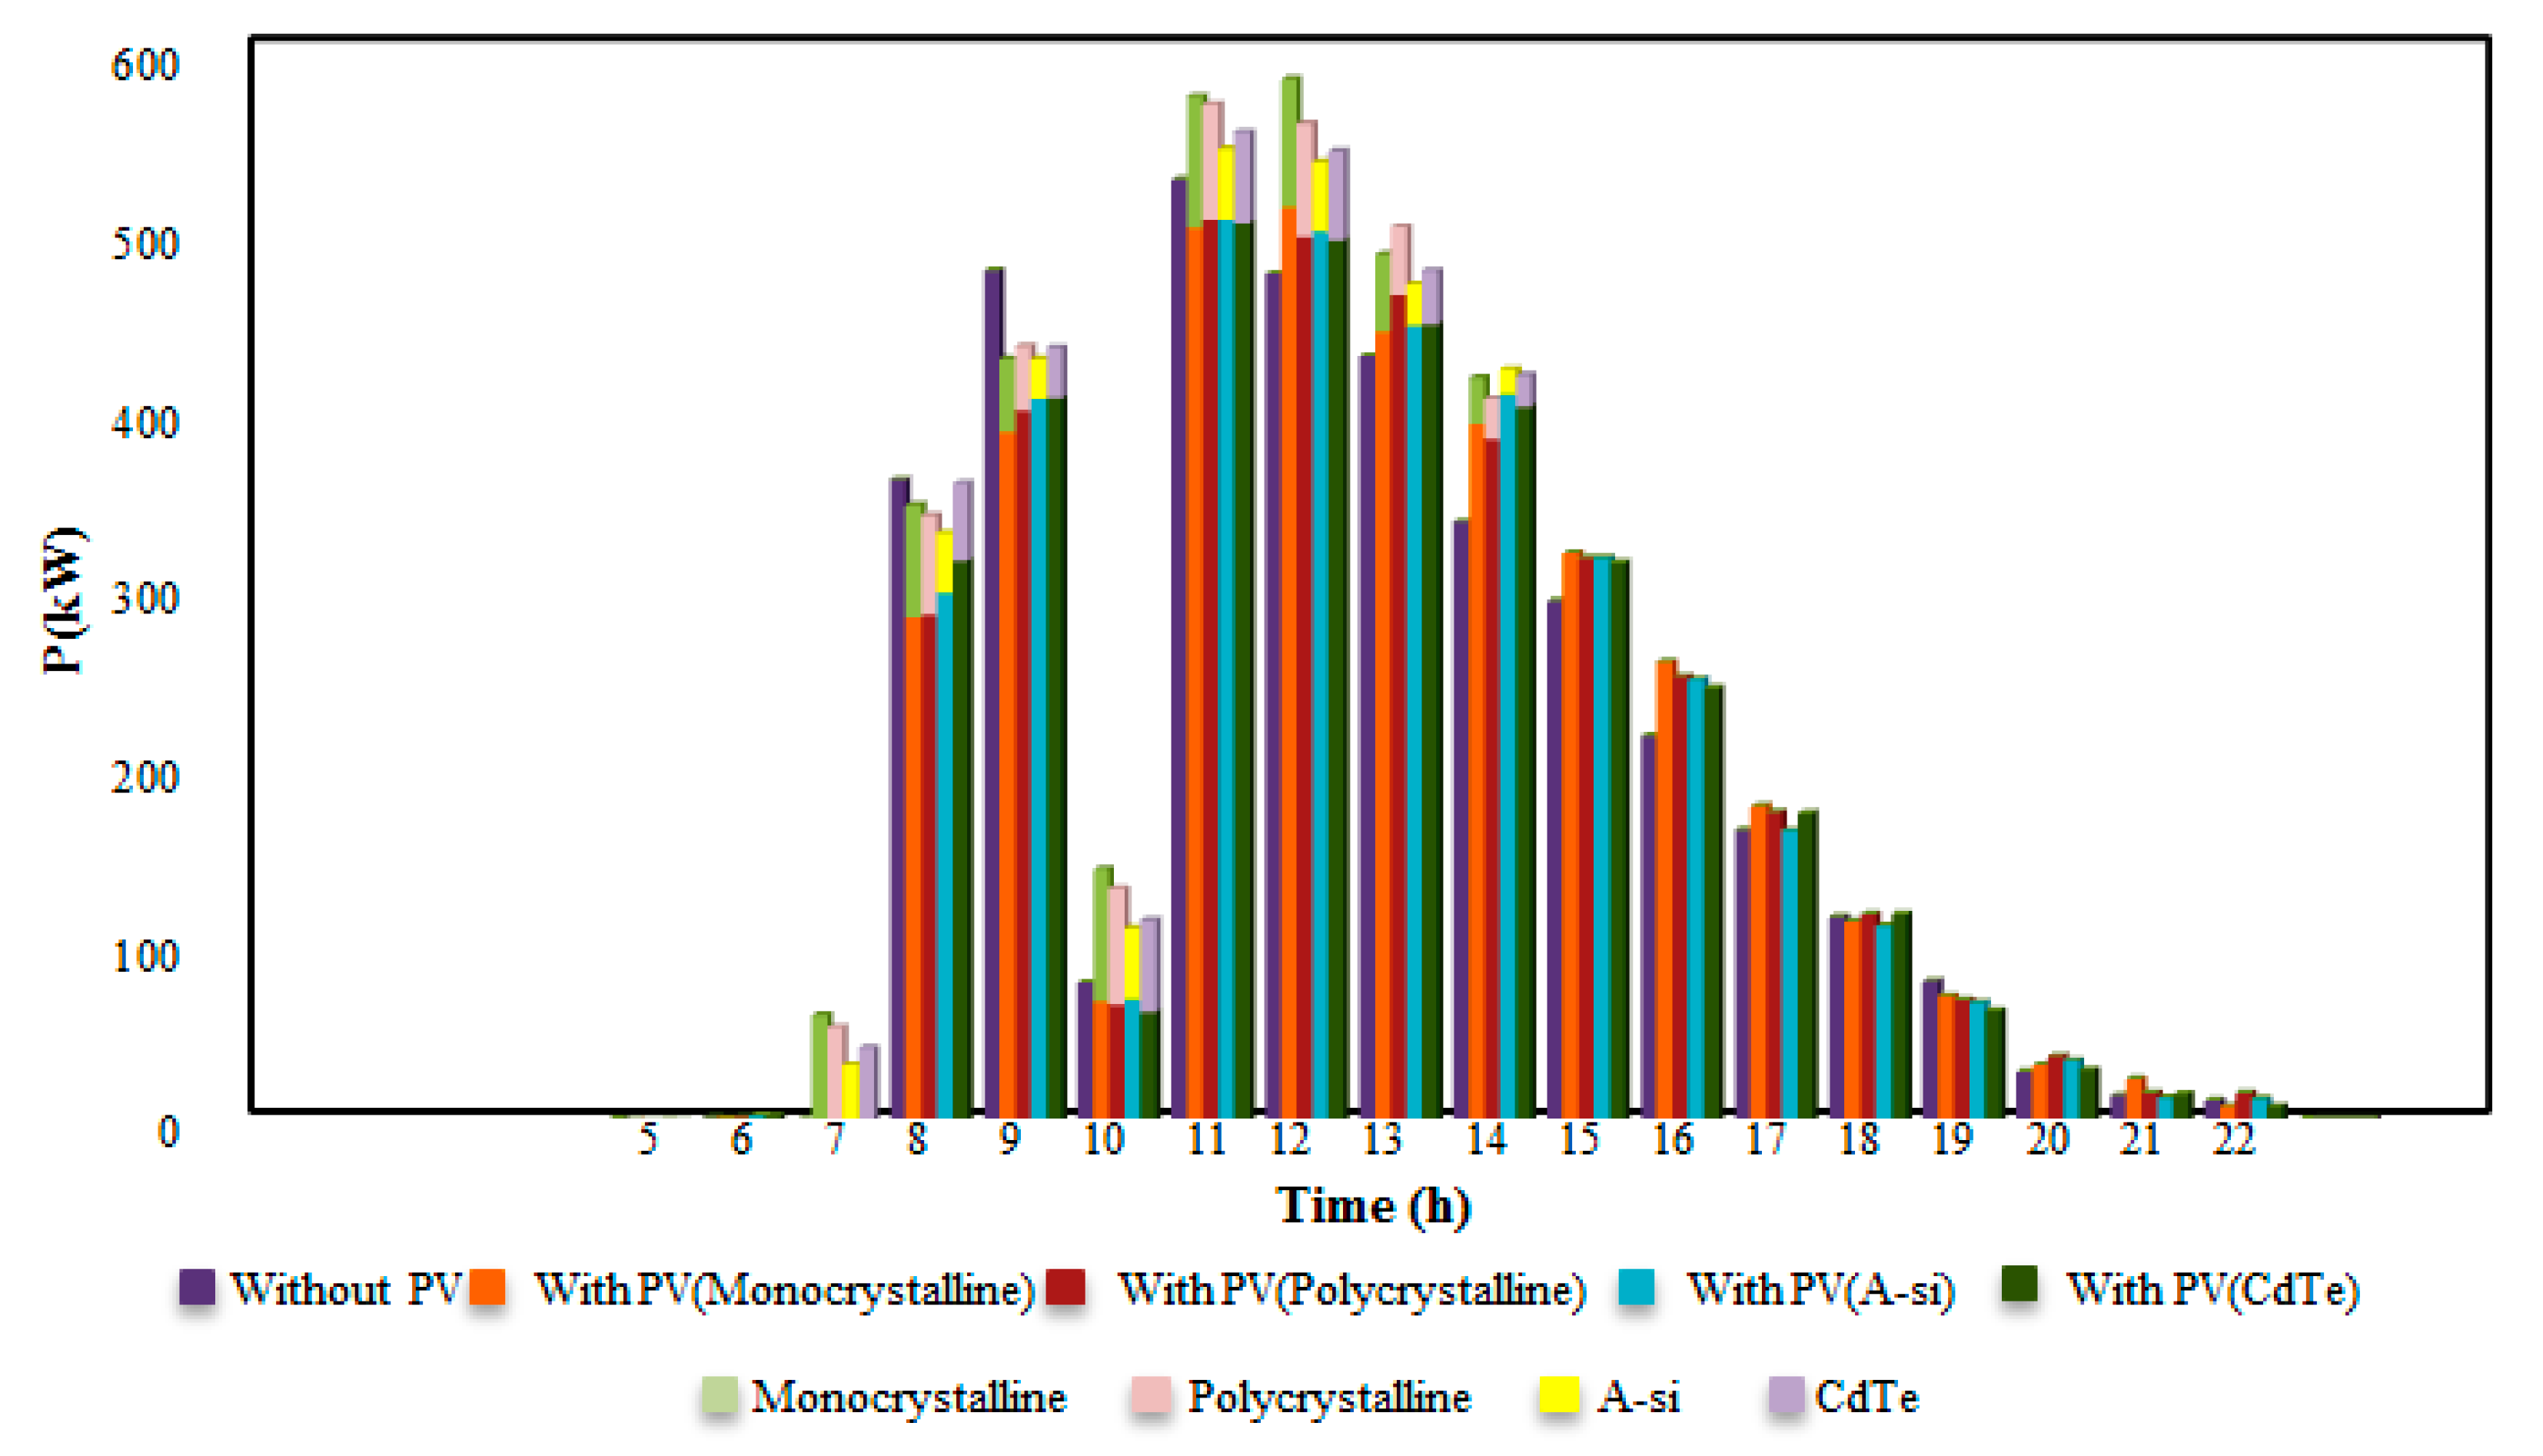
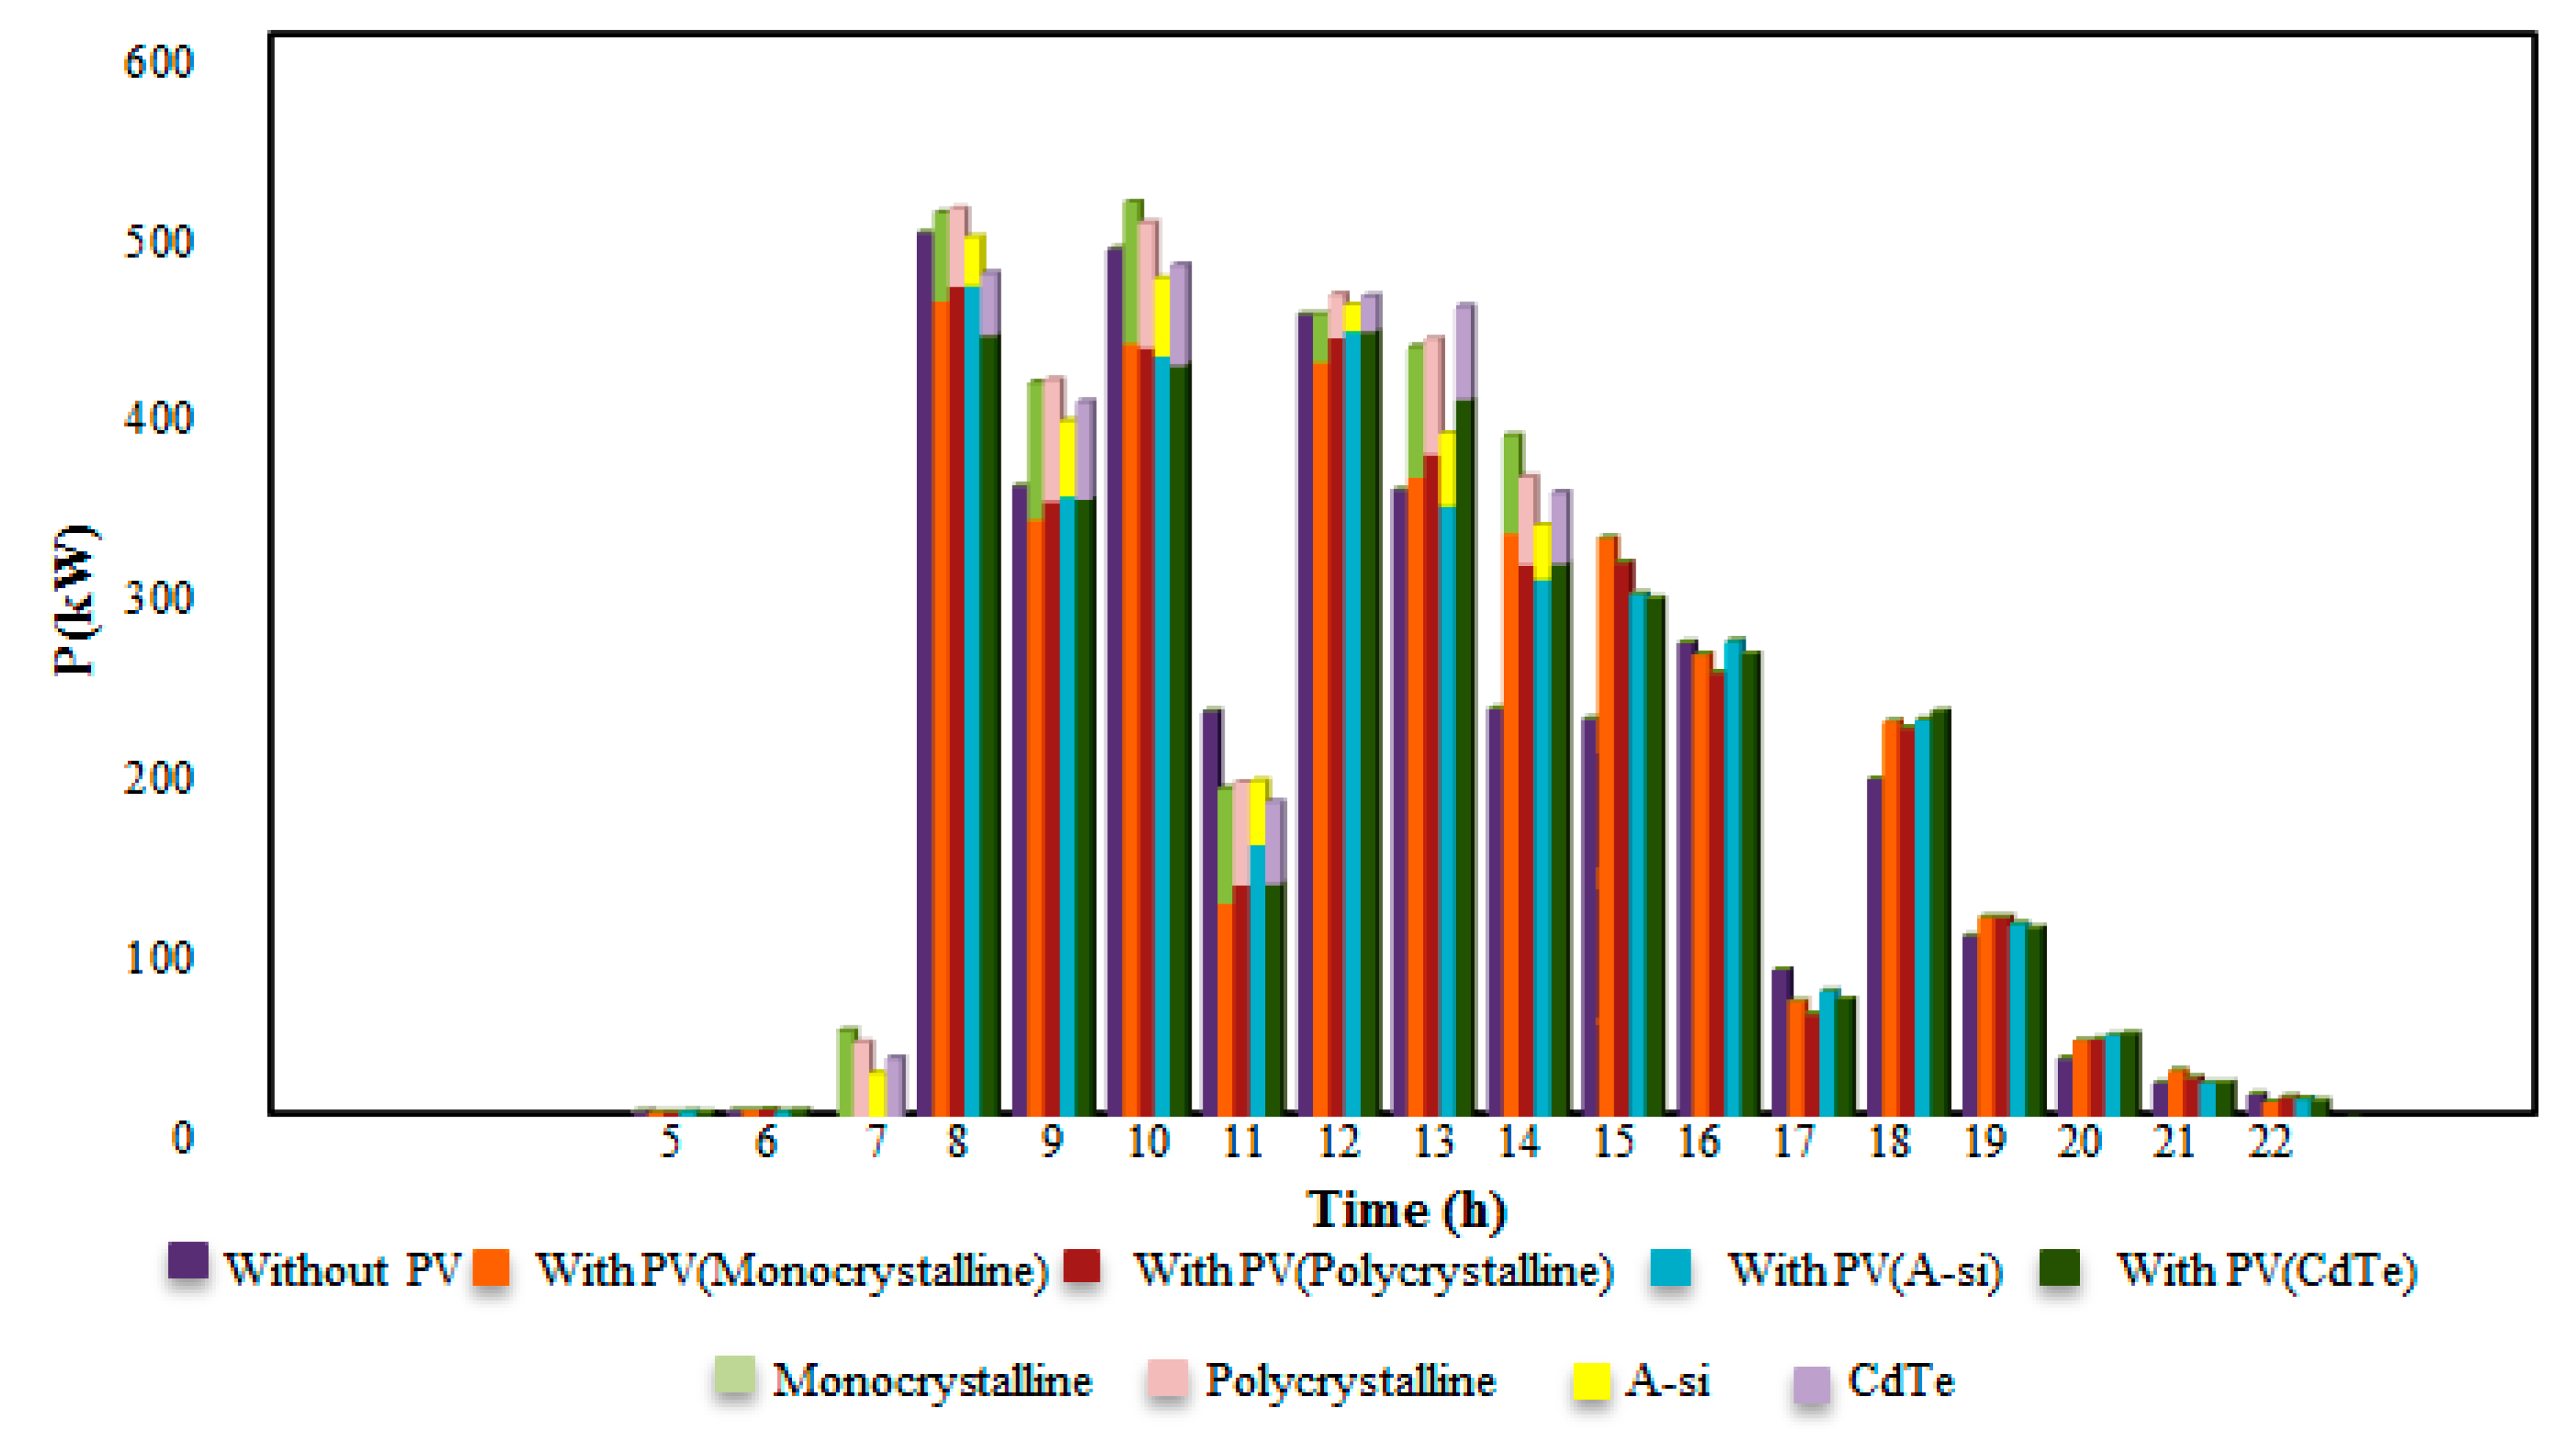
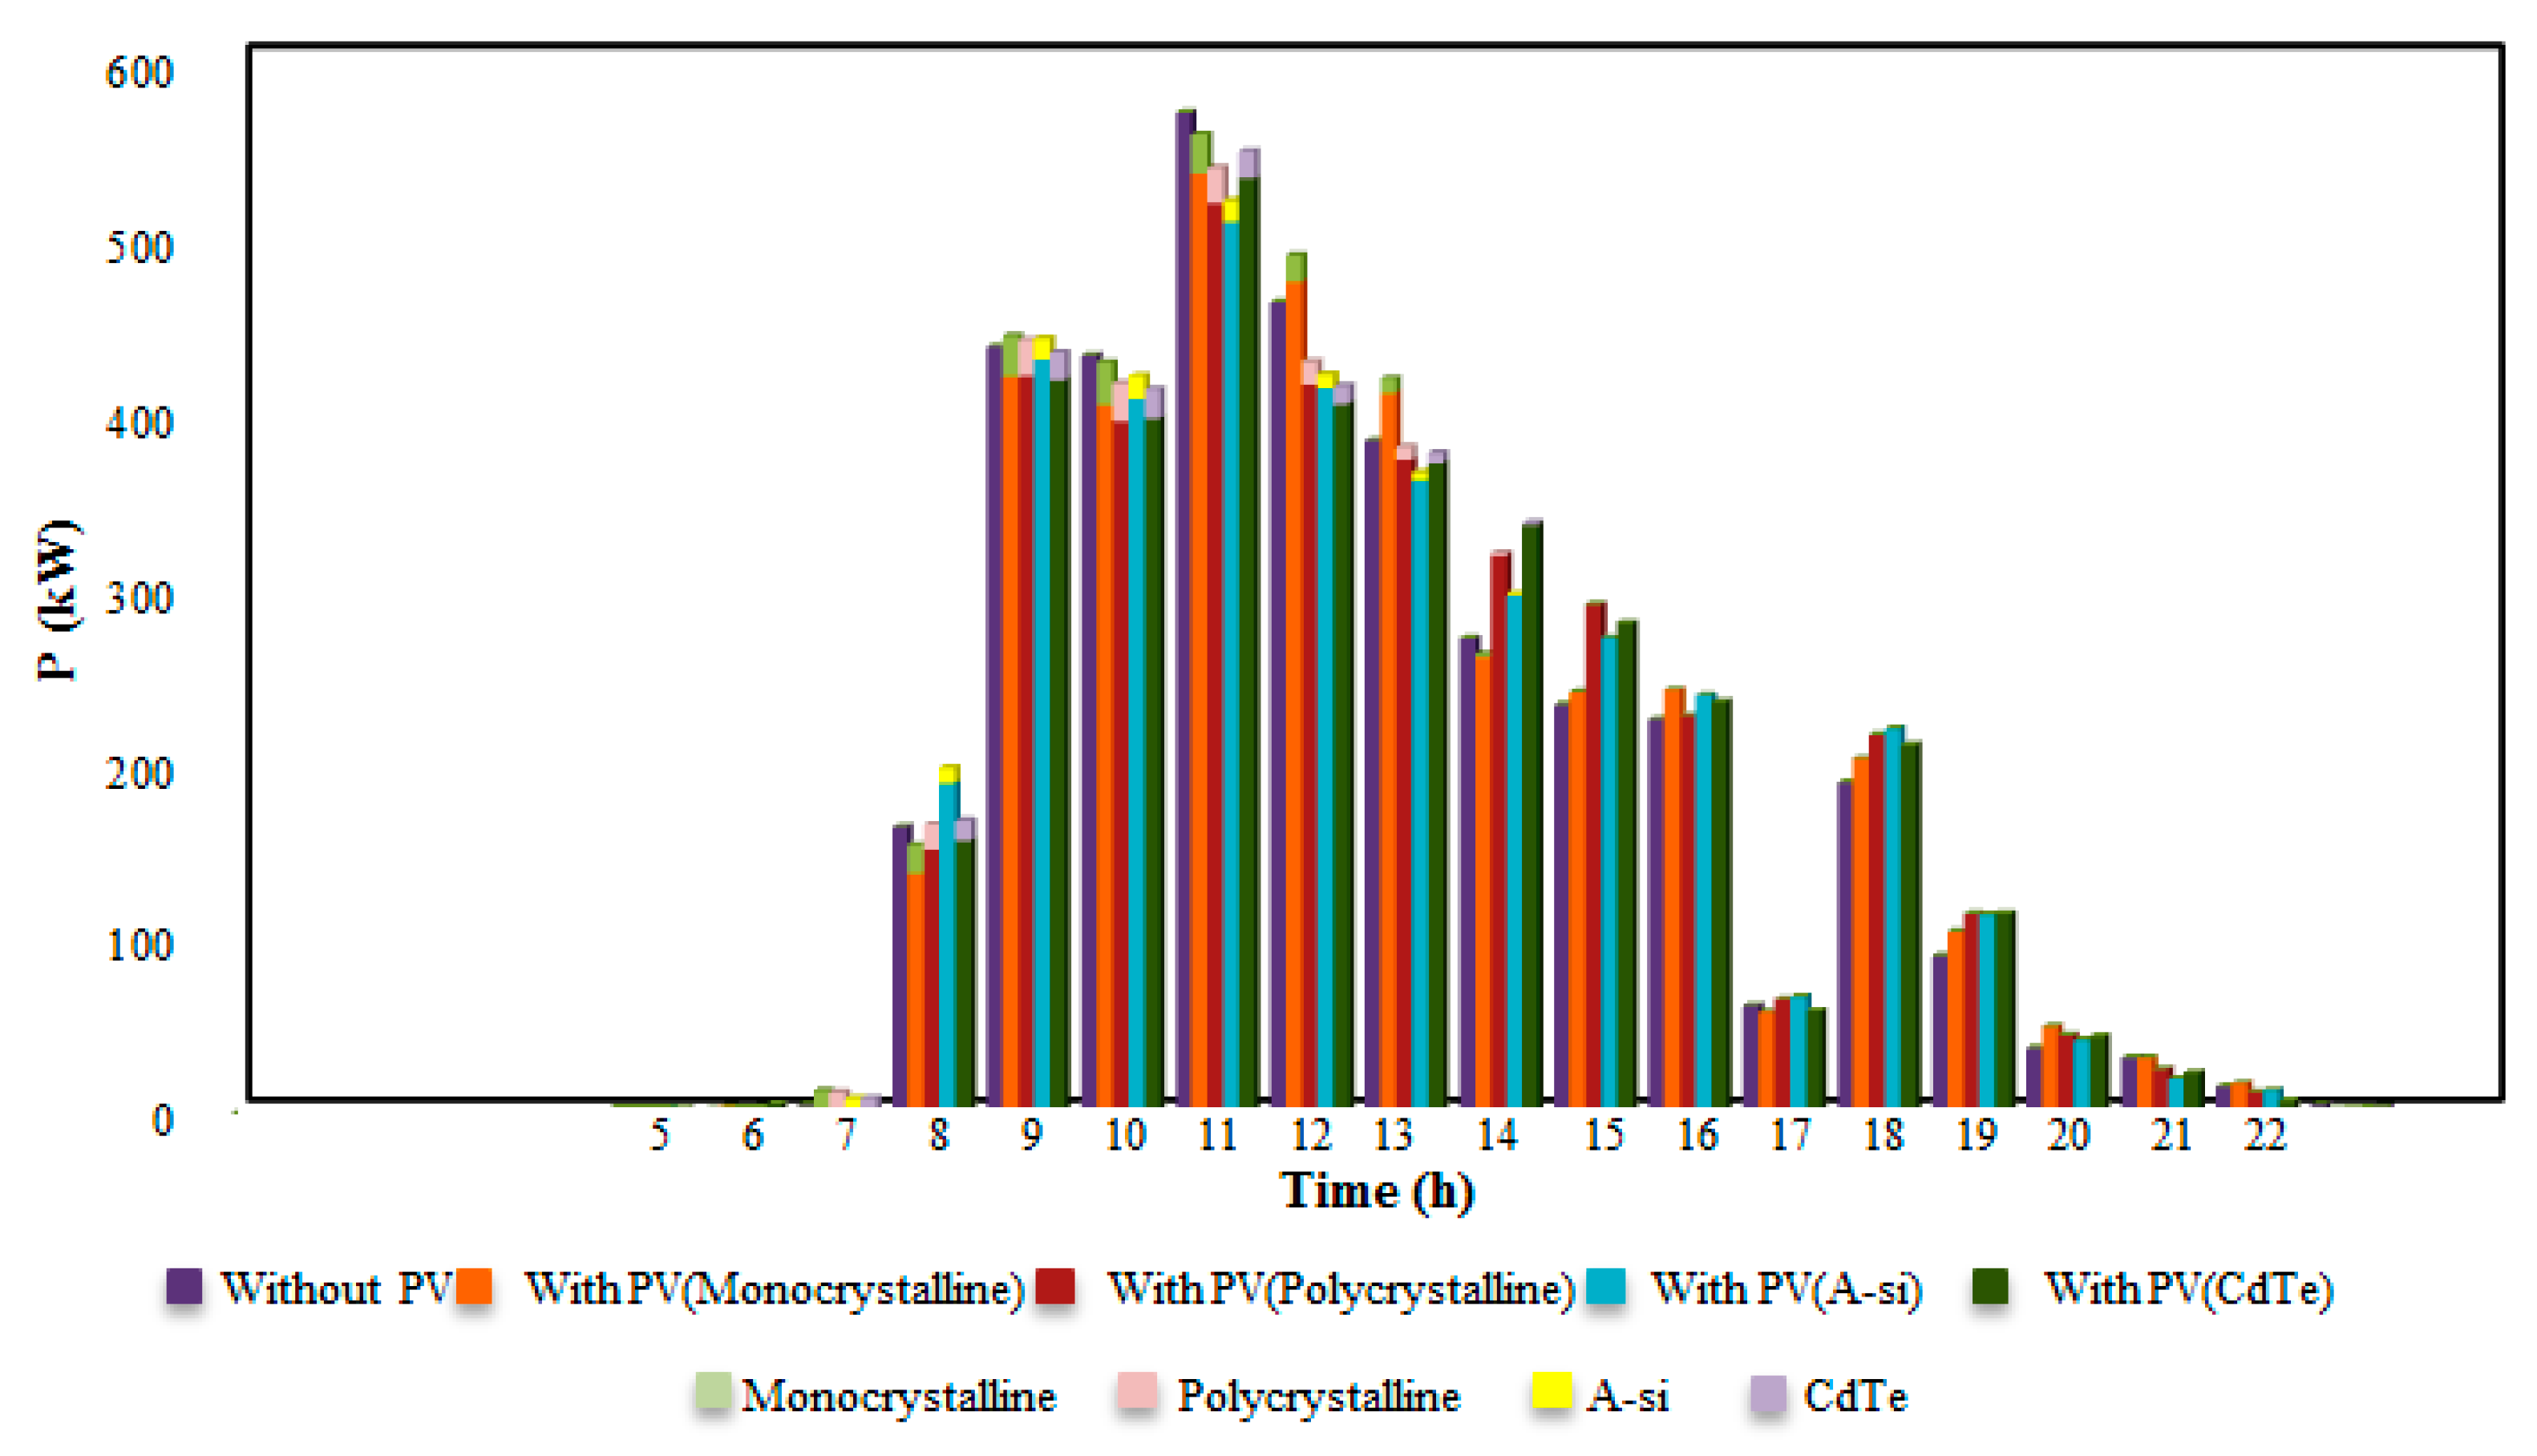
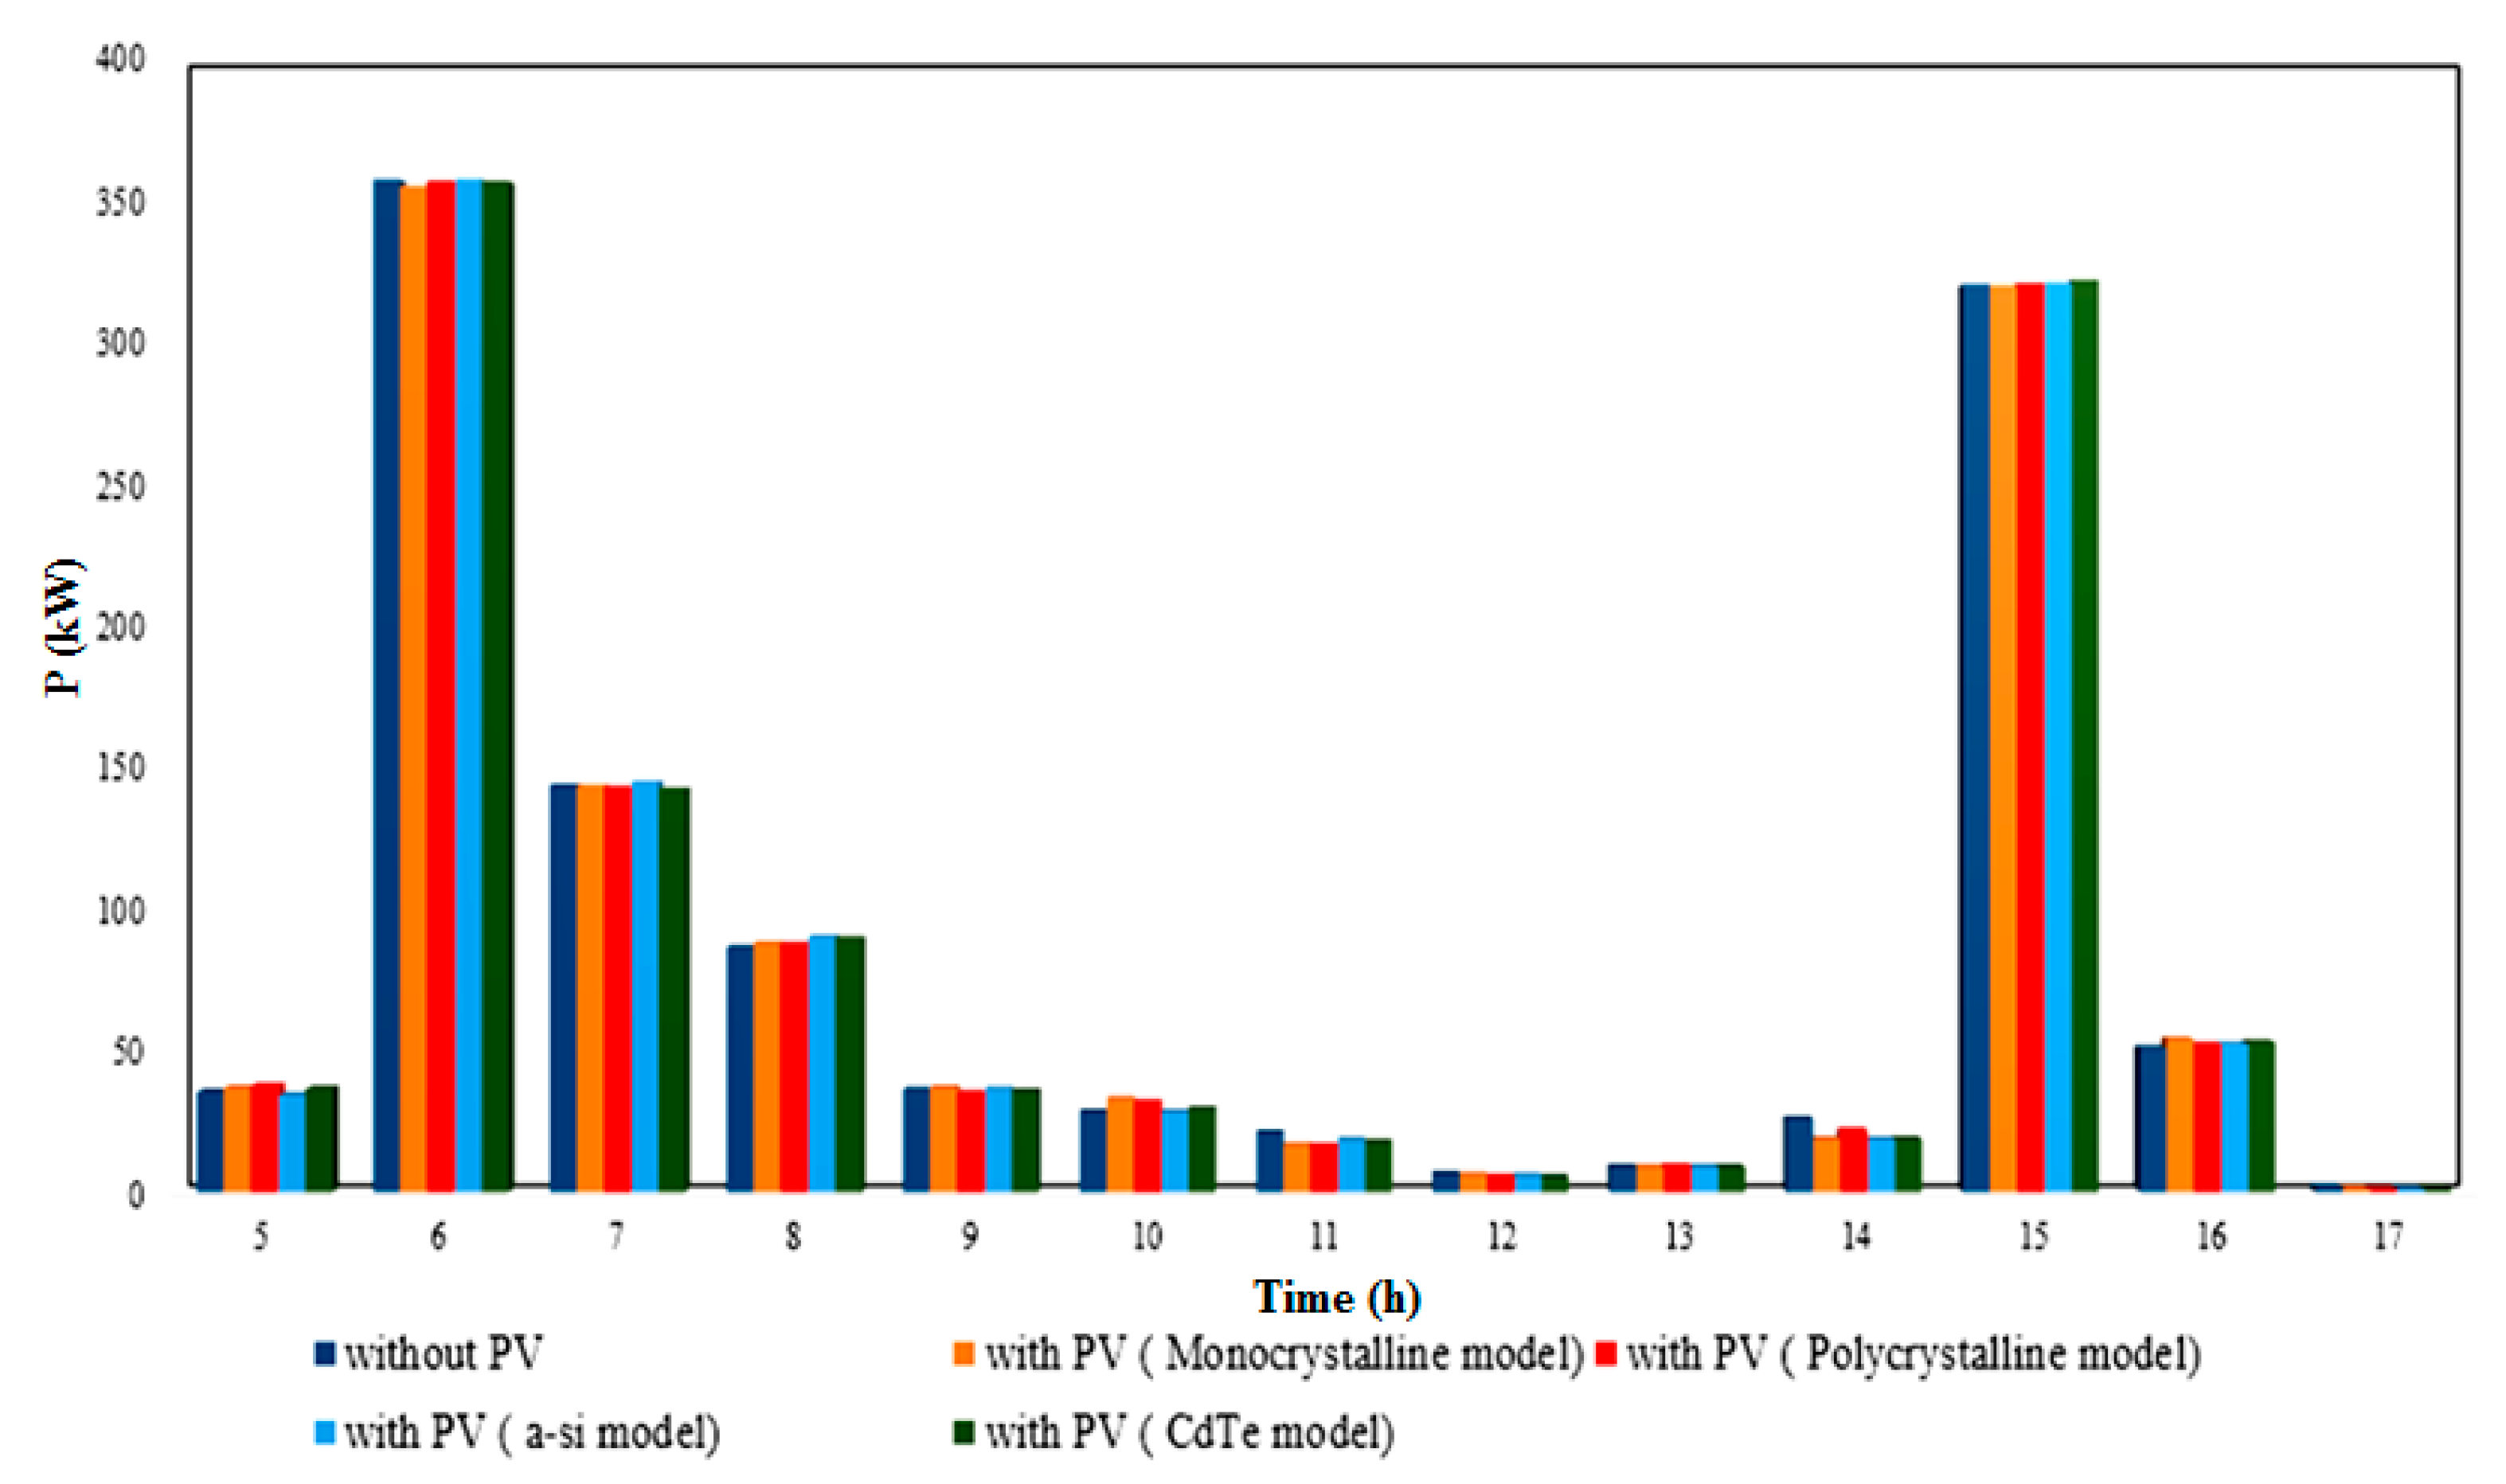
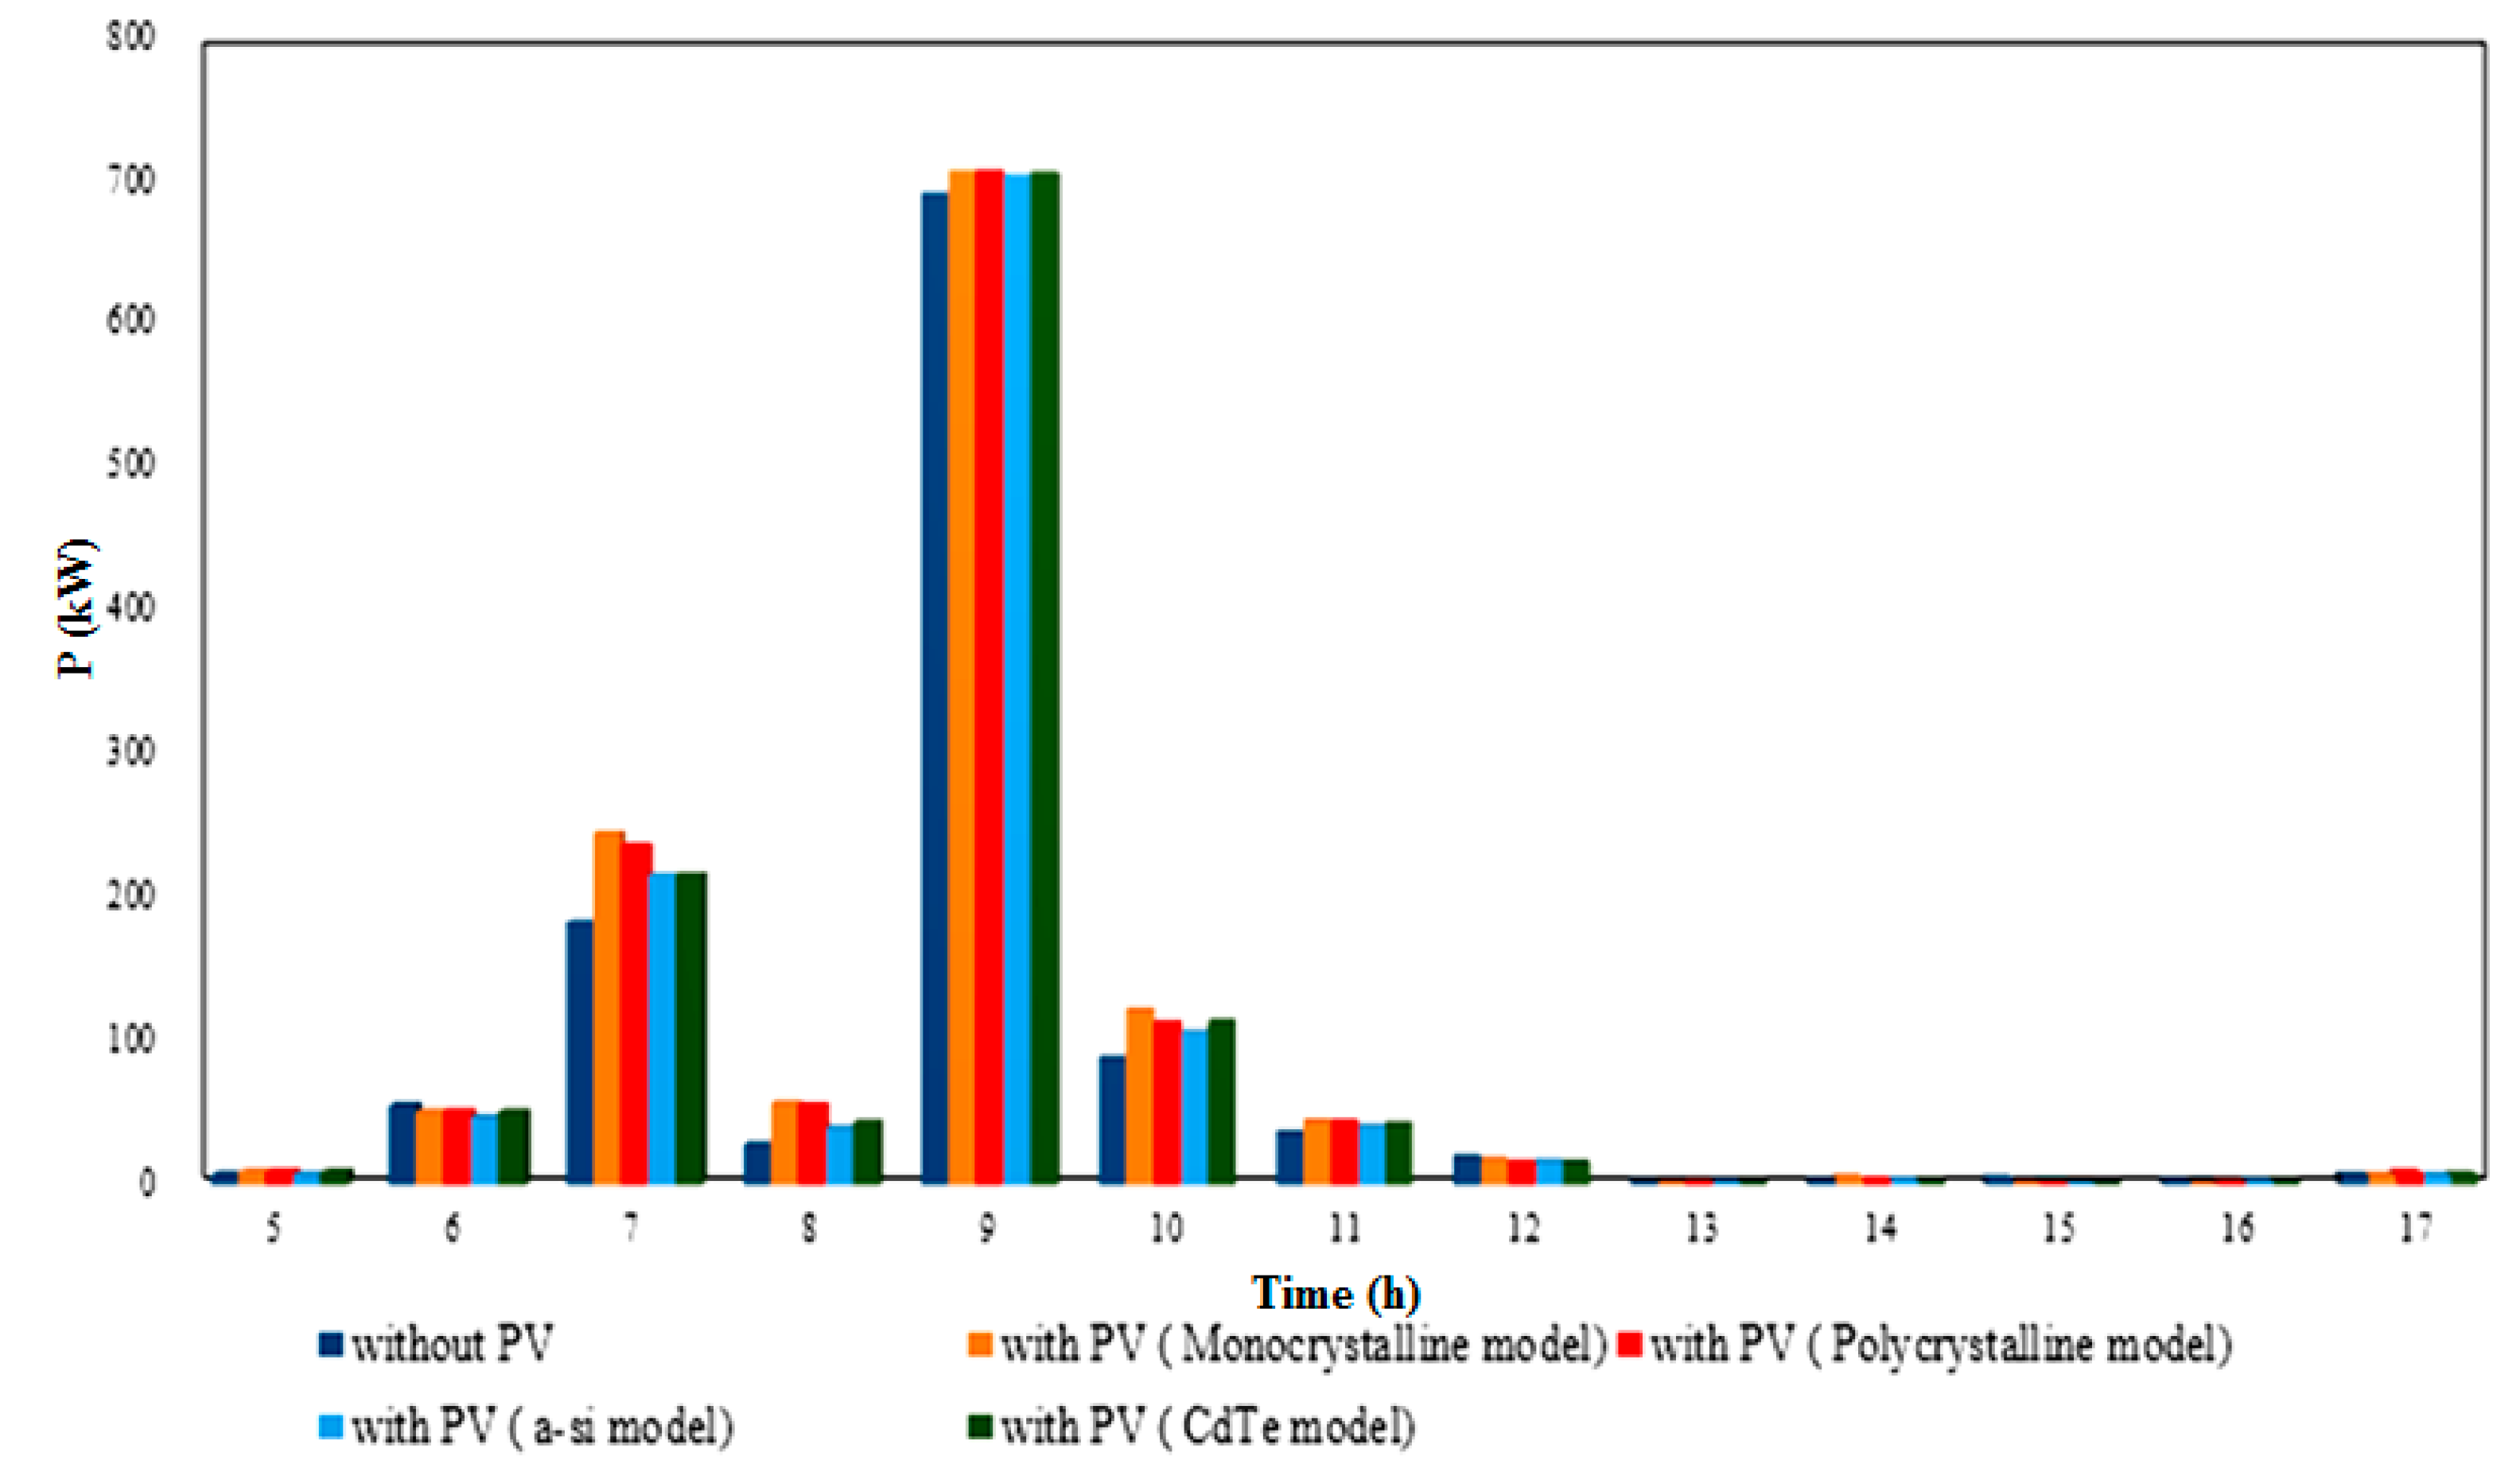
4.2. PLO’s Profit with PV Generation

In this scenario, for evaluating the effect of the PV panel technology on parking lot operator profit, four different technologies including Monocrystalline silicon, Polycrystalline silicon, Amorphous silicon and Cadmium Telluride were considered. Due to the uncertainty of solar energy, four months were considered for a more accurate evaluation. In this regard, trading energy between PL and DSO is shown in Table 6.
For better understanding the effect of PV rooftops on EV parking lots and parking lot operator profit, Figure 5, Figure 6, Figure 7 and Figure 8 are given. These figures show how much energy in a day is supplied by DSO and PV panels. Before 7:00, the PV generation is at its lowest level and EVs can only be charged by purchasing energy from the DSO. Between 8:00 to 14:00, due to the production of more energy by the PV rooftops, EVs are charged by the DSO and solar energy. During this time the amount of energy purchased from the DSO is reduced. The amount of reduction in energy purchases from the DSO depends on the power generated by PV and the decision to sell solar energy based on the price of energy. After 14:00 by reducing the energy of PV, the DSO can charge EVs. As can be seen in February and November, the highest amount of energy is supplied through the DSO because in these two months, the solar radiation is very low, and the PV panels are not able to produce energy. While the energy generated by PV panels with the four PV technologies in May and August is quite clear.
Discharging energy of PL to DSO is presented in Figure 9, Figure 10, Figure 11 and Figure 12. According to these Figures and Figure 3, the energy exchange between PL and DSO depends on PV generation, number of EVs and the price of selling the energy to DSO. In February at 7:00 and 16:00 and in November at 8:00 and 17:00, the number of EVs in the PL is less and the price of selling energy is at the highest amount, therefore the energy sold to DSO by the parking lot operator is a significant amount. In May at 8:00 and 10:00 and in August at 11:00 and 17:00, by reducing the number of EVs, increasing PV generation and because of the selling energy price, a lot of energy is traded between the parking lot operator and DSO.
As it can be seen, installing PV rooftops on EV parking lots reduces the energy purchased from DSO to PL but the performance of the PV technology can change the amount of energy exchanged. Table 7 presents the profit of the parking lot operator in all scenarios. Based on the results, the least profitable scenario is scenario I because all the required energy is supplied by DSO due to the lack of other energy sources to support the EV charging energy. Thus the parking lot operator gains less profit.
According to Table 7, PV generation helps parking lot operators to participate more in the energy exchange and increase their profit but because of the weather conditions, solar radiation and the type of PV technology the amount of income is different each month. In February and November, due to the low value of solar radiation, the energy produced by PV panels is less than that in May and August. However, the Monocrystalline silicon technology performance is better in all the months compared to the other technologies, because there are no defects or impurities in the silicon crystalline structure and consequently the efficiency is high. As can be observed, increasing the output power of PV allows the parking lot operator to purchase and sell energy to/from DSO at a more reasonable price and gain more profit.
The next most appropriate technology is Polycrystalline silicon. The performance of this technology is similar to Monocrystalline silicon, but there are more defects in the crystalline structures and the efficiency is slightly less than Monocrystalline cells. Thin-film solar panels like Amorphous silicon and Cadmium Telluride are completely different from crystalline solar cells and they have less efficiency. As can be seen, because of the lower performance and the lower benefits, they are not suitable for Finnish weather conditions.
Moreover, comparing profits in different months shows that the energy exchange in August is much more profitable than in other months.

5. Conclusions

The goal of this study is to maximize the benefit to parking lot operators in the energy market between DSO and EVOs for rooftop PV parking lots with different PV technologies. To analyze the impacts of different PV technologies’ output power on the parking lot’s profits in several weather conditions, various scenarios were considered.
Hence, by considering solar radiation uncertainty and different behaviors of EV owners, studies were performed on four different PV technologies including Monocrystalline silicon, Polycrystalline silicon, Amorphous silicon and Cadmium Telluride in February, May, August and November. Moreover, for accurate investigation, the output power curve of the PV, energy purchase and sales curve and power supplied by PV by each PV technology in 4 months were shown.
Based on the results, the parking lot’s profit in February and November was lower than the other two months due to lack of solar radiation and August is the most profitable month due to suitable weather conditions, which consequently results in more PV generation. Also, a review of each technology in different months indicates that Monocrystalline silicon, every 4 months, has a better performance than other technologies, which creates a better opportunity for energy exchange and consequently a higher profit compared to the other technologies. Moreover, according to the estimated climate in the experiments, the most efficient technologies for parking lot operators are Monocrystalline silicon and Polycrystalline silicon, and the other two, Amorphous silicon and Cadmium Telluride, are not quite suitable based on the experimented circumstances. Based on the evaluation of the efficiency and performance of different technologies in Finland’s weather conditions and in different scenarios, the Monocrystalline silicon technology is a more suitable option for use in parking lots. In future work, the application of these technologies in EVPLs can be compared based on the payback time and lifespan.

Author Contributions

Conceptualization, S.J., H.L., M.S.-k.; methodology, M.Z.F., S.J., S.M.B.S.; validation, S.M.B.S., M.S.-k.; investigation, H.L., M.S.-k.; writing—original draft preparation, M.Z.F., S.J.; visualization, M.Z.F., S.M.B.S.; supervision, M.S.-k. All authors have read and agreed to the published version of the manuscript.

Funding

This research received no external funding.

Institutional Review Board Statement

Not applicable.

Informed Consent Statement

Not applicable.

Data Availability Statement

Data sharing is not applicable to this article.

Acknowledgments

M. Shafie-khah and H. Laaksonen acknowledge the support by SolarX research project with financial support provided by the Business Finland, 2019–2021 (grant No. 6844/31/2018).

Conflicts of Interest

The authors declare no conflict of interest.

Nomenclature

The Main Parameters and Variables are Presented Here.
Indices
nIndex for EV number
wIndex for scenarios
hIndex for time (hour)
Parameters
CcdCost of equipment depreciation (€/kWh)
RmaxMaximum charging/discharging rate (kWh)
SOEarvInitial SOE of EVs at the arrival time to PL (kWh)
SOEdepDesired SOE of EVs at the departure time from PL (kWh)
SOEmaxMaximum rate of SOE (kWh)
SOEminMinimum rate of SOE (kWh)
tarvArrival time of EVs to the PL
tdepDeparture time of Evs
PrchCharging tariff of EVs (€/kWh)
PrGridPrice of purchasing energy from DSO by PL (€/kWh)
PrdchPrice of selling energy to DSO by PL (€/kWh)
ηchCharging efficiency (%)
ηdchDischarging efficiency (%)
ρ ϖ probability of each scenario
Variables
Pch-GridCharging power of each EV from DSO (kW)
Pch-SolarCharging power of each EV from solar energy’s output (kW)
Pdch-GridDischarging power of PL to DSO (kW)
PSolarSolar energy’s output of PL to DSO (kW)
SOEEVs’ state of energy (kWh)
XchBinary variable which shows the charge status of each EV

References

  1. Adeeb, J.; Farhan, A.; Al-Salaymeh, A. Temperature Effect on Performance of Different Solar Cell Technologies. J. Ecol. Eng. 2019, 20, 249–254. [Google Scholar] [CrossRef]
  2. Amelia, A.R.; Irwan, Y.M.; Leow, W.Z.; Irwanto, M.; Safwati, I.; Zhafarina, M. Investigation of the Effect Temperature on Photovoltaic (PV) Panel Output Performance. Int. J. Adv. Sci. Eng. Inf. Technol. 2016, 6, 5. [Google Scholar]
  3. Kawajiri, K. Effect of Temperature on PV Potential in the World. Environ. Sci. Technol. 2011, 45, 9030–9035. [Google Scholar] [CrossRef] [PubMed]
  4. Kamkird, K.; Ketjoy, N.; Rakwichian, W.; Sukchai, S. Investigation on Temperature Coefficients of Three Types Photovoltaic Module Technologies under Thailand Operating Condition. Procedia Eng. 2012, 32, 376–383. [Google Scholar] [CrossRef] [Green Version]
  5. Global EV Report. Available online: https://www.iea.org/reports/global-ev-outlook-2019 (accessed on 20 January 2021).
  6. Chukwu, U.C.; Mahajan, S.M. V2G parking lot with PV rooftop for capacity enhancement of a distribution system. IEEE Trans. Sustain. Energy 2013, 5, 119–127. [Google Scholar] [CrossRef]
  7. Honarmand, M.; Zakariazadeh, A.; Jadid, S. Self-scheduling of electric vehicles in an intelligent parking lot using stochastic optimization. J. Frankl. Inst. 2015, 352, 449–467. [Google Scholar] [CrossRef]
  8. Heydarian-Forushani, E.; Golshan, M.E.; Shafie-khah, M. Flexible interaction of plug-in electric vehicle parking lots for efficient wind integration. Appl. Energy 2016, 179, 338–349. [Google Scholar] [CrossRef]
  9. Song, Y.; Zheng, Y.; Hill, D.J. Optimal scheduling for EV charging stations in distribution networks: A Convexified model. IEEE Trans. Power Syst. 2016, 32, 1574–1575. [Google Scholar] [CrossRef]
  10. Ivanova, A.; Fernandez, J.A.; Crawford, C.; Djilali, N. Coordinated charging of electric vehicles connected to a net-metered PV parking lot. In Proceedings of the 2017 IEEE PES Innovative Smart Grid Technologies Conference Europe (ISGT-Europe), Turin, Italy, 26–29 September 2017; pp. 1–6. [Google Scholar]
  11. Figueiredo, R.; Nunes, P.; Brito, M.C. The feasibility of solar parking lots for electric vehicles. Energy 2017, 140, 1182–1197. [Google Scholar] [CrossRef]
  12. Aghajani, S.; Kalantar, M. Operational scheduling of electric vehicles parking lot integrated with renewable generation based on bi-level programming approach. Energy 2017, 139, 422–432. [Google Scholar] [CrossRef]
  13. Zhang, Y.; Cai, L. Dynamic charging scheduling for EV parking lots with photovoltaic power system. IEEE Access 2018, 6, 56995–57005. [Google Scholar] [CrossRef]
  14. Yan, Q.; Zhang, B.; Kezunovic, M. Optimized operational cost reduction for an EV charging station integrated with battery energy storage and PV generation. IEEE Trans. Smart Grid 2018, 10, 2096–2106. [Google Scholar] [CrossRef]
  15. Eldeeb, H.H.; Faddel, S.; Mohammed, O.A. Multi-objective optimization technique for the operation of grid tied PV powered EV charging station. Electr. Power Syst. Res. 2018, 164, 201–211. [Google Scholar] [CrossRef]
  16. Jannati, J.; Nazarpour, D. Multi-objective scheduling of electric vehicles intelligent parking lot in the presence of hydrogen storage system under peak load management. Energy 2018, 163, 338–350. [Google Scholar] [CrossRef]
  17. Chen, C.R.; Chen, Y.S.; Lin, T.C. Optimal Charging Scheduling for Electric Vehicle in Parking Lot with Renewable Energy System. In Proceedings of the 2019 IEEE International Conference on Systems, Man and Cybernetics (SMC), Bari, Italy, 6–9 October 2019; pp. 1684–1688. [Google Scholar]
  18. Jiang, W.; Zhen, Y. A Real-time EV Charging Scheduling for Parking Lots with PV System and Energy Store System. IEEE Access 2019, 7, 86184–86193. [Google Scholar] [CrossRef]
  19. Turan, M.T.; Ates, Y.; Erdinc, O.; Gokalp, E.; Catalão, J.P. Effect of electric vehicle parking lots equipped with roof mounted photovoltaic panels on the distribution network. Int. J. Electr. Power Energy Syst. 2019, 109, 283–289. [Google Scholar] [CrossRef]
  20. Seddig, K.; Jochem, P.; Fichtner, W. Two-stage stochastic optimization for cost-minimal charging of electric vehicles at public charging stations with photovoltaics. Appl. Energy 2019, 242, 769–781. [Google Scholar] [CrossRef]
  21. Sedighizadeh, M.; Mohammadpour, A.; Alavi, S.M.M. A daytime optimal stochastic energy management for EV commercial parking lots by using approximate dynamic programming and hybrid big bang big crunch algorithm. Sustain. Cities Soc. 2019, 45, 486–498. [Google Scholar] [CrossRef]
  22. Ahmadi-Nezamabad, H.; Zand, M.; Alizadeh, A.; Vosoogh, M.; Nojavan, S. Multi-objective optimization based robust scheduling of electric vehicles aggregator. Sustain. Cities Soc. 2019, 47, 101494. [Google Scholar] [CrossRef]
  23. Wang, Z.; Jochem, P.; Fichtner, W. A scenario-based stochastic optimization model for charging scheduling of electric vehicles under uncertainties of vehicle availability and charging demand. J. Clean. Prod. 2020, 254, 119886. [Google Scholar] [CrossRef]
  24. Cao, Y.; Du, J.; Qian, X.; Nojavan, S.; Jermsittiparsert, K. Risk-involved stochastic performance of hydrogen storage based intelligent parking lots of electric vehicles using downside risk constraints method. Int. J. Hydrog. Energy 2020, 45, 2094–2104. [Google Scholar] [CrossRef]
  25. Cao, Y.; Huang, L.; Li, Y.; Jermsittiparsert, K.; Ahmadi-Nezamabad, H.; Nojavan, S. Optimal scheduling of electric vehicles aggregator under market price uncertainty using robust optimization technique. Int. J. Electr. Power Energy Syst. 2020, 117, 105628. [Google Scholar] [CrossRef]
  26. Bayrakcia, M.; Choib, Y.; Brownson, J. Temperature Dependent Power Modeling of Photovoltaics. Energy Procedia 2014, 57, 745–754. [Google Scholar] [CrossRef] [Green Version]
  27. Dash, P.K.; Gupta, N.C. Effect of Temperature on Power Output from Different Commercially available Photovoltaic Modules. Int. J. Eng. Res. Appl. 2015, 5, 148–151. [Google Scholar]
  28. Zhu, H.; Lian, W.; Lu, L.; Kamunyu, P.; Yu, C.; Dai, S.; Hu, Y. Online Modelling and Calculation for Operating Temperature of Silicon-Based PV Modules Based on BP-ANN. Int. J. Photoenergy 2017, 2017, 6759295. [Google Scholar] [CrossRef] [Green Version]
  29. Fesharaki, V.J.; Dehghani, M.; Fesharaki, J.J. The Effect of Temperature on Photovoltaic Cell Efficiency. In Proceedings of the 1st International Conference on Emerging Trends in Energy Conservation—ETEC, Tehran, Iran, 30–21 November 2011. [Google Scholar]
  30. Finnish Weather Data. Available online: https://www.ilmatieteenlaitos.fi/havaintojen-lataus (accessed on 20 January 2021).
  31. Sadati, S.M.B.; Moshtagh, J.; Shafie-Khah, M.; Rastgou, A.; Catalão, J.P. Optimal charge scheduling of electric vehicles in solar energy integrated power systems considering the uncertainties. In Electric Vehicles in Energy Systems; Springer: Cham, Switzerland, 2020; pp. 73–128. [Google Scholar]
  32. Prices for Electricity Products. Available online: https://www.vaasansahko.fi/en/prices-for-electricity-products-2/ (accessed on 15 December 2020).
  33. Nordpool Market Data. Available online: https://www.nordpoolgroup.com/ (accessed on 15 December 2020).
Figure 1. Interaction between PLO, DSO and PEV.
Cleantechnol 03 00030 g001
Figure 2. Expected value of output power of PV on each month for each technology.
Cleantechnol 03 00030 g002
Figure 3. Price of selling energy to DSO.
Cleantechnol 03 00030 g003
Figure 4. Required energy for charging EVs each month.
Cleantechnol 03 00030 g004
Figure 5. Power supplied by DSO and PV panel in February.
Cleantechnol 03 00030 g005
Figure 6. Power supplied by DSO and PV panel in May.
Cleantechnol 03 00030 g006
Figure 7. Power supplied by DSO and PV panel in August.
Cleantechnol 03 00030 g007
Figure 8. Power supplied by DSO and PV panel in November.
Cleantechnol 03 00030 g008
Figure 9. Discharging energy from PL to DSO in February.
Cleantechnol 03 00030 g009
Figure 10. Discharging energy from PL to DSO in May.
Cleantechnol 03 00030 g010
Figure 11. Discharging energy from PL to DSO in August.
Cleantechnol 03 00030 g011
Figure 12. Discharging energy from PL to DSO in November.
Cleantechnol 03 00030 g012
Table 1. The specifications of each technology.
Cell TypeStructureEfficiency [1,2,3]Thermal Coefficient (C−1)
Monocrystalline silicon
  • manufactured from pure semiconducting material with no defects or impurities in the silicon crystalline structure
  • production procedure is complicated
  • higher-priced than some other technologies
17–22%0.0044
Polycrystalline silicon
  • manufacturing process is simpler than the monocrystalline ones
  • more cost-effective
  • more defects in the crystalline structures
15–17%0.0038
Thin film solar panels:
Amorphous silicon
Cadmium Telluride
  • completely different from crystalline solar panels
  • lightweight and, in some cases, flexible
10–13%0.0023
0.0017
Table 2. The modified probability distribution of EVs [31].
MeanStandard DeviationMinimumMaximum
Initial SOC (%)54.858.924070
The time of Arrival (h)83523
The time of Departure (h)163624
Cap (kW)62.7928.601895
Table 3. EVs specification.
Capacity of Battery32 kWhEfficiency of Charge90%
The rate of Charging/discharging 10 kWEfficiency of Discharge95%
SOE min4.8 kWhDesired SOE28.8 kWh
SOE max28.8 kWhCcd20 €/MWh
Table 4. The price of energy exchanged between DSO and PLO (cent/kWh).
Price/TimeOff-Peak Periods
(01:00–06:00)
Mid-Peak Periods
(07:00–11:00, 18:00–19:00)
On-Peak Periods
(12:00–17:00)
Energy purchased from DSO by the PLOs4.194.194.19
Energy sold to EVO by the PLO4.675.535.53
Table 5. Charging/discharging energy of EVs and PLO’s profit.
MonthFebruaryMayAugustNovember
Charging (kWh)3636.943636.943608.853620.89
Discharging (kWh)1123.221128.011311.241285.6
PLO’s profit (€)44.7040.2547.3342.65
Table 6. Energy exchange between PL and DSO (kWh).
FebruaryMayAugustNovember
Pch from DSOPch to DSOPch from DSOPch to DSOPch from DSOPch to DSOPch from DSOPch to DSO
Without PV3636.941123.223636.941128.013608.851311.243620.891285.60
Mono crystalline3628.061118.803625.131267.403598.091340.393600.571283.05
Poly crystalline3628.131118.443627.211246.913598.11313.353600.521279.27
Amorphous silicon3628.841117.953632.941192.803598.91239.243602.471277
Cadmium Telluride3628.441118.093627.701212.603595.931272.833602.981281.32
Table 7. PLO’s profit (€) by using different PV technologies.
PV Technology/MonthFebruaryMayAugustNovember
Without PV44.7040.2547.3342.65
Mono crystalline45.0663.2672.7348.85
Poly crystalline45.0160.5269.8248.11
Amorphous silicon44.8752.7261.2545.89
Cadmium Telluride44.9356.2665.3646.86
Publisher’s Note: MDPI stays neutral with regard to jurisdictional claims in published maps and institutional affiliations.

